<strong>BHARTI</strong> <strong>INFOTEL</strong> <strong>LIMITED</strong> (Formerly <strong>BHARTI</strong> TELENET <strong>LIMITED</strong>) SCHEDULES ANNEXED TO AND FORMING PART OF ACCOUNTS SCHEDULE 5 : FIXED ASSETS (Refer Notes 2,3,11 and 14 on Schedule 23 and Note 2 on Schedule 24) (Rs. ’000) Gross Block Value Depreciation Net Block Value As at Acquired Transferred Additions Sale/ As at As at Acquired Transferred For the Sale/ As at As at As at Particulars April 1, on merger on demerger during Adjustment March 31, April 1, on merger on demerger year Adjustment March 31, March 31, March 31, 2002 the year during 2003 2002 during 2003 2003 2002 the year the year Leasehold Land 5,785 955 – 120 – 6,860 327 – – 22 – 349 6,511 5,458 Freehold Land 143,266 7,787 – 32,855 – 183,908 – – – – – – 183,908 143,266 Leasehold VSAT Assets – 41,568 – - 9,614 31,954 – 37,180 – 4,186 9,412 31,954 – – Plant and Machinery 6,223,915 2,129,974 60,250 11,909,078 - 20,202,717 1,271,263 216,903 10,795 1,304,311 – 2,781,682 17,421,035 4,952,652 Air Conditioners 37,388 30,332 – 61,938 105 129,553 8,302 2,862 – 13,951 30 25,085 104,468 29,086 Building and Leasehold Improvements 296,742 182,629 24,276 211,719 – 666,814 39,597 14,095 4,654 43,513 – 92,551 574,263 257,145 Office Equipment 45,645 36,650 2,541 35,008 381 114,381 22,080 16,479 1,854 24,335 158 60,882 53,499 23,565 Computer 481,949 280,903 10,186 330,801 2,793 1,080,674 203,547 160,051 3,201 247,540 1,765 606,172 474,502 278,402 Vehicle 15,488 – 1,232 1,233 1,626 13,863 9,219 – 1,020 2,235 1,169 9,265 4,598 6,269 Furniture and Fixtures 65,697 19,602 2,510 26,606 328 109,067 27,314 10,793 2,136 21,665 150 57,486 51,581 38,383 200 ANNUAL REPORT 2002-2003 TOTAL 7,315,875 2,730,400 100,995 12,609,358 14,847 22,539,791 1,581,649 458,363 23,660 1,661,758 12,684 3,665,426 18,874,365 5,734,226 Capital Work-in-Progress 3,504,161 1,648,949 22,378,526 7,383,175 Previous Year 5,567,140 – – 1,757,088 8,353 7,315,875 889,177 – - 696,715 4,243 1,581,649 Notes: 1. Additions during the year are net off Rs. 2,608 thousand Exchange Gain (Previous year includes Rs. 1,474 thousand exchange loss) on account of fluctuation in foreign exchange rate on purchase of Fixed Assets. 2. Capital Work in Progress as at 31.03.03 includes Rs. 2,082 thousand exchange loss (Previous year Rs. 593 thousand exchange loss) on account of fluctuation in Foreign Exchange rate. 3. Leasehold land acquired on merger represents land acquired on lease-cum-sale basis from Karnataka Industrial Areas Development Board. 4. The company owns certain network infrastructure jointly with a 100 percent subsidiary under an agreement in the proportion of 13:87. The pro-rata costs of such assets and related depreciation included under Plant and Machinery above, is as below: (Rs. ’000) Current year* Previous year Cost Opening Balance 19,698 – Addition during the year 51,613 19,698 71,311 19,698 Depreciation Opening Balance 310 – For the year 903 310 Accumulated Depreciation as at March 31, 2003 1,213 310 Written Down Value as on March 31, 2003 70,098 19,388 * As on December 1, 2002, the entire assets have been transferred by the subsidiary to the Company and the proportion of the subsidiary has been accounted for in the books of the company accordingly. 5. Pursuant to amalgamation of erstwhile BTSoL, the Company has acquired network infrastructure owned jointly by the erstwhile BTSoL with a fellow subsidiary under an agreement in the proportion of 56:44. The pro-rata costs of such assets and related depreciation included under Plant and Machinery above is as below: (Rs. ’000) Cost Acquired on merger 508,621 Addition during the year – 508,621 Depreciation Acquired on merger 9,225 For the year 33,925 Accumulated Depreciation as at March 31, 2003 43,150 Written Down Value as on March 31, 2003 465,471 6. Borrowing cost of Rs. 109,107 thousand (Previous year Rs. Nil) has been capitalised along with the respective qualifying assets. 7. Capital Work-in-Progress includes Capital Advances of Rs. 192,475 thousand (Previous year Rs. 79,379 thousand) and Rs. 47,649 thousand (Previous year Nil) of borrowing cost to be capitalised alongwith respective qualifying Fixed Assets.
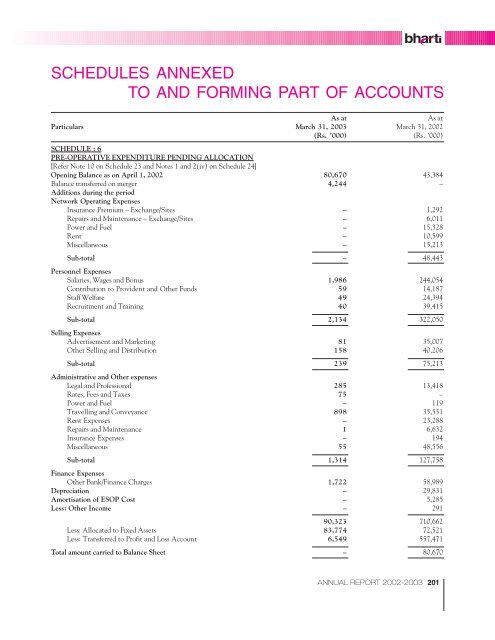
SCHEDULES ANNEXED TO AND FORMING PART OF ACCOUNTS As at As at Particulars March 31, 2003 March 31, 2002 (Rs. ’000) (Rs. ’000) SCHEDULE : 6 PRE-OPERATIVE EXPENDITURE PENDING ALLOCATION [Refer Note 10 on Schedule 23 and Notes 1 and 2(iv) on Schedule 24] Opening Balance as on April 1, 2002 80,670 43,384 Balance transferred on merger Additions during the period Network Operating Expenses 4,244 – Insurance Premium – Exchange/Sites – 1,292 Repairs and Maintenance – Exchange/Sites – 6,011 Power and Fuel – 15,328 Rent – 10,599 Miscellaneous – 15,213 Sub-total Personnel Expenses – 48,443 Salaries, Wages and Bonus 1,986 244,054 Contribution to Provident and Other Funds 59 14,187 Staff Welfare 49 24,394 Recruitment and Training 40 39,415 Sub-total Selling Expenses 2,134 322,050 Advertisement and Marketing 81 35,007 Other Selling and Distribution 158 40,206 Sub-total Administrative and Other expenses 239 75,213 Legal and Professional 285 13,418 Rates, Fees and Taxes 75 – Power and Fuel – 119 Travelling and Conveyance 898 35,551 Rent Expenses – 23,288 Repairs and Maintenance 1 6,632 Insurance Expenses – 194 Miscellaneous 55 48,556 Sub-total Finance Expenses 1,314 127,758 Other Bank/Finance Charges 1,722 58,989 Depreciation – 29,831 Amortisation of ESOP Cost – 5,285 Less: Other Income – 291 90,323 710,662 Less: Allocated to Fixed Assets 83,774 72,521 Less: Transferred to Profit and Loss Account 6,549 557,471 Total amount carried to Balance Sheet – 80,670 ANNUAL REPORT 2002-2003 201