BHARTI INFOTEL LIMITED - Airtel
BHARTI INFOTEL LIMITED - Airtel
BHARTI INFOTEL LIMITED - Airtel

You also want an ePaper? Increase the reach of your titles
YUMPU automatically turns print PDFs into web optimized ePapers that Google loves.
SCHEDULES ANNEXED<br />
TO AND FORMING PART OF ACCOUNTS<br />
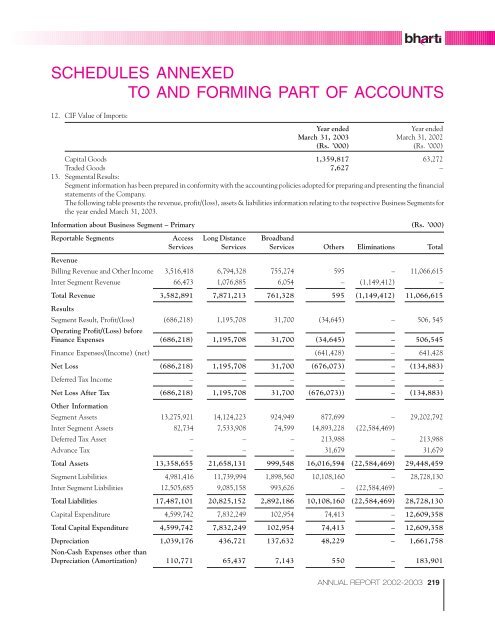
12. CIF Value of Imports:<br />
Year ended Year ended<br />
March 31, 2003 March 31, 2002<br />
(Rs. ’000) (Rs. ’000)<br />
Capital Goods 1,359,817 63,272<br />
Traded Goods<br />
13. Segmental Results:<br />
7,627 –<br />
Segment information has been prepared in conformity with the accounting policies adopted for preparing and presenting the financial<br />
statements of the Company.<br />
The following table presents the revenue, profit/(loss), assets & liabilities information relating to the respective Business Segments for<br />
the year ended March 31, 2003.<br />
Information about Business Segment – Primary (Rs. ’000)<br />
Reportable Segments Access Long Distance Broadband<br />
Services Services Services Others Eliminations Total<br />
Revenue<br />
Billing Revenue and Other Income 3,516,418 6,794,328 755,274 595 – 11,066,615<br />
Inter Segment Revenue 66,473 1,076,885 6,054 – (1,149,412) –<br />
Total Revenue<br />
Results<br />
3,582,891 7,871,213 761,328 595 (1,149,412) 11,066,615<br />
Segment Result, Profit/(loss)<br />
Operating Profit/(Loss) before<br />
(686,218) 1,195,708 31,700 (34,645) – 506, 545<br />
Finance Expenses (686,218) 1,195,708 31,700 (34,645) – 506,545<br />
Finance Expenses/(Income) (net) (641,428) – 641,428<br />
Net Loss (686,218) 1,195,708 31,700 (676,073) – (134,883)<br />
Deferred Tax Income – – – – – –<br />
Net Loss After Tax<br />
Other Information<br />
(686,218) 1,195,708 31,700 (676,073)) – (134,883)<br />
Segment Assets 13,275,921 14,124,223 924,949 877,699 – 29,202,792<br />
Inter Segment Assets 82,734 7,533,908 74,599 14,893,228 (22,584,469)<br />
Deferred Tax Asset – – – 213,988 – 213,988<br />
Advance Tax – – – 31,679 – 31,679<br />
Total Assets 13,358,655 21,658,131 999,548 16,016,594 (22,584,469) 29,448,459<br />
Segment Liabilities 4,981,416 11,739,994 1,898,560 10,108,160 – 28,728,130<br />
Inter Segment Liabilities 12,505,685 9,085,158 993,626 – (22,584,469) –<br />
Total Liabilities 17,487,101 20,825,152 2,892,186 10,108,160 (22,584,469) 28,728,130<br />
Capital Expenditure 4,599,742 7,832,249 102,954 74,413 – 12,609,358<br />
Total Capital Expenditure 4,599,742 7,832,249 102,954 74,413 – 12,609,358<br />
Depreciation<br />
Non-Cash Expenses other than<br />
1,039,176 436,721 137,632 48,229 – 1,661,758<br />
Depreciation (Amortization) 110,771 65,437 7,143 550 – 183,901<br />
ANNUAL REPORT 2002-2003 219