
Create successful ePaper yourself
Turn your PDF publications into a flip-book with our unique Google optimized e-Paper software.
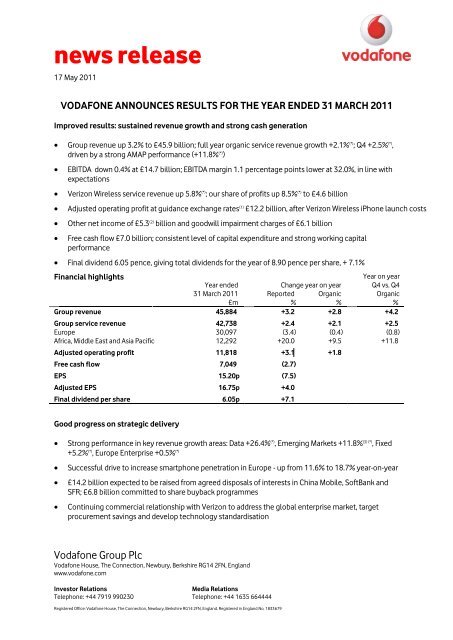
news release<br />
<strong>17</strong> <strong>May</strong> <strong>2011</strong><br />
VODAFONE ANNOUNCES RESULTS FOR THE YEAR ENDED 31 MARCH <strong>2011</strong><br />
Improved results: sustained revenue growth and strong cash generation<br />
Group revenue up 3.2% to £45.9 billion; full year organic service revenue growth +2.1% (*) ; Q4 +2.5% (*) ,<br />
driven by a strong AMAP performance (+11.8% (*) )<br />
EBITDA down 0.4% at £14.7 billion; EBITDA margin 1.1 percentage points lower at 32.0%, in line with<br />
expectations<br />
Verizon Wireless service revenue up 5.8% (*) ; our share of profits up 8.5% (*) to £4.6 billion<br />
Adjusted operating profit at guidance exchange rates (1) £12.2 billion, after Verizon Wireless iPhone launch costs<br />
Other net income of £5.3 (2) billion and goodwill impairment charges of £6.1 billion<br />
Free cash flow £7.0 billion; consistent level of capital expenditure and strong working capital<br />
performance<br />
Final dividend 6.05 pence, giving total dividends for the year of 8.90 pence per share, + 7.1%<br />
Financial highlights<br />
Year ended<br />
Change year on year<br />
Year on year<br />
Q4 vs. Q4<br />
31 March <strong>2011</strong> Reported Organic Organic<br />
£m % % %<br />
Group revenue 45,884 +3.2 +2.8 +4.2<br />
Group service revenue 42,738 +2.4 +2.1 +2.5<br />
Europe 30,097 (3.4) (0.4) (0.8)<br />
Africa, Middle East and Asia Pacific 12,292 +20.0 +9.5 +11.8<br />
Adjusted operating profit 11,818 +3.1 +1.8<br />
Free cash flow 7,049 (2.7)<br />
EPS 15.20p (7.5)<br />
Adjusted EPS 16.75p +4.0<br />
Final dividend per share 6.05p +7.1<br />
Good progress on strategic delivery<br />
Strong performance in key revenue growth areas: Data +26.4% (*) , Emerging Markets +11.8% (3) (*) , Fixed<br />
+5.2% (*) , Europe Enterprise +0.5% (*)<br />
Successful drive to increase smartphone penetration in Europe - up from 11.6% to 18.7% year-on-year<br />
£14.2 billion expected to be raised from agreed disposals of interests in China Mobile, SoftBank and<br />
SFR; £6.8 billion committed to share buyback programmes<br />
Continuing commercial relationship with Verizon to address the global enterprise market, target<br />
procurement savings and develop technology standardisation<br />
<strong>Vodafone</strong> Group Plc<br />
<strong>Vodafone</strong> House, The Connection, Newbury, Berkshire RG14 2FN, England<br />
www.vodafone.com<br />
Investor Relations Media Relations<br />
Telephone: +44 7919 990230 Telephone: +44 1635 664444<br />
Registered Office: <strong>Vodafone</strong> House, The Connection, Newbury, Berkshire RG14 2FN, England. Registered in England No. 1833679
Guidance for the 2012 financial year<br />
Adjusted operating profit expected to be in the range of £11.0 billion to £11.8 billion, reflecting the<br />
loss of our £0.5 billion share of profits from SFR as the result of the disposal of our 44% interest<br />
Free cash flow expected to be in the range of £6.0 billion to £6.5 billion, reflecting continued strong<br />
cash generation offset by the reduction of £0.3 billion in dividends from SFR and China Mobile, and the<br />
more limited working capital improvements available going forward<br />
Vittorio Colao, Group Chief Executive, commented:<br />
“The past year has seen further strong performances in our key revenue growth areas of data, emerging<br />
markets and enterprise, and we have gained or held market share in most of our key markets. Continuing<br />
network investment is an important differentiator for <strong>Vodafone</strong>, improving the customer experience and<br />
giving us leadership in smartphone penetration and in customer take up of data plans. We enter the new<br />
financial year well positioned to deliver further value to our shareholders.”<br />
Notes:<br />
(*) All amounts in this document marked with an “(*)” represent organic growth which presents performance on a comparable basis, both in<br />
terms of merger and acquisition activity and foreign exchange rates.<br />
(1) See ‘Guidance’ on page 8<br />
(2) Other net income includes a £2.8 billion net gain on the sale of the Group’s interest in China Mobile Limited, £0.9 billion tax benefit and a £0.9<br />
billion interest benefit relating to the settlement of a tax case and £0.5 billion from the disposal of investments in SoftBank.<br />
(3) Emerging markets include India, Vodacom, Egypt, Turkey, Ghana, Qatar and Fiji.<br />
2
CHIEF EXECUTIVE’S STATEMENT<br />
Financial review of the year<br />
We have performed well this year, combining a better operational performance with good strategic<br />
progress. Organic service revenue growth improved during the year, with a strong result from emerging<br />
markets and signs of renewed growth in some parts of Europe.<br />
Customers have adopted data services in increasing numbers, as smartphones proliferate and the tablet<br />
market begins to take off. Our network investment is becoming a key differentiator, as we are leading the<br />
migration to smartphones in most of our European operations. Through this and our continued stronger<br />
commercial focus, we are growing our market share again in most of our markets.<br />
However, markets remain competitive and the economic environment, particularly across southern<br />
Europe, is challenging. We continue to keep a tight rein on costs and working capital, allowing us to<br />
maintain our levels of investment while again delivering a strong free cash flow performance.<br />
Group revenue for the year was up 3.2% to £45.9 billion, with Group service revenue up 2.1% (*) on an<br />
organic basis and up 2.5% (*) in Q4. Group EBITDA margin fell 1.1 percentage points, reflecting continuing<br />
weakness across southern Europe, higher growth in lower margin markets, and the increased investment<br />
in migrating customers to higher value smartphones. As a result, EBITDA fell 0.4% year-on-year.<br />
Group adjusted operating profit rose 3.1% to £11.8 billion, at the top end of our guidance range after<br />
allowing for currency movements and despite the additional costs incurred by Verizon Wireless’s iPhone<br />
launch. The main drivers were good growth in the Africa, Middle East and Asia Pacific region (‘AMAP’) and a<br />
strong performance from Verizon Wireless.<br />
During the year we recorded other net income of £5.3 billion, primarily in relation to a £2.8 billion net gain<br />
on the sale of the Group’s interests in China Mobile Limited, £1.8 billion on the settlement of a tax case<br />
and £0.5 billion from the disposal of investments in SoftBank Mobile Corp. We also recorded impairment<br />
charges of £6.1 billion relating to our businesses in Spain, Greece, Portugal, Italy and Ireland, which were<br />
primarily driven by higher discount rates given sharply increased interest rates. The impairment in Spain<br />
represented approximately half of the total.<br />
Free cash flow was £7.0 billion, at the top end of our medium-term guidance, as a result of our continued<br />
financial discipline and a strong working capital performance. Capital expenditure was £6.2 billion, broadly<br />
flat on last year and in line with our target, as we focused on widening our data coverage and improving<br />
network performance.<br />
Adjusted earnings per share was 16.75 pence, up 4.0% on last year, reflecting higher profitability and lower<br />
shares in issue as a result of the ongoing £2.8 billion buyback programme. The Board is recommending a<br />
final dividend per share of 6.05 pence, to give total dividends per share for the year of 8.90 pence, up 7.1%<br />
year-on-year.<br />
Europe<br />
Organic service revenue in Europe was down 0.4% (*) during the year and down 0.8% (*) in Q4. This represents<br />
a good recovery on last year (-3.8% (*) ) and is the result of two different trends: the more stable economies<br />
of northern Europe (Germany, UK, Netherlands) were up 2.7% (*) , while the rest of Europe was down 2.9% (*)<br />
as a result of the ongoing macroeconomic challenges. Data revenue growth continued to be strong, but<br />
was offset by continued voice price declines and cuts to mobile termination rates (‘MTRs’).<br />
Organic EBITDA for Europe was down 3.7% (*) and the EBITDA margin fell 1.7 percentage points as a result of<br />
the decline in revenue, ongoing competitive activity and higher commercial costs as we accelerated<br />
smartphone adoption.<br />
3
CHIEF EXECUTIVE’S STATEMENT<br />
AMAP<br />
Organic service revenue growth in AMAP was 9.5% (*) , accelerating through the year to a level of 11.8% (*) in<br />
Q4. Our two major businesses, India and Vodacom, reported growth of 16.2% (*) and 5.8% (*) respectively. Our<br />
performance in India has been driven by increasing voice penetration and a more stable pricing<br />
environment. In South Africa, Vodacom continues to be highly successful in promoting data services.<br />
Organic EBITDA was up 7.5% (*) , with EBITDA margin falling 0.6 percentage points (*) . The two main factors<br />
behind the margin decline were the adverse impact from higher recurring licence fee costs in India and the<br />
change in regional mix from the strong growth in India.<br />
Verizon Wireless<br />
Our US associate, Verizon Wireless, has continued to perform strongly. Organic service revenue was up<br />
5.8% (*) and EBITDA was up 6.7% (*) , with good growth in customers and strong data take-up. In Q4, Verizon<br />
Wireless launched a CDMA version of the iPhone, ending the exclusivity of its main competitor. We are<br />
continuing to work closely with Verizon, putting together unified account teams to handle large<br />
multinational enterprise accounts, gaining efficiencies through procurement and aligning our technical<br />
roadmaps. Our share of profits from Verizon Wireless amounted to £4.6 billion, up 8.5% (*) .<br />
Delivering a more valuable <strong>Vodafone</strong><br />
In November 2010 we announced an updated strategy, designed to build on the progress made during my<br />
first two years as CEO. There are four main elements to the strategy to build a more valuable <strong>Vodafone</strong>:<br />
1. Focus on key areas of growth potential;<br />
2. Deliver value and efficiency from scale;<br />
3. Generate liquidity or free cash flow from non-controlled interests; and<br />
4. Apply rigorous capital discipline to investment decisions.<br />
I am pleased to say that we are making good progress in each area.<br />
1) Focus on key areas of growth potential<br />
Mobile data: data revenue was up 26.4% (*) year-on-year to £5.1 billion, and now represents 12.0% of Group<br />
service revenue. We have continued to increase the penetration of smartphones into our customer base as<br />
these are a key driver of data adoption. Mobile broadband, which still accounts for the majority of data<br />
traffic on our network, has significant further scope for growth as we are seeing the emergence of a new<br />
and incremental category – tablets – which we believe have the potential to become mass market devices<br />
in the medium-term.<br />
We are successfully growing data revenue by moving away from “all-you-can-eat” packages to tiered data<br />
pricing. At the same time, we are increasing the penetration of data tariffs within our base, with 48% of our<br />
European smartphone customers now taking some form of data plan.<br />
Network quality is absolutely central to our data strategy and we have made further significant<br />
investments over the last 12 months to improve the speed and reliability of our coverage. Based on third<br />
party tests performed in 16 of our main 3G markets, we rank first for overall data performance in 13<br />
markets.<br />
Enterprise: revenue in the overall European enterprise segment was up 0.5% (*) year-on-year and<br />
represented 29.5% of our European service revenue. Within this, <strong>Vodafone</strong> Global Enterprise, which serves<br />
our multinational customers, delivered revenue growth of around 8% (*) thanks to some important<br />
customer wins and increased penetration of existing customer accounts. This market offers attractive<br />
growth opportunities, as multinationals and smaller companies alike look not only to manage costs but<br />
also to move to converged platforms and improve mobile connectivity for their workforces. <strong>Vodafone</strong> One<br />
Net, our converged voice proposition targeted at the small-to-medium-sized enterprise market, has now<br />
4
CHIEF EXECUTIVE’S STATEMENT<br />
been introduced into six countries and is gaining traction in an attractive segment. Enterprise customer<br />
satisfaction scores are at record levels, with customers increasingly focusing not just on price but on<br />
network quality and value-added services too – playing directly to our strengths.<br />
Emerging markets: the Group has an attractive level of exposure to emerging markets, where penetration<br />
is lower and GDP growth higher than in the more mature markets of western Europe. In addition, the lack<br />
of fixed line infrastructure in many of these markets means that mobile operators will be the primary<br />
providers of internet connectivity. Organic service revenue growth in our emerging markets was 11.8% (*) ,<br />
with our key operations in India, South Africa and Turkey up 16.2% (*) , 5.0% (*) and 28.9% (*) respectively.<br />
Total communications: we continue to develop our fixed line capabilities to meet our customers’ total<br />
communications needs beyond mobile connectivity. In the enterprise market we have made significant<br />
progress in the development of converged services, giving us an attractive opportunity to grow our share<br />
of companies’ total telecoms spend.<br />
In residential, our focus has been on developing innovative new services such as the <strong>Vodafone</strong> DSL Router,<br />
which combines mobile and fixed broadband services, and <strong>Vodafone</strong> TV, which delivers free and premium<br />
video content through a range of connections using satellite DTT, broadband (either fixed or mobile), or<br />
cable. Revenue from our fixed line operations amounted to £3.4 billion, up 5.2% (*) year-on-year.<br />
New services: machine-to-machine platforms (‘M2M’), mobile financial services and near-field<br />
communications, among other new services, all offer potential for incremental growth. During the year we<br />
made good progress in our M2M business and continued the growth and expansion of our mobile money<br />
transfer platform, which now has over 20 million customers and is currently being trialled in India.<br />
2) Deliver value and efficiency from scale<br />
The current composition of the Group has enabled us to increase efficiency and achieve favourable<br />
comparable cost positions in many markets. We aim to continue to generate savings from technology<br />
standardisation, off-shoring, outsourcing, platform sharing and Group purchasing. During the year we also<br />
established a more formal relationship with Verizon to leverage our purchasing power across a wide range<br />
of suppliers.<br />
3) Generate liquidity or free cash flow from non-controlled interests<br />
During the year we agreed disposals of our 3.2% stake in China Mobile Limited and our SoftBank interests<br />
for a total cash consideration of £7.4 billion. Subsequent to the year end, we announced the sale of our<br />
44% holding in SFR, the number two mobile operator in France, to Vivendi, the majority shareholder, for<br />
£6.8 billion. These three transactions crystallised significant value for shareholders, with £6.8 billion of<br />
proceeds being committed to share buyback programmes.<br />
4) Apply rigorous capital discipline to investment decisions<br />
We continue to apply capital discipline to our investment decisions. We apply rigorous commercial<br />
analysis and demanding hurdle rates to ensure that any investment or corporate activity will enhance<br />
shareholder returns. Adhering to our target credit rating of low single A continues to provide the Group<br />
with a low cost of debt and good access to liquidity. We will continue to undertake regular reviews of<br />
<strong>Vodafone</strong>’s entire portfolio to ensure that we optimise value for shareholders.<br />
Prospects for 2012 financial year<br />
We enter the new financial year in a strong position. We are gaining or holding market share in most of our<br />
major markets, and are leading our competitors in the drive to migrate customers to smartphones and<br />
data packages. We will continue to focus on our key growth areas of data, enterprise and emerging<br />
markets, while maintaining investment in network quality and the development of new services.<br />
5
CHIEF EXECUTIVE’S STATEMENT<br />
However, we continue to face challenging macroeconomic conditions across our southern European<br />
footprint, and we expect further regulated cuts to mobile termination rates to have a negative impact of<br />
about 2.5 percentage points on service revenue growth in the 2012 financial year.<br />
The Group EBITDA margin is expected to continue to decline, albeit at a lower rate than in the <strong>2011</strong><br />
financial year. The main driver is the persistent revenue decline in some of our southern European<br />
operations.<br />
Adjusted operating profit is expected to be in the range of £11.0 billion to £11.8 billion, reflecting the loss<br />
of our £0.5 billion share of profits from SFR as a result of the disposal of our 44% interest.<br />
Free cash flow is expected to be in the range of £6.0 to £6.5 billion, reflecting continued strong cash<br />
generation offset by the £0.3 billion reduction in dividends from SFR and China Mobile Limited in the 2012<br />
financial year, and the more limited working capital improvements available going forward. Capital<br />
expenditure is expected to be at a similar level to last year on a constant currency basis.<br />
We are well positioned to continue to deliver value to shareholders through the achievement of our<br />
medium-term targets for revenue, free cash flow and dividend growth; our commitment to investment in<br />
profitable growth areas; and our clear capital discipline.<br />
6
GROUP FINANCIAL HIGHLIGHTS<br />
Financial information (1)<br />
<strong>2011</strong> 2010 % change<br />
Page £m £m Reported Organic<br />
Revenue 25 45,884 44,472 3.2 2.8<br />
Operating profit 25 5,596 9,480 (41.0)<br />
Profit before taxation 25<br />
7<br />
9,498 8,674 9.5<br />
Profit for the financial year 25 7,870 8,618 (8.7)<br />
Basic earnings per share (pence) 25 15.20p 16.44p (7.5)<br />
Capital expenditure 32 6,219 6,192 0.4<br />
Cash generated by operations 20 15,392 15,337 0.4<br />
Performance reporting (1)(2)<br />
Group EBITDA 9 14,670 14,735 (0.4) (0.7)<br />
Group EBITDA margin 32.0% 33.1% (1.1pp) (1.1pp)<br />
Adjusted operating profit 9,34 11,818 11,466 3.1 1.8<br />
Adjusted profit before tax 11,34 11,003 10,564 4.2<br />
Adjusted effective tax rate 11 24.5% 24.0%<br />
Adjusted profit attributable<br />
to equity shareholders 12 8,776 8,471 3.6<br />
Adjusted earnings per share (pence) 12 16.75p 16.11p 4.0<br />
Free cash flow (3) 20 7,049 7,241 (2.7)<br />
Net debt 20,21 29,858 33,316 (10.4)<br />
Notes:<br />
(1) Amounts presented at 31 March or for the year then ended.<br />
(2) See page 31 for “Use of non-GAAP financial information” and page 36 for “Definitions of terms”.<br />
(3) All references to free cash flow are to amounts before licence and spectrum payments and for the year ended 31 March <strong>2011</strong> other items in<br />
respect of: a tax case settlement, tax relating to the disposal of China Mobile Limited, the SoftBank disposal and the court deposit made in<br />
respect of the India tax case, each of which are discussed elsewhere herein.
GUIDANCE<br />
Please see page 31 for “Use of non-GAAP financial information”, page 36 for “Definitions of terms” and page 37 for<br />
“Forward-looking statements”.<br />
Performance against <strong>2011</strong> financial<br />
year guidance<br />
8<br />
Adjusted operating profit<br />
£bn<br />
Free cash flow<br />
£bn<br />
Guidance – November 2010 (1) 11.8 – 12.2 In excess of 6.5<br />
<strong>2011</strong> performance on guidance basis (2) 12.2 7.2<br />
Foreign exchange (1) (0.3) (0.2)<br />
Verizon Wireless (3) (0.1) –<br />
<strong>2011</strong> reported performance (2) 11.8 7.0<br />
2012 financial year guidance<br />
Adjusted operating profit<br />
£bn<br />
Free cash flow<br />
£bn<br />
11.0 – 11.8 6.0 – 6.5<br />
Adjusted operating profit is expected to be in the range of £11.0 billion to £11.8 billion, reflecting the loss of our £0.5<br />
billion share of profits from SFR as a result of the disposal of our 44% stake.<br />
Free cash flow is expected to be in the range of £6.0 billion to £6.5 billion, reflecting continued strong cash<br />
generation offset by the £0.3 billion reduction in dividends from China Mobile Limited and SFR in the 2012 financial<br />
year, and the more limited working capital improvements available going forward. Capital expenditure is expected to<br />
be at a similar level to last year on a constant currency basis.<br />
Medium-term guidance<br />
The execution of the updated strategy is targeted to achieve annual growth in organic service revenue of between<br />
1% and 4% in the period to 31 March 2014. We expect that the Group EBITDA margin will stabilise by the end of this<br />
period.<br />
As a result of the loss of £0.5 billion of cash dividends from our disposals of stakes in China Mobile Limited and SFR,<br />
we expect that annual free cash flow generation will now be in the £5.5 billion to £6.5 billion range in the period to<br />
March 2014, underpinning the three year 7% per annum dividend per share growth target issued in <strong>May</strong> 2010. We<br />
continue to expect that total dividends per share will be no less than 10.18 pence for the 2013 financial year.<br />
The free cash flow target range excludes any incremental benefit that we derive from our strategy to generate<br />
liquidity or incremental cash flow from non-controlled interests of the Group, such as Verizon Wireless and<br />
Polkomtel.<br />
Assumptions<br />
Guidance for the 2012 financial year and the medium-term is based on our current assessment of the global<br />
economic outlook and assumes foreign exchange rates of £1:€1.15 and £1:US$1.60. It excludes the impact of<br />
licence and spectrum purchases, material one-off tax related payments and restructuring costs and assumes no<br />
material change to the current structure of the Group.<br />
With respect to the 7% per annum dividend per share growth target, as the Group's free cash flow is predominantly<br />
generated by companies operating within the euro currency zone, we have assumed that the euro to sterling<br />
exchange rate remains within 10% of the above guidance exchange rate.<br />
Actual exchange rates may vary from the exchange rate assumptions used. A 1% change in the euro to sterling<br />
exchange rate would impact adjusted operating profit and free cash flow by approximately £50 million and a 1%<br />
change in the dollar to sterling exchange rate would impact adjusted operating profit by approximately £50 million.<br />
Notes:<br />
(1) The Group’s guidance reflected assumptions for average exchange rates for the <strong>2011</strong> financial year of approximately £1:€1.15 and<br />
£1:US$1.50. Actual exchange rates were £1:€1.18 and £1:US$1.56.<br />
(2) After Verizon Wireless iPhone launch costs.<br />
(3) The Group’s guidance did not include the impact of the revenue recognition and Alltel related adjustments in Verizon Wireless.
CONTENTS<br />
Page<br />
Financial results 9<br />
Liquidity and capital resources 20<br />
Other significant developments 23<br />
Consolidated financial statements 25<br />
Use of non-GAAP financial information 31<br />
Additional information 32<br />
Other information (including forward-looking statements) 36<br />
FINANCIAL RESULTS<br />
Group (1)(2)<br />
Africa,<br />
Middle East<br />
and Asia<br />
9<br />
Non-<br />
Controlled<br />
Interests and<br />
Common<br />
Europe Pacific Functions (3) Eliminations <strong>2011</strong> 2010 % change<br />
£m £m £m £m £m £m £ Organic (4)<br />
Voice revenue<br />
Messaging revenue<br />
Data revenue<br />
Fixed line revenue<br />
Other service revenue<br />
Service revenue<br />
Other revenue<br />
Revenue<br />
Direct costs<br />
Customer costs<br />
Operating expenses<br />
EBITDA<br />
Depreciation and amortisation:<br />
<strong>17</strong>,884<br />
4,106<br />
3,871<br />
3,003<br />
1,233<br />
30,097<br />
1,918<br />
32,015<br />
(7,771)<br />
(9,672)<br />
(3,749)<br />
10,823<br />
9,036<br />
904<br />
1,216<br />
399<br />
737<br />
12,292<br />
1,012<br />
13,304<br />
(3,483)<br />
(3,224)<br />
(2,598)<br />
3,999<br />
293<br />
72<br />
35<br />
–<br />
12<br />
412<br />
247<br />
659<br />
(131)<br />
(393)<br />
(287)<br />
(152)<br />
–<br />
–<br />
–<br />
–<br />
(63)<br />
(63)<br />
(31)<br />
(94)<br />
63<br />
–<br />
31<br />
–<br />
27,213<br />
5,082<br />
5,122<br />
3,402<br />
1,919<br />
42,738<br />
3,146<br />
45,884<br />
(11,322)<br />
(13,289)<br />
(6,603)<br />
14,670<br />
28,009<br />
4,795<br />
4,051<br />
3,289<br />
1,575<br />
41,719<br />
2,753<br />
44,472<br />
(10,805)<br />
(12,249)<br />
(6,683)<br />
14,735<br />
2.4<br />
3.2<br />
(0.4)<br />
2.1<br />
2.8<br />
(0.7)<br />
Acquired intangibles (128) (966) (12) – (1,106) (1,226)<br />
Purchased licences (1,050) (122) (5) – (1,<strong>17</strong>7) (1,128)<br />
Other<br />
Share of result in associates<br />
Adjusted operating profit<br />
(3,919)<br />
–<br />
5,726<br />
(1,690)<br />
51<br />
1,272<br />
(75)<br />
5,064<br />
4,820<br />
–<br />
–<br />
–<br />
(5,684)<br />
5,115<br />
11,818<br />
(5,657)<br />
4,742<br />
11,466 3.1 1.8<br />
Impairment loss<br />
(6,150) (2,100)<br />
Other income and expense (5)<br />
(72) 114<br />
Operating profit<br />
5,596 9,480<br />
Non-operating income and expense (6)<br />
Net investment income/(financing costs)<br />
3,022<br />
880<br />
(10)<br />
(796)<br />
Income tax expense<br />
(1,628) (56)<br />
Profit for the year<br />
7,870 8,618<br />
Notes:<br />
(1) The Group revised its segment structure on 1 October 2010. See “Change in segments” on page 29.<br />
(2) Current period results reflect average exchange rates of £1:€1.18 and £1:US$1.56.<br />
(3) Common Functions primarily represent the results of the partner markets and the net result of unallocated central Group costs.<br />
(4) Organic growth includes Vodacom at the current level of ownership but excludes Australia following the merger with Hutchison 3G Australia on 9 June 2009.<br />
(5) Other income and expense for the year ended 31 March <strong>2011</strong> included £56 million representing the net loss on disposal of certain Alltel investments by Verizon<br />
Wireless. This is included within the line item “Share of results in associates” in the consolidated income statement.<br />
(6) Non-operating income and expense for the year ended 31 March <strong>2011</strong> includes £3,019 million profit arising on the sale of the Group’s 3.2% interest in China<br />
Mobile Limited. For further details see page 24.
FINANCIAL RESULTS<br />
Revenue<br />
Group revenue increased by 3.2% to £45,884 million and Group service revenue increased by 2.4% to £42,738<br />
million. On an organic basis Group service revenue increased by 2.1% (*) , with a 0.8 percentage point improvement<br />
between the first and second half as both Europe and AMAP delivered improved organic service revenue trends.<br />
In Europe service revenue fell by 0.4% (*) with a decline of 0.3% (*) in the second half of the year. Both the UK and<br />
Germany performed well delivering full year service revenue growth of 4.7% (*) and 0.8% (*) respectively. Spain<br />
continued to experience economic pressures which have intensified competition leading to a 6.9% (*) decline in<br />
service revenue. Service revenue also declined by 2.1% (*) in Italy driven by a challenging economic and competitive<br />
environment combined with the impact of termination rate cuts. Our improved commercial offers in Turkey have<br />
delivered service revenue growth of 28.9% (*) , despite a 52% cut in termination rates which was effective from 1 April<br />
2010. Challenging economic and competitive conditions continued in our other central European businesses where<br />
service revenue growth was also impacted by mobile termination rate cuts. European enterprise revenue increased<br />
by 0.5% (*) with improved roaming activity and important customer wins.<br />
In AMAP service revenue grew by 9.5% (*) . Vodacom continued to perform well, with strong data revenue growth from<br />
mobile broadband offsetting weaker voice revenue which was impacted by two termination rate cuts during the year.<br />
In India service revenue increased by 16.2% (*) , driven by an increase in the mobile customer base and a more stable<br />
pricing environment towards the end of the year. In Qatar the customer base reached 757,000 by the end of the year,<br />
with 45% of the population now actively using <strong>Vodafone</strong> services less than two years after launch. On an organic<br />
basis, service revenue in Egypt declined by 0.8% (*) where performance was impacted by the socio-political unrest<br />
during the fourth quarter.<br />
EBITDA and profit<br />
EBITDA decreased by 0.4% to £14,670 million with a 1.1 percentage point decline in both the reported and organic<br />
EBITDA margin.<br />
In Europe EBITDA decreased by 3.7% (*) , with a decline in EBITDA margin of 1.7 percentage points, primarily driven by a<br />
reduction in service revenue in most markets and higher investment in acquisition and retention costs, partially<br />
offset by operating cost efficiencies.<br />
In AMAP EBITDA increased by 7.5% (*) , driven primarily by growth in India, together with improvements in Vodacom,<br />
Ghana, New Zealand and Qatar, partially offset by a slight decline in Egypt. The EBITDA margin fell 0.6 percentage<br />
points (*) , the two main factors behind the decline being higher recurring licence fee costs in India and the change in<br />
regional mix from the strong growth in India.<br />
Adjusted operating profit grew by 3.1% as a result of an increase in the Group’s share of results of Verizon Wireless<br />
partially offset by the decline in Group EBITDA. The Group’s share of results in Verizon Wireless, the Group’s associate<br />
in the United States, increased by 8.5% (*) primarily due to the expanding customer base, robust data revenue,<br />
efficiencies in operating expenses and lower acquisition costs partially offset by higher customer retention costs<br />
reflecting the increased demand for smartphones in the United States.<br />
The Group recorded other net income of £5,342 million, primarily in relation to a £2.8 billion net gain on the sale of<br />
the Group’s interests in China Mobile Limited, £1.8 billion on the settlement of a tax case and £0.5 billion from the<br />
disposal of investments in SoftBank Mobile Corp.<br />
Operating profit decreased by 41.0% primarily due to higher impairment losses compared to the prior year.<br />
Impairment losses totalling £6,150 million were recorded relating to our businesses in Spain (£2,950 million), Italy<br />
(£1,050 million), Ireland (£1,000 million), Greece (£800 million) and Portugal (£350 million), primarily resulting from<br />
increased discount rates as a result of increases in government bond rates together with lower cash flows within<br />
business plans, reflecting weaker country-level macro economic environments. The impairment loss in the prior year<br />
was £2,100 million.<br />
Profit for the year decreased by 8.7%.<br />
10
FINANCIAL RESULTS<br />
Net investment income/(financing costs)<br />
11<br />
<strong>2011</strong> 2010<br />
£m £m<br />
Investment income 1,309 716<br />
Financing costs (429) (1,512)<br />
Net investment income/(financing costs) 880 (796)<br />
Analysed as:<br />
Net financing costs before income from investments (852) (1,024)<br />
Potential interest charges arising on settlement of outstanding tax issues (1) (46) (23)<br />
Income from investments 83 145<br />
(815) (902)<br />
Foreign exchange (2) 256 (1)<br />
Equity put rights and similar arrangements (3) 95 (94)<br />
Interest related to the settlement of tax cases (4) 872 201<br />
Disposal of SoftBank financial instruments (5) 472 –<br />
880 (796)<br />
Notes:<br />
(1) Excluding interest credits related to a tax case settlement.<br />
(2) Comprises foreign exchange rate differences reflected in the income statement in relation to certain intercompany balances and the foreign<br />
exchange rate differences on financial instruments received as consideration on the disposal of <strong>Vodafone</strong> Japan to SoftBank in April 2006.<br />
(3) Includes foreign exchange rate movements, accretion expense and fair value charges. Further details of these options are provided on page<br />
23.<br />
(4) The £872 million in the year ended 31 March <strong>2011</strong> relates to the settlement of a tax case and the £201 million in the year ended 31 March<br />
2010 relates to the settlement of the German tax loss claim.<br />
(5) See “Other significant developments” on page 24.<br />
Net financing costs before income from investments decreased from £1,024 million to £852 million primarily due to<br />
a reduction in net debt, partially offset by an increase in average interest rates for debt denominated in US dollars. At<br />
31 March <strong>2011</strong> the provision for potential interest charges arising on settlement of outstanding tax issues was £398<br />
million (31 March 2010: £1,312 million), with the reduction primarily reflecting the settlement of a tax case.<br />
Taxation<br />
<strong>2011</strong> 2010<br />
£m £m<br />
Income tax expense 1,628 56<br />
Tax on adjustments to derive adjusted profit before tax (232) (39)<br />
Tax benefit related to settlement of tax cases (1) 929 2,103<br />
Adjusted income tax expense 2,325 2,120<br />
Share of associates’ tax 519 572<br />
Adjusted income tax expense for purposes of calculating adjusted tax rate 2,844 2,692<br />
Profit before tax 9,498 8,674<br />
Adjustments to derive adjusted profit before tax (2) 1,505 1,890<br />
Adjusted profit before tax 11,003 10,564<br />
Add: Share of associates’ tax and non-controlling interest 604 652<br />
Adjusted profit before tax for the purpose of calculating adjusted effective tax rate 11,607 11,216<br />
Adjusted effective tax rate 24.5% 24.0%<br />
Notes:<br />
(1) The £929 million in the year ended 31 March <strong>2011</strong> relates to the settlement of a tax case and the £2,103 million in the year ended 31 March<br />
2010 relates to the settlement of the German tax loss claim.<br />
(2) See “Earnings per share” on page 12.<br />
The adjusted effective tax rate for the year ended 31 March <strong>2011</strong> was 24.5%. This is in line with the adjusted effective<br />
tax rate for the year ended 31 March 2010 of 24.0%. Tax on adjustments to derive adjusted profit before tax includes<br />
tax payable on the gain on the disposal of the Group’s 3.2% interest in China Mobile Limited.<br />
Income tax expense includes a credit of £929 million arising as a result of the settlement of a tax case in July 2010.<br />
For further details see note 4 to the consolidated financial statements in the half-year financial report for the six<br />
months ended 30 September 2010.
FINANCIAL RESULTS<br />
Earnings per share<br />
Adjusted earnings per share increased by 4.0% to 16.75 pence for the year ended 31 March <strong>2011</strong> due to growth in<br />
adjusted earnings and a reduction in shares arising from the Group’s share buyback programme. Basic earnings per<br />
share decreased to 15.2 pence primarily due to the £6,150 million of impairment charges partially offset by a gain<br />
on disposal of the Group’s 3.2% interest in China Mobile Limited and the settlement of a tax case.<br />
<strong>2011</strong> 2010<br />
£m £m<br />
Profit attributable to equity shareholders 7,968 8,645<br />
Pre-tax adjustments:<br />
Impairment loss 6,150 2,100<br />
Other income and expense (1)(4) 72 (114)<br />
Non-operating income and expense (2)(4) (3,022) 10<br />
Investment income and financing costs (3)(4) (1,695) (106)<br />
1,505 1,890<br />
Taxation (4) (697) (2,064)<br />
Adjusted profit attributable to equity shareholders 8,776 8,471<br />
Million Million<br />
Weighted average number of shares outstanding – basic 52,408 52,595<br />
Weighted average number of shares outstanding – diluted 52,748 52,849<br />
Notes:<br />
(1) The year ended 31 March <strong>2011</strong> includes £56 million representing the net loss on disposal of certain Alltel investments by Verizon Wireless.<br />
This is included within the line item “Share of results in associates” in the consolidated income statement.<br />
(2) The year ended 31 March <strong>2011</strong> includes £3,019 million representing the profit arising on the sale of the Group’s 3.2% interest in China<br />
Mobile Limited.<br />
(3) See notes 2, 3, 4 and 5 in ”Net investment income/(financing costs)” on page 11.<br />
(4) These amounts comprise “Other net income” of £5,342 million.<br />
12
FINANCIAL RESULTS<br />
Europe (1)<br />
Germany Italy Spain UK Other Eliminations Europe % change<br />
£m £m £m £m £m £m £m £ Organic<br />
31 March <strong>2011</strong><br />
Voice revenue 3,466 3,237 3,319 2,545 5,318 (1) <strong>17</strong>,884<br />
Messaging revenue 790 849 345 1,148 974 – 4,106<br />
Data revenue 1,250 602 537 762 720 – 3,871<br />
Fixed line revenue 1,813 574 314 31 271 – 3,003<br />
Other service revenue 152 <strong>17</strong>0 220 445 504 (258) 1,233<br />
Service revenue 7,471 5,432 4,735 4,931 7,787 (259) 30,097 (3.4) (0.4)<br />
Other revenue 429 290 398 340 466 (5) 1,918<br />
Revenue 7,900 5,722 5,133 5,271 8,253 (264) 32,015 (2.5) 0.6<br />
Direct costs (1,729) (1,305) (1,050) (1,548) (2,398) 259 (7,771)<br />
Customer costs (2,399) (1,169) (1,990) (1,928) (2,191) 5 (9,672)<br />
Operating expenses (820) (605) (531) (562) (1,231) – (3,749)<br />
EBITDA<br />
Depreciation and amortisation:<br />
2,952 2,643 1,562 1,233 2,433 – 10,823 (7.1) (3.7)<br />
Acquired intangibles – – (1) – (127) – (128)<br />
Purchased licences (472) (102) (7) (333) (136) – (1,050)<br />
Other (932) (638) (639) (552) (1,158) – (3,919)<br />
Adjusted operating profit 1,548 1,903 915 348 1,012 – 5,726 (9.8) (6.1)<br />
EBITDA margin 37.4% 46.2% 30.4% 23.4% 29.5% 33.8%<br />
31 March 2010<br />
Voice revenue 3,895 3,658 3,859 2,681 5,732 (1) 19,824<br />
Messaging revenue 778 894 400 1,020 926 – 4,018<br />
Data revenue 1,018 516 488 593 630 – 3,245<br />
Fixed line revenue 1,900 540 318 31 181 – 2,970<br />
Other service revenue 131 <strong>17</strong>2 233 386 474 (294) 1,102<br />
Service revenue 7,722 5,780 5,298 4,711 7,943 (295) 31,159<br />
Other revenue 286 247 415 314 414 (2) 1,674<br />
Revenue 8,008 6,027 5,713 5,025 8,357 (297) 32,833<br />
Direct costs (1,728) (1,359) (1,161) (1,521) (2,364) 295 (7,838)<br />
Customer costs (2,221) (1,150) (2,035) (1,813) (2,136) 2 (9,353)<br />
Operating expenses (937) (675) (561) (550) (1,275) – (3,998)<br />
EBITDA 3,122 2,843 1,956 1,141 2,582 – 11,644<br />
Depreciation and amortisation:<br />
Acquired intangibles – (10) (2) (7) (<strong>17</strong>9) – (198)<br />
Purchased licences (446) (104) (7) (333) (123) – (1,013)<br />
Other (981) (622) (637) (646) (1,196) – (4,082)<br />
Adjusted operating profit 1,695 2,107 1,310 155 1,084 – 6,351<br />
EBITDA margin 39.0% 47.2% 34.2% 22.7% 30.9% 35.5%<br />
Change at constant exchange rates % % % % %<br />
Voice revenue (7.3) (7.8) (10.4) (5.1) (4.5)<br />
Messaging revenue 5.8 (1.0) (10.0) 12.6 8.2<br />
Data revenue 27.9 21.5 14.8 28.5 18.5<br />
Fixed line revenue (0.5) 10.7 2.8 1.9 55.3<br />
Other service revenue 21.1 2.6 (1.4) 15.3 9.4<br />
Service revenue 0.8 (2.1) (6.9) 4.7 1.0<br />
Other revenue 56.2 21.8 (0.2) 8.2 <strong>17</strong>.2<br />
Revenue 2.8 (1.1) (6.4) 4.9 1.8<br />
Direct costs 4.2 – (5.7) 1.8 4.0<br />
Customer costs 12.7 6.0 1.9 6.4 5.7<br />
Operating expenses (8.9) (6.8) (1.6) 2.1 (0.9)<br />
EBITDA<br />
Depreciation and amortisation:<br />
(1.5) (3.1) (16.8) 8.0 (2.2)<br />
Acquired intangibles – (100.0) (50.0) (100.0) (27.0)<br />
Purchased licences 10.3 3.0 – – 14.3<br />
Other 0.5 6.7 4.6 (14.6) (0.4)<br />
Adjusted operating profit (4.9) (5.9) (27.3) 125.1 (1.7)<br />
EBITDA margin movement (pps) (1.6) (1.0) (3.9) 0.7 (1.2)<br />
Note:<br />
(1) The Group revised its segment structure on 1 October 2010. See “Change in segments” on page 29.<br />
13
FINANCIAL RESULTS<br />
Revenue declined by 2.5% reflecting a 3.2 percentage point impact from unfavourable foreign exchange rate<br />
movements. On an organic basis service revenue declined by 0.4% (*) reflecting reductions in most markets offset by<br />
growth in Germany, the UK, the Netherlands and Turkey. The decline was primarily driven by lower voice revenue<br />
resulting from continued market and regulatory pressure on pricing and the challenging economic climate, partially<br />
offset by growth in data and fixed line revenue.<br />
EBITDA decreased by 7.1% including a 3.5 percentage point impact from unfavourable exchange rate movements.<br />
On an organic basis EBITDA decreased by 3.7% (*) , with a 1.7 percentage point decline in EBITDA margin resulting from<br />
a reduction in service revenue in most markets and higher customer investment, partially offset by operating cost<br />
savings.<br />
14<br />
Organic M&A Foreign Reported<br />
change activity exchange change<br />
% pps pps %<br />
Revenue - Europe 0.6 0.1 (3.2) (2.5)<br />
Service revenue<br />
Germany 0.8 – (4.1) (3.3)<br />
Italy (2.1) – (3.9) (6.0)<br />
Spain (6.9) – (3.7) (10.6)<br />
UK 4.7 – – 4.7<br />
Other Europe 0.5 0.5 (3.0) (2.0)<br />
Europe (0.4) 0.1 (3.1) (3.4)<br />
EBITDA<br />
Germany (1.5) – (3.9) (5.4)<br />
Italy (3.1) – (3.9) (7.0)<br />
Spain (16.8) – (3.3) (20.1)<br />
UK 8.0 – – 8.0<br />
Other Europe (2.4) 0.2 (3.6) (5.8)<br />
Europe (3.7) 0.1 (3.5) (7.1)<br />
Adjusted operating profit<br />
Germany (4.9) – (3.8) (8.7)<br />
Italy (5.9) – (3.8) (9.7)<br />
Spain (27.3) – (2.9) (30.2)<br />
UK 125.1 – – 125.1<br />
Other Europe (2.0) 0.3 (4.9) (6.6)<br />
Europe (6.1) 0.1 (3.8) (9.8)<br />
Germany<br />
Service revenue increased by 0.8% (*) driven by strong data and messaging revenue growth. Data revenue grew by<br />
27.9% (*) as a result of increased penetration of smartphones and Superflat Internet tariffs. Mobile revenue remained<br />
stable in the fourth quarter despite a termination rate cut effective from 1 December 2010. Enterprise revenue grew<br />
by 3.6% (*) driven by strong customer and data revenue growth.<br />
EBITDA declined by 1.5% (*) , with a 1.6 percentage point reduction in the EBITDA margin. This decline was driven by<br />
increased customer acquisition and retention, contributed to by the launch of the iPhone in the third quarter,<br />
partially offset by operating cost efficiencies.<br />
During the year we acquired LTE spectrum in Germany and launched LTE services towards the end of the year,<br />
initially targeting rural areas underserved by fixed broadband.<br />
Italy<br />
Service revenue declined by 2.1% (*) primarily driven by the challenging economic and competitive environment, the<br />
impact of termination rate cuts and customer tariff optimisation. The average contract customer base grew by 12.6%<br />
enabling the partial offset of these pressures. Data revenue growth remained strong at 21.5% (*) driven by the high<br />
level of customers migrating to smartphones and taking advantage of data plans. There was continued investment to<br />
improve quality and coverage of the network. Fixed line revenue continued to grow with the broadband customer<br />
base reaching 1.7 million at 31 March <strong>2011</strong> on a 100% basis.
FINANCIAL RESULTS<br />
EBITDA decreased by 3.1% (*) , with a fall in the EBITDA margin of 1.0 percentage point, as a result of the decline in<br />
service revenue and higher investment in acquisition and retention costs partially offset by a reduction in operating<br />
expenses.<br />
Spain<br />
Service revenue declined by 6.9% (*) impacted by continued intense competition, general economic weakness and the<br />
penetration of lower priced tariffs into the customer base. New integrated plans were introduced in the third quarter<br />
in response to the demand for combined voice and data tariffs driven by the increase in smartphones. Data revenue<br />
grew by 14.8% (*) driven by mobile broadband and mobile internet. One-off items contributed to a 1.8 percentage<br />
point (*) improvement to service revenue growth for the fourth quarter.<br />
EBITDA declined 16.8% (*) , with a 3.8 percentage point fall in the EBITDA margin, due to lower service revenue and<br />
proportionately higher acquisition and retention costs, partially offset by a reduction in operating expenses.<br />
UK<br />
Service revenue increased by 4.7% (*) driven by data revenue growth due to increasing penetration of smartphones<br />
and mobile internet bundles, and strong net contract customer additions, which more than offset continued<br />
competitive pressures and weaker prepaid revenue. The termination rate cuts announced in March <strong>2011</strong> are<br />
expected to have a significant negative impact on revenue growth during the 2012 financial year.<br />
EBITDA increased by 8.0% (*) with the EBITDA margin increasing by 0.7 percentage points, reflecting higher service<br />
revenue partially offset by higher customer acquisition and retention costs.<br />
Other Europe<br />
Service revenue increased by 0.5% (*) with growth in Turkey and the Netherlands being partially offset by declines in<br />
other markets due to the challenging economic environment and intense competitive factors. In Turkey service<br />
revenue grew by 28.9% (*) driven by strong growth in both data and voice revenue, despite a 52% cut in termination<br />
rates effective from 1 April 2010. In Greece service revenue declined by 19.4% (*) with intense competition driving a<br />
reduction in prepaid revenue and economic factors leading to customer tariff optimisation.<br />
EBITDA declined by 2.4% (*) , with declines in all markets except Turkey and the Netherlands, due primarily to lower<br />
service revenue and higher acquisition and retention costs partially offset by operating cost efficiencies.<br />
15
FINANCIAL RESULTS<br />
Africa, Middle East and Asia Pacific (1)<br />
Other<br />
Africa,<br />
Africa,<br />
Middle East<br />
Middle East<br />
India Vodacom<br />
and<br />
Asia Pacific Eliminations<br />
and<br />
Asia Pacific % change<br />
£m £m £m £m £m £ Organic (2)<br />
31 March <strong>2011</strong><br />
Voice revenue 3,041 3,528 2,467 – 9,036<br />
Messaging revenue <strong>17</strong>1 285 448 – 904<br />
Data revenue 247 577 392 – 1,216<br />
Fixed line revenue 7 216 <strong>17</strong>6 – 399<br />
Other service revenue 338 233 167 (1) 737<br />
Service revenue 3,804 4,839 3,650 (1) 12,292 20.0 9.5<br />
Other revenue 51 640 321 – 1,012<br />
Revenue 3,855 5,479 3,971 (1) 13,304 20.0 9.5<br />
Direct costs (1,114) (1,168) (1,202) 1 (3,483)<br />
Customer costs (534) (1,652) (1,038) – (3,224)<br />
Operating expenses (1,222) (815) (561) – (2,598)<br />
EBITDA<br />
Depreciation and amortisation:<br />
985 1,844 1,<strong>17</strong>0 – 3,999 20.8 7.5<br />
Acquired intangibles (357) (554) (55) – (966)<br />
Purchased licences (5) – (1<strong>17</strong>) – (122)<br />
Other (608) (463) (619) – (1,690)<br />
Share of result in associates – – 51 – 51<br />
Adjusted operating profit 15 827 430 – 1,272 55.5 8.6<br />
EBITDA margin 25.6% 33.7% 29.5% 30.1%<br />
31 March 2010<br />
Voice revenue 2,547 3,043 2,268 – 7,858<br />
Messaging revenue 108 243 391 – 742<br />
Data revenue 169 342 268 – 779<br />
Fixed line revenue 2 <strong>17</strong>2 145 – 319<br />
Other service revenue 243 154 152 (1) 548<br />
Service revenue 3,069 3,954 3,224 (1) 10,246<br />
Other revenue 45 496 302 – 843<br />
Revenue 3,114 4,450 3,526 (1) 11,089<br />
Direct costs (880) (1,034) (1,031) 1 (2,944)<br />
Customer costs (424) (1,134) (940) – (2,498)<br />
Operating expenses (1,003) (754) (578) – (2,335)<br />
EBITDA 807 1,528 977 – 3,312<br />
Depreciation and amortisation:<br />
Acquired intangibles (340) (611) (61) – (1,012)<br />
Purchased licences – – (110) – (110)<br />
Other (504) (395) (527) – (1,426)<br />
Share of result in associates – (2) 56 – 54<br />
Adjusted operating (loss)/profit (37) 520 335 – 818<br />
EBITDA margin 25.9% 34.3% 27.7% 29.9%<br />
Change at constant exchange rates<br />
% % %<br />
Voice revenue 11.9 6.2 3.0<br />
Messaging revenue 49.3 7.1 3.6<br />
Data revenue 36.8 53.5 34.8<br />
Fixed line revenue 185.3 23.3 14.9<br />
Other service revenue 31.0 43.1 3.4<br />
Service revenue 16.2 12.5 6.3<br />
Other revenue 7.3 16.8 (2.9)<br />
Revenue 16.1 13.0 5.5<br />
Direct costs 18.5 4.6 9.3<br />
Customer costs <strong>17</strong>.7 33.0 0.5<br />
Operating expenses 14.0 0.5 (9.4)<br />
EBITDA<br />
Depreciation and amortisation:<br />
15.1 9.8 15.7<br />
Acquired intangibles (1.7) (18.3) (<strong>17</strong>.9)<br />
Purchased licences – – 4.5<br />
Other 13.0 9.2 10.5<br />
Share of result in associates – – (8.2)<br />
Adjusted operating profit (134.0) 43.9 31.4<br />
EBITDA margin movement (pps) (0.2) (0.9) 2.6<br />
(1) The Group revised its segment structure on 1 October 2010. See “Change in segments” on page 29.<br />
(2) Organic growth includes Vodacom at the current level of ownership and excludes Australia following the merger with Hutchison 3G Australia on 9 June 2009.<br />
16
FINANCIAL RESULTS<br />
Revenue grew by 20.0% with an 8.5 percentage point benefit from foreign exchange rate movements and the full<br />
year impact of the consolidation of Vodacom results from 18 <strong>May</strong> 2009 partially offset by the impact of the creation<br />
of the <strong>Vodafone</strong> Hutchison Australia (‘VHA’) joint venture on 9 June 2009. On an organic basis service revenue grew<br />
by 9.5% (*) despite the impact of MTR reductions and difficult economic environments. The growth was driven by a<br />
strong performance in India and continued growth from Vodacom and the rest of the region, other than Egypt where<br />
performance was impacted by the socio-political unrest during the fourth quarter.<br />
EBITDA grew by 20.8% with foreign exchange rate movements contributing 8.0 percentage points of growth. On an<br />
organic basis EBITDA grew by 7.5% (*) driven primarily by growth in India, together with improvements in Vodacom,<br />
Ghana, Qatar and New Zealand, partially offset by a decline in Egypt following pricing pressure and socio-political<br />
unrest.<br />
<strong>17</strong><br />
Organic M&A Foreign Reported<br />
change activity exchange change<br />
% pps pps %<br />
Revenue – Africa, Middle East and Asia Pacific 9.5 2.0 8.5 20.0<br />
Service revenue<br />
India 16.2 – 7.7 23.9<br />
Vodacom 5.8 6.7 9.9 22.4<br />
Other Africa, Middle East and Asia Pacific 7.2 (0.9) 6.9 13.2<br />
Africa, Middle East and Asia Pacific 9.5 2.2 8.3 20.0<br />
EBITDA<br />
India 15.1 – 7.0 22.1<br />
Vodacom 4.9 4.9 10.9 20.7<br />
Other Africa, Middle East and Asia Pacific 5.1 10.6 4.1 19.8<br />
Africa, Middle East and Asia Pacific 7.5 5.3 8.0 20.8<br />
Adjusted operating profit<br />
India 134.0 – 6.5 140.5<br />
Vodacom 5.7 38.2 15.1 59.0<br />
Other Africa, Middle East and Asia Pacific 2.2 29.2 (3.0) 28.4<br />
Africa, Middle East and Asia Pacific 8.6 39.9 7.0 55.5<br />
India<br />
Service revenue grew by 16.2% (*) including a 1.7 percentage point (*) benefit from Indus Towers, the Group’s network<br />
sharing joint venture. Growth was driven by a 39.0% increase in the average mobile customer base and stable usage<br />
per customer trends, partially offset by a fall in the effective rate per minute due to an increase in the penetration of<br />
lower priced tariffs into the customer base and strong competition in the market.<br />
February <strong>2011</strong> saw the launch of commercial 3G services following the purchase of 3G spectrum in <strong>May</strong> 2010 and<br />
subsequent network build. By the end of the year 1.5 million customers had activated their 3G access.<br />
EBITDA grew by 15.1% (*) driven by the increase in the customer base and economies of scale, which absorbed pricing<br />
and cost pressures.<br />
Vodacom<br />
Service revenue grew by 5.8% (*) driven by South Africa where growth in data revenue of 35.9% (*)(1) offset a decline in<br />
voice revenue caused by termination rate cuts effective from 1 March 2010 and 1 March <strong>2011</strong>.<br />
In South Africa data revenue growth was driven by a 48.9% (*) increase in data usage due to strong growth in mobile<br />
connect cards and smartphones. In addition, successful commercial activity, particularly in off-peak periods, drove<br />
higher voice usage during the year which partially offset the impact of termination rate cuts. Net customer additions<br />
returned to pre-registration levels for the first time in the third quarter, with the trend continuing during the fourth<br />
quarter with net additions of 1.2 million.<br />
In Vodacom’s operations outside South Africa service revenue growth continued with strong performances from<br />
Tanzania and Mozambique. Trading conditions remain challenging in the Democratic Republic of Congo and the<br />
Gateway operations.
FINANCIAL RESULTS<br />
EBITDA grew by 4.9% (*) driven by the increase in service revenue, strong handset sales and lower interconnection<br />
costs, partially offset by higher operating expenses.<br />
On 1 April <strong>2011</strong> Vodacom refreshed its branding to more closely align with that of the Group.<br />
Other Africa, Middle East and Asia Pacific<br />
Service revenue grew by 7.2% (*) with growth across all markets except Egypt. In Qatar the customer base reached<br />
757,000 by the end of the year, with 45% of the population now actively using <strong>Vodafone</strong> services. The decline in<br />
Egypt service revenue was driven by a combination of termination rate reductions, competitive pressure on pricing<br />
and socio-political unrest during the fourth quarter, offset in part by strong customer and data revenue growth during<br />
the year. In Ghana service revenue growth of 21.0% (*) was supported by competitive tariffs and improved brand<br />
awareness.<br />
VHA integration remains on track and a number of important initiatives were completed during the financial year to<br />
begin realising the benefits of the merger. Contact centre operations were consolidated into two major centres in<br />
Hobart and Mumbai India, substantial progress was made in the consolidation of the retail footprint and a major refit<br />
of retail stores is underway. VHA appointed new suppliers for network managed services, core, transmission and IT<br />
managed services.<br />
EBITDA increased by 5.1% (*) driven by growth in Ghana, New Zealand and Qatar partially offset by a decline in Egypt<br />
resulting primarily from the lower effective price per minute but also impacted by the socio-political unrest during<br />
the fourth quarter.<br />
Note:<br />
(1) Data revenue in South Africa grew by 41.8% (*) . Excluding the impact of reclassifications between messaging and data revenue during the year,<br />
data revenue grew by 35.9% (*) .<br />
18
FINANCIAL RESULTS<br />
Verizon Wireless (1)(2)<br />
19<br />
<strong>2011</strong> 2010 % change<br />
£m £m £ Organic (3)<br />
Service revenue <strong>17</strong>,238 15,898 8.4 5.8<br />
Revenue 18,711 <strong>17</strong>,222 8.6 6.0<br />
EBITDA 7,313 6,689 9.3 6.7<br />
Interest (261) (298) (12.4)<br />
Tax (2) (235) (205) 14.6<br />
Group’s share of result in Verizon Wireless 4,569 4,112 11.1 8.5<br />
KPIs (100% basis)<br />
Customers (’000) (4) 88,414 85,715<br />
Average monthly ARPU (US$) 57.2 55.8<br />
Churn 16.3% 16.9%<br />
Messaging and data as a percentage of service revenue 32.9% 28.7%<br />
Notes:<br />
(1) All amounts represent the Group’s share unless otherwise stated.<br />
(2) The Group’s share of the tax attributable to Verizon Wireless relates only to the corporate entities held by the Verizon Wireless partnership<br />
and certain state taxes which are levied on the partnership. The tax attributable to the Group’s share of the partnership’s pre-tax profit is<br />
included within the Group tax charge.<br />
(3) Organic growth rates include the impact of a non-cash revenue adjustment which was recorded by Verizon Wireless to defer previously<br />
recognised data revenue that will be earned and recognised in future periods. Excluding this the equivalent organic growth rates for service<br />
revenue, revenue, EBITDA and the Group’s share of result in Verizon Wireless would have been 6.4%, 6.6%, 8.2% and 10.8% respectively.<br />
(4) In order to align with the customer numbers reported externally by Verizon Wireless, customers were restated to reflect retail customers<br />
only. Comparatives are presented on the revised basis.<br />
In the United States Verizon Wireless reported 2.6 million net mobile customer additions bringing its closing mobile<br />
customer base to 88.4 million, a 3.1% increase. Customer growth improved in the fourth quarter of the year following<br />
the launch of the iPhone on the Verizon Wireless network in February <strong>2011</strong>.<br />
Service revenue growth of 5.8% (*) was driven by the expanding customer base and robust data revenue primarily<br />
derived from growth in the penetration of smartphones.<br />
The EBITDA margin remained strong despite the competitive challenges and economic environment. Efficiencies in<br />
operating expenses and lower customer acquisition costs resulting from lower volumes have been partly offset by a<br />
higher level of customer retention costs reflecting the increased demand for smartphones.<br />
As part of the regulatory approval for the Alltel acquisition, Verizon Wireless was required to divest overlapping<br />
properties in 105 markets. On 26 April 2010 Verizon Wireless completed the sale of network and licence assets in 26<br />
markets, encompassing 0.9 million customers, to Atlantic Tele-Network for US$0.2 billion. On 22 June 2010 Verizon<br />
Wireless completed the sale of network assets and mobile licences in the remaining 79 markets to AT&T Mobility for<br />
US$2.4 billion. As a result the Verizon Wireless customer base reduced by approximately 2.1 million net customers<br />
on a 100% basis, partially offset by certain adjustments in relation to the Alltel acquisition.<br />
On 23 August 2010 Verizon Wireless acquired a spectrum licence, network assets and related customers in<br />
southwest Mississippi and in Louisiana, formerly owned by Centennial Communications Corporation, from AT&T Inc.<br />
for cash consideration of US$0.2 billion. This acquisition was made to enhance Verizon Wireless’ network coverage in<br />
these two locations.<br />
Verizon Wireless’ net debt at 31 March <strong>2011</strong> totalled US$9.6 billion (31 March 2010: US$22.4 billion).
LIQUIDITY AND CAPITAL RESOURCES<br />
Cash flows and funding<br />
20<br />
<strong>2011</strong> 2010<br />
£m £m %<br />
Cash generated by operations 15,392 15,337 0.4<br />
Cash capital expenditure (1) (5,658) (5,986)<br />
Disposal of property, plant and equipment 51 48<br />
Operating free cash flow 9,785 9,399 4.1<br />
Taxation (2,597) (2,273)<br />
Dividends received from associates and investments (2) 1,509 1,577<br />
Dividends paid to non-controlling shareholders in subsidiaries (320) (56)<br />
Interest received and paid (1,328) (1,406)<br />
Free cash flow 7,049 7,241 (2.7)<br />
Other amounts (3) 45 –<br />
Licence and spectrum payments (2,982) (989)<br />
Acquisitions and disposals (4) (183) (2,683)<br />
Contributions from non-controlling shareholders in subsidiaries (5) – 613<br />
Equity dividends paid (4,468) (4,139)<br />
Purchase of treasury shares (2,087) –<br />
Foreign exchange 834 1,038<br />
Other (6) 5,250 (<strong>17</strong>4)<br />
Net debt decrease 3,458 907<br />
Opening net debt (33,316) (34,223)<br />
Closing net debt (29,858) (33,316) (10.4)<br />
Notes:<br />
(1) Cash paid for purchase of property, plant and equipment and intangible assets, other than licence and spectrum payments.<br />
(2) The year ended 31 March <strong>2011</strong> includes £1,024 million (2010: £1,034 million) from the Group’s interest in Verizon Wireless.<br />
(3) Comprises items in respect of: a tax case settlement (£800 million), tax relating to the disposal of China Mobile (£208 million), the SoftBank<br />
disposal (£1,409 million) and the court deposit made in respect of the India tax case (£356 million). The latter is included within the line item<br />
“Purchase of interests in subsidiaries and joint ventures, net of cash acquired” in the consolidated statement of cash flows.<br />
(4) The year ended 31 March <strong>2011</strong> includes net cash and cash equivalents paid of £183 million (2010: £1,777 million) and assumed debt of £nil<br />
(2010: £906 million).<br />
(5) The year ended 31 March 2010 includes £613 million in relation to Qatar.<br />
(6) The year ended 31 March <strong>2011</strong> includes £4,264 million in relation to the disposal of the Group’s 3.2% interest in China Mobile Limited.<br />
Free cash flow decreased by 2.7% to £7,049 million primarily due to higher taxation payments and dividends to noncontrolling<br />
shareholders in subsidiaries partially offset by improved cash generated from operations and lower<br />
payments for capital expenditure.<br />
Cash generated by operations increased by 0.4% to £15,392 million primarily driven by foreign exchange rate<br />
movements and working capital improvements. Cash capital expenditure decreased by £328 million primarily due to<br />
lower expenditure in India. The Group invested £2,982 million in licences and spectrum including £1,725 million in<br />
India and £1,210 million in Germany.<br />
Payments for taxation increased by 14.3% to £2,597 million primarily due to the absence of the one-time benefit of<br />
additional tax deductions which were available in Italy in the prior financial year.<br />
Dividends received from associates and investments were stable at £1,509 million.<br />
Net interest payments decreased by 5.5% to £1,328 million primarily due to lower average net debt.
LIQUIDITY AND CAPITAL RESOURCES<br />
An analysis of net debt is as follows:<br />
21<br />
<strong>2011</strong> 2010<br />
£m £m<br />
Cash and cash equivalents (1) 6,252 4,423<br />
Short-term borrowings<br />
Bonds (2,470) (1,<strong>17</strong>4)<br />
Commercial paper (2) (1,660) (2,563)<br />
Put options over non-controlling interests (3,113) (3,274)<br />
Bank loans (2,070) (3,460)<br />
Other short-term borrowings (1) (593) (692)<br />
(9,906) (11,163)<br />
Long-term borrowings<br />
Put options over non-controlling interests (78) (131)<br />
Bonds, loans and other long-term borrowings (28,297) (28,501)<br />
(28,375) (28,632)<br />
Other financial instruments (3) 2,<strong>17</strong>1 2,056<br />
Net debt (29,858) (33,316)<br />
Notes:<br />
(1) At 31 March <strong>2011</strong> the amount includes £531 million (2010: £604 million) in relation to cash received under collateral support agreements.<br />
(2) At 31 March <strong>2011</strong> US$551 million was drawn under the US commercial paper programme and €1,490 million was drawn under the euro<br />
commercial paper programme.<br />
(3) Comprises i) mark-to-market adjustments on derivative financial instruments which are included as a component of trade and other<br />
receivables (31 March <strong>2011</strong>: £2,045 million; 2010: £2,128 million) and trade and other payables (31 March <strong>2011</strong>: £548 million; 2010: £460<br />
million); and ii) short-term investments primarily in index linked government bonds included as a component of other investments (31 March<br />
<strong>2011</strong>: £674 million; 2010: £388 million).<br />
Net debt decreased by £3,458 million to £29,858 million primarily due to the sale of the Group’s interests in<br />
SoftBank and the element of the proceeds from the sale of the 3.2% interest in China Mobile Limited which was<br />
not committed to the share buyback programme. The £7,049 million free cash flow generated during the year was<br />
primarily used to fund £4,468 million of dividend payments to shareholders as well as spectrum purchases<br />
totalling £2,935 million in Germany and India.<br />
The following table sets out the Group’s undrawn committed bank facilities:<br />
31 March<br />
<strong>2011</strong><br />
Maturity £m<br />
US$4.2 billion committed revolving credit facility provided by 30 banks (1) March 2016 2,596<br />
€4.2 billion committed revolving credit facility provided by 31 banks (1) July 2015 3,666<br />
Other committed credit facilities Various 985<br />
Undrawn committed facilities 7,247<br />
Note:<br />
(1) Both facilities support US and euro commercial paper programmes of up to US$15 billion and £5 billion respectively.<br />
The Group’s £1,660 million of commercial paper maturing within one year is covered 4.3 times by the £7.2 billion of<br />
undrawn credit facilities. In addition, the Group has historically generated significant amounts of free cash flow<br />
which can be allocated to pay dividends, repay maturing borrowings and pay for discretionary spending. The Group<br />
currently expects to continue generating significant amounts of free cash flow.<br />
The Group has a €30 billion euro medium-term note (“EMTN”) programme and a US shelf programme which are used<br />
to meet medium to long-term funding requirements. At 31 March <strong>2011</strong> the total amounts in issue under these<br />
programmes split by currency were US$14.3 billion, £2.6 billion, €10.6 billion and £0.2 billion sterling equivalent of<br />
other currencies.
LIQUIDITY AND CAPITAL RESOURCES<br />
At 31 March <strong>2011</strong> the Group had bonds outstanding with a nominal value of £20,987 million (31 March 2010:<br />
£21,963 million). Details of bonds issued between 1 April 2010 and 30 September 2010 are included in the Group’s<br />
half-year financial report for the six months ended 30 September 2010. Between 1 October 2010 and 31 March<br />
<strong>2011</strong> the following bonds were issued:<br />
Date issued Maturity Currency<br />
22<br />
Amount<br />
million<br />
Sterling<br />
equivalent<br />
million<br />
US shelf programme or<br />
EMTN programme<br />
March <strong>2011</strong> March 2016 US$ 600 374 US shelf programme<br />
March <strong>2011</strong> March 2021 US$ 500 311 US shelf programme<br />
Dividends<br />
In <strong>May</strong> 2010 the directors issued a dividend per share growth target of at least 7% per annum for each of the financial<br />
years in the period ending 31 March 2013.<br />
Accordingly, the directors have announced a final dividend of 6.05 pence per share representing a 7.1% increase over<br />
last year’s final dividend. Total dividends for the year increased by 7.1% to 8.90 pence per share.<br />
The ex-dividend date for the final dividend is 1 June <strong>2011</strong> for ordinary shareholders, the record date is 3 June <strong>2011</strong><br />
and the dividend is payable on 5 August <strong>2011</strong>. Dividend payments on ordinary shares will be paid by direct credit into<br />
a nominated bank or building society account or, alternatively, into the Company’s dividend reinvestment plan. The<br />
Company no longer pays dividends by cheque. Ordinary shareholders who have not already done so should provide<br />
appropriate bank account details to us. Please refer to www.vodafone.com/investor for further information.<br />
Share buyback programme<br />
Following the disposal of the Group’s 3.2% interest in China Mobile Limited on 10 September 2010, the Group<br />
initiated a £2.8 billion share buyback programme under the authority granted by the shareholders at the 2010 AGM.<br />
In addition to ordinary market purchases the Group placed irrevocable purchase instructions with a number of banks<br />
to enable the banks to buy back shares on our behalf when we may otherwise have been prohibited from buying in<br />
the market.<br />
Details of the shares purchased to date, including those purchased under irrevocable instructions, are shown below:<br />
Date of share purchase<br />
Number of shares<br />
purchased (1)<br />
Average price paid<br />
per share inclusive<br />
of transaction<br />
costs<br />
Total number of<br />
shares purchased<br />
under publicly<br />
announced share<br />
buyback<br />
programme (2)<br />
Maximum value of<br />
shares that may<br />
yet be purchased<br />
under the<br />
programme (3)<br />
’000 Pence ’000 £m<br />
September 2010 115,400 161.78 115,400 2,613<br />
October 2010 187,500 165.50 302,900 2,303<br />
November 2010 209,400 <strong>17</strong>0.21 512,300 1,947<br />
December 2010 162,900 167.44 675,200 1,674<br />
January <strong>2011</strong> <strong>17</strong>7,090 <strong>17</strong>6.67 852,290 1,361<br />
February <strong>2011</strong> 134,700 <strong>17</strong>9.23 986,990 1,120<br />
March <strong>2011</strong> 250,900 <strong>17</strong>7.26 1,237,890 675<br />
April <strong>2011</strong> 135,100 <strong>17</strong>6.81 1,372,990 436<br />
<strong>May</strong> <strong>2011</strong> 127,000 <strong>17</strong>0.14 1,499,990 220<br />
Total 1,499,990 (4) <strong>17</strong>2.01 1,499,990 220<br />
Notes:<br />
(1) The nominal value of shares purchased is 11 3 /7 US cents each.<br />
(2) No shares were purchased outside the publicly announced share buyback programme.<br />
(3) In accordance with shareholder authority granted at the 2010 AGM.<br />
(4) The total number of shares purchased represents 2.9% of our issued share capital, excluding treasury shares, at 16 <strong>May</strong> <strong>2011</strong>.
LIQUIDITY AND CAPITAL RESOURCES<br />
On 3 April <strong>2011</strong> the Group announced an agreement to sell its entire 44% shareholding in SFR to Vivendi. The Group<br />
intends to return £4 billion of the net proceeds from the sale to shareholders by way of a share buyback programme.<br />
The share buyback will be carried out after the completion of the existing programme which is expected to be<br />
completed in June <strong>2011</strong>.<br />
Option agreements and similar arrangements<br />
The Group is party to a number of option agreements which could result in it being required to pay cash to maintain<br />
or increase its equity interests in its operations in India and the United States.<br />
On 30 March <strong>2011</strong> the Essar Group exercised its underwritten put option over 22.0% of <strong>Vodafone</strong> Essar Limited (‘VEL’)<br />
following which, on 31 March <strong>2011</strong>, the Group exercised its call option over the remaining 11.0% of VEL owned by<br />
the Essar Group. The total consideration due under these two options is US$5 billion (£3.1 billion).<br />
Details of other call and put option agreements, including those in relation to the United States, are available on<br />
page 44 of the Group’s annual report for the year ended 31 March 2010.<br />
OTHER SIGNIFICANT DEVELOPMENTS<br />
Indian tax case<br />
<strong>Vodafone</strong> Essar Limited (‘VEL’) and <strong>Vodafone</strong> International Holdings B.V. (‘VIHBV’) each received notices in August 2007<br />
and September 2007 respectively, from the Indian tax authority alleging potential liability in connection with alleged<br />
failure by VIHBV to deduct withholding tax from consideration paid to the Hutchison Telecommunications International<br />
Limited group (‘HTIL’) in respect of HTIL’s gain on its disposal to VIHBV of its interests in a wholly-owned subsidiary that<br />
indirectly holds interests in VEL. Following the receipt of such notices, VEL and VIHBV each filed writs seeking orders<br />
that their respective notices be quashed and that the tax authority take no further steps under the notices. Initial<br />
hearings were held before the Bombay High Court and in the case of VIHBV the High Court admitted the writ for final<br />
hearing in June 2008. In December 2008 the High Court dismissed VIHBV’s writ. VIHBV subsequently filed a special leave<br />
petition to the Supreme Court to appeal the High Court’s dismissal of the writ. On 23 January 2009 the Supreme Court<br />
referred the question of the tax authority’s jurisdiction to seek to pursue tax back to the tax authority for adjudication on<br />
the facts with permission granted to VIHBV to appeal that decision back to the High Court should VIHBV disagree with<br />
the tax authority’s findings. On 30 October 2009 VIHBV received a notice from the tax authority requiring VIHBV to show<br />
cause as to why it believed that the tax authority did not have competent jurisdiction to proceed against VIHBV for the<br />
default of non-deduction of withholding tax from consideration paid to HTIL. VIHBV provided a response on 29 January<br />
2010. On 31 <strong>May</strong> 2010, VIHBV received an order from the Indian tax authority confirming their view that they did have<br />
jurisdiction to proceed against VIHBV as well as a further notice alleging that VIHBV should be treated as the agent of<br />
HTIL for the purpose of recovering tax on the transaction. VIHBV appealed this ruling to the Bombay High Court. On 8<br />
September, 2010, the Bombay High Court ruled that the tax authority had jurisdiction to decide whether the transaction<br />
or some part of the transaction could be taxable in India. VIHBV appealed this decision to the Supreme Court on 14<br />
September 2010. A hearing before the Supreme Court took place on 27 September 2010 at which the Supreme Court<br />
noted the appeal and asked the tax authority to quantify any liability. On 22 October 2010 the Indian tax authority<br />
quantified the alleged tax liability and issued a demand for payment of INR 112.2 billion (£1.6 billion) of tax and interest.<br />
VIHBV has contested the amount of such demand both on the basis of the calculation and on the basis that no tax was<br />
due in any event. On 15 November 2010 VIHBV was asked to make a deposit with the Supreme Court of INR 25 billion<br />
(£356 million) and provide a guarantee for INR 85 billion (£1,188 million) pending final adjudication of the case,<br />
which request it duly complied with. The Supreme Court will now hear the appeal on the issue of jurisdiction as well as<br />
on the challenge to quantification on 19 July <strong>2011</strong>. On 23 March <strong>2011</strong> VIHBV received a notice requesting it to explain<br />
why it should not be liable for penalties of up to 100% of any tax found due, for alleged failure to withhold. On 15 April<br />
<strong>2011</strong> the Supreme Court, in response to an application made by VIHBV, allowed the Indian tax authority to continue its<br />
investigations into the application of penalties but stayed the Indian tax authorities from enforcing any liability until after<br />
the outcome of the Supreme Court hearing scheduled for 19 July <strong>2011</strong>. After investigations, on 29 April <strong>2011</strong>, the Indian<br />
tax authority raised an order alleging penalties were due, but noting that these will not be enforced in line with the<br />
Supreme Court stay. In addition the separate proceedings taken against VIHBV to seek to treat it as an agent of HTIL in<br />
respect of its alleged tax on the same transaction have been deferred until the outcome in the first matter is known.<br />
VEL’s case also continues to be stayed pending the outcome of the VIHBV Supreme Court hearing. VIHBV believes that<br />
neither it nor any other member of the Group is liable for such withholding tax, or is liable to be made an agent of HTIL;<br />
however, the outcome of the proceedings remains uncertain and such proceedings may or may not dispose of the<br />
matter in its entirety and there can be no assurance that any outcome will be favourable to VIHBV or the Group.<br />
23
OTHER SIGNIFICANT DEVELOPMENTS<br />
In light of the uncertainty created by the Indian tax authority's actions as set out above, VIHBV, through its indirect<br />
wholly owned subsidiary Euro Pacific Securities Ltd, has sought confirmation from the Authority for Advanced Rulings<br />
(‘AAR’) in India on whether withholding tax is due in respect of consideration payable on the acquisition of Essar Group’s<br />
(‘Essar’) offshore holding in VEL. A ruling from the AAR is expected by the end of <strong>May</strong> <strong>2011</strong>. The Group does not<br />
believe that there is any legal requirement to withhold tax in respect of these transactions but if, contrary to<br />
expectations, the AAR directs tax to be withheld, this amount is anticipated to be approximately an additional US$1.0<br />
billion.<br />
SFR<br />
On 3 April <strong>2011</strong> the Group announced an agreement to sell its entire 44% shareholding in Société Française du<br />
Radiotéléphone S.A. (‘SFR’) to Vivendi for a cash consideration of €7.75 billion (£6.8 billion). <strong>Vodafone</strong> will also receive a<br />
final dividend from SFR of €200 million (£<strong>17</strong>6 million) on completion of the transaction.<br />
Subject to customary competition authority and regulatory approvals, the transaction is expected to complete during<br />
the second calendar quarter of <strong>2011</strong>.<br />
At 31 March <strong>2011</strong> the SFR investment had a carrying value of €4.7 billion (£4.2 billion) and was reported within the Non-<br />
Controlled Interests and Common Functions segment.<br />
SoftBank<br />
On 9 November 2010 <strong>Vodafone</strong> agreed to sell to SoftBank Corp. of Japan its interests in loan notes issued by SoftBank<br />
Mobile Corp. and preferred stock and share acquisition rights issued by BB Mobile Corp. (both subsidiaries of SoftBank<br />
Corp.), which were originally received as part of the proceeds from the sale of <strong>Vodafone</strong> Japan in 2006, for a total<br />
consideration of ¥412.5 billion (£3.1 billion).<br />
The consideration is receivable in two tranches: ¥212.5 billion (£1.6 billion) was received in December 2010 and the<br />
remaining ¥200 billion (£1.5 billion) is expected to be received in April 2012.<br />
China Mobile<br />
On 10 September 2010 <strong>Vodafone</strong> sold its entire 3.2% interest in China Mobile Limited. The cash consideration was<br />
£4.3 billion before tax and transaction costs and resulted in a pre-tax gain of £3.0 billion which has been recorded in<br />
non-operating income and expense in the consolidated income statement.<br />
24
CONSOLIDATED FINANCIAL STATEMENTS<br />
Consolidated income statement<br />
25<br />
<strong>2011</strong> 2010<br />
£m £m<br />
Revenue 45,884 44,472<br />
Cost of sales (30,814) (29,439)<br />
Gross profit 15,070 15,033<br />
Selling and distribution expenses (3,067) (2,981)<br />
Administrative expenses (5,300) (5,328)<br />
Share of result in associates 5,059 4,742<br />
Impairment losses (6,150) (2,100)<br />
Other income and expense (16) 114<br />
Operating profit 5,596 9,480<br />
Non-operating income and expense 3,022 (10)<br />
Investment income 1,309 716<br />
Financing costs (429) (1,512)<br />
Profit before taxation 9,498 8,674<br />
Income tax expense (1,628) (56)<br />
Profit for the financial year 7,870 8,618<br />
Attributable to:<br />
– Equity shareholders 7,968 8,645<br />
– Non-controlling interests (98) (27)<br />
7,870 8,618<br />
Earnings per share<br />
– Basic 15.20p 16.44p<br />
– Diluted 15.11p 16.36p<br />
Consolidated statement of comprehensive income<br />
<strong>2011</strong> 2010<br />
£m £m<br />
Gains on revaluation of available-for-sale investments, net of tax 310 206<br />
Foreign exchange translation differences, net of tax (2,132) (1,021)<br />
Net actuarial gains/(losses) on defined benefit pension schemes, net of tax 136 (104)<br />
Revaluation gain – 860<br />
Foreign exchange gains transferred to the income statement (630) (84)<br />
Fair value (gains)/losses transferred to the income statement (2,192) 3<br />
Other, net of tax 19 67<br />
Other comprehensive loss (4,489) (73)<br />
Profit for the financial year 7,870 8,618<br />
Total comprehensive income for the year 3,381 8,545<br />
Attributable to:<br />
– Equity shareholders 3,567 8,312<br />
– Non-controlling interests (186) 233<br />
3,381 8,545
CONSOLIDATED FINANCIAL STATEMENTS<br />
Consolidated statement of financial position<br />
26<br />
<strong>2011</strong> 2010<br />
£m £m<br />
Non-current assets<br />
Goodwill 45,236 51,838<br />
Other intangible assets 23,322 22,420<br />
Property, plant and equipment 20,181 20,642<br />
Investments in associates 38,105 36,377<br />
Other investments 1,381 7,591<br />
Deferred tax assets 2,018 1,033<br />
Post employment benefits 97 34<br />
Trade and other receivables 3,877 2,831<br />
134,2<strong>17</strong> 142,766<br />
Current assets<br />
Inventory 537 433<br />
Taxation recoverable 281 191<br />
Trade and other receivables 9,259 8,784<br />
Other investments 674 388<br />
Cash and cash equivalents 6,252 4,423<br />
<strong>17</strong>,003 14,219<br />
Total assets 151,220 156,985<br />
Equity<br />
Called up share capital 4,082 4,153<br />
Additional paid-in capital 153,760 153,509<br />
Treasury shares (8,<strong>17</strong>1) (7,810)<br />
Retained losses (77,661) (79,655)<br />
Accumulated other comprehensive income 15,545 20,184<br />
Total equity shareholders’ funds 87,555 90,381<br />
Non-controlling interests 2,880 3,379<br />
Put options over non-controlling interests (2,874) (2,950)<br />
Total non-controlling interests 6 429<br />
Total equity 87,561 90,810<br />
Non-current liabilities<br />
Long-term borrowings 28,375 28,632<br />
Taxation liabilities 350 –<br />
Deferred tax liabilities 6,486 7,377<br />
Post employment benefits 87 237<br />
Provisions 482 497<br />
Trade and other payables 804 816<br />
36,584 37,559<br />
Current liabilities<br />
Short-term borrowings 9,906 11,163<br />
Taxation liabilities 1,912 2,874<br />
Provisions 559 497<br />
Trade and other payables 14,698 14,082<br />
27,075 28,616<br />
Total equity and liabilities 151,220 156,985
CONSOLIDATED FINANCIAL STATEMENTS<br />
Consolidated statement of changes in equity<br />
Additional<br />
Accumulated<br />
Equity<br />
Non-<br />
Share<br />
paid-in Treasury comprehensive shareholders’ controlling<br />
Total<br />
capital<br />
capital shares<br />
income<br />
funds interests equity<br />
£m £m £m £m £m £m £m<br />
1 April 2009 4,153 153,348 (8,036) (63,303) 86,162 (1,385) 84,777<br />
Issue or reissue of shares – – 189 (119) 70 – 70<br />
Share-based payment – 161 – – 161 – 161<br />
Acquisition of subsidiaries – – – (133) (133) 1,636 1,503<br />
Comprehensive income – – – 8,312 8,312 233 8,545<br />
Dividends – – – (4,131) (4,131) (56) (4,187)<br />
Other – – 37 (97) (60) 1 (59)<br />
31 March 2010 4,153 153,509 (7,810) (59,471) 90,381 429 90,810<br />
Issue or reissue of shares – – 232 (125) 107 – 107<br />
Redemption or cancellation of<br />
shares (71) 71 1,532 (1,532) – – –<br />
Purchase of own shares – – (2,125) – (2,125) – (2,125)<br />
Share-based payment – 180 – – 180 – 180<br />
Acquisition of subsidiaries – – – (120) (120) 35 (85)<br />
Comprehensive income – – – 3,567 3,567 (186) 3,381<br />
Dividends – – – (4,468) (4,468) (328) (4,796)<br />
Other – – – 33 33 56 89<br />
31 March <strong>2011</strong> 4,082 153,760 (8,<strong>17</strong>1) (62,116) 87,555 6 87,561<br />
27
CONSOLIDATED FINANCIAL STATEMENTS<br />
Consolidated statement of cash flows<br />
28<br />
<strong>2011</strong> 2010<br />
£m £m<br />
Net cash flow from operating activities 11,995 13,064<br />
Cash flows from investing activities<br />
Purchase of interests in subsidiaries and joint ventures, net of cash acquired (402) (1,777)<br />
Purchase of intangible assets (4,290) (2,134)<br />
Purchase of property, plant and equipment (4,350) (4,841)<br />
Purchase of investments (318) (522)<br />
Disposal of property, plant and equipment 51 48<br />
Disposal of investments 4,467 <strong>17</strong><br />
Dividends received from associates 1,424 1,436<br />
Dividends received from investments 85 141<br />
Interest received 1,659 195<br />
Taxation on investing activities (208) –<br />
Net cash flow from investing activities (1,882) (7,437)<br />
Cash flows from financing activities<br />
Issue of ordinary share capital and reissue of treasury shares 107 70<br />
Net movement in short-term borrowings (573) 227<br />
Proceeds from issue of long-term borrowings 4,861 4,2<strong>17</strong><br />
Repayment of borrowings (4,064) (5,184)<br />
Purchase of treasury shares (2,087) –<br />
Equity dividends paid (4,468) (4,139)<br />
Dividends paid to non-controlling shareholders in subsidiaries (320) (56)<br />
Contributions from non-controlling shareholders in subsidiaries – 613<br />
Other transactions with non-controlling shareholders in subsidiaries (137) –<br />
Interest paid (1,578) (1,601)<br />
Net cash flow from financing activities (8,259) (5,853)<br />
Net cash flow 1,854 (226)<br />
Cash and cash equivalents at beginning of the year 4,363 4,846<br />
Exchange loss on cash and cash equivalents (12) (257)<br />
Cash and cash equivalents at end of the financial year 6,205 4,363
CONSOLIDATED FINANCIAL STATEMENTS<br />
1. Basis of preparation<br />
The preliminary results for the year ended 31 March <strong>2011</strong> are an abridged statement of the full annual report which<br />
was approved by the Board of directors on <strong>17</strong> <strong>May</strong> <strong>2011</strong>. The consolidated financial statements within the full annual<br />
report are prepared in accordance with International Financial Reporting Standards (‘IFRS’) as issued by the<br />
International Accounting Standards Board. They are also prepared in accordance with IFRS adopted by the European<br />
Union (‘EU’), the Companies Act 2006 and Article 4 of the EU IAS Regulations.<br />
The auditor’s report on those consolidated financial statements was unqualified, did not draw attention to any<br />
matters by way of emphasis without qualifying their report, and did not contain statements under section 498(2) or<br />
498(3) of the Companies Act 2006. The preliminary results do not comprise statutory accounts within the meaning<br />
of section 434(3) of the Companies Act 2006. The annual report for the year ended 31 March <strong>2011</strong> will be delivered<br />
to the Registrar of Companies following the Company’s annual general meeting to be held on 26 July <strong>2011</strong>.<br />
The financial information included in this preliminary announcement does not itself contain sufficient information to<br />
comply with IFRS. The Company will publish full financial statements that comply with IFRS in June <strong>2011</strong>.<br />
The preparation of the preliminary results requires management to make estimates and assumptions that affect the<br />
reported amounts of assets and liabilities, disclosure of contingent assets and liabilities at the end of the reporting<br />
period and the reported amounts of revenue and expenses during the reporting period. Actual results could vary<br />
from these estimates. The estimates and underlying assumptions are reviewed on an ongoing basis. Revisions to<br />
accounting estimates are recognised in the period in which the estimate is revised if the revision affects only that<br />
period or in the period of the revision and future periods if the revision affects both current and future periods.<br />
IFRS 3 (Revised) - “Business Combinations”<br />
The Group adopted IFRS 3 (Revised) on 1 April 2010. The revised standard introduces a number of changes in the<br />
accounting for business combinations that impacts the amount of goodwill recognised, the reported results in the<br />
period in which a business combination occurs and future reported results. Whilst this standard does not have a<br />
material impact on the Group’s results or financial position for the periods presented, it may impact the Group’s<br />
accounting for any future business combinations.<br />
IAS 27 - “Consolidated and Separate Financial Statements”<br />
The Group adopted an amendment to IAS 27 “Consolidated and Separate Financial Statements” on 1 April 2010. This<br />
requires that when a transaction occurs with non-controlling interests in Group entities that do not result in a change<br />
in control, the difference between the consideration paid or received and the recorded non-controlling interest<br />
should be recognised in equity. Cash flows related to such transactions should be reported within financing activities<br />
in the statement of cash flows. In cases where control is lost, any retained interest should be remeasured to fair<br />
value, with the difference between fair value and the previous carrying value being recognised immediately in the<br />
income statement.<br />
The adoption of this standard has resulted in a change in presentation within the statement of cash flows of amounts<br />
paid to acquire non-controlling interests in Group entities that do not result in a change in control. In the year ended<br />
31 March <strong>2011</strong>, £137 million related to such transactions was classified as “Other transactions with non-controlling<br />
shareholders in subsidiaries” within “Net cash flows from financing activities”, whereas these amounts would have<br />
previously been recorded in “Purchase of interests in subsidiaries and joint ventures, net of cash acquired” within<br />
“Cash flows from investing activities”. There is no material impact in the comparative period.<br />
Change in segments<br />
During the year ended 31 March <strong>2011</strong> the Group changed its organisational structure to enable continued<br />
improvement in the delivery of the Group’s strategic goals. The Europe region now consists of all existing controlled<br />
businesses in Europe plus the Group’s interests in Czech Republic, Hungary, Romania and Turkey. The Africa, Middle<br />
East and Asia Pacific region includes the Group’s interests in Egypt, India, Ghana, Kenya, Qatar and Vodacom as well<br />
as Australia, New Zealand and Fiji. Non-Controlled Interests and Common Functions includes Verizon Wireless, SFR<br />
and Polkomtel as well as central Group functions. Both current year and comparative financial information has been<br />
restated to reflect the new organisational structure.<br />
29
CONSOLIDATED FINANCIAL STATEMENTS<br />
2. Equity dividends<br />
30<br />
<strong>2011</strong> 2010<br />
£m £m<br />
Declared during the financial year:<br />
Final dividend for the year ended 31 March 2010: 5.65 pence per share<br />
(2009: 5.20 pence per share) 2,976 2,731<br />
Interim dividend for the year ended 31 March <strong>2011</strong>: 2.85 pence per share<br />
(2010: 2.66 pence per share) 1,492 1,400<br />
4,468 4,131<br />
Proposed after the end of the reporting period and not recognised as a liability:<br />
Final dividend for the year ended 31 March <strong>2011</strong>: 6.05 pence per share<br />
(2010: 5.65 pence per share) 3,106 2,976
USE OF NON-GAAP FINANCIAL INFORMATION<br />
In the discussion of the Group’s reported financial position, operating results and cash flows, information is presented<br />
to provide readers with additional financial information that is regularly reviewed by management. However, this<br />
additional information presented is not uniformly defined by all companies including those in the Group’s industry.<br />
Accordingly, it may not be comparable with similarly titled measures and disclosures by other companies.<br />
Additionally, certain information presented is derived from amounts calculated in accordance with IFRS but is not<br />
itself an expressly permitted GAAP measure. Such non-GAAP measures should not be viewed in isolation or as an<br />
alternative to the equivalent GAAP measure.<br />
A summary of certain non-GAAP measures included in this results announcement, together with details of where<br />
additional information and reconciliation to the nearest equivalent GAAP measure can be found, is shown below.<br />
Non-GAAP measure Equivalent GAAP measure<br />
Location in this results<br />
announcement of reconciliation and<br />
further information<br />
EBITDA Operating profit Group results on page 9<br />
Adjusted operating profit Operating profit Group results on page 9<br />
Adjusted operating profit on<br />
guidance basis<br />
Operating profit Group results on page 9 and<br />
performance against <strong>2011</strong> financial<br />
year guidance on page 8<br />
Adjusted profit before tax Profit before taxation Taxation on page 11<br />
Adjusted effective tax rate Income tax expense as a percentage<br />
of profit before taxation<br />
Adjusted profit attributable to equity<br />
shareholders<br />
Profit attributable to equity<br />
shareholders<br />
31<br />
Taxation on page 11<br />
Earnings per share on page 12<br />
Operating free cash flow Cash generated by operations Cash flows and funding beginning on<br />
page 20<br />
Free cash flow Cash generated by operations Cash flows and funding beginning on<br />
page 20<br />
Free cash flow on guidance basis Cash generated by operations Cash flows and funding beginning on<br />
page 20 and performance against<br />
<strong>2011</strong> financial year guidance on<br />
page 8
ADDITIONAL INFORMATION<br />
Regional results (1)<br />
Adjusted operating<br />
Operating free<br />
Revenue EBITDA<br />
profit/(loss) Capital expenditure<br />
cash flow<br />
<strong>2011</strong> 2010 <strong>2011</strong> 2010 <strong>2011</strong> 2010 <strong>2011</strong> 2010 <strong>2011</strong> 2010<br />
£m £m £m £m £m £m £m £m £m £m<br />
Germany 7,900 8,008 2,952 3,122 1,548 1,695 824 766 2,297 2,355<br />
Italy 5,722 6,027 2,643 2,843 1,903 2,107 590 610 2,067 2,254<br />
Spain 5,133 5,713 1,562 1,956 915 1,310 5<strong>17</strong> 543 885 1,481<br />
UK 5,271 5,025 1,233 1,141 348 155 516 494 950 662<br />
Other Europe<br />
Greece 927 1,158 233 311 39 99 108 164 122 <strong>17</strong>7<br />
Netherlands 1,672 1,807 568 612 342 400 <strong>17</strong>3 162 435 498<br />
Portugal 1,101 1,227 455 506 282 329 150 169 332 365<br />
Romania 710 816 259 350 69 99 98 122 156 228<br />
Turkey 1,566 1,148 189 (8) (72) (198) 435 385 (138) (350)<br />
Other (2) 2,277 2,201 729 811 352 355 266 280 379 571<br />
8,253 8,357 2,433 2,582 1,012 1,084 1,230 1,282 1,286 1,489<br />
Intra-region eliminations (264) (297) – – – – – – – –<br />
Europe 32,015 32,833 10,823 11,644 5,726 6,351 3,677 3,695 7,485 8,241<br />
India 3,855 3,114 985 807 15 (37) 870 853 433 (7)<br />
Vodacom 5,479 4,450 1,844 1,528 827 520 572 520 1,339 1,092<br />
Other Africa, Middle East and Asia Pacific<br />
Egypt 1,329 1,351 607 673 360 430 292 228 409 488<br />
Other 2,642 2,<strong>17</strong>5 563 304 70 (95) 462 466 221 (10)<br />
3,971 3,526 1,<strong>17</strong>0 977 430 335 754 694 630 478<br />
Intra-region eliminations (1) (1) – – – – – – – –<br />
Africa, Middle East and Asia Pacific 13,304 11,089 3,999 3,312 1,272 818 2,196 2,067 2,402 1,563<br />
Non-Controlled Interests and Common<br />
Functions 659 667 (152) (221) 4,820 4,297 346 430 (102) (405)<br />
Inter-region eliminations (94) (1<strong>17</strong>) – – – – – – – –<br />
Group 45,884 44,472 14,670 14,735 11,818 11,466 6,219 6,192 9,785 9,399<br />
Notes:<br />
(1) The Group revised its segment structure on 1 October 2010. See “Change in segments” on page 29.<br />
(2) Includes elimination of £24 million (2010: £31 million) and £3 million (2010: £4 million) of intercompany revenue between operating companies within the Other Europe and Other Africa, Middle East and Asia Pacific<br />
segments respectively.<br />
See page 31 for “Use of non-GAAP financial information” and page 36 for “Definitions of terms”.<br />
32
ADDITIONAL INFORMATION<br />
Service revenue – quarter ended 31 March<br />
Group (1) Europe<br />
Africa, Middle East<br />
and Asia Pacific<br />
<strong>2011</strong> 2010 <strong>2011</strong> 2010 <strong>2011</strong> 2010<br />
£m £m £m £m £m £m<br />
Voice revenue 6,482 6,891 4,161 4,705 2,250 2,112<br />
Messaging revenue 1,281 1,221 1,036 1,002 229 211<br />
Data revenue 1,384 1,118 1,043 873 329 236<br />
Fixed line revenue 877 844 773 761 105 83<br />
Other service revenue 525 438 337 301 200 157<br />
Service revenue 10,549 10,512 7,350 7,642 3,113 2,799<br />
% change<br />
Group Europe<br />
Africa, Middle East<br />
and Asia Pacific<br />
Reported Organic Reported Organic Reported Organic<br />
Voice revenue (5.9) (3.9) (11.6) (8.5) 6.5 7.1<br />
Messaging revenue 4.9 6.8 3.4 6.4 8.5 4.9<br />
Data revenue 23.8 26.9 19.5 23.2 39.4 42.6<br />
Fixed line revenue 3.9 6.5 1.6 4.0 26.5 29.2<br />
Other service revenue 19.9 22.5 12.0 14.6 27.4 31.6<br />
Service revenue 0.4 2.5 (3.8) (0.8) 11.2 11.8<br />
Germany Italy Spain UK India Vodacom<br />
<strong>2011</strong> 2010 <strong>2011</strong> 2010 <strong>2011</strong> 2010 <strong>2011</strong> 2010 <strong>2011</strong> 2010 <strong>2011</strong> 2010<br />
£m £m £m £m £m £m £m £m £m £m £m £m<br />
Voice revenue 803 937 734 859 756 898 621 635 781 692 884 833<br />
Messaging revenue 200 193 212 216 79 90 296 274 45 35 71 71<br />
Data revenue 344 284 160 138 142 127 208 161 72 44 157 109<br />
Fixed line revenue 455 478 158 144 80 80 7 8 2 1 58 47<br />
Other service revenue 44 29 63 65 68 48 114 100 88 71 66 45<br />
Service revenue 1,846 1,921 1,327 1,422 1,125 1,243 1,246 1,<strong>17</strong>8 988 843 1,236 1,105<br />
% change<br />
Germany Italy Spain UK India Vodacom<br />
Reported Organic Reported Organic Reported Organic Reported Organic Reported Organic Reported Organic<br />
Service revenue (3.9) (0.2) (6.7) (3.0) (9.5) (5.9) 5.8 5.8 <strong>17</strong>.2 18.7 11.9 8.4<br />
Note:<br />
(1) The sum of the regional amounts may not be equal to Group totals due to Non-Controlled Interests and Common Functions and intercompany eliminations.<br />
33
ADDITIONAL INFORMATION<br />
Reconciliation of adjusted earnings<br />
Note Reported Adjustments Adjusted<br />
Year ended 31 March <strong>2011</strong> £m £m £m<br />
Operating profit 1 5,596 6,222 11,818<br />
Non-operating income and expense 2 3,022 (3,022) –<br />
Net investment income/(financing costs) 3 880 (1,695) (815)<br />
Profit before taxation 9,498 1,505 11,003<br />
Income tax expense 4 (1,628) (697) (2,325)<br />
Profit for the financial year 7,870 808 8,678<br />
Attributable to:<br />
– Equity shareholders 7,968 808 8,776<br />
– Non-controlling interests (98) – (98)<br />
Basic earnings per share 15.20p 16.75p<br />
Notes:<br />
(1) Adjustment primarily relates to the £6,150 million of goodwill impairment charges and the £56 million net loss arising on the disposal by<br />
Verizon Wireless of certain markets related to the Alltel acquisition.<br />
(2) Adjustment primarily consists of the gain arising from the disposal of the Group’s 3.2% interest in China Mobile Limited.<br />
(3) Includes a £268 million adjustment in relation to foreign exchange rate movements on certain intercompany balances and on financial<br />
instruments received as consideration in the disposal of <strong>Vodafone</strong> Japan to SoftBank which completed in April 2006, a £472 million gain<br />
arising from the disposal of these financial instruments to SoftBank in November 2010 and an £872 million release of interest accrual on<br />
the settlement of a tax case in July 2010.<br />
(4) Represents £215 million tax arising on the disposal of the Group’s 3.2% interest in China Mobile Limited and £<strong>17</strong> million relating to tax on<br />
the adjustments used to derive adjusted profit before tax offset by £929 million arising on the settlement of a tax case in July 2010.<br />
Note Reported Adjustments Adjusted<br />
Year ended 31 March 2010 £m £m £m<br />
Operating profit 1 9,480 1,986 11,466<br />
Non-operating income and expense (10) 10 –<br />
Net financing costs 2 (796) (106) (902)<br />
Profit before taxation 8,674 1,890 10,564<br />
Income tax expense 3 (56) (2,064) (2,120)<br />
Profit for the financial year 8,618 (<strong>17</strong>4) 8,444<br />
Attributable to:<br />
– Equity shareholders 8,645 (<strong>17</strong>4) 8,471<br />
– Non-controlling interests (27) – (27)<br />
Basic earnings per share 16.44p 16.11p<br />
Notes:<br />
(1) Adjustment consists of the impairment losses in relation to <strong>Vodafone</strong> India, the gain on disposal arising from the merger of <strong>Vodafone</strong><br />
Australia with Hutchison 3G Australia and the reversal of the licence impairment charge in relation to <strong>Vodafone</strong> Turkey.<br />
(2) Includes a £201 million adjustment in relation to interest on settlement of German tax claim partially offset by a £1 million adjustment in<br />
relation to foreign exchange rate movements on certain intercompany balances and on financial instruments received as consideration in<br />
the disposal of <strong>Vodafone</strong> Japan to SoftBank which completed in April 2006 and a £94 million adjustment in relation to equity put rights and<br />
similar arrangements.<br />
(3) Includes £2,103 million relating to the conclusion of the 2001 tax audit in respect of write down in Germany and a £39 million adjustment<br />
relating to tax on the adjustments used to derive adjusted profit before tax.<br />
34
ADDITIONAL INFORMATION<br />
Mobile customers (1)(2)<br />
(in thousands)<br />
Country<br />
1 January<br />
<strong>2011</strong><br />
Net<br />
additions<br />
35<br />
Other<br />
movements<br />
31 March<br />
<strong>2011</strong> Prepaid<br />
Europe<br />
Germany (3) 36,676 330 (300) 36,706 55.9%<br />
Italy 23,513 (93) – 23,420 84.6%<br />
Spain (3) <strong>17</strong>,484 143 (400) <strong>17</strong>,227 37.9%<br />
UK 19,<strong>17</strong>1 (26) – 19,145 49.6%<br />
96,844 354 (700) 96,498 60.2%<br />
Other Europe<br />
Albania 1,675 (57) – 1,618 93.5%<br />
Czech Republic 3,<strong>17</strong>4 20 – 3,194 45.6%<br />
Greece 4,135 (259) – 3,876 58.5%<br />
Hungary 2,686 (10) – 2,676 53.4%<br />
Ireland 2,2<strong>17</strong> (4) – 2,213 67.2%<br />
Malta 256 (8) – 248 83.0%<br />
Netherlands 4,936 99 – 5,035 38.2%<br />
Portugal 6,124 (64) – 6,060 80.9%<br />
Romania (3) 9,804 (388) (219) 9,197 63.1%<br />
Turkey 16,675 148 – 16,823 72.2%<br />
51,682 (523) (219) 50,940 65.0%<br />
Europe 148,526 (169) (919) 147,438 61.8%<br />
Africa, Middle East and Asia Pacific<br />
India (4) 124,255 10,315 – 134,570 95.3%<br />
Vodacom (5) 41,590 1,902 – 43,492 87.9%<br />
165,845 12,2<strong>17</strong> – <strong>17</strong>8,062 93.5%<br />
Other Africa, Middle East and Asia Pacific<br />
Australia 3,6<strong>17</strong> (9) – 3,608 43.0%<br />
Egypt 31,271 561 – 31,832 96.2%<br />
Fiji 297 – – 297 95.4%<br />
Ghana 2,780 260 – 3,040 99.3%<br />
New Zealand 2,465 19 – 2,484 68.0%<br />
Qatar 711 46 – 757 95.3%<br />
41,141 877 – 42,018 86.5%<br />
Africa, Middle East and Asia Pacific 206,986 13,094 – 220,080 92.0%<br />
Non-Controlled Interests and Common<br />
Functions<br />
Poland 3,351 15 – 3,366 47.7%<br />
Group 358,863 12,940 (919) 370,884 78.6%<br />
Reconciliation to proportionate<br />
Group 358,863 12,940 (919) 370,884 78.6%<br />
Non-controlling interests subsidiaries (74,512) (4,590) – (79,102) –<br />
Associates (6) 55,637 289 – 55,926 23.2%<br />
Proportionate (4) 339,988 8,639 (919) 347,708 65.1%<br />
Europe 148,520 (169) (919) 147,432 61.8%<br />
Africa, Middle East and Asia Pacific 139,461 8,396 – 147,857 92.6%<br />
Non-Controlled Interests and Common<br />
Functions 52,007 412 – 52,419 15.4%<br />
Notes:<br />
(1) The Group revised its segment structure on 1 October 2010. See “Change in segments” on page 29.<br />
(2) Group customers represent subsidiaries on a 100% basis and joint ventures (being Italy, Poland, Australia and Fiji) based on the Group’s equity<br />
interests. Proportionate customers are based on the Group’s equity interests in subsidiaries, joint ventures and associates. Further details of<br />
the Group’s equity interests are provided in notes 12 to 14 of the consolidated financial statements included within the Group’s annual report<br />
for the year ended 31 March 2010.<br />
(3) Other movements primarily relate to disconnections resulting from a review of inactive customers.<br />
(4) Proportionate customers are based on equity interests at 31 March <strong>2011</strong>. However, the calculation of proportionate customers for India also<br />
assumes the exercise of call options that could increase the Group’s aggregate direct and indirect equity interest from 59.9% to 67.0%. These<br />
call options can only be exercised in accordance with Indian law prevailing at the time of exercise.<br />
(5) Vodacom refers to the Group’s interests in Vodacom Group Limited and its subsidiaries, including those located outside of South Africa.<br />
(6) In the quarter ended 31 March <strong>2011</strong> Verizon Wireless customers were restated to reflect retail customers only, as reported externally by<br />
Verizon Wireless. All periods are presented on the revised basis.
ADDITIONAL INFORMATION<br />
Annualised mobile customer churn – quarter ended 31 March <strong>2011</strong><br />
Country Contract Prepaid Total<br />
Germany 14.1% 40.7% 29.1%<br />
Italy 22.9% 28.7% 27.8%<br />
Spain 25.4% 59.4% 38.5%<br />
UK 15.8% 59.1% 37.6%<br />
India 28.0% 52.1% 50.9%<br />
Vodacom (1) 9.5% 39.2% 35.6%<br />
Note:<br />
(1) Vodacom refers to the Group’s interests in Vodacom Group Limited and its subsidiaries, including those located outside of South Africa.<br />
OTHER INFORMATION<br />
1) Copies of this document are available from the Company’s registered office at <strong>Vodafone</strong> House, The<br />
Connection, Newbury, Berkshire, RG14 2FN.<br />
2) The preliminary results will be available on the <strong>Vodafone</strong> Group Plc website, www.vodafone.com/investor,<br />
from <strong>17</strong> <strong>May</strong> <strong>2011</strong>.<br />
For further information:<br />
<strong>Vodafone</strong> Group Plc<br />
Investor Relations Media Relations<br />
Telephone: +44 7919 990230 Telephone: +44 1635 664 444<br />
Notes:<br />
1. <strong>Vodafone</strong> and the <strong>Vodafone</strong> logo, Vodacom and <strong>Vodafone</strong> One Net are trademarks of the <strong>Vodafone</strong> Group.<br />
iPhone is a trademark of Apple Inc, registered in the United States and other countries. Other product and<br />
company names mentioned herein may be the trademarks of their respective owners.<br />
2. All growth rates reflect a comparison to the year ended 31 March 2010 unless otherwise stated.<br />
3. References to the “third quarter”, “previous quarter” or “Q3” are to the quarter ended 31 December 2010 unless<br />
otherwise stated.<br />
4. References to the “fourth quarter” or “Q4” are to the quarter ended 31 March <strong>2011</strong> unless otherwise stated.<br />
5. References to “H2” are to the six months ended 31 March <strong>2011</strong> unless otherwise stated.<br />
6. All amounts marked with an “(*)” represent organic growth which presents performance on a comparable basis,<br />
both in terms of merger and acquisition activity and foreign exchange rates. All relevant calculations of organic<br />
growth include Vodacom at the current level of ownership and exclude all results of the Group’s business in<br />
Australia.<br />
7. Reported growth is based on amounts in pounds sterling as determined under IFRS.<br />
8. Quarterly historical information including service revenue, customers, churn, voice usage and ARPU is provided in<br />
a spreadsheet available at www.vodafone.com/investor.<br />
Copyright © <strong>Vodafone</strong> Group <strong>2011</strong><br />
Definitions of terms<br />
Term Definition<br />
Proportionate mobile<br />
customers<br />
The proportionate mobile customer number represents the number of mobile<br />
customers in the Group’s subsidiaries, joint ventures and associates, based on the<br />
Group’s ownership in such ventures.<br />
CDMA CDMA means code division multiple access.<br />
DTT DTT means digital terrestrial television.<br />
For definitions of other terms please refer to page 141 of the Group’s annual report for the year ended 31 March<br />
2010.<br />
36
OTHER INFORMATION<br />
Forward-looking statements<br />
This document contains “forward-looking statements” within the meaning of the US Private Securities Litigation Reform<br />
Act of 1995 with respect to the Group’s financial condition, results of operations and businesses and certain of the Group’s<br />
plans and objectives.<br />
In particular, such forward-looking statements include, but are not limited to, statements with respect to expectations<br />
regarding the Group’s financial condition or results of operations contained within the Chief Executive’s statement on<br />
pages 3 to 6 of this document, including the Group’s 7% per annum dividend per share growth target, and within the<br />
guidance for adjusted operating profit and free cash flow for the 2012 financial year and the medium-term guidance for<br />
organic service revenue and free cash flow for the three financial years ending 31 March 2014 on pages 2 and 8 of this<br />
document; expectations of renewed growth in Europe and expectations for the Group’s future performance generally;<br />
expectations regarding the operating environment and market conditions and trends, including customer mix and usage,<br />
competitive pressures and price trends; intentions and expectations regarding the development and launch of products,<br />
services and technologies either introduced by <strong>Vodafone</strong> or by <strong>Vodafone</strong> in conjunction with third parties, including the<br />
<strong>Vodafone</strong> M-Pesa money transfer platform, or by third parties independently, including the emergence of tablet devices;<br />
anticipated benefits to the Group from cost reduction or efficiency programmes; growth in customers and usage; growth in<br />
mobile data, enterprise and broadband; expectations regarding adjusted operating profit, revenue, service revenue,<br />
capitalised fixed asset additions, EBITDA margins, depreciation and amortisation charges, capital expenditure, free cash<br />
flow, foreign exchange rates and tax rates, including the Group’s adjusted effective tax rate for the 2012 financial year;<br />
expectations regarding capital expenditures; expectations regarding the integration or performance of current and future<br />
investments, associates, joint ventures, non-controlled interests and newly acquired businesses, including <strong>Vodafone</strong><br />
Hutchison Australia and its integration with the 3 network; expectations regarding the Group’s share buyback programme<br />
and the outcome and impact of regulatory and legal proceedings involving <strong>Vodafone</strong> and of scheduled or potential<br />
regulatory changes.<br />
Forward-looking statements are sometimes, but not always, identified by their use of a date in the future or such words as<br />
“will”, “anticipates”, “aims”, “could”, “may”, “should”, “expects”, “believes”, “intends”, “plans” or “targets”. By their nature,<br />
forward-looking statements are inherently predictive, speculative and involve risk and uncertainty because they relate to<br />
events and depend on circumstances that will occur in the future. There are a number of factors that could cause actual<br />
results and developments to differ materially from those expressed or implied by these forward-looking statements. These<br />
factors include, but are not limited to, the following: changes in economic or political conditions in markets served by<br />
operations of the Group that would adversely affect the level of demand for mobile services; greater than anticipated<br />
competitive activity, from both existing competitors and new market entrants, which could require changes to the Group’s<br />
pricing models, lead to customer churn or make it more difficult to acquire new customers; the impact of investment in<br />
network capacity and the deployment of new technologies, or the rapid obsolescence of existing technology; higher than<br />
expected costs or capital expenditures; slower than expected customer growth and reduced customer retention; changes<br />
in the spending patterns of new and existing customers and the possibility that new products and services will not be<br />
commercially accepted or perform according to expectations; the Group’s ability to renew or obtain necessary licences; the<br />
Group’s ability to achieve cost savings; the Group’s ability to execute its strategy in mobile data, enterprise and broadband<br />
and in emerging markets; changes in foreign exchange rates or interest rates; the ability to realise benefits from entering<br />
into partnerships for developing data and internet services and entering into service franchising and brand licensing;<br />
unfavourable consequences of acquisitions or disposals; changes in the regulatory framework in which the Group operates,<br />
including possible action by regulators in markets in which the Group operates or by the EU to regulate rates the Group is<br />
permitted to charge; the impact of legal or other proceedings against the Group or other companies in the mobile<br />
telecommunications industry; loss of suppliers or disruption of supply chains; the Group’s ability to satisfy working capital<br />
and other requirements through access to bank facilities, funding in the capital markets and operations; changes in<br />
statutory tax rates or profit mix which might impact the weighted average tax rate; changes in tax legislation or final<br />
resolution of open tax issues which might impact the Group’s tax payments or effective tax rate; and changes in exchange<br />
rates, including, particularly, the exchange rate of sterling to the euro and the US dollar.<br />
Furthermore, a review of the reasons why actual results and developments may differ materially from the expectations<br />
disclosed or implied within forward-looking statements can be found under “Forward-looking statements” and “Principal<br />
risk factors and uncertainties” in <strong>Vodafone</strong> Group Plc’s 2010 annual report. The annual report can be found on the Group’s<br />
website, www.vodafone.com/investor. All subsequent written or oral forward-looking statements attributable to the<br />
Company or any member of the Group or any persons acting on their behalf are expressly qualified in their entirety by the<br />
factors referred to above. No assurances can be given that the forward-looking statements in this document will be<br />
realised. Subject to compliance with applicable law and regulations, <strong>Vodafone</strong> does not intend to update these forwardlooking<br />
statements and does not undertake any obligation to do so.<br />
37