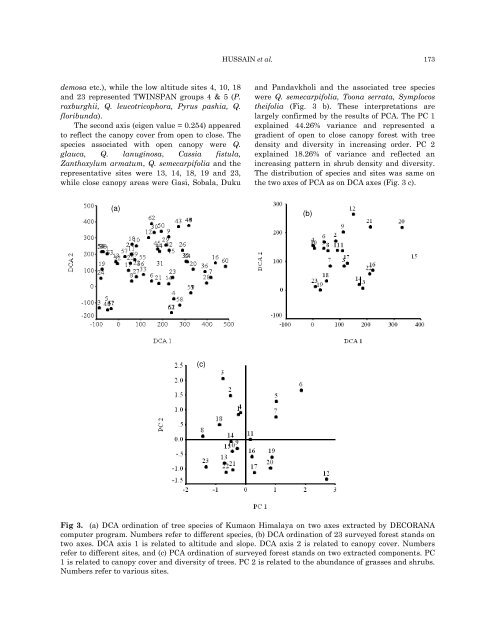
172 FOREST STRUCTURE IN KUMAON HIMALAYA Results Tree species classification N<strong>in</strong>eteen broad communities have been recognised <strong>in</strong> Kumaon. Overall, 63 tree, 56 shrub, 90 herb <strong>and</strong> 21 grass species were recorded <strong>in</strong> the 23 <strong>forest</strong> st<strong>and</strong>s. A total <strong>of</strong> five homogenous groups <strong>of</strong> tree species, <strong>in</strong> relation to the environmental variables, was identified through TWINSPAN analysis (Fig. 2). The left arm <strong>of</strong> the first dichotomy conta<strong>in</strong>ed 25 species, which was further divided <strong>in</strong>to two groups. First negative group consisted <strong>of</strong> four species which were characteristic <strong>of</strong> site 8 (for site code see Fig 1). Second positive group also consisted <strong>of</strong> two homogenous groups. The first group conta<strong>in</strong>ed Quercus semecarpifolia as a dom<strong>in</strong>ant species at sites 12, 13 <strong>and</strong> 17. The second group consisted <strong>of</strong> Abies p<strong>in</strong>drow <strong>and</strong> Taxus baccata as dom<strong>in</strong>ant species <strong>and</strong> represented mixed coniferous habitat. Further subdivisions did not provide any additional ecological <strong>in</strong>formation. The right arm <strong>of</strong> the first dichotomy had 38 tree species, which were further divided <strong>in</strong>to two groups. First negative group conta<strong>in</strong>ed 21 species. These tree species were ma<strong>in</strong>ly encountered at sites 2, 4, 5, 7, 18, 19 <strong>and</strong> 23. At site 2, Q. leucotricophora, P<strong>in</strong>us wallichiana <strong>and</strong> Cedrus deodara were the dom<strong>in</strong>ant tree species while at site 23 the dom<strong>in</strong>ant species was Q. lanug<strong>in</strong>osa (Table 2). Tree species ord<strong>in</strong>ation DCA ord<strong>in</strong>ation successfully h<strong>and</strong>led the variation <strong>in</strong> tree species communities from low to high altitude. All the sites <strong>and</strong> tree species showed mean<strong>in</strong>gful distribution on axis 1 <strong>and</strong> axis 2 <strong>of</strong> DCA (Fig. 3 a). The first axis (eigen value = 0.389) represents an altitude gradient (low to high). Sites 14, 15, 16, 20, 21, <strong>and</strong> 22 occupied extreme end <strong>of</strong> the first axis <strong>and</strong> represented TWINSPAN group 3 (A. p<strong>in</strong>drow, T. baccata, Betula utilis, Tsuga Table 2. Communities <strong>and</strong> their characteristic tree species with their codes (<strong>in</strong> parentheses used <strong>in</strong> DECORANA computer program) <strong>in</strong> Kumaon based on TWINSPAN classification. Comm. = Community. Groups Comm. Forest st<strong>and</strong> Tree species 1 1 BWS Acer caesium (20), Aesculus <strong>in</strong>dica (23), Swida sp.(42), Betula alnoides (44) 2 2 Daphiadura Gasi, Quercus semecarpifolia (4), Toona serrata (14), Dodecademia gr<strong>and</strong>iflora (37), Dhakuri Symplocos sp. (50) 3 3, 4, 5, 6 P<strong>in</strong>dari, Sobala, Duku Wachham, Sunderdunga, Munsiary 4 7, 8, 9, 10, 11, 12, 13 V<strong>in</strong>aiyak, Maheshkhan, Gager, Jill<strong>in</strong>g, Majtham, G<strong>and</strong>hura, Mechh 5 14, 15, 16, 17, 18, 19 Mukteshwer, Kilbery, P<strong>and</strong>avkholi, Sitlakhet, Jageshwer, Kunjakharak Abies p<strong>in</strong>drow (15), Jugulans regia (34), Prunus cerasoides (63), Betula utilis (28) Rhododendron barbatum (7), Taxus baccata (16), Tsuga demosa (35), Pyrus vestita (52), Zanthoxylum armatum (58), Ficus palmata (46), Morus serrata (47), Symplocos ch<strong>in</strong>ensis (51), Prunus cornuta (60), Debregeasia hypoleuca (59), Acer cappadocicum (53), Frax<strong>in</strong>us sp. (48), Dendroephthoe falcate (43) Cedrus deodara (17), Cupressus torulosa (25), Cassia fistula (62), Quercus lanug<strong>in</strong>ose (5), Engelhardia spicata (36), Ficus auriculata (41), Daphnephyllum himalense (38), Quercus glauca (3), P<strong>in</strong>us roxburghii (19), Myrica esculenta (24), Maytenus rufa (54), Benthamidia capitata (39), Phoenix humilis (61), Castanopsis tribuloides (40), Quercus leucotricophora (1), Pyrus pashia (13), P<strong>in</strong>us wallichiana (18), Euonymus t<strong>in</strong>gens (10), Swida oblonga (27), Macaranga pustulata (33), Picea smithiana (45) Litsea umbrosa (30), Populus ciliate (49), Persea duthiei (9), Rhododendron arboreum (6), Alnus nepalensis (21), Viburnum mullaha (22), Ilex dipyrena (26), Stranvissia nausea (57), Meliosma dillenaeafolia (29), Rhamnus triqueter (56), Quercus floribunda (2), Frax<strong>in</strong>us micrantha (32), Symplocos theifolia (12), L<strong>in</strong>dera pulcherrima (31), Lyonia ovalifolia (8), Euonymus pendulus (11), Viburnum coriacieum (55)
demosa etc.), while the low altitude sites 4, 10, 18 <strong>and</strong> 23 represented TWINSPAN groups 4 & 5 (P. roxburghii, Q. leucotricophora, Pyrus pashia, Q. floribunda). The second axis (eigen value = 0.254) appeared to reflect the canopy cover from open to close. The species associated with open canopy were Q. glauca, Q. lanug<strong>in</strong>osa, Cassia fistula, Zanthoxylum armatum, Q. semecarpifolia <strong>and</strong> the representative sites were 13, 14, 18, 19 <strong>and</strong> 23, while close canopy areas were Gasi, Sobala, Duku (a) (c) HUSSAIN et al. 173 <strong>and</strong> P<strong>and</strong>avkholi <strong>and</strong> the associated tree species were Q. semecarpifolia, Toona serrata, Symplocos theifolia (Fig. 3 b). These <strong>in</strong>terpretations are largely confirmed by the results <strong>of</strong> PCA. The PC 1 expla<strong>in</strong>ed 44.26% variance <strong>and</strong> represented a gradient <strong>of</strong> open to close canopy <strong>forest</strong> with tree density <strong>and</strong> diversity <strong>in</strong> <strong>in</strong>creas<strong>in</strong>g order. PC 2 expla<strong>in</strong>ed 18.26% <strong>of</strong> variance <strong>and</strong> reflected an <strong>in</strong>creas<strong>in</strong>g pattern <strong>in</strong> shrub density <strong>and</strong> diversity. The distribution <strong>of</strong> species <strong>and</strong> sites was same on the two axes <strong>of</strong> PCA as on DCA axes (Fig. 3 c). Fig 3. (a) DCA ord<strong>in</strong>ation <strong>of</strong> tree species <strong>of</strong> Kumaon Himalaya on two axes extracted by DECORANA computer program. Numbers refer to different species, (b) DCA ord<strong>in</strong>ation <strong>of</strong> 23 surveyed <strong>forest</strong> st<strong>and</strong>s on two axes. DCA axis 1 is related to altitude <strong>and</strong> slope. DCA axis 2 is related to canopy cover. Numbers refer to different sites, <strong>and</strong> (c) PCA ord<strong>in</strong>ation <strong>of</strong> surveyed <strong>forest</strong> st<strong>and</strong>s on two extracted components. PC 1 is related to canopy cover <strong>and</strong> diversity <strong>of</strong> trees. PC 2 is related to the abundance <strong>of</strong> grasses <strong>and</strong> shrubs. Numbers refer to various sites. (b)