PDF, about 5Mb - Teksid Aluminum
PDF, about 5Mb - Teksid Aluminum
PDF, about 5Mb - Teksid Aluminum

Create successful ePaper yourself
Turn your PDF publications into a flip-book with our unique Google optimized e-Paper software.
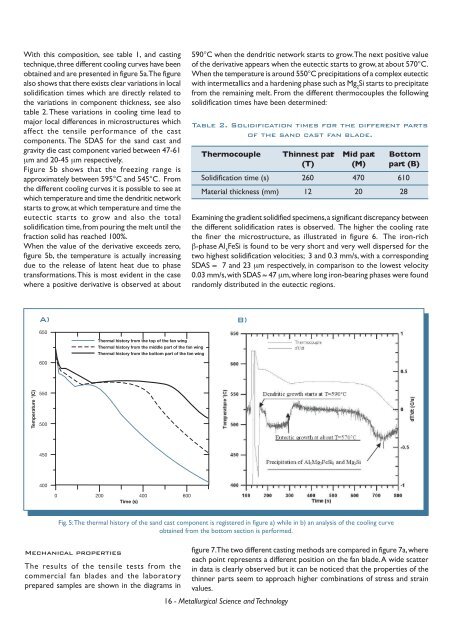
With this composition, see table 1, and casting<br />
technique, three different cooling curves have been<br />
obtained and are presented in figure 5a. The figure<br />
also shows that there exists clear variations in local<br />
solidification times which are directly related to<br />
the variations in component thickness, see also<br />
table 2. These variations in cooling time lead to<br />
major local differences in microstructures which<br />
affect the tensile performance of the cast<br />
components. The SDAS for the sand cast and<br />
gravity die cast component varied between 47-61<br />
µm and 20-45 µm respectively.<br />
Figure 5b shows that the freezing range is<br />
approximately between 595°C and 545°C. From<br />
the different cooling curves it is possible to see at<br />
which temperature and time the dendritic network<br />
starts to grow, at which temperature and time the<br />
eutectic starts to grow and also the total<br />
solidification time, from pouring the melt until the<br />
fraction solid has reached 100%.<br />
When the value of the derivative exceeds zero,<br />
figure 5b, the temperature is actually increasing<br />
due to the release of latent heat due to phase<br />
transformations. This is most evident in the case<br />
where a positive derivative is observed at <strong>about</strong><br />
<br />
A) B)<br />
<br />
<br />
<br />
<br />
<br />
<br />
<br />
<br />
<br />
<br />
<br />
<br />
Mechanical properties<br />
The results of the tensile tests from the<br />
commercial fan blades and the laboratory<br />
prepared samples are shown in the diagrams in<br />
590°C when the dendritic network starts to grow. The next positive value<br />
of the derivative appears when the eutectic starts to grow, at <strong>about</strong> 570°C.<br />
When the temperature is around 550°C precipitations of a complex eutectic<br />
with intermetallics and a hardening phase such as Mg 2 Si starts to precipitate<br />
from the remaining melt. From the different thermocouples the following<br />
solidification times have been determined:<br />
Table 2. Solidification times for the different parts<br />
of the sand cast fan blade.<br />
Thermocouple Thinnest part Mid part Bottom<br />
(T) (M) part (B)<br />
Solidification time (s) 260 470 610<br />
Material thickness (mm) 12 20 28<br />
Examining the gradient solidified specimens, a significant discrepancy between<br />
the different solidification rates is observed. The higher the cooling rate<br />
the finer the microstructure, as illustrated in figure 6. The iron-rich<br />
β-phase Al 5 FeSi is found to be very short and very well dispersed for the<br />
two highest solidification velocities; 3 and 0.3 mm/s, with a corresponding<br />
SDAS ≈ 7 and 23 µm respectively, in comparison to the lowest velocity<br />
0.03 mm/s, with SDAS ≈ 47 µm, where long iron-bearing phases were found<br />
randomly distributed in the eutectic regions.<br />
Fig. 5: The thermal history of the sand cast component is registered in figure a) while in b) an analysis of the cooling curve<br />
obtained from the bottom section is performed.<br />
figure 7. The two different casting methods are compared in figure 7a, where<br />
each point represents a different position on the fan blade. A wide scatter<br />
in data is clearly observed but it can be noticed that the properties of the<br />
thinner parts seem to approach higher combinations of stress and strain<br />
values.<br />
16 - Metallurgical Science and Technology