PDF, about 5Mb - Teksid Aluminum
PDF, about 5Mb - Teksid Aluminum
PDF, about 5Mb - Teksid Aluminum

Create successful ePaper yourself
Turn your PDF publications into a flip-book with our unique Google optimized e-Paper software.
In the case of the larger SDAS ~ 47 µm, it is<br />
therefore reasonable to assume that due the slow<br />
cooling conditions many air pockets formed within<br />
the liquid or due to interaction with oxide particles<br />
have been driven in front of the solidified front<br />
without being engulfed and in that case not been<br />
detected in the gradient solidified specimens due<br />
to the solidification mode. Another reason might<br />
be the longer time available for the hydrogen to<br />
diffuse and move in front of solid-liquid interface<br />
out of the sample into the surrounding<br />
environment.<br />
The scatter in the data is too great to derive any<br />
clear correlation between porosity level and the<br />
tensile strength and ultimate elongation, see figure<br />
11 a and b. According to literature, it is stated [2]<br />
that the static tensile properties such as ultimate<br />
tensile strength, yield strength and elongation to<br />
A) B)<br />
DISCUSSION<br />
Generally, the mechanical properties of metals are<br />
widely influenced by their microstructures. When<br />
defining the microstructure many parameters have<br />
to be taken into account, and these include among<br />
others the secondary dendrite arm spacing, the<br />
size and shape of precipitated phases such as silicon<br />
and iron-bearing phases, grain size, porosity, etc.<br />
In this investigation, many of the parameters<br />
mentioned above have been measured and<br />
correlated to the mechanical properties.<br />
Constituents that may have deleterious effect on<br />
the mechanical properties are defects such as<br />
oxide films or undesired phases and inclusions.<br />
A comparison of the results of the tensile testing<br />
with the casting method and the corresponding<br />
fracture, were all decreased with an increased degree of porosity. On the<br />
contrary, according to [3-7], the reduction in tensile properties has almost<br />
no correlation with the average volume fraction of porosity. In fact, the<br />
decrease in tensile properties was attributed to the length and/or the area<br />
fraction of defects in the fracture surface. Development of a high fraction<br />
of porosity may also be due to Fe in the melt. The long, needle-shaped iron<br />
intermetallic phase formed is expected to cause severe feeding difficulties<br />
during solidification. The morphology of the β-phase blocks the interdendritic<br />
flow channels, which is why it is proposed that higher iron contents in the<br />
alloy are associated with higher levels of porosity.<br />
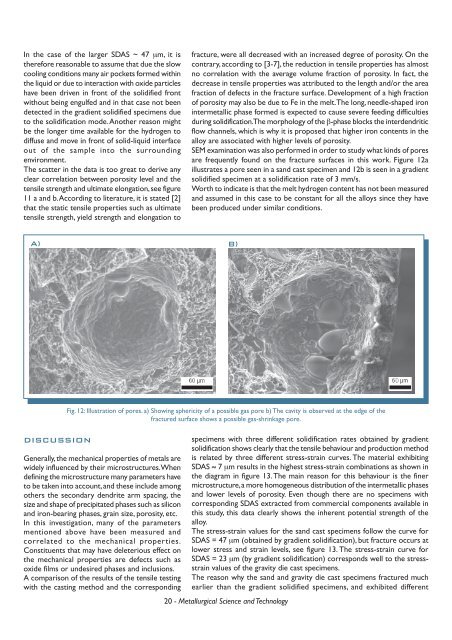
SEM examination was also performed in order to study what kinds of pores<br />
are frequently found on the fracture surfaces in this work. Figure 12a<br />
illustrates a pore seen in a sand cast specimen and 12b is seen in a gradient<br />
solidified specimen at a solidification rate of 3 mm/s.<br />
Worth to indicate is that the melt hydrogen content has not been measured<br />
and assumed in this case to be constant for all the alloys since they have<br />
been produced under similar conditions.<br />
Fig. 12: Illustration of pores. a) Showing sphericity of a possible gas pore b) The cavity is observed at the edge of the<br />
fractured surface shows a possible gas-shrinkage pore.<br />
specimens with three different solidification rates obtained by gradient<br />
solidification shows clearly that the tensile behaviour and production method<br />
is related by three different stress-strain curves. The material exhibiting<br />
SDAS ≈ 7 µm results in the highest stress-strain combinations as shown in<br />
the diagram in figure 13. The main reason for this behaviour is the finer<br />
microstructure, a more homogeneous distribution of the intermetallic phases<br />
and lower levels of porosity. Even though there are no specimens with<br />
corresponding SDAS extracted from commercial components available in<br />
this study, this data clearly shows the inherent potential strength of the<br />
alloy.<br />
The stress-strain values for the sand cast specimens follow the curve for<br />
SDAS = 47 µm (obtained by gradient solidification), but fracture occurs at<br />
lower stress and strain levels, see figure 13. The stress-strain curve for<br />
SDAS = 23 µm (by gradient solidification) corresponds well to the stressstrain<br />
values of the gravity die cast specimens.<br />
The reason why the sand and gravity die cast specimens fractured much<br />
earlier than the gradient solidified specimens, and exhibited different<br />
20 - Metallurgical Science and Technology