PDF, about 5Mb - Teksid Aluminum
PDF, about 5Mb - Teksid Aluminum
PDF, about 5Mb - Teksid Aluminum

You also want an ePaper? Increase the reach of your titles
YUMPU automatically turns print PDFs into web optimized ePapers that Google loves.
micrographs and were observed both inter- and<br />
intragranularly.<br />
The 2618 sample was characterized by very large<br />
grains slightly elongated in the flow direction. Their<br />
size in the transverse direction was of the order<br />
of 500 µm, as shown in figure 1c. As expected,<br />
considering the composition of the AA2618 alloy<br />
[1], several intragranular FeNiAl 9 particles were<br />
observed together with globular Al 2 Cu and (CuFe)<br />
Al 3 precipitates.<br />
The microstructure and hardness of the forgings<br />
were in all cases homogeneous in the regions<br />
where tension and toughness specimens were<br />
sampled.<br />
3.2 MECHANICAL BEHAVIOUR<br />
The average tensile properties in hoop direction<br />
of the investigated materials at room temperature<br />
and at 130°C are summarized in Table I. At room<br />
temperature, the 2014-A forging showed the<br />
highest tensile strength and the lowest ductility.<br />
The increase in test temperature from 20 to 130°C<br />
led to a significant reduction in the ultimate tensile<br />
strength (UTS) and 0,2% proof stress (YS) and to<br />
a corresponding significant increase in reduction<br />
of area (Z) and elongation (A) at fracture.<br />
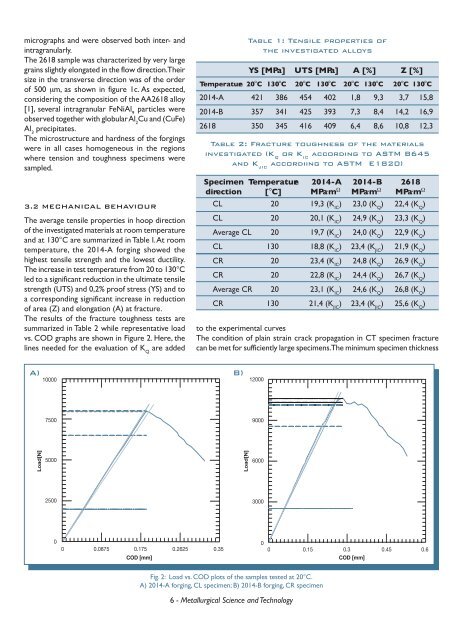
The results of the fracture toughness tests are<br />
summarized in Table 2 while representative load<br />
vs. COD graphs are shown in Figure 2. Here, the<br />
lines needed for the evaluation of K Q are added<br />
A) B)<br />
6 - Metallurgical Science and Technology<br />
Table 1: Tensile properties of<br />
the investigated alloys<br />
YS [MPa] UTS [MPa] A [%] Z [%]<br />
Temperature 20°C 130°C 20°C 130°C 20°C 130°C 20°C 130°C<br />
2014-A 421 386 454 402 1,8 9,3 3,7 15,8<br />
2014-B 357 341 425 393 7,3 8,4 14,2 16,9<br />
2618 350 345 416 409 6,4 8,6 10,8 12,3<br />
Table 2: Fracture toughness of the materials<br />
investigated (K Q or K IC according to ASTM B645<br />
and K JIC accordiing to ASTM E1820)<br />
Specimen Temperature 2014-A 2014-B 2618<br />
direction [°C] MPa . m Ω MPa . m Ω MPa . m Ω<br />
CL 20 19,3 (K IC ) 23,0 (K Q ) 22,4 (K Q )<br />
CL 20 20,1 (K IC ) 24,9 (K Q ) 23,3 (K Q )<br />
Average CL 20 19,7 (K IC ) 24,0 (K Q ) 22,9 (K Q )<br />
CL 130 18,8 (K IC ) 23,4 (K JIC ) 21,9 (K Q )<br />
CR 20 23,4 (K IC ) 24,8 (K Q ) 26,9 (K Q )<br />
CR 20 22,8 (K IC ) 24,4 (K Q ) 26,7 (K Q )<br />
Average CR 20 23,1 (K IC ) 24,6 (K Q ) 26,8 (K Q )<br />
CR 130 21,4 (K JIC ) 23,4 (K JIC ) 25,6 (K Q )<br />
to the experimental curves<br />
The condition of plain strain crack propagation in CT specimen fracture<br />
can be met for sufficiently large specimens. The minimum specimen thickness<br />
Fig. 2: Load vs. COD plots of the samples tested at 20°C.<br />
A) 2014-A forging, CL specimen; B) 2014-B forging, CR specimen