Chapter 3 - SA Urban Forest Biodiversity Program
Chapter 3 - SA Urban Forest Biodiversity Program
Chapter 3 - SA Urban Forest Biodiversity Program

Create successful ePaper yourself
Turn your PDF publications into a flip-book with our unique Google optimized e-Paper software.
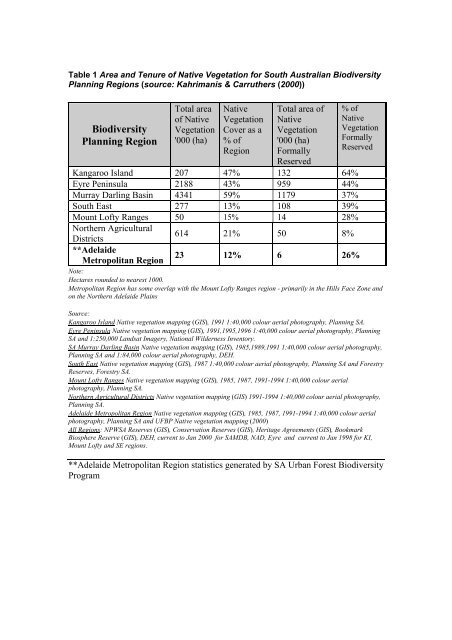
Table 1 Area and Tenure of Native Vegetation for South Australian <strong>Biodiversity</strong><br />
Planning Regions (source: Kahrimanis & Carruthers (2000))<br />
<strong>Biodiversity</strong><br />
Planning Region<br />
Total area<br />
of Native<br />
Vegetation<br />
'000 (ha)<br />
Native<br />
Vegetation<br />
Cover as a<br />
% of<br />
Region<br />
Total area of<br />
Native<br />
Vegetation<br />
'000 (ha)<br />
Formally<br />
Reserved<br />
% of<br />
Native<br />
Vegetation<br />
Formally<br />
Reserved<br />
Kangaroo Island 207 47% 132 64%<br />
Eyre Peninsula 2188 43% 959 44%<br />
Murray Darling Basin 4341 59% 1179 37%<br />
South East 277 13% 108 39%<br />
Mount Lofty Ranges 50 15% 14 28%<br />
Northern Agricultural<br />
Districts<br />
614 21% 50 8%<br />
**Adelaide<br />
Metropolitan Region<br />
23 12% 6 26%<br />
Note:<br />
Hectares rounded to nearest 1000.<br />
Metropolitan Region has some overlap with the Mount Lofty Ranges region - primarily in the Hills Face Zone and<br />
on the Northern Adelaide Plains<br />
Source:<br />
Kangaroo Island Native vegetation mapping (GIS), 1991 1:40,000 colour aerial photography, Planning <strong>SA</strong>.<br />
Eyre Peninsula Native vegetation mapping (GIS), 1991,1995,1996 1:40,000 colour aerial photography, Planning<br />
<strong>SA</strong> and 1:250,000 Landsat Imagery, National Wilderness Inventory.<br />
<strong>SA</strong> Murray Darling Basin Native vegetation mapping (GIS), 1985,1989,1991 1:40,000 colour aerial photography,<br />
Planning <strong>SA</strong> and 1:84,000 colour aerial photography, DEH.<br />
South East Native vegetation mapping (GIS), 1987 1:40,000 colour aerial photography, Planning <strong>SA</strong> and <strong>Forest</strong>ry<br />
Reserves, <strong>Forest</strong>ry <strong>SA</strong>.<br />
Mount Lofty Ranges Native vegetation mapping (GIS), 1985, 1987, 1991-1994 1:40,000 colour aerial<br />
photography, Planning <strong>SA</strong>.<br />
Northern Agricultural Districts Native vegetation mapping (GIS) 1991-1994 1:40,000 colour aerial photography,<br />
Planning <strong>SA</strong>.<br />
Adelaide Metropolitan Region Native vegetation mapping (GIS), 1985, 1987, 1991-1994 1:40,000 colour aerial<br />
photography, Planning <strong>SA</strong> and UFBP Native vegetation mapping (2000)<br />
All Regions: NPW<strong>SA</strong> Reserves (GIS), Conservation Reserves (GIS), Heritage Agreements (GIS), Bookmark<br />
Biosphere Reserve (GIS), DEH, current to Jan 2000 for <strong>SA</strong>MDB, NAD, Eyre and current to Jan 1998 for KI,<br />
Mount Lofty and SE regions.<br />
**Adelaide Metropolitan Region statistics generated by <strong>SA</strong> <strong>Urban</strong> <strong>Forest</strong> <strong>Biodiversity</strong><br />
<strong>Program</strong>