Chapter 3 - SA Urban Forest Biodiversity Program
Chapter 3 - SA Urban Forest Biodiversity Program
Chapter 3 - SA Urban Forest Biodiversity Program

You also want an ePaper? Increase the reach of your titles
YUMPU automatically turns print PDFs into web optimized ePapers that Google loves.
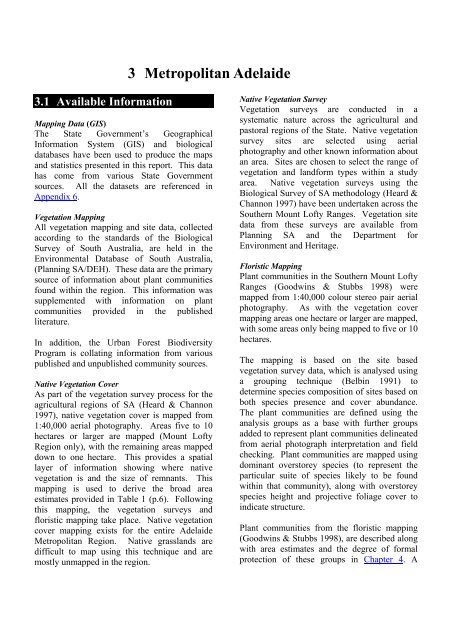
3.1 Available Information<br />
3 Metropolitan Adelaide<br />
Mapping Data (GIS)<br />
The State Government’s Geographical<br />
Information System (GIS) and biological<br />
databases have been used to produce the maps<br />
and statistics presented in this report. This data<br />
has come from various State Government<br />
sources. All the datasets are referenced in<br />
Appendix 6.<br />
Vegetation Mapping<br />
All vegetation mapping and site data, collected<br />
according to the standards of the Biological<br />
Survey of South Australia, are held in the<br />
Environmental Database of South Australia,<br />
(Planning <strong>SA</strong>/DEH). These data are the primary<br />
source of information about plant communities<br />
found within the region. This information was<br />
supplemented with information on plant<br />
communities provided in the published<br />
literature.<br />
In addition, the <strong>Urban</strong> <strong>Forest</strong> <strong>Biodiversity</strong><br />
<strong>Program</strong> is collating information from various<br />
published and unpublished community sources.<br />
Native Vegetation Cover<br />
As part of the vegetation survey process for the<br />
agricultural regions of <strong>SA</strong> (Heard & Channon<br />
1997), native vegetation cover is mapped from<br />
1:40,000 aerial photography. Areas five to 10<br />
hectares or larger are mapped (Mount Lofty<br />
Region only), with the remaining areas mapped<br />
down to one hectare. This provides a spatial<br />
layer of information showing where native<br />
vegetation is and the size of remnants. This<br />
mapping is used to derive the broad area<br />
estimates provided in Table 1 (p.6). Following<br />
this mapping, the vegetation surveys and<br />
floristic mapping take place. Native vegetation<br />
cover mapping exists for the entire Adelaide<br />
Metropolitan Region. Native grasslands are<br />
difficult to map using this technique and are<br />
mostly unmapped in the region.<br />
Native Vegetation Survey<br />
Vegetation surveys are conducted in a<br />
systematic nature across the agricultural and<br />
pastoral regions of the State. Native vegetation<br />
survey sites are selected using aerial<br />
photography and other known information about<br />
an area. Sites are chosen to select the range of<br />
vegetation and landform types within a study<br />
area. Native vegetation surveys using the<br />
Biological Survey of <strong>SA</strong> methodology (Heard &<br />
Channon 1997) have been undertaken across the<br />
Southern Mount Lofty Ranges. Vegetation site<br />
data from these surveys are available from<br />
Planning <strong>SA</strong> and the Department for<br />
Environment and Heritage.<br />
Floristic Mapping<br />
Plant communities in the Southern Mount Lofty<br />
Ranges (Goodwins & Stubbs 1998) were<br />
mapped from 1:40,000 colour stereo pair aerial<br />
photography. As with the vegetation cover<br />
mapping areas one hectare or larger are mapped,<br />
with some areas only being mapped to five or 10<br />
hectares.<br />
The mapping is based on the site based<br />
vegetation survey data, which is analysed using<br />
a grouping technique (Belbin 1991) to<br />
determine species composition of sites based on<br />
both species presence and cover abundance.<br />
The plant communities are defined using the<br />
analysis groups as a base with further groups<br />
added to represent plant communities delineated<br />
from aerial photograph interpretation and field<br />
checking. Plant communities are mapped using<br />
dominant overstorey species (to represent the<br />
particular suite of species likely to be found<br />
within that community), along with overstorey<br />
species height and projective foliage cover to<br />
indicate structure.<br />
Plant communities from the floristic mapping<br />
(Goodwins & Stubbs 1998), are described along<br />
with area estimates and the degree of formal<br />
protection of these groups in <strong>Chapter</strong> 4. A
description of the <strong>SA</strong> vegetation structural<br />
formation definitions is found in Appendix 7.<br />
Planning <strong>SA</strong> is currently re-mapping the<br />
remnant vegetation within the Adelaide region.<br />
It is expected that this exercise will consolidate<br />
the accuracy of previously collected information<br />
pertaining to remnant vegetation in the Adelaide<br />
region. A further assessment of vegetation<br />
condition for each discrete association would<br />
contribute immensely to a clearer picture of<br />
where we are now and what we need to do in the<br />
future.<br />
Both regional and standard 1:50,000 tile based<br />
maps of the floristic mapping are readily<br />
available from Planning <strong>SA</strong> on request.<br />
Floristic mapping for some of the larger<br />
NPW<strong>SA</strong> Reserves exists in GIS format.<br />
In the Southern Mount Lofty Ranges region,<br />
much of the native grassland has not been<br />
included in this GIS floristic mapping.<br />
Roadside Vegetation<br />
Roadside vegetation has been difficult to map in<br />
a standard way due to the difficulty of using<br />
conventional aerial photography techniques for<br />
mapping narrow linear strips of vegetation. As<br />
a result, prior to the last two years, very little<br />
roadside vegetation mapping was available in<br />
GIS format for the Metropolitan Adelaide<br />
Region.<br />
Lack of adequate mapping of native roadside<br />
vegetation and its condition has hampered<br />
efforts to regionally manage such vegetation<br />
effectively.<br />
A methodology to rapidly assess and map<br />
roadside native vegetation has been developed<br />
by the State Government to survey vegetation<br />
on roads managed by Local Government and<br />
Transport <strong>SA</strong> (Stokes et al. 1998). The<br />
methodology provides for GIS mapping of<br />
roadside vegetation and assists in the<br />
development of appropriate management<br />
guidelines to be determined as a result. A<br />
number of roads in the Adelaide Metropolitan<br />
Region have been surveyed using the<br />
methodology (see Appendix 5). For details<br />
contact the Geographical Analysis and Research<br />
Unit or the Environmental Unit, Transport <strong>SA</strong>.<br />
Interim roadside vegetation survey manuals are<br />
available from Planning <strong>SA</strong>.<br />
Pre-European Vegetation Mapping<br />
Broad mapping (1:250,000) currently exists for<br />
the Adelaide Plains (Kraehenbuehl 1996). This<br />
mapping provides an indication of broad plant<br />
communities of the area and their distribution<br />
before clearance. This mapping provides a<br />
valuable tool for revegetation projects that aim<br />
to try and restore some of the original plants and<br />
plant communities of the region. This map is<br />
readily available from Planning <strong>SA</strong> and the<br />
<strong>Urban</strong> <strong>Forest</strong> <strong>Biodiversity</strong> <strong>Program</strong>.<br />
The Pre-European settlement plant communities<br />
for the southern Adelaide region are currently<br />
being mapped. The use of Pre-European<br />
settlement vegetation maps within a biodiversity<br />
planning context is extremely useful. Extending<br />
this exercise into the Hills Face Zone and<br />
beyond would provide valuable information.<br />
3.2 Study Area<br />
The Adelaide region has been described as<br />
having probably the richest source of<br />
biodiversity in the state before European<br />
settlement (Possingham pers. comm.). This high<br />
biodiversity is a consequence of a high rainfall<br />
gradient between the Gulf and the Mount Lofty<br />
Ranges (see Map 1 Appendix 4) and because the<br />
region has both coastal and interior elements.<br />
Such uniqueness and diversity is underscored by<br />
the fact that the Adelaide region supports<br />
several animal species at their northern and<br />
western limits of distribution (Tyler et al. 1976).<br />
As a consequence of this habitat variety, the<br />
Adelaide region supported significant<br />
percentages of the State’s terrestrial plants<br />
(30%), birds (58%), terrestrial mammals (32%),<br />
reptiles (20%) frogs (22%) and freshwater fishes<br />
(20%) in an area that is only 0.15% of the total<br />
land area of the State.
While it is unrealistic to aim at restoring all of<br />
the lost species, (indeed some are now totally<br />
extinct, not just in the Adelaide Metropolitan<br />
Area) we can aim to halt the current loss of<br />
habitat and therefore species, and to rehabilitate<br />
or even restore many areas.<br />
The clearing of vegetation in the Adelaide<br />
region commenced with the arrival of the first<br />
European settlers. This was largely motivated<br />
by the desire to create suitable grasslands for the<br />
grazing of stock; to utilise timber for housing,<br />
fencing and firewood; and to clear areas for the<br />
construction of dwellings and infrastructure<br />
such as roads. The early settlers soon<br />
recognised the soil types and vegetation<br />
assemblages that provided the most productive<br />
areas for stock grazing. Consequently, many<br />
vegetation assemblages that were seen to be<br />
non-productive remained well conserved until<br />
only recent times. Kraehenbuehl (1996)<br />
indicates that the ‘Black <strong>Forest</strong>’ (Eucalyptus<br />
59%<br />
1%<br />
Figure<br />
1 Relative landcover estimates for<br />
Adelaide Metropolitan Area<br />
3.3 Boundaries<br />
The boundaries of metropolitan Adelaide have been<br />
defined differently by different authors and<br />
organisations. This document has used the<br />
12%<br />
microcarpa Woodland) at Goodwood was<br />
recognised early in Adelaide’s European history<br />
as prime grazing land, and therefore the Black<br />
<strong>Forest</strong> was almost totally cleared by 1880.<br />
Areas to the North and West of the city<br />
(reedbeds, samphire, and coastal dunes)<br />
remained largely uncleared until as late as 1950.<br />
These areas were rapidly urbanised following<br />
the<br />
boom period after World War II.<br />
The estimated area of metropolitan<br />
Adelaide is<br />
about 185,000 hectares.<br />
Figure 1 (p.3) shows that the metropolitan area<br />
comprises a variety of different landuses. Land<br />
owners are presented with unique challenges<br />
when faced with managing remnant vegetation<br />
surrounded<br />
by a variety of contrasting landuses.<br />
28%<br />
Remnant Vegetation<br />
Built-up/ <strong>Urban</strong> Area<br />
Primary Production<br />
Other Land uses<br />
Source:<br />
GIS mapping (1985, 1987, 1991-1994 colour aerial<br />
photography landcover mapping)<br />
boundaries of the metropolitan area as defined in the<br />
Development Act 1993. (see Appendix 4).
Administrative Boundaries<br />
The Adelaide Metropolitan Area includes 20<br />
Local Government Areas (see Appendix 4). It<br />
completely encompasses 18 of these and<br />
includes the western third of the Adelaide Hills<br />
Council. The Adelaide Metropolitan Area also<br />
includes<br />
a small portion (166ha) of the District<br />
Council of Kapunda Light, north of the Gawler<br />
River and east of Main North Road.<br />
The Adelaide Metropolitan Area covers part of<br />
three Soil Conservation Board Districts and<br />
directly adjoins one other (see Appendix 4).<br />
Biological boundaries<br />
In the interests of planning for the National<br />
Reserves<br />
System, the Interim Biogeographic<br />
Regionalisation for Australia (IBRA) has<br />
recently divided Australia into 80 discrete<br />
biological regions (Thackway & Cresswell<br />
1995).<br />
Metropolitan Adelaide falls into parts of<br />
two IBRA regions, The Mount<br />
Lofty Block and<br />
the Eyre/Yorke Block (see Appendix 4). The<br />
Mount Lofty Block extends from the<br />
Quorn/Crystal Brook region in a narrow band<br />
along both sides of the ranges south to the tip of<br />
the Fleurieu Peninsula and includes Kangaroo<br />
Island. The Eyre/Yorke Block includes Eyre<br />
and Yorke Peninsula, but also extends down the<br />
northern Adelaide Plains in a south westerly<br />
direction from Gawler to the suburb of Cavan.<br />
All land south of this line is included in the<br />
Mount Lofty Block. The Eyre/Yorke Block<br />
should really extend further south on the<br />
Adelaide Plains to approximately Aldinga, as<br />
this region is biologically more like the<br />
Eyre/Yorke Block than the Mount Lofty Block.<br />
It is expected that this inaccuracy will be<br />
addressed following a comprehensive review of<br />
IBRA (Tim Bond pers. comm.).<br />
While it is preferred that biodiversity plans be<br />
prepared and implemented according to<br />
biogeographic regions, it is considered that the<br />
metropolitan area has unique issues that require<br />
addressing at this social/administrative level.<br />
3.4 Physical Description<br />
Climate<br />
Metropolitan Adelaide has a mediterranean<br />
climate, consisting of long hot summers<br />
and<br />
cool wet winters. Yet across the region,<br />
there is<br />
significant variation in both temperature and<br />
rainfall, with a general trend of increasing<br />
rainfall from west to east (see Appendix 4).<br />
This variation is largely a result of variation in<br />
topography. Areas adjacent to Mount Lofty<br />
receive the highest average annual rainfall, with<br />
Stirling receiving an average of 1189mm of rain<br />
per annum. Areas to the north and west receive<br />
the lowest average annual rainfall; Edinburgh on<br />
the northern Adelaide Plains receives, on<br />
average, 440mm of rain each year.<br />
3.5 Native Vegetation Tenure<br />
Since European settlement, approximately 88% of<br />
native vegetation has been cleared, originally for<br />
agriculture,<br />
but increasingly for residential<br />
development (see fold out map). The remaining<br />
12% (23,047ha) is largely concentrated in the Hills<br />
Face Zone. Indeed, 33% (7699ha) of metropolitan<br />
Adelaide’s remnant vegetation is found in the Hills<br />
Face Zone. The bulk of this is found in the central<br />
Hills Face Zone between Anstey Hill Conservation<br />
Park and Belair National Park. This region,<br />
representing 5% of the total metropolitan area,<br />
supports 25% of the total remnant vegetation. The<br />
southern and northern Hills Face Zone contains<br />
comparatively little remnant vegetation.<br />
Outside of the Hills Face Zone, much of the<br />
remaining remnant vegetation is found in the<br />
coastal<br />
(2117ha).<br />
mangrove/samphire communities<br />
Approximately 26% (6027ha) of Adelaide’s<br />
remnant vegetation is found in NPW<strong>SA</strong> reserves<br />
52%<br />
(12014ha)<br />
1%<br />
(210ha)<br />
2%<br />
(477ha)<br />
Commonw ealth<br />
Local<br />
State (non-NPW<strong>SA</strong>)<br />
NPW<strong>SA</strong> & Heritage Agreements<br />
Private<br />
19%<br />
(4319ha)<br />
26%<br />
(6027ha)
or is afforded similar protection as a heritage<br />
agreement.<br />
With another 22% on land under<br />
government ownership, most of which is owned<br />
by the state government (primarily <strong>SA</strong> Water<br />
and <strong>Forest</strong>ry <strong>SA</strong>). More than half of Adelaide’s<br />
remaining native vegetation is held in private<br />
ownership (see Figure 2).<br />
Figure 2 Land Tenure of Remnant Vegetation<br />
in Adelaide Metropolitan area<br />
An<br />
analysis of the Adelaide Plains only, reveals<br />
even less remnant vegetation. Approximately<br />
2.8% (2826ha) of the Adelaide<br />
Plains consists<br />
of<br />
remnant vegetation. The mangrove/samphire<br />
community along the coast makes up almost<br />
75% of this amount (2117ha). Therefore, not<br />
including the mangroves and samphire<br />
communities, 0.7 percent of the Adelaide Plains<br />
is considered remnant vegetation.<br />
Comparisons with other Planning<br />
Regions<br />
Table 1 is a comparison of the area<br />
of native<br />
vegetation<br />
for different planning regions in the<br />
State.<br />
As might be expected in an urban area, the<br />
Adelaide region is depauperate in remnant<br />
vegetation<br />
when compared with other nearby<br />
regions.<br />
As a percentage of the total region the<br />
Adelaide metropolitan area has only 12% native<br />
vegetation. Similar figures are obtained when<br />
comparing the total native vegetation reserved<br />
in NPW<strong>SA</strong> areas.
Table 1 Area and Tenure of Native Vegetation for South Australian <strong>Biodiversity</strong><br />
Planning Regions (source: Kahrimanis & Carruthers (2000))<br />
<strong>Biodiversity</strong><br />
Planning Region<br />
Total area<br />
of Native<br />
Vegetation<br />
'000 (ha)<br />
Native<br />
Vegetation<br />
Cover as a<br />
% of<br />
Region<br />
Total area of<br />
Native<br />
Vegetation<br />
'000 (ha)<br />
Formally<br />
Reserved<br />
% of<br />
Native<br />
Vegetation<br />
Formally<br />
Reserved<br />
Kangaroo Island 207 47% 132 64%<br />
Eyre Peninsula 2188 43% 959 44%<br />
Murray Darling Basin 4341 59% 1179 37%<br />
South East 277 13% 108 39%<br />
Mount Lofty Ranges 50 15% 14 28%<br />
Northern Agricultural<br />
Districts<br />
614 21% 50 8%<br />
**Adelaide<br />
Metropolitan Region<br />
23 12% 6 26%<br />
Note:<br />
Hectares rounded to nearest 1000.<br />
Metropolitan Region has some overlap with the Mount Lofty Ranges region - primarily in the Hills Face Zone and<br />
on the Northern Adelaide Plains<br />
Source:<br />
Kangaroo Island Native vegetation mapping (GIS), 1991 1:40,000 colour aerial photography, Planning <strong>SA</strong>.<br />
Eyre Peninsula Native vegetation mapping (GIS), 1991,1995,1996 1:40,000 colour aerial photography, Planning<br />
<strong>SA</strong> and 1:250,000 Landsat Imagery, National Wilderness Inventory.<br />
<strong>SA</strong> Murray Darling Basin Native vegetation mapping (GIS), 1985,1989,1991 1:40,000 colour aerial photography,<br />
Planning <strong>SA</strong> and 1:84,000 colour aerial photography, DEH.<br />
South East Native vegetation mapping (GIS), 1987 1:40,000 colour aerial photography, Planning <strong>SA</strong> and <strong>Forest</strong>ry<br />
Reserves, <strong>Forest</strong>ry <strong>SA</strong>.<br />
Mount Lofty Ranges Native vegetation mapping (GIS), 1985, 1987, 1991-1994 1:40,000 colour aerial<br />
photography, Planning <strong>SA</strong>.<br />
Northern Agricultural Districts Native vegetation mapping (GIS) 1991-1994 1:40,000 colour aerial photography,<br />
Planning <strong>SA</strong>.<br />
Adelaide Metropolitan Region Native vegetation mapping (GIS), 1985, 1987, 1991-1994 1:40,000 colour aerial<br />
photography, Planning <strong>SA</strong> and UFBP Native vegetation mapping (2000)<br />
All Regions: NPW<strong>SA</strong> Reserves (GIS), Conservation Reserves (GIS), Heritage Agreements (GIS), Bookmark<br />
Biosphere Reserve (GIS), DEH, current to Jan 2000 for <strong>SA</strong>MDB, NAD, Eyre and current to Jan 1998 for KI,<br />
Mount Lofty and SE regions.<br />
**Adelaide Metropolitan Region statistics generated by <strong>SA</strong> <strong>Urban</strong> <strong>Forest</strong> <strong>Biodiversity</strong><br />
<strong>Program</strong>