4 - Hanford Site
4 - Hanford Site
4 - Hanford Site

Create successful ePaper yourself
Turn your PDF publications into a flip-book with our unique Google optimized e-Paper software.
AR TARGET SHEET<br />
The following document was.too large to scan as one<br />
unit, therefore it has been broken down into sections.<br />
DOCUMENT # -- -IDO C / l?- L -F<br />
EDMC # i 3^ 15 39<br />
SECTION Z . ,.OF-
THIS IMAGE INTENTIONALLY<br />
LEFT BLANK
s^.<br />
DOE/RL 88-41<br />
Revision 1<br />
APPENDIX D-1<br />
WELL CONSTRUCTION DIAGRAMS<br />
APP Dl—i
Cy<br />
n<br />
DOE/RL 88-41<br />
Revision 1<br />
1<br />
2<br />
3<br />
4<br />
5 This page intentionally left blank.<br />
APP D1-ii
M<br />
LL<br />
0<br />
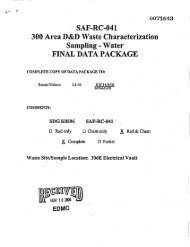
Construction Diagram<br />
• n. Protective Lockable<br />
Casing<br />
Cap<br />
Pad<br />
,X , „Guard Posts<br />
4• inch Stainless<br />
Steel Casing<br />
DOE/RL 88-41<br />
Revision 1<br />
Lithologic Diagram<br />
100 Silty Sand to<br />
Gravelly Sand<br />
120<br />
140<br />
160 —<br />
180 —<br />
260<br />
220<br />
Silty Sandy Gravel<br />
320 [<br />
340 8• in. Telescoping ,<br />
10-Slot Stainless<br />
Steel Screen<br />
44n., 20-Slot<br />
Stainless Steel<br />
Screen<br />
L^ r^ Slightly Silty Gravelly Sand<br />
Sandy Gravel<br />
"—'-Siltv<br />
—!Z— Water Level Sentonite Pallets Sand<br />
Cement Grout<br />
Granular Sernonite<br />
Silica Sand<br />
Gravel<br />
Well 299-E18-1<br />
APP DI-1<br />
silt<br />
% moisture<br />
% CaCO3<br />
0102030 0246810 0<br />
It —<br />
20<br />
— 40<br />
60<br />
80<br />
100<br />
120<br />
140<br />
160<br />
f8o<br />
O<br />
200 0<br />
3:<br />
220<br />
240<br />
280<br />
300<br />
320<br />
340
w<br />
-Y<br />
0<br />
Con<br />
20 Pad<br />
40<br />
60<br />
80<br />
100<br />
120<br />
i 140<br />
N<br />
g 160<br />
e<br />
G<br />
180 —<br />
a<br />
m<br />
m 200<br />
280<br />
300<br />
320<br />
340<br />
Poets<br />
4-Inch Stsinler<br />
Stew Casing<br />
DOE/RL 88-41<br />
Revision 1<br />
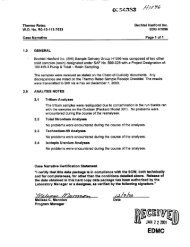
Construction Diagram Lithologic Diagram<br />
64n. Protective Lockable<br />
8-in. Telescoping<br />
10-Slot Stainless<br />
Stew Swoon<br />
_ 6/ea4_<br />
Silty Sand to<br />
Gravelly Sand<br />
Silty Sandy Gravel<br />
4in., 20•Slat '•p`6 Slightly 9 Y Silty h GravellyY<br />
Stainless Stew<br />
Sand to Slightly Gravelly<br />
Screen Sand<br />
—3Z_ Water Level Bentonite Pellets Sand<br />
Cement Grout Silica Sand Silt<br />
®<br />
Granular Ben[oni[e op Gravel<br />
Well 299-E18-2<br />
APP D1-2<br />
Moisture %CaCO3<br />
0102030 0246810 0<br />
20<br />
40<br />
60<br />
80<br />
140<br />
160<br />
Y<br />
wo g<br />
0<br />
200 r; s<br />
z2o m<br />
m<br />
240 i<br />
260<br />
280<br />
320<br />
340
C%$<br />
r"k<br />
-^ a<br />
m-<br />
140<br />
N<br />
9<br />
] 160<br />
O<br />
5<br />
teo<br />
s<br />
m 2W<br />
LL<br />
0<br />
20<br />
40<br />
60<br />
80<br />
DOE/RL 88-41<br />
Revision 1<br />
Construction Diagram Uthologic Diagram<br />
6-in. Protec tive Lockable<br />
` 10-Slot Stainless<br />
Ste el Screen<br />
Silty Sand to<br />
Gravelly Sand<br />
Silty Sandy Gravel<br />
to Sandy Gravel<br />
Slightly Silly<br />
Gravelly Sand<br />
Water Level Bentonite Pellets Sand<br />
Cement Grout Silica Sand 8 Silt<br />
Granular Bentonite 6p0 Gravel<br />
Well 299-E18-3<br />
APP D1-3<br />
Moisture %CaCO3<br />
0102030 0246810 0<br />
20<br />
40<br />
60<br />
80<br />
100<br />
120<br />
140<br />
160<br />
d<br />
180 g<br />
]<br />
0<br />
200 t7<br />
3<br />
220 m m<br />
m<br />
240 i<br />
260<br />
280<br />
300<br />
320<br />
340
u<br />
0<br />
100<br />
120<br />
3 140<br />
N<br />
a<br />
3 60<br />
0<br />
N<br />
1 00<br />
0<br />
2w<br />
240<br />
260<br />
2130<br />
DOE/RL 88-41<br />
`kievision 1<br />
Construction Diagram Lithologic Diagram<br />
6-in. Protective Lockable<br />
Casing Cap<br />
t Guard Posts<br />
Pad<br />
C 8- in. Telmoping,<br />
10-Slot Stainle ss<br />
Steel Screen<br />
stainless 61961<br />
Sartori<br />
Slightly Silly Sand to<br />
Gravelly Sand<br />
Silty Sandy Gravel<br />
_4 Water Level eantonite Pellets ':itr» Sand<br />
Ppp<br />
Cement Grout SOica Send _ _^ Silt<br />
Granular Bentonite o°p Gravel<br />
Well 299-E18-4<br />
APP D1-4<br />
Moisture % CaCO3<br />
0102030 0246810 0<br />
27<br />
40<br />
60<br />
80<br />
100<br />
140<br />
160 m`<br />
N<br />
+so 8<br />
0<br />
200 ^<br />
ie<br />
220 m<br />
d<br />
240 2<br />
260<br />
280<br />
300<br />
320<br />
340
-;w<br />
1^m<br />
1<br />
2<br />
3<br />
4<br />
5<br />
DOE/RL 88-41<br />
Revision 1<br />
APPENDIX 0-2<br />
GROUNDWATER DATA<br />
APP D2-i
Gt':<br />
t<br />
r°±<br />
A.<br />
n<br />
DOE/RL 88-41<br />
Revision 1<br />
1<br />
2<br />
3<br />
4<br />
5 This page intentionally left blank.<br />
APP D2-ii
Table D2-1. Summary of Sampling Results for the 2101-M Pond, August 1988. (sheet 1 of 4)<br />
--------------------------------- - ----- Constituent List=Contamination Indicator Parameters ---------------------------- -- -- -<br />
Constituent Detection Oslo. Drinking Water Standards<br />
Code Name Units iimit Samples Detection Standard Agency Exceeded Full name<br />
oas CONDLAB umbo 16 0 700 WDOE Specific conductance, laboratory<br />
191 COHDFLD umho 1 16 0 700 WDOE xxx Sppecific conductance, field<br />
199 PIIFIELD<br />
0.1 16<br />
0<br />
6.6-8.6 EPAS<br />
pH, field<br />
207 Pli -LAB 0.01 16<br />
0<br />
6.6 -6.6 EPAS<br />
pptl, laboratory<br />
C69 TOC ppb 1000 16 0 Total organic carbon<br />
H42 TO%LDI- ppb 20 IB 0 Total organic halogens, Ia. DL<br />
-------------- -r.-------------------------- Constituent List=Drinking Water Parameters -----------------------------------------<br />
Constituent Detection Below Drinklny Wa Nr Standards<br />
Code Name Units Limit Samples Detection Standard Agency Exceeded Full name<br />
109 COLIFRM MPH 2.2 1 1 •e• 1 EPA Coliform bacteria p<br />
v 111 BETA pCi/L 8 1 0 60 EPA Gross beta m m<br />
161 RADIUM pCi/L 1 1 0 6 EPA Total radium
Dv<br />
9! I E: 0? 7<br />
Table D2-1. Summary of Sampling Results for the 2101-M Pond, August 1988. (sheet 2 of 4)<br />
-------------------- ------------------ ------ Constituent List=Water Quality Parameter s ___________________________<br />
Constituent Detection Below Drinklnp Water Standards<br />
Code Name Units Limit Samples Detection Standard Agency Exceeded Full name<br />
All SODIUM ppb 200 4 0 Sodium<br />
All MANGESE ppb 5 4 0 60 EPAS xxx Manganese<br />
A19 IRON ppb 30 4 0 300 EPAS xxx Iron<br />
C13 SULFATE ppb 600 4 0 250000 EPAS Sulfate<br />
CIS CHLORID ppb 600 4 0 260000 EPAS Chloride<br />
H24 FSODIUM ppb 200 4 0 Sodlua, filtered<br />
H29 FMANGAN ppb 6 4 2 60 EPAS was Manganese, filtered<br />
H31 FIRON ppb" 30 4 0 300 EPAS Iron, filtered<br />
1161 LPHENOL ppb to 4 4 •e• Phenol, low DL<br />
--------------------------------- ------ Constituent List=<strong>Site</strong> Specific and Other Parameters ----------------------<br />
Constituent Detection Below Drinking Water Standards<br />
Code Name Units Limit Samples Detection Standard Agency Exceeded Full name<br />
A01 BERYLUM ppb 6 4 4 •se Beryllium m Mm<br />
p A03 STRONUM ppb 20 4 0 Strontlum<br />
ro < ^<br />
604 Z INC ppb 6 4 1 5000 EPAS Zinc y<br />
ro A06 CALCIUM ppb 50 4 0 Calcium -'<br />
Al2 NICKEL ppb 10 4 0 Nickel 0 00<br />
AI3 COPPER ppb 10 4 4 see 1300 EPAP Copper 1<br />
A14 VANADUM ppb 6 4 1 Vanadium<br />
A16 ANTIONY ppb 100 4 4 ese Antimony<br />
A18 ALUMNUM ppb 160 4 3 Aluminum<br />
A18 POTASUM ppb 100 4 0 Potassium<br />
.<br />
ASO YAGNES ppb 50 4 0 Magnesium<br />
C76 PHOSPHA ppb 1000 4 4 so * Phosphate<br />
H13 F ZINC ppb 6 4 2 6000 EPAS Zinc lilts, ad<br />
H19 FCALCIU ppb 60 4 0 Calcium, filtered<br />
H26 FNICKEL ppb 10 4 3 Nickel, filtered<br />
H26 FCOPPER ppb 10 4 4 see 1300 EPAP Copper, filtered<br />
H21 FVANADI ppb 6 4 1 , Vanadium, filtered<br />
H29 FALUMIN ppb 160 4 4 •eo Aluminum, filtered<br />
H30 FPOTASS ppb 100 4 0 Pota ss ium, filtered<br />
1132 FMAGNES ppb 60 4 0 Magnesium, filtered<br />
1133 FBERYLL ppb 6 4 4 see Beryllium, filtered<br />
1136 F57RONT ppb 20 4 0 Strontium, filtered<br />
U36 FANTIMO ppb 100 4 4 see Antimony, filtered<br />
* so - Indicates all samples were reported as below contractual detection limits<br />
xxx - Indicates that Drinking Water Standards were exceeded<br />
EPA - based on Maximum Contaminant Levels ? Ivan In 40 CFR Part 141 (July,1987)<br />
National Primary Drinking Water Rego stlons as •mended b}}' 62 FR 26690<br />
EPAR - based on National Interim Primary Drinking Water BeguI tlone.<br />
Appendix IV, EPA-670/9-1E-003<br />
EPAP - based on proposed Maximum Contaminant level Goals In 60 FR 40936<br />
EPAS - based on Secondary Maximum Contaminant levels given in 40 (FR Part 143<br />
National Secondary Drinking Water Regulations
n<br />
'o<br />
v<br />
O<br />
N<br />
w<br />
F ` I - , r<br />
Table D2-1. Summary of Sampling Results for the 2101-M Pond, August 1988. (sheet 3 of 4)<br />
Quadruplicate Contamination InJicstor Paran.etw s<br />
Duplicate CIOIDFI0<br />
Well Callsction sample undo<br />
fl ame Date number 1/700w<br />
2-E18-1 16AUG88 912<br />
1 812<br />
2 911<br />
3 809<br />
2-EIB-2 18AUGSO 362<br />
1 361<br />
2 366<br />
3 366<br />
2-EIS-3 16AUG89 279<br />
1 279<br />
2 280<br />
3 290<br />
2-EIS-1 IGAUG98 303•<br />
1 303<br />
2 303<br />
3 303<br />
The column headers consist of : Constituent Name<br />
Analysis Units<br />
Contractual Detection Limit/Drinking Water Standard(suffix)<br />
Suffix<br />
none - based on Maximum Contaminant Levels given in 10 CFR Part 111 (July,1987)<br />
National Primary Drinking Water Regulations as amended b y 62 FR 26890<br />
r - based on National Interim Primary Drinking Water Re 9u 1•tl ons,<br />
Appendlx 1V, EPA-670/9-10-003<br />
P - based on proposed Maximum Contaminant Level Goals in 60 FR 18938<br />
s - based on Secondary Maximum Contaminant Levels given In 10 CFR Pert 113<br />
(July, 1987) National Secondary Drinking Water Regulations<br />
w - based on additional Secondary Maximum Contaminant Levels given In<br />
WAC 218-61, Public Water Supplies<br />
Data flags<br />
< - Less than Contractual Detection Limit, reported as Limit<br />
1 - Less then Contractual Detection Limit, moasursd valve reported<br />
a - For radioactive constituents, reported value L len than 2-sigma error<br />
COIIDLAB PII-LAB PIIFIELD TOC TOXLDL<br />
umho pyyb ppb<br />
.1700. 0.01/8.6s 0.1/9.6 8 1000/. 20/.<br />
631 7.9 7.8 632 11.3<br />
631 1.9 1.0 890 11.6<br />
629 1.9 7.9 302 11.1<br />
621 1.9 7.9 1397 -1.8<br />
261 8.6 7.9 311 1.7<br />
219 0.0 1.9 366 -0.9<br />
219 9. 8 1.9 717 -1.9<br />
218 8.0 7.9 1643 19.9<br />
Roo 8.0 7.9 610 12.9<br />
200 0.0 7.9 631 113.7<br />
201 3.0 7.9 198 37.2<br />
201 8.0 1.9 1492 16.1<br />
219 9.0 7.8 163 0.9<br />
220 8.0 7.9 603 17.7<br />
219 0.0 8.0 110<br />
3.2<br />
218 9.0 8.0 1a42 12.7<br />
n<br />
0<br />
;U CD<br />
m m<br />
N ^<br />
0 00<br />
= 00
D<br />
v<br />
0<br />
N<br />
.P<br />
Table D2-1. Summary of Sampling Results for the 2101-M Pond, August 1988. (sheet 4 of 4)<br />
Duplicate ALPHA<br />
Veit collection .ample pCl/L<br />
name Date number 4/15<br />
2410 . 1 16AUGBB. 2.210<br />
2-EIB-2 16AUGBS- 0.416<br />
2-E18. 3 16AUGH •0.352<br />
2-EIB-4 16AUM 0.917<br />
Duplicate CHLORID<br />
Veit" Collection ample TO<br />
[wn Date maber 500/25000<br />
2-EIS-1 16AVGBS 6,550<br />
2418. 2 16AVG88 2,060<br />
2-Ell-3 WOMB 4,470<br />
2-E18-4 16AUGBB 6,260<br />
Duplicate MANGESE<br />
Veil Collection ceople ppb<br />
naoe Date n0nber 51503<br />
2-EIS-1 16AUC83 70<br />
2-EIB-2 16AU&M 6<br />
2-EIS-3 HAUGH, 15<br />
2-EIA-4 16AMBS 13<br />
Duplicate SCDILH<br />
Well Collection Smple ppb<br />
name Oats mcber 2011.<br />
2-EIB-1 16AUG88 • 28,700<br />
2-EIB-2 16AUG88 •18,000<br />
2-EIS-3 16AUG88 5,570<br />
2-EIS-4 16AMS 6,010<br />
AIIHNIH ARSENIC FARSENI BARIIH fOARIIH BETA ICAL CIII CALCIIH<br />
ppb ppb Fpb "A, ppb pCIA ppb ppb<br />
150/. 5150 5/50 6/1000 6/1010 8/50 50/. 50/.<br />
351
a<br />
v<br />
V<br />
0<br />
N<br />
cn<br />
n<br />
Table D2-2. Summary of Resampling Results for the 2101-M Pond, September 1988.<br />
Standard List Constituents<br />
I ALUM III AL1110111h AESFIIIC FARSE111 PARMA FUARIIIH HAIM Ili CAI1H111M 1'CALC111<br />
Well Surle Uup<br />
116 FIJI, ?IA, p^d. pill. ^pL gp t. pplet<br />
Flame 031e rlllu IJ /. I1 /. 1/50 1/50 - 6, 600 6/1000 g/li, / 1 0 5b/.<br />
2-E18-1 22SEPOB% it 0 if 54 10 it 11 Moo<br />
2-EIB-2 22SEP88' D U 5 5 54 52 D U 25600<br />
2-EI8-3 23SEP8B 1 D D 11 12 61 59 D D 31000<br />
2-EIR-4 22SEP88 D 173 9 8 58 55 D D 31360<br />
- 1 Well<br />
1<br />
53rple<br />
Date nur ""<br />
CALCIUM<br />
^1Rpt,<br />
W.<br />
FCHRDHI<br />
ppb<br />
10/50<br />
CHROHUN<br />
"<br />
10/50<br />
COPPER<br />
p PG<br />
FCOPPER<br />
p pG<br />
IRAN<br />
M'O'O<br />
IF ROU<br />
p 1,<br />
HANES<br />
L' pb<br />
novae ]0/1300p 10/1300p 30s 301300;<br />
2-EIB-1 22SEP88.<br />
2-EIB-2 22SEPBB•<br />
2-EI8-3 22SEPBB<br />
2-EIB-4 22SEP88<br />
72000<br />
25400<br />
29600<br />
31000<br />
D<br />
D<br />
D<br />
D<br />
104<br />
87<br />
67<br />
159<br />
It<br />
D<br />
D<br />
D<br />
0<br />
D<br />
D<br />
1810<br />
535<br />
1440<br />
1580<br />
it<br />
D<br />
32<br />
68<br />
17000<br />
6790<br />
7900<br />
8070<br />
FHAGUES fMAN AN 11AUGESE HICHkL FUIC`EL FPOTASS POTASIIH FSLLEtll<br />
E' SEIL.EHUM<br />
Well Sawple Uup Rt, p<br />
p<br />
ppb pt,<br />
L<br />
name 03te fitim 1V /. 5/J0s 5/505 a/. f8 /. 188/, . 1D0:. 5 /10 J %l0<br />
2-EIB-1 22SEPBB' 16500 19 46 48 It 7200 8.6 10<br />
2-EIS-2 22SEPBB 6710 U 13 43 D 4930 5090 U It<br />
2-EIB-3 32SEP80i 8080 D 22 35 D 5220 5140 D D<br />
2-EIB-4 22SEPBB 8060 11 32 79 16 5570 5640 D U<br />
SILVER FSILVER SODIUH FSODIUM FVAHADI VANA1111H ZINC FZ111C<br />
Well <strong>Site</strong> Blip P pL ppt RR t, pr, R G ^Nl,<br />
^,p1. ^a Apq r, G D L<br />
Ar<br />
n3ue 03te rluu IO/50 1U/10 2VV/. 2VV/. Y'l<br />
1/. 1/1VOOs J/JV0 05<br />
2-k18-1 22SEP88 , D D 28000 27400 D 5 73 46-<br />
2--E18-2 22SEFOO , D D 17700 17300 18 19 D D<br />
2-EIB-3 22SEFBB+ D U 5310 5360 27 36 34 D<br />
2- L IB-4 22SEPBB 11 U 6760 6680 19 23 10 D<br />
0<br />
zo<br />
m 0<br />
r \<br />
N f<br />
0 00<br />
OD<br />
....ice
--------------------------------<br />
Constituent Detection<br />
Code Name Units Limit<br />
096 CONDLAB ueho<br />
191 COHDFLD umho 1<br />
199 PHFIELD<br />
0.1<br />
201 PH-LAB 0.01<br />
C69 IOC ppb 1000<br />
H42 TOXLDL ppb 20<br />
Table D2-3. Constituent List and Summary of Sampling Results<br />
for the 2101-M Pond, November 1988. (sheet 1 of 12)<br />
Constituent tie L= Contsminstlen Indicator Parameters ------<br />
Below<br />
Drinkln Weter Standards<br />
Samplea Ddectlon St andard Agency Exceeded Full name<br />
16 0 700 000E Specific conductance, Isborsl..ey<br />
24 0 700 ODOE ctance, II.,a<br />
24 Q 6.6-9.6 EPAS ex. S11 p , cflic condu<br />
1 6 0 6. 6 -6.6 EPAS pp1I laboratory<br />
20 0 ToEe1 arganlc carbon<br />
20 0 Iota) organic halogens. IoW OL<br />
- Constituent List=Interim Primary Drinking Water Parameters ---------------------------<br />
Constituent Detection I Islas Drinklnpp Water Standards<br />
Code Name Units Limit Samples Del .action Standard Agency Exceeded Fuji name<br />
109 COLIFRY MPH 2.2 4<br />
ee. 1 EPA Collform bacte ria<br />
111 BETA pCl /L 9 0 I II 60 -EPA Grose bets CD<br />
191 RADIUM pCl/L 1 6 I I 6 'EPA Total radium<br />
p 212 ALPHA pCl/L 4 a<br />
I 1 6 EPA Gross alpha CD<br />
ro AD$ BARIUM ppb a a 1 I 1000 EPA Barium<br />
Gn A07 CADMIUM ppb 2 6<br />
I 000 10 EPA Cadmium y<br />
A09 CHROMUII ppb 30 a I I 6 0 EPA Chromium -+<br />
ASO SILVER ppb 10 a I I e.s 60 EPA Silver<br />
0 00<br />
A20 ARSENIC ppb 6 a<br />
0 EPA Arsenic ' 6<br />
A21 MERCURY ppb 0.1 i<br />
i so* 2 EPA Mercury .r.<br />
A22 SELENUM ppb 6 0<br />
10 EPA Selenium ^-+<br />
ASS ENORIN ppb 0.1 i<br />
i sea 0.2 EPA Endrin<br />
• A34 IIETHLOR ppb 3 i<br />
i esa 100 EPA Methoxychlor<br />
A35 TOXAENE ppb 1 i<br />
i sea 6 EPA Toxaphene<br />
A3 4 •-BIIC ppb 0.1 6<br />
i sea 4 EPA Linden:, alpha-BHC<br />
AS7 ASS b-BHC ppb 0.1 i<br />
sae 4 EPA Lindane, bete-BHC<br />
3 -911C ppb 0.1 i<br />
i •oo 4 EPA Lindane. ® smma-BIIC<br />
AS d-BIIC ppb 0.1 6<br />
i see 4 EPA Linden::011C<br />
A61 LEADGF<br />
60 EPA Lead (graphite furnace)<br />
C72 NITRATE ppb 600 a<br />
46000 EPA Nitrate<br />
C74 FLUDRIO ppb 600 a<br />
4000 EPA Fluoride<br />
HIS 2,4-0 2 6<br />
i e.0 100 EPA 2,4-D 2,4-Dlchlorophenoxyscetic acid]<br />
1114 2,4 SIP ppb<br />
2<br />
6<br />
..e 10 EPA 2,4 6- P s{Ivex<br />
1120 FBAkTUM ppb<br />
a<br />
a I I<br />
1000 EPA<br />
Bar ^um, filtered<br />
021 FCADMIU ppb 2 a i I u.<br />
10 EPA Cadmium, filtered<br />
1122 FCHROUI ppb 10 a<br />
i 60 EPA Chromium filtered<br />
U23 FSILVER ppb 10 a i I .e. 60 EPA Silver, fil tered<br />
1137 FARSENI ppb i a<br />
60 EPA Arsenic, filtered<br />
1139 FMERCUR ppb 0.1 i<br />
i ... 2 EPA Mercury, filtered<br />
1139 FSELENI ppb 6 a<br />
SO EPA Selenium (IltereJ<br />
1141 FLEAD ppb 6 a i ... 60 EPA Lead, fl^tared
Y<br />
Constituent Detection<br />
Code None Units Limit<br />
-gyp 106 TRITIUM pCl/L 600<br />
N<br />
1<br />
ADS<br />
A03<br />
AOA<br />
DERYLUM ppb<br />
STRONUM ppb<br />
ZINC ppb<br />
6<br />
20<br />
6<br />
v A06 CALCIUM ppb<br />
Al2 NICKEL pp<br />
Ali COPPER<br />
60<br />
10<br />
A14 VADUM UA ppb 1 6<br />
A16 ANTIONY ppb<br />
Ala ALUMNUM ppb<br />
100<br />
160<br />
All POTASUM ppb<br />
ASO MADNES<br />
100<br />
A61 TETRANE pp b<br />
A02 BENZENE ppb<br />
A8 3 DIOXANE ppb<br />
A5 4 METHDOE ppb<br />
A66 PYRIDIII ppb<br />
ASO TOLUENE ppb<br />
A87 1, 11 ,1-T ppb<br />
AS$ 1 1 2-T ppb<br />
A8 9 THINE ppb<br />
AID PERCENE ppb<br />
All OPXYLE<br />
6 6<br />
6<br />
600<br />
10<br />
600<br />
6<br />
6<br />
6<br />
6<br />
6<br />
A72 ACROLIN ppb<br />
A73 ACRYILE ppb<br />
A1 4 BISTHER ppb<br />
A76 BROMONE ppb<br />
Ala METHBRO ppb<br />
All CARBIDE ppb<br />
A76 CHLBENZ ppb<br />
10<br />
10<br />
10<br />
10<br />
10<br />
10<br />
to<br />
Al p CULTHER ppb<br />
ASO CULFORM ppb<br />
10<br />
6<br />
.3 7<br />
Table D2-3. Constituent List and Summary of Sampling Results<br />
for the 2101-M Pond, November 1988. (sheet 2 of 12)<br />
-------------------------------------- ----- Constituent l.isl_Weter Quality Parameter s<br />
Constituent Data, tion Below Drinking Water Standards<br />
Code Name UnI to limit Samples Detectlen Standard Agency Exceeded Full name<br />
All SODIUM ppb 200 a 0 Sodium<br />
All MANCESE ppb 6 a 2 60 EPAS Mangan ese<br />
Alt IRON pl,b 30 a 0 300 EPAS xxx Iron<br />
C67 PHENOL ppb IO 1 4 •.• Phenol<br />
CIS SULFATE ppb 600 a 0 260000 - EPAS Sulfate<br />
CIS CULORID ppb 600 e 0 260000 EPAS Chloride<br />
H2 4 FSODIUM ppb 200 e 0 Sodium, fllt.red<br />
1129 FMANCAN ppb<br />
6<br />
e<br />
a ss•<br />
60 EPAS Manganese filtered<br />
1131 FIRON ppb<br />
30<br />
a<br />
6<br />
300 EPAS Iron, f1Itered<br />
H61 LPHEUOL ppb 10 1 1 •e• Phenol, low OL<br />
----- Constituent Llat=<strong>Site</strong> Specific and Other Perimeters -----------------<br />
Below Drinklnp Water Standards<br />
Semple• Detection Standard Agency Ex ce eded Full name<br />
6 0 20000 EPA Tritium (H-3)<br />
e e e.e Beryllium<br />
e 0 Strantlum<br />
a 0 6000 EPAS Zinc<br />
a 0 Calcium<br />
a 6 1300 EPAP Copper<br />
a 1 Vaned lum<br />
e a see Antimony<br />
a e ses Aluminum<br />
a 0 Pates alum<br />
a 0 Ma pn alum<br />
16 Is ass 6 EPA Mrachloromethane [Carbon Tetrachloride<br />
N 11 so* 6 EPA Benzene<br />
14 lA see Dloxane<br />
16 116 sae Methyl ethyl ketone<br />
14 14 ass Pyrldlne<br />
l^<br />
hA see<br />
2000 EPAP<br />
Toluene<br />
16<br />
16 ses<br />
200 EPA<br />
I, 1 o1-Trlchloroathane<br />
16 I6 ass 1,1,2-Trlchloroathane<br />
16 16 eee 6 EPA Trichloroethylese lst,2-Trlchloroetheno<br />
16 16 sso Parehloroethy lane [Tstrechloroothenel<br />
16 16 ses 4 40 EPAP xylem• o,P<br />
14 1 4 see Acroleln -<br />
IA 11 ass Acryloaltrlle<br />
1 4 hA see Bla(chloramothyl) ether<br />
11 1 4 eee Bromoacetone<br />
14 14 ass Methyl bromide<br />
N 1 4 *so Carbon d isulfide<br />
N 14 ass 60 EPAP Chlorobenzene<br />
1 4 IA so* 2-Chloroethyl vinyl ether<br />
16 16 soe 100 EPA Chloroform (Tr lch loromethanal<br />
O<br />
A C)<br />
m m<br />
N ^<br />
o Co<br />
Co<br />
i
n vM<br />
O<br />
N C<br />
au<br />
Constituent Detection<br />
Code Name Units Limit<br />
Ael UETHCHL ppb 10<br />
A02 CHMTHER ppb ]0<br />
A03 CROTONA ppb 10<br />
A04 DIBRCUL ppb 10<br />
A06 DIBRETH ppb<br />
ASS DIBRILET ppb<br />
f0<br />
10<br />
AST DIBUTEN ppb 10<br />
ASO DICDIFM ppb<br />
ASS 1,1-0 IC ppb<br />
10<br />
10<br />
AS0 1 2-DIC ppb 10<br />
A01 TAARCE ppb 10<br />
A92 OIC HY ppb 10<br />
ASS NETHYCH ppb<br />
A99 DTCPANE ppb<br />
10<br />
to<br />
A96 DICPEHE ppb 10<br />
ASO NNDIEIIY ppb<br />
ASS HYORSUL ppb<br />
10<br />
10<br />
801 IODOUET ppb<br />
802 METHACR ppb<br />
IO<br />
10<br />
803 METHTHI ppb 10<br />
809 PENTACH ppb 10<br />
B06 1112-tc ppb 10<br />
800 1122-tc ppb 10<br />
800 BROMORM ppb 10<br />
809 TRCUEOL ppb 10<br />
810 TRCUFLM ppb 10<br />
Oil IRCPANE ppb<br />
812 123-trDD ppb<br />
1013 VINYIOE ppb<br />
019 U-XYLE<br />
10 16 DIETIIY ppb<br />
10<br />
1 0<br />
10<br />
10<br />
B10 ACETILE ppb 3000<br />
C04 UETACRY ppb<br />
CTI FORUALN ppb<br />
CIA PHOSPHA ppb<br />
1106 ETIIOXTO ppb<br />
1100 EIIIUETH ppb<br />
Ills TC<br />
1110 fZINC ppb<br />
30<br />
600<br />
1000<br />
3000<br />
10<br />
1006<br />
1115 FCALCIU ppb<br />
H26 MICKEL ppb<br />
H24 FCOPPER ppb<br />
H27 FVANADI ppb<br />
1120 FALUMIN ppb<br />
1130 FPOTASS ppb<br />
1132 FMAGNES ppb<br />
1133 FSERYLL ppb<br />
1136 FSTRONT ppb<br />
H30 FANTIMO ppb<br />
60<br />
10<br />
10<br />
6<br />
160<br />
100<br />
60<br />
6<br />
20<br />
100<br />
9 1 8 9"<br />
1 1 0 7 - -1<br />
Table 02-3. Constituent List and Summary of Sampling Results<br />
for the 2101-M Pond, November 1988. (sheet 3 of 12)<br />
----- Constituent Lint-<strong>Site</strong> Specific and Other Parameters -----------------------------<br />
Below Orinklna Water StanJarJa<br />
Samples Detection Standard Agency Exceeded full name<br />
]A It sea Methyl chloride IChloromethenel<br />
19 19 see Ch loromethyyl methyl ether<br />
U 11 tee CrotonaldehyJe<br />
14 IA see 0 EPAP 12-Dibromo-3-ch l 0roprop 4 ne<br />
19 11 ass 1 2-Dibromoethane<br />
19 19 see Dibromoswthane<br />
19 11 ess 1 9-Dichloro-2-butane<br />
19 1 4 •s• 0^chlorodlfluoromethana<br />
19 IA •s• 1,1-Dichlorosthane<br />
19 19 see 6 EPA 1,2-Dichloroothane<br />
14 lA see 70 EPAP trans- 1 ,2-01 chloroathene<br />
fA 19 eee 7 EPA 1,1-Dichloroethylone<br />
16 Is ese Mathyylane chloride<br />
11 49 sea 0 EPAP 1,2-Dlcbloropropane<br />
1 9 19 ass 1,3-Dichloropropens<br />
11 11 *so 14,11-diethylhydraaine CD m<br />
19 19 ass IlyJrogen au <<br />
19<br />
IA<br />
1 1<br />
lA<br />
19<br />
19<br />
19<br />
19<br />
19<br />
IA<br />
lA<br />
19<br />
16<br />
11<br />
19<br />
19<br />
11<br />
N<br />
IA<br />
IA<br />
19<br />
19<br />
19<br />
19<br />
19<br />
19<br />
16<br />
19<br />
•s•<br />
•s•<br />
sea<br />
ese<br />
sea<br />
ass<br />
ess<br />
*so<br />
see<br />
ass<br />
sea<br />
eee<br />
sea<br />
see<br />
100<br />
2<br />
MO<br />
EPA<br />
EPA<br />
EPAP<br />
_<br />
Iodomethane<br />
Methacrylonitrlle<br />
Uathanothlol<br />
Pentachloroothane<br />
1,1,1,2-Atrachlorethane<br />
1,1,2 2-Tetrachlorethans<br />
Bromolorm (Trlbramomethane)<br />
Trlchloromsthanethioi<br />
Trlchloromonofluoromothano<br />
Trlchloropropan•<br />
1 2,3-Tr ichloropropane<br />
Vinyl chlorl Je<br />
Xyy lane-m<br />
Dlathy laralue<br />
y<br />
o M<br />
= OD<br />
F--<br />
1-<br />
19 14 ese Acetonitrile<br />
U<br />
14<br />
6<br />
19<br />
19<br />
6<br />
ese<br />
eee<br />
ess<br />
Methyl mothacrylate<br />
Formalln<br />
Phosphate<br />
1 1<br />
11<br />
9<br />
6<br />
lA<br />
19<br />
0<br />
0<br />
ese<br />
eee<br />
6000 EPAS<br />
Ethylene oxide<br />
Ethyl methacrylato<br />
Total carbon<br />
Zinc flitared<br />
0 0 Calcium, filtered<br />
0<br />
0<br />
0<br />
6 1300 EPAP<br />
Nickel,<br />
Copper,<br />
filtered<br />
fllterbd<br />
a<br />
a<br />
2<br />
a sea<br />
Vanadium, filtered<br />
Aluminum, filtered<br />
a<br />
0<br />
0<br />
0<br />
6<br />
0<br />
0<br />
a<br />
0<br />
8<br />
see<br />
see<br />
Potassium, filtered<br />
Magnesium, flitereJ<br />
Beryllium, filtered<br />
Str0ntlum, filtered<br />
Antimony, filtered<br />
o<br />
O
D<br />
v<br />
vN<br />
W<br />
'.^<br />
' 1 uq<br />
t°<br />
Table D2-3. Constituent List and Summary of Sampling Results<br />
for the 2101-M Pond, November 1988. (sheet 4 of 12)<br />
________ ___________ ___ ___________ ______ Constituent Llst=Slte Specific and Other Parameters -----------------------------------<br />
Constituent Detection Below DrinklaQ Wstar Standards<br />
Code Name lift its Limit Samples Detection Standard Agency Exc ee ded Full name<br />
1180 TURBID ntu 0.1 l 0 Turbidity<br />
1188 BROMIDE ppb 1000 a 6 sss Bromide<br />
1187 NITRITE ppb 1000 a a see Nitrite<br />
IIa6 HEXONE ppb 10 16 16 ••s Haxone<br />
ToI ACETONE ppb 10 19 9 Acetone<br />
109 BUTAHOL ppb 6000 9 9 *so I-Butanol<br />
I10 PROPAIIL ppb 6000 9 9 •es 2-Proyy&nol<br />
121 TRIBUFII ppb 10 9 9 ••• Tributylphoephor le acid<br />
128 TAf ppb 10 1 9 11 ••• Tetrahydorf uran .<br />
I 7 ETHANOL ppb 6000 9 9 ass Ethanol<br />
L20 a MBP , ppb 6000 9 9 as* Monobutylphosph&te<br />
L21 DBP ppb 6000 9 9 ees Dl buty 1pho&phate -<br />
------------------------------------------------_ Constituent List=WAC 173 - 303 - 0006 --------------------------------------------<br />
Constituent Detection Below Drinklnpp Water an<br />
Name Units Limit Semple& Detect) on Stendord Agency Exceeded Full name N ern<br />
A23 THALIIAI ppb 6 6 6 so• Thal l lees -" A<br />
A24 THIOURA ppb 200<br />
r<br />
9 9 sae thiourea r.<br />
A26 ACETHEA ppb 200<br />
9<br />
9 see<br />
1-Accty1-2-thlouree<br />
A2<br />
6 CHLOREA ppb 200<br />
9<br />
9 *as 1-(o-Ch loroyyhenyl) thiourea<br />
0W<br />
A27 DIETROL ppb 200 9 9 *so Olethylatllbeatorol<br />
^..,<br />
A20 ETHIflEA ppb 200 9 9 eee Ethylenethloures<br />
A29 NAPHREA ppb 200<br />
9<br />
9 es• 1-Napthyyl-2-thiourea<br />
A32 PHEHREA ppb 600<br />
9<br />
9 sae H-henylthlourse<br />
A40 ODD ppb 0.1 9 9 sea DDg<br />
M1 DDE ppb- 0.1 9 9 ees DDE<br />
A42 DDT ppb 0.1 9 9 sss DDT<br />
A43 HEPTLOR ppb 0.1 9 9 e•a 0 EPAP Heptachlor<br />
A44 HEPTIOE ppb 0.1 9 9 s•• 0 EPAP lleptachfor epoxide<br />
A ga DIELRIN ppb 0.1 9 9 a•e Die<br />
% I d, in<br />
A47 ALDRIN ppb 0.1 9 9 see Aldrin<br />
A48 CHLOANE ppb 1 9 9 see 0 EPAP Chlordane<br />
A99 Ef6)O1 ppb 0.1 9 9 sss Endosulfan I (el ha)<br />
A62 END02 ppb 0.1 9 9 sss Endosul An II (bite)<br />
A69 ARt01 8 ppb 1 9 9 ass 0 EPAP Arochlor 1016<br />
A66 AR1221 ppb 1 9 9 see 0 EPAP Arochlor 1221<br />
A66 AR1232 ppb 1 9 9 *so 0 EPAP Arochlor 1232<br />
A67 AR1242 ppb 1 9 9 sea 0 EPAP Arochlor 1212<br />
A6a AR1240 ppb 1 9 9 ass 0 EPAP Arochlor 1290<br />
AS9 AR1264 ppb 1 9 9 sss 0 EPAP Arochlor 1269<br />
ASO AR1280 ppb 1 9 9 sae 0 EPAP Arochlor 1280<br />
820 ACETOPII ppb 10 9 / see . Acetophenons<br />
821 WARFRIN ppb s0 9 9 see Warfarin<br />
622 ACEFENE ppb 10 9 9 *so 2-Acetyfaminafluoren•<br />
623 AMIt10YL ppb t0 9 9 ass 9-Am inoblphenf i<br />
024 AMIISO% ppb 10 4 4 •ea<br />
6-(Aminomethy)-3-isoxaaolol<br />
i
a .9<br />
O NI<br />
O<br />
Table D2-3. Cons tituent List and Summary of Sampling Results<br />
for the 2101 -M Pond, November 1988. (sheet 5 of 12)<br />
Con stituent tlmt=WAC 173 - 303 - 9906 --------------------------------------------- -<br />
Constituent Ootectlon<br />
)elmn SOng We ter Standards<br />
Code Nsme Units Limit Samples De Lectlon stands rd Agency Excetded Full name<br />
1<br />
1<br />
1<br />
•m•<br />
tot<br />
moo<br />
Amitrole<br />
Anllln•<br />
Arsmlt•<br />
1<br />
I<br />
1<br />
1<br />
1<br />
1<br />
1<br />
I<br />
1<br />
1<br />
I<br />
I<br />
I<br />
1<br />
1<br />
1<br />
I<br />
I<br />
I<br />
1<br />
!<br />
I<br />
1<br />
I<br />
I<br />
I<br />
I<br />
I<br />
I<br />
I<br />
I<br />
I<br />
Dot<br />
*to<br />
0e 4<br />
ems<br />
mom<br />
mom<br />
mmm<br />
tso<br />
mom<br />
eoo<br />
sot<br />
oos<br />
ooe<br />
too<br />
tom<br />
400<br />
moo<br />
met<br />
moo<br />
•mo<br />
too<br />
set<br />
tea<br />
moo<br />
sot<br />
000<br />
ooe<br />
oos<br />
see<br />
oos<br />
tom<br />
ooe<br />
•o•<br />
•o•<br />
••o<br />
ooe<br />
too<br />
0 e0<br />
000<br />
moo<br />
oso<br />
os•<br />
mom<br />
.<br />
0 EPAP<br />
Auramine<br />
B•nz[c]mcridin•<br />
8e ax [•]•nthrmc•n•<br />
0enztnm, dlchloromethyl<br />
0enzeneth101<br />
B•nzldln•<br />
benzo(b]fluoranthmnm<br />
B•nzo J fluoranthene<br />
yy 13ansoqulnon•<br />
Benzyl chloride<br />
01e ((2-chloroethoxr) ethane<br />
el•(2-chloro•thyyl et her<br />
Bls(2- •thylhsxyl) phthalate<br />
1-Bromoheny( then I other<br />
Butyl bans h•lst• pht<br />
2-stc-s,6-(ONer) Butyl-dlnitrophonol<br />
o<br />
Chloroalkyl others<br />
p-Chlor*aniline<br />
p-Chloro-m-cresol<br />
1-Chloro-2,3-•poxypropan•<br />
2-Chlorona, hths lone<br />
2-Chlorophenol<br />
Cresols<br />
2-Cyclohex 1-1 8dinitropheno 1<br />
Diben:[[a,h •cr^din•<br />
Olbenz [s,1 scrldln•<br />
Olb•ns `a, anthracene<br />
7H-Oibsn so e,p]c•rbazol•<br />
Manz o •,• pyrene<br />
Dibonxo s,h pyr•ne<br />
Dlbonzo • i pyrona<br />
Dl -n-butyl phthalate<br />
1,2-Dlchl orobens•n•<br />
1,3-Dlchlorobenz•ne<br />
1,1-Dichlorobenzen•<br />
3,3'-61 chlorob•nzidine<br />
2,1-Oichlorophanol<br />
2 6-Olchlorophanol<br />
D^•Lhyl phthalsto<br />
0 1hy1rosolrol•<br />
s,9 -Dlm•thoxybonsldlne<br />
y Dlmmthyleminomzobenzane<br />
7,3'<br />
^ CD<br />
(D<br />
-'3a<br />
w r'<br />
0 0^<br />
= 00<br />
I<br />
12-OIm:thyIb•nzjajsnthracona<br />
B26 AYITHOL ppb<br />
020 ANILINE ppb<br />
B27 ABAYITE ppb<br />
10<br />
10<br />
10<br />
4<br />
1<br />
1<br />
020 AUBAYIN ppb<br />
029 BEHZCAC ppb<br />
B30 BENZAAN ppb<br />
831 BENDICY ppb<br />
632 BENTHOL ppb<br />
833 BEHOINE ppb<br />
831 BENZBFL ppb<br />
1336 BEHZJFLppb<br />
836 PBE14ZQU ppb<br />
037 BENUI L ppb<br />
1336 0T52CIlM ppb<br />
939 a SMIE ppb<br />
010 6 S2EPH ppb<br />
2 I1 BBOPHEN ppb<br />
B42 BUTBENP ppb<br />
013 BUT0114P ppb<br />
B11 CHALETH ppb<br />
04 6 CULANIL ppb<br />
818 CHLCRES ppb<br />
817 CHLEPDX ppb<br />
BU CIU.NAPH ppb<br />
010 CHMEN ppb<br />
861 CHESOLS ppb<br />
B62 CYCHDIN ppb<br />
063 DIBAHAC ppb<br />
661 DIBAJAC pph<br />
066 MAHAN ppb<br />
066 DISCOCA ppb<br />
867 0 BAEPY ppb<br />
860 DIBAHPY ppb<br />
B69 DIBAIPY ppb<br />
Ban DIBPHTH ppb<br />
881 12-db•n ppb<br />
862 13-dben ppb<br />
863 11-dben ppb<br />
001 DICHBEH ppb<br />
B86 21-dchp ppb<br />
966 26-dchyy ppb<br />
067 DIEPHTH ppb<br />
BO6 DIHYSAF ppb<br />
869 DIUETNB ppb<br />
870 DIUEAUB ppb<br />
13 11 DIUBENZ ppb<br />
13 12 DIUEYLS ppb<br />
als TIMM)( ppb<br />
811 DIYPHAU ppb<br />
10<br />
10<br />
10<br />
10<br />
10<br />
f0<br />
10<br />
10<br />
10<br />
10<br />
10<br />
10<br />
10<br />
10<br />
10<br />
ID<br />
10<br />
10<br />
10<br />
10<br />
10<br />
ID<br />
10<br />
10<br />
10<br />
10<br />
10<br />
10<br />
10<br />
10<br />
to<br />
10<br />
10<br />
10<br />
10<br />
20<br />
10<br />
10<br />
10<br />
10<br />
10<br />
10<br />
10<br />
IO<br />
10<br />
10<br />
1<br />
1<br />
1<br />
1<br />
1<br />
1<br />
1<br />
1<br />
1<br />
1<br />
1<br />
s<br />
/<br />
1<br />
4<br />
1<br />
s<br />
1<br />
1<br />
1<br />
1<br />
1<br />
1<br />
1<br />
1<br />
1<br />
1<br />
4<br />
1<br />
1<br />
1<br />
1<br />
1<br />
1<br />
1<br />
1<br />
1<br />
1<br />
1<br />
1<br />
1<br />
1<br />
1<br />
1<br />
1<br />
4<br />
4<br />
4<br />
000<br />
see<br />
ooe ,<br />
3,-Diem thylbenzf(d n•<br />
Thlo/anox<br />
alpl,.,alpha-Dimmthylphenethylamine
v<br />
v<br />
C7<br />
N 1<br />
Table D2- 3. Constituent List and Summary of Sampling Results<br />
for the 2101-M Pond, November 1988. (sheet 6 of 12)<br />
Constituent List=WAC 171-303-9906<br />
Constituent Detection 8e 10r DrinMlnaa We br StenJerd•<br />
Code Name Units Limit Samples Detection Ste do rd Agency Ex ce eded Full name<br />
076 OIW WHEN ppb<br />
876 DIMPHTII ppb<br />
817 DINDENZ ppb<br />
879 DINCRES ppb<br />
819 D114PIlEN ppb<br />
880 2 4 -dint ppb<br />
Bet 26-dint ppb<br />
982 DIOPHTH ppb<br />
88 11 DIPHAYI ppb<br />
BBf DIPIIHYD ppb<br />
BB6 DIPINHT ppb<br />
088 ETHMINE ppb<br />
897 ETIWETS ppb<br />
888 FLUORAN ppb<br />
089 UEXCBEN ppb<br />
BOO NEXCBUT ppb<br />
10<br />
10<br />
10<br />
10<br />
60<br />
10<br />
10<br />
1 0<br />
10<br />
10<br />
10<br />
10<br />
10<br />
10<br />
10<br />
10<br />
4<br />
t<br />
1<br />
!<br />
1<br />
1<br />
1<br />
A<br />
f<br />
f<br />
4<br />
f<br />
f<br />
f<br />
f<br />
f<br />
4<br />
f<br />
f<br />
4<br />
f<br />
f<br />
1<br />
4<br />
f<br />
f<br />
f<br />
1<br />
4<br />
4<br />
4<br />
4<br />
e so<br />
ass<br />
as*<br />
too<br />
ass<br />
ass<br />
so*<br />
toe<br />
eee<br />
so*<br />
ass<br />
see<br />
see<br />
so*<br />
s••<br />
111<br />
2 4-Dlmethylphenol<br />
Di methyl phthalate<br />
Dlnitrobenzene<br />
4,8-0 1 nitro-o-cresol and salts<br />
2,1-Dlnitrophenol<br />
2,f-Dlnitrotoluene<br />
2 6-Dlnitrotoluene<br />
Dl-n-octyl phthalate<br />
Dlphenylamine<br />
1 2-Dlphenyylh[drazlne<br />
Dl-n-proppyl nl ro ssmine<br />
EthylenoW ne<br />
Ethyl methsnssulfonste<br />
Fluoronthen,<br />
Ibsschlorobenzsne<br />
lleaachlorobutadlene<br />
B91 IIEXCCYC ppb<br />
892 HEXCETH ppb<br />
B93 INDENOP ppb<br />
894 ISOSOLE ppb<br />
B96 YALOILE ppb<br />
B98 YELPHAL ppb<br />
891 METHAPY ppb<br />
898 METHNYL ppb<br />
099 YETAZIR ppb<br />
COI YETCHAN ppb<br />
CO2 METBISC ppb<br />
CO3 UETAC70 ppb<br />
COS UETMSUL ppb<br />
COO METPROP ppb<br />
C07 METHIOU ppb<br />
COO NAPUQUI ppb<br />
COO 1-naphs ppb<br />
CIO 2-nspha ppb<br />
C11 HI RANI ppb<br />
C12 NITBENZ ppb<br />
C19 NITPHEN ppb<br />
C14 INIBUTY ppb<br />
CIS NNIDIEA ppb<br />
CIS NNIDIEY ppb<br />
C17 I9II11IME ppb<br />
CI9 INIMETH ppb<br />
CIO 1141URET ppb<br />
C20 INIVINY ppb<br />
C21 I9IIMORP ppb<br />
C22 INIHICO ppb<br />
C23 MIPIPE ppb<br />
C24 UIMPYR ppb<br />
C26 141TRIOL ppb<br />
10<br />
10<br />
10<br />
10<br />
10<br />
10<br />
10<br />
10<br />
10<br />
10<br />
10<br />
10<br />
10<br />
10<br />
]0<br />
10<br />
10<br />
10<br />
60<br />
10<br />
60<br />
10<br />
10<br />
10<br />
10<br />
10<br />
10<br />
10<br />
10<br />
10<br />
10<br />
10<br />
10<br />
1<br />
4<br />
f<br />
4<br />
4<br />
4<br />
d<br />
!<br />
A<br />
4<br />
1<br />
1<br />
f<br />
4<br />
4<br />
f<br />
1<br />
f<br />
f<br />
d<br />
4<br />
4<br />
4<br />
4<br />
9<br />
4<br />
4<br />
f<br />
1<br />
f<br />
!<br />
f<br />
4<br />
4<br />
4<br />
d<br />
4<br />
4<br />
4<br />
d<br />
f<br />
C<br />
4<br />
4<br />
4<br />
4<br />
1<br />
4<br />
1<br />
4<br />
4<br />
4<br />
d<br />
1<br />
4<br />
4<br />
4<br />
9<br />
1<br />
1<br />
4<br />
f<br />
4<br />
4<br />
!<br />
4<br />
see<br />
*so<br />
*so<br />
so*<br />
see<br />
see<br />
*so<br />
111<br />
esa<br />
too<br />
*so<br />
so*<br />
ete<br />
eee<br />
eta<br />
*so<br />
eee<br />
eee<br />
ete<br />
111<br />
eee<br />
eee<br />
so*<br />
so*<br />
so*<br />
too<br />
sos<br />
tes<br />
eee<br />
so*<br />
eta<br />
set<br />
040<br />
liezechlorocyyelopentsdlene<br />
lleaschloroeth *no<br />
Tndsno (1 2,3-cd)pyrene<br />
Iaoofro^s<br />
Mslononitrlle<br />
Yelppholsn<br />
1leths yrllene<br />
Moths onyl<br />
2-Yethylszirldine<br />
3-Methyleholonthrene<br />
4,V-Mathylsnabis(2-chloroonlllne)<br />
2-Ysthyllactonitrllo<br />
Methyl methanesulfonste<br />
2-Methyyl-2-(msthylthlo) proplonsldehyde-<br />
Methyy^lthlouracll<br />
1 ,4-Haphthoqulnone<br />
1-Naphthylsmine<br />
2-Naphthylsmine<br />
p Nltrosnlllne<br />
Nitrobenzene<br />
4-Nitrophenol<br />
N-nitrosodl-n-bgtyylamine<br />
N-nitrosodlethanol amine<br />
H-nitrosodlethyylsmine<br />
H-nitroso4imethylsmine<br />
N-nitrosomethylethylsmine<br />
N-nitroso-o-methrrlurethone<br />
N-nitrosomathylviny ism lne<br />
N-nitrosomorph*line<br />
N-nitrosonornicotine<br />
N-nitr000piperldlne<br />
Nltrosopyrrolldlne<br />
6-Nitro-o-toluldine<br />
.'O O<br />
M m<br />
N ^<br />
o 03<br />
= 03
Constituent<br />
Code Name Unite<br />
C26 PENTCHB ppb<br />
C27 PENTCHN ppb<br />
C2 8 PENTCIP ppb<br />
C2 11 PHENTIN ppb<br />
C30 PRENINE ppb<br />
C31 PHIHEST ppb<br />
toC32 PICOLIN ppb<br />
4 1 *so 2-Picollne<br />
M'O<br />
'O<br />
O<br />
N<br />
I<br />
N<br />
C33 PRONIOE ppb<br />
C RESERPI ppb<br />
C36RESORCI ppb<br />
CIA SAFFOL ppb<br />
C37 TETRCHB ppb<br />
C30 TETRCHP ppb<br />
C40 1 JURAII ppb<br />
C 4 1 IOLIIDTA ppb<br />
C 4 2 OTOLHYD cob<br />
Cal<br />
CIO<br />
C17<br />
CIA<br />
CIO<br />
Coo<br />
caw<br />
C07<br />
Coo<br />
Cal<br />
Table D2-3. Constituent List and Summary of Sampling Results<br />
for the 2101-M Pond, November 1988. (sheet 7 of 12)<br />
------------------------- Conatltuent LIst=WAC 173-303-9006 ---------------------------<br />
Detection Below Drinking Water Standards<br />
Limit Samples Detection Standard Agency Exceeded Full name<br />
10 4 e^ ass Pentachlorobentene<br />
10 d 1 see Pentachloronitrobans<br />
60 1 d see 220 EPAP Pentachlorophenal<br />
10 d d see Phan scetIa<br />
10 1 d *so Phenyl enodl amine<br />
30 f d as* phthalic acid *star*<br />
10 d d ue Pronamide<br />
10 d d see Reserpino<br />
10 1 d see Resorcinol<br />
10 d d so* Ssfrol<br />
10 d d see 1,2,4,6-Te<br />
10 4 d ass 2s3,d,0-Te<br />
10 d d eee Thlurem<br />
10 d d see loluenedla<br />
10 f 1 see o-loluldin<br />
10 d d sae 1,2,4-Trlc<br />
60 4 d see 2,d, 6- 1 rlc<br />
10 d d see 2,45 -Trlc<br />
to d d see O,o,o-trla<br />
10 d d see 5ym-trinit<br />
10 d a * as 7rle(2,3-d<br />
to d 4 eee ansolalppy<br />
10 d d see<br />
C;<br />
10 d d see Bls(2-chic 1014,<br />
to d d *so Kaxachloropropane<br />
3000 d d see Ilydreslne<br />
to d d ass. Ilexechloropheno<br />
10 d d ese lie<br />
10 d 1 set 1,2,3-Trlchlorobe<br />
phtheleae<br />
10 d d *as 1,3,6-Trlchlorobe<br />
to d 1 .ass 1,2,3.4-4trachlo<br />
10<br />
2<br />
30<br />
2<br />
2<br />
2<br />
2<br />
2<br />
10<br />
1000<br />
d<br />
d<br />
4<br />
4<br />
1<br />
d<br />
d<br />
4<br />
6<br />
4<br />
!<br />
d<br />
d<br />
d<br />
f<br />
A<br />
d<br />
d<br />
6<br />
f<br />
*so<br />
see<br />
.o•<br />
•ee<br />
•se<br />
ass<br />
•as<br />
*so<br />
ese<br />
ass<br />
1,2,3,6-tatrachlo<br />
Tatreeth 1 py ro ho<br />
Ch to robnsllat*<br />
Cerbophenothion<br />
Oloulfoton<br />
Dlmuthoata<br />
Uethyl psrathlon<br />
Parathlon<br />
Cyanide<br />
Perchlorate<br />
1000<br />
10000<br />
60<br />
0.1<br />
1000<br />
2000<br />
60<br />
d<br />
1<br />
6<br />
d<br />
e<br />
4<br />
.d<br />
A<br />
1<br />
6<br />
d<br />
e<br />
d<br />
4<br />
see<br />
• so<br />
see<br />
ees<br />
see<br />
see<br />
*so<br />
Sulfide<br />
Kerosene<br />
Ammonlum Ion<br />
Dioxin<br />
Citrus red<br />
Paraldehyde<br />
Strychnine<br />
orobensene<br />
orophonol<br />
ochloride<br />
anion s,<br />
hsnol<br />
hone<br />
hosphorothloate<br />
ens<br />
propyl) phosphate<br />
ropyl) ether<br />
to<br />
CD<br />
;:V O<br />
M m<br />
N ^<br />
o 03<br />
3 CO
Table D2-3. Constituent List and Summary of Sampling Results<br />
for the 2101-M Pond, November 1988. (sheet 8 of 12)<br />
----------------- ------------------------------- Constituent List=VAC 113-303-9906 --------------------------------<br />
Constituent Detection Below Drinklnp Water Standards<br />
Code Name Units Limit Sampl esDetection Standard Agency Exceeded Full name<br />
C92 MALIIYDR ppb 600 1 A s.. Malelc hydraalde<br />
C93 NICOTIN ppb 100 1 4 u. Nlcotl n lc acid<br />
C94 ACRYIDE ppb 10000 1 / s.. 0 EPAP Acrylamlde<br />
COS ALLYLAL ppb 2600 1 1 s.s Allyl alcohol<br />
C97 CHLACET ppb 16000 1 1 ese Chloroseetoldshyyde<br />
COS CHLPROP ppb 1000 1 1 sss 3-Chloroproplonitrile<br />
H03 ET CARD ppb 6000 1 / sss<br />
Ethyl carbona te<br />
1101 MCYAN ppb 200D 1 / so* Ethr/1 cyranid*<br />
1109 ISOBUTY ppb 1000 1 1 sae ISO6ucyl alcohol<br />
H11 PROPYLA ppb 10000 1 / *so a-Propylamin*<br />
1112 PROPYHO ppb 8000 1 1 so* 2-Pro -1-01<br />
' 1 11 6 2 1 6-T ppb 2 1 1 so*<br />
2,1 6-T<br />
H40 Fffl9LI ppb 6 6 6 sss<br />
TWIlum, filtered<br />
vs.. - Indi ca tes all sample are reported as below contractual detection limits<br />
xxx - Indicates that Drinking Co Water Standards were exceeded<br />
O<br />
EPA - b...d on Maximum ntaminant Levels riven In 10 CFR Part 111 (JUIh,1987) tD M<br />
National Primary Drinking Water Re<br />
gulations as amended b 62 FR 21690 < ^<br />
0<br />
EPAR - based on National Interim Primary Drinking Water Rev. I. t cans, y P0<br />
^.. Appendix IV, EPA-670/9-76-003<br />
w EPAP - b as ed on proposed Maximum Contaminant Level Coal& In 60 FR 16936 0 00<br />
EPAS - b as ed on Secondary Maximum Contamin an t Lev el s g iv en In 40 CFR Part 113 = Co<br />
National Secondary Drinking Water Regulations<br />
WDOE - based on odd, tlonal Secondary Maximum Contaminant Levels given In<br />
WAC 248-61, Public Water Supplies
a<br />
^o<br />
0<br />
N<br />
A<br />
^3 ! 0 a `) -7<br />
Table D2-3. Constituent List and Summary of Sampling Results<br />
for the 2101-M Pond, November 1988. (sheet 9 of 12)<br />
Dup I Icete CONWFLD COMMAS PN-LA8 PIIFIELD TOC TOM OL<br />
Well Collection •8@ ie UMho umho PPb PPb<br />
nerve Dete numb•$, 1/70OW ./700W 0.01/8.68 0.1/0.6 8 1000/. 20/.<br />
2711-1 IONOV88 686 671 7.6 6.6 400 24<br />
1 684 686 1.6 6.8 300<br />
2 663 666 6.0 8.6 300 3<br />
1300<br />
^0<br />
3 684 683 7.6 6.6 3<br />
2416 11 23NOVOO 833 8.6<br />
2-916-2 10IMS 263 206 7.6 8.4 200<br />
^7<br />
- 1 262 271 1.8 6.4 300<br />
1<br />
2 282 210 1.8 8.4 300 2<br />
3 202 211 1.6 6.4 1600<br />
7<br />
2-E18-2 22NOV88 267 6.0 200 1<br />
1 280 8.1 3D0 1<br />
2 260 8. 1 300 2<br />
1 280 6.1 X200 8<br />
2-E18-2 23NOV60 278 8.6<br />
2-E18-3 10140V88 232 228 7.8 8.1 400 6<br />
1 232 233 1.8 8.1 600 7<br />
• 2 232 233 1.8 6.1 600<br />
2<br />
8 232 234 1.6 6.1 1600<br />
0<br />
2-918-8 28 40V88 247 8.4<br />
2-Ell-4 08NOV88 270 242 7.8 6.2 600 4<br />
1 271 260 7.8 8.2 800<br />
2<br />
2 - 211 261 6.0 8.2 600 3<br />
3 210 260 6.0 8.2 1600<br />
2<br />
2-E18-4 23NOV88 262 8.4<br />
( O<br />
m m<br />
o 00<br />
= co<br />
I<br />
.^ .a
nv<br />
O<br />
N l<br />
p -7 n y<br />
Table D2-3. Constituent List and Summary of Sampling Results<br />
for the 2101-M Pond, November 1988. (sheet 10 of 12)<br />
Dupl lcate ACEIIRIE At PHA ARSENIC FARSENI BARIUM FBARIUM BETA FCALCIU CALCIUM<br />
Well Col lectlon sampple ppb pCl/L ppb ppb b<br />
[yp<br />
^^yy<br />
name Date namb•r 10/. 4 /16 6/60 6/60 8/1000 6%1000 p6/60 60/. 6o/.<br />
2-EIS-1 I 011OVea 82 3.830 (6 (6 4 2 4 3 9. 4 6 63,200 67, 4 00<br />
lall0Vee 1 32 3.900 (6 (6 38 36 10.70 68, 4 00 61,700<br />
IOil0Ve8 2 13<br />
laltOVea 3 It<br />
23110VOO (10<br />
23ttOV88 M
Table D2-3. Constituent List and Summary of Sampling Results<br />
for the 2101-M Pond, November 1988. (sheet 11 of 12)<br />
Dup l l cat* LEADGF YAC16S FYAGNES MANGESE NICKEL FNICNEL NITRATE FPOTASS<br />
Well Coll4ctlon •.apyl• ppb yppb pyb ppb PPb<br />
PPb PPb<br />
no" 0oto nuw64r 6/60 EO /. 60/. 6/60• 10/. pp" 10/. 600/46000 100/,<br />
2-E16-1 10110V88.
a v0NI<br />
r<br />
V<br />
2-Ele-I 10110V88 112,000 21,600 a-287
av v0NI<br />
Co<br />
Co<br />
Table D2-4. Constituent Lists and Summary of Sampling Results for the<br />
2101-M Pond. February 1989. (sheet 1 of 7)<br />
Constituent List=Contamination Indicator Parameters<br />
Constituent Detection Below Drinklnp Water Standards<br />
Cods Name Units Limit SamPles Detection Standard Agency Exceeded Full name<br />
088 CONDLAB umho 16 0 700 WDOESpeclfle conductance, laboratory<br />
191 CONDFLO umho 1 18 0 100 WDOE Sppecific conductance, field<br />
199 PHFIELD 0.1 10 0 6.6-6.6 EPAS pH, field<br />
201 Pit-LAB 0.01 18 0 6.6-1.6 EPAS ppN laboratory<br />
[69 TOC ppb 2000 16 0 To^.e) organic carbon<br />
H42 TOXLDL ppb 10 le 0 Total organic halogens, low DL<br />
------------------------------ Constituent List=Interim Primary Drinking Water Parameters ----------------------------<br />
Constituent Detection Below Orinking Water Standards<br />
Code Name Units Limit Samples Detection Standard Agency Exceeded Full name<br />
109 COLIFRM MPH 2.2 4 4 see 1 EPA Collform bacteria<br />
111 BETA pCl/L B 6 0 60 EPA gross beta<br />
112 ALPHAHI pCl/L 4 6 0 16 EPA Or •Ipha, high DL<br />
181 RADIUM pCl/L 1 6 0 6 EPA Total radium<br />
A08 BARIUM ppb 6 6 0 1000 EPA Barium<br />
A07 CADMIUM ppb 2 6 6 *as 10 EPA Cadmium<br />
ADS CHROMUM ppb 10 6 0 60 EPA xxx Chromium<br />
AID SILVER ppb 10 6 6 sss 60 EPA Silver<br />
A20 ARSENIC ppb 6 6 1 60 EPA Arsenic<br />
A21 MERCURY ppb 0.1 6 6 ass 2 EPA Mercury<br />
A22 SELENUM ppb 6 6 4 10 EPA Selenium<br />
A33 ENDRIN ppb 0.1 4 4 see 0.2 EPA Endrin<br />
A34 METHLOR ppb 3 4 4 so* 100 EPA Methoxychlor<br />
A36 TOXAENE ppb 1 4 4 ass 6 EPA Toxaphone<br />
A36 a-OHC ppb 0.1 4 4 ass 4 EPA Llndano, alpha-BHC<br />
A37 b-BIIC ppb 0.1 4 4 so* 4 EPA I.None, beta-BHC<br />
A36 -BIIC ppb 0.1 4 4 *so 4 EPA Llndane, gamma-BHC<br />
A39 -BHC ppb 0.1 4 4 *so 4 EPA Llndane, dolts-BHC<br />
A61 LEADGF ppb 6 6 6 sss 60 EPA Lead (graphite furna ce )<br />
C12 NITRATE ppb 600 4 2 46000 EPA Nitrate<br />
C14 FLUORID ppb 600 4 3 4000 EPA Fluoride<br />
H13 2,4-D ppb 2 4 4 see 100 EPA 2,4-0 12,4-Dichlorophenoxyacetic acid]<br />
H14 2 4 6TP ppb 2 4 4 ees 10 EPA 2.4 6-TP silvox<br />
H2O FAAAIUM ppb 6 6 0 1000 EPA<br />
Barium, filtered<br />
U21 FCADMIU ppb 2 6 4 10 EPA Cadmium, filtered<br />
U22 FCRROMI ppb 10 6 6 see 60 EPA Chromium filtered<br />
H23 FSILVER ppb 10 6 6 *so 60 EPA Sllvor. filtered<br />
1137 FARSENI ppb 6 6 1 60 EPA Arsenics filtered<br />
1136 PMERCUR ppb 0.1 6 6 ass 2 EPA Mercury, filtered<br />
H39 FSELENI ppb 6 6 4 10 EPA Selenium filtered<br />
H41 PLEAD ppb 6 6 6 so* 60 EPA Lead filtered<br />
1160 TURBID ntu 0.1 1 0 1 EPA xxx Turbidity, nepholometric<br />
z CD<br />
m m<br />
N ^<br />
o Co<br />
=S Co
D<br />
v<br />
v<br />
N<br />
i 0 7<br />
Table D2-4. Constituent Lists and Summary of Sampling Results for the<br />
2101-M Pond, February 1989. (sheet 2 of 7)<br />
-------------------------------- ------ Constituent List=Oster Quality Par am eters -------------------<br />
Constituent Detection Below Drinking Water Standards<br />
Code Name Unite Limit Samples Detection Standard Agency Exceeded Full name<br />
All SODIUM ppb 200 6 0 Sodium<br />
All MANOESE ppb 6 6 1 60 EPAS Mangan es e<br />
A10 IRON. ppb 30 6 0 300 EPAS was Iron<br />
CIA SULFATE ppb 600 4 0 260000 EPAS Sulfate<br />
C16 CHLORID ppb 600 4 0 260000 EPAS Chloride<br />
H24 FSODIUM ppb 200 6 0 Sodium, filtered<br />
H2 9 FRANOAN ppb 6 6 6 fee 60 EPAS Manganese, filtered<br />
HSI FIRON ppb 30 6 2 300 EPAS Iron, filtered<br />
H61 LPHENOL ppb 10 4 4 foe Phenol, low DL<br />
-------------------------- ------ Constituent Lie L=<strong>Site</strong> Specific and Other Constituents -------------<br />
Constituent Detection allow Drinking mater Standards<br />
Code Name Units Limit S am pl es Detection Standard Agency Exceeded Full na me<br />
101 TRITIUM pCi/L 600 1 0 20000 EPA Tritium (H-3)<br />
A01 BERYLUM ppb 6 6 6 too Beryllium<br />
A03 STRONUM ppb 21 6 0 Strontium<br />
A04 ZINC ppb 6 6 0 6000 EPAS 'Zinc<br />
A06 CALCIUM ppb 60 1 0 Calcium<br />
Al2 NICKEL ppb 10 6 1 Nickel<br />
A13 COPPER ppb 10 6 3 1300 EPAP Copper<br />
A14 VANADUM ppb 6 6 1 Vanadium<br />
Ali ANTIONY ppb 100 6 6 to Antimony<br />
A10 ALUMNUM ppb 160 6 6 tee Aluminum<br />
All POTASUM ppb 100 6 0" Potassium<br />
A60 MAONES ppb 60 6 0 Magnesium<br />
C76 PHOSPHA ppb 1000 4 4 too Phosphate<br />
H10 TC ppb 1000 1 0 Total carbon<br />
H11 FZINC ppb 6 6 0 6000 EPAS Zine! filtered<br />
11 11 FCALCIU ppb 60 6 0 CaIc^ us, filtered<br />
11 26 FNICKEL ppb 10 6 4 Nickel, filtered<br />
H2O FCOPPER ppb 10 6 4 1300 EPAP Copper, filtered<br />
H27 FVANADI ppb 6 6 0 Vanadium, filtered<br />
HIS FALUMIN ppb 160 6 6 efe Aluminum, filtered<br />
H30 FPOTASS ppb t00 6 0 Potessiva, filte re d<br />
H32 FMAONES ppb 60 6 0 Magnesium, filtered<br />
H33 FBERYLL ppb 6 6 6 w Beryllium, filtered<br />
036 FSTRONT ppb 20 6 0 StronLium, filtered<br />
H36 FANTIMO ppb 100 6 6 too Antimony, filtered<br />
MOO BROMIDE ppb 1000 4 4 toe Bromide<br />
H67 NITRITE ppb 1000 4 4 tea Nitrite<br />
A CO<br />
m m<br />
^r<br />
o cu<br />
= m
n v<br />
C3 NI<br />
N CD<br />
Table D2-4. Constituent Lists and Summary of Sampling Results for the<br />
2101-M Pond, February 1989. (sheet 3 of 7)<br />
-------------------------------- Constituent List=Sits Specific and Other Constituents - - - - - - - - - - - - - - - - - - - - - - - - - - - - - - - - .<br />
Constituent Detection Below Drinking titer Standards<br />
Code Name Units Limit Samples Detection Standard Agency Exceeded Full n am e<br />
HBO FBORON ppb 10 6 I Baron, filtered<br />
HSI FCOBALT ppb 20 1 6 eee Cobalt, littered<br />
HIS FLITHI ppb 10 6 6 eee Lithium, filtered<br />
11 66 FNOLY ppb 40 6 6 see Molybdenum, I filtered<br />
090 FSILICO ppb 60 6 0 Sllicoa filtered<br />
Hot FT1N ppb 30 6 6 see<br />
Tin, fi<br />
H92 FTITAN ppb NO 6 6 eee Titanium, filtered<br />
H93 FZIBCON ppb 60 6 6 met Zirconium, filtered<br />
PO1 BORON ppb 10 t 1 Boron<br />
P02 COBALT' 'ppb 20 6 6 see Cobalt<br />
POO LITHIUM ppb 10 6 6 met Lithium<br />
PO4 HOLY ppb 10 6 6 eee Molybdenum<br />
P06 SILICON ppb 60 1 0 Silicon<br />
1, 06 TIN ppb 30 6 6 eee Tim<br />
P07 TITAN ppb s0 6 6 eee Titanium<br />
POs ZIRCON ppb 60 6 6 eee Zirconium<br />
Constituent List=VAC 173-103-9906 Constituents<br />
Constituent Detection Below Drinking later Standards<br />
Cod* Nate Units Limit S am ples Detection Standard Agency Exceeded Full n am e<br />
A01<br />
A02<br />
A04<br />
AS$<br />
As?<br />
Aso<br />
A09<br />
AID<br />
All<br />
Aso<br />
AGO<br />
TETRANE ppb<br />
BENZENE ppb<br />
METHONE ppb<br />
TOLUENE ppb<br />
1,1,1-T ppb<br />
1,1,2-1 ppb<br />
TRICENE ppb<br />
PERCENE ppb<br />
0PXYLE ppb<br />
CHLFORM ppb<br />
1,1-DIC ppb<br />
6<br />
6<br />
10<br />
6<br />
6<br />
6<br />
6<br />
6<br />
6<br />
i<br />
6<br />
1<br />
1<br />
1<br />
1<br />
1<br />
1<br />
1<br />
1<br />
1<br />
1<br />
1<br />
1<br />
1<br />
1<br />
1<br />
1<br />
1<br />
1<br />
1<br />
1<br />
I<br />
1<br />
see<br />
*to<br />
eee<br />
*u<br />
eee<br />
met<br />
eee<br />
met<br />
eee<br />
eee<br />
eee<br />
6<br />
6<br />
2000<br />
200<br />
6<br />
44 0<br />
100<br />
EPA<br />
EPA<br />
EPAP<br />
EPA<br />
EPA<br />
EPAP<br />
EPA<br />
Tot rachI *rose thans [Carbon Tetrachloride<br />
Benzene<br />
Methyl ethyl ketone<br />
Toluene<br />
1, 11 ,1-Trichloroethans<br />
1,1,2-Trichloroethane<br />
Trichicroethylene [1,1,2-Triehloro*thens<br />
Porch loroethyIone Tetrmchloroethenel<br />
Xrlene-o,p<br />
Cdlorofora [Trichloromethane)<br />
1,1-Dichloroethane<br />
Ag o<br />
A91<br />
A23<br />
81 3<br />
1,2-DIC ppb<br />
TRANDCE ppb<br />
METHYCH ppb<br />
YINYIDE ppb<br />
6<br />
6<br />
6<br />
10<br />
1<br />
1<br />
1<br />
1<br />
1<br />
1<br />
1<br />
1<br />
eee<br />
eee<br />
eee<br />
eee<br />
6<br />
71<br />
2<br />
EPA<br />
EPAP<br />
EPA<br />
1,2-Dichloroethane<br />
tuna-11,2-Dichlo ro ethens<br />
Meth^rlene chloride [Dichloromethmns]<br />
Vinyl chloride<br />
B1 4<br />
Coo<br />
M-XYLE ppb<br />
AMMDNIU ppb<br />
6<br />
60<br />
1<br />
1<br />
1<br />
1<br />
eee<br />
eee<br />
110 EPAP Xylons- n<br />
Ammonium Ion<br />
H16<br />
H02<br />
Ho g<br />
101<br />
2,1 6-T ppb<br />
LOYBRAZ ppb<br />
HEXONE ppb<br />
ACETONE ppb<br />
2<br />
30<br />
10<br />
10<br />
t<br />
1<br />
I<br />
1<br />
1<br />
1<br />
1<br />
I<br />
eee<br />
•ae<br />
see<br />
eee<br />
2,1,6-1<br />
Nydrasine low °'OL<br />
Hexne Methyl loobutyl ketone]<br />
Moons by VOA<br />
126<br />
1163<br />
TAF<br />
140DEN<br />
ppb<br />
ppb<br />
10<br />
6<br />
1<br />
1<br />
1<br />
1<br />
eee<br />
see 76 EPA<br />
Tetrahydorfuran<br />
1, 4 -Dichicrobensens [p-DichI archon tone]<br />
toted<br />
0<br />
;U C)<br />
m m<br />
O OD<br />
3 W<br />
^.p<br />
a
Table D2-4. Constituent Lists and Summary of Sampling Results for the<br />
2101-M Pond, February 1989. (sheet 4 of 7)<br />
ese - Indicates all samples were reported as below contractual detection limits<br />
xxx - Indicates that Drinking Water Standards were exceeded<br />
EPA - based on Maximum Contaminant Levels alven In 10 CFR Part 141 Ouly,1987)<br />
National Primary Drinking Water Regulation• as amended by 62 FR 26690<br />
EPAR - based on National Interim Primary Drinking Water Regulations,<br />
Appendix IV, EPA-670/9-711-003<br />
EPAP - booed on proposed Maximum Contaminant Level Goals In 60 FR 11193E<br />
EPAS - booed on Secondary Maximum Contaminant Levels given In 40 CFR Part 143<br />
National Secondary Drinking Water Regulations<br />
WDOE - based on additional Secondary Maximum Contaminant Levels given In<br />
WAC 240-61, Public Water Supplies<br />
a vv 0<br />
z o<br />
0 m m<br />
N<br />
N<br />
O 00<br />
7 On I<br />
.p<br />
H
Y 'o<br />
O<br />
N<br />
N<br />
N<br />
I . 1 3 '1 7<br />
Table D2-4. Constituent Lists and Summary of Sampling Results for the<br />
2101-M Pond, February 1989. (sheet 5 of 7)<br />
Quadruplicate Contamination Indicator Parameters<br />
Duplicate WORD<br />
Well Collection •ample umho<br />
name Oat• number 1/700w<br />
2-E18-1 16FE089 637<br />
1 639<br />
2 632<br />
a 631<br />
2-E18-2' ` ' 16FE889 268<br />
1 268<br />
2 268<br />
3 266<br />
2-E18-3 18FE889 207<br />
1 208<br />
2 206<br />
a 206<br />
2-E18-9 16FE089 298<br />
1 298<br />
2 298<br />
3 240<br />
COHDLAB PH-LAB PHFIELD TOC TOXLDL<br />
umho<br />
./700w 0.01/8.69 0.1/8.60 2000/. 10 /.<br />
619 7.80 7.00 200 6<br />
612 7.60 7.00 200 6<br />
610 7.70 6.90 200<br />
617 7.80 6.90<br />
1200<br />
262 8.10 8.00 600 9<br />
263 8.10 8.00 70o 3<br />
266 8.10 8.00 900 6<br />
268 8.10 8.00 /1000 3<br />
236 8.20 8.00 800 +8<br />
232 8.20 8.00 800 +6<br />
229 8.20 8.00 600<br />
12<br />
230 8.10 8.00 1600<br />
11<br />
228 8.10 7.00 Boo 8<br />
263 8.10 7.00 800 9<br />
281 8.00 7.00 Boo<br />
292 9.00 7.00<br />
logo<br />
0<br />
Is<br />
9<br />
Is<br />
O<br />
zo<br />
m m<br />
w r<br />
o CO<br />
=CO
Regular Monitoring Data<br />
tl dy " '<br />
Table D2-4. Constituent Lists and Summary of Sampling Results for the<br />
2101-M Pond, February 1989. (sheet 6 of 7)<br />
Duplicate ALPNAIII ARSENIC FARSENI BARIUM FBARIUM BETA BORON FBORON FCADMIU<br />
Weil [olfaction •ample PCIA ppb pPb PPb ppb pCl7L pPb PPb PPb<br />
name Data number 4/16 6/60 6/60 6/1000 8/1000 6/60 10/. 10/. 2/10<br />
2-EIS-1 16FEB89 4.670 (6 (6 29 31 8.86 33 38 (2<br />
2-E18-2 IGFEB89 1.720 a a 80 69 6.46 24 18 (2<br />
16FEBOO 1 •1.200 6 a 81 02 0 1.76 13 34 (2<br />
2-EIO-3 ISFEB89 2.420 13 12 62 63 6.12 14 (10 2<br />
2-EIO-4 ISFES89 0 0.879 it 10 61 62 6.66 (10 14 (2<br />
Well<br />
name .<br />
Duplicate FCALCIU CALCIUM CNLORID CNROMUM COPPER FCOPPER FLUORID IRON<br />
Collection<br />
Date nu<br />
:ample pPb pppb PPb ppb PPb<br />
pp<br />
mber 60/. 60/. 600/260000• 10/60 10/1300p 10/1300p %300•<br />
60q/4000 30<br />
2-EIS-1 16FE889 67,600 66,700 6,900 22 (30 (10 (600 162<br />
M . 2-E18-2- 16FEB69 26,300 26,700 4,900 60 12 (10 700 303<br />
18FEBOO 1 28,600 26,400 79 (10 (10 423<br />
U 2-EIO-3 18FEB69 29,800 29,•00 6,600 104 (10 (10 (600 666<br />
i 2-EIO-4 1 6FES69 27,400 27,800 9,600 42 13 11 (600 326<br />
N<br />
W<br />
Dupl lcate FIRON MAGNES FMAGNES MANGESE NICKKpEL FNICKEL NITRATE FPOTASS<br />
p<br />
Well<br />
name ColDotelen number 30/300s gSi. ESi.<br />
3<br />
6iEoa 10/. 10/. 600/46000 1 8Bi.<br />
2-EI8-1 v 16FES89 (30 13,900 14,400 (6 (10 (10 11,400 6,800<br />
2-EIS-2 1 6FE889 39 7,190 7,160 8 26 (10 (600 6,100<br />
laFE8B9 1 40 7,220 7,610 9 40 (10 6,360<br />
2-EIS-3 18FEBOO 41 8,320 6,270 18 64 13 (600 6,310<br />
2-EIS-4 15FE889
Table D2-4. Constituent Lists and Summary of Sampling Results for the<br />
2101-M Pond, February 1989. (sheet 7 of 7)<br />
Duplicate STRONUM SULFATE TC TRITIUM TURBID F9ANADI VANADUM ZINC FZINC<br />
well Collection sampple ppb ppb ppb pCi/L at ppb ppb pPb ppb<br />
na g sDate number 20/. 600/260000• 1000/. 609/20000 0.1/1 6 1. 6/. 6/6000• 6/6000•<br />
2-EIB-1 16FEBOO 210 110,000 23,800 9-66.7 1.1 0 (6 23 30<br />
2-E18-2 I 5 FEB89 118 31,800 2 4 29 21 11<br />
laFEBS9 1 117 21 20 22 20<br />
2-EIS-3 ISFE089 181 12,600 31 32 22 6<br />
2-EIS-1 15FEBBO 160 22,100 22 22 9 9<br />
The column headers consist of : Constituent Nave<br />
Analysis Units<br />
Contractual Detection Limit/Drinking later Standard(suffi x )<br />
v<br />
-O<br />
o<br />
^v<br />
Suffix<br />
none - ba se d on Maximum Contaminant el• y Ivan In /0 CFR Part 141 (Jely,1991)<br />
National Primary Drinking later Low Regulations se am ended b i 62 FR 26600<br />
r - based on National Interim Priesry Drinking later Re 9ulatons,<br />
Appendix IY, EPA-670/9-18-003<br />
'P p - ba g d on proposed Maximum Contaminant Level Goals in 60 FR 10936<br />
a - based on Secondary Maximum Cont am inant Levels given in 10 CFR Part 113<br />
(July, 1997) National Secondary Drinking la ter Regulations<br />
n - ba se d on additional Secondary M ax imum Contaminant Levels given in<br />
1AC 218-61, Public tstar Supplies<br />
Data flaps<br />
( - Less than Contractual Detection Limit, reported as Limit<br />
!<br />
- Lams than Contractual Detection Limit, m ea sured value reported<br />
- For radioacti ve constituents, reported value Is loss than 2-mig as error'<br />
0<br />
;a CD<br />
M m<br />
N ^<br />
0 00<br />
=S 00
Table D2-5. Constituent List and Summary of Sampling Results<br />
for the 2101-M Pond, May 1989. (sheet 1 of 7)<br />
--------------------------- --- --- Constituent List=Contamination Indicator Parameters --------------------------------<br />
Constituent Detection Below Drinkinp Water Standards<br />
Code Name Units Limit Sampl es Detection Standard Agency Exceeded Full name<br />
088 CONDLAB umho 18 0 700 yDOE Specific conductance, laboratory<br />
191 CONDFLD umho 1 18 0 700 WDOE Specific conductance, field<br />
199<br />
207 PHFIELD<br />
0.1 18 0<br />
0.6-8.6 EPAS<br />
pH, field<br />
PH-LAB<br />
0.01 18<br />
0 6.6EPAS<br />
-8.6<br />
V. laboratory<br />
C89 TOC ppb 2000 18 1 Total organic carbon<br />
H42 TOXLDL ,ppb 10 18 0 Total organic halogens, low OL<br />
------------------------ ------ Constituent List=Interim Primary Drinking Water Parameters ----------------------------<br />
Constituent Detection Below DrinkinQ Water Standards<br />
Code Name Units Limit Sampl es Detection Standard Agency Exceeded Full name<br />
n 109 COLIFRM MPN 2.2 4 4 sea 1 EPA Coliform bacteria<br />
111 BETA pCl/L 8 6 0 60 EPA Gross beta o<br />
112 ALPHAHI pCi/L 4 6 0 16 EPA Gross alpha, high DL m m<br />
N 181 RADIUM pCl/L 1 6 0 6 EPA Total radium <<br />
ro<br />
Ln<br />
A00 BARIUM ppb<br />
A07 CADMIUM ppb<br />
ADS CHROMUM ppb<br />
a<br />
2<br />
10<br />
6<br />
6<br />
6<br />
0<br />
6 as•<br />
0<br />
1000 EPA<br />
10 EPA<br />
60 EPA<br />
Barium<br />
Cadmium<br />
Chromium<br />
H r-<br />
-•<br />
° co<br />
AID SILVER ppb<br />
A20 ARSENIC ppb<br />
A21 MERCURY ppb<br />
A22 SELENUM ppb<br />
A33 ENDRIN ppb<br />
A34 METHLOR ppb<br />
A36 TOXAENE ppb<br />
A38 a-BHC ppb<br />
A37 b-BHC ppb<br />
1 0<br />
6<br />
0.1<br />
6<br />
0.1<br />
3<br />
1<br />
0.1<br />
0.1<br />
6<br />
6<br />
6<br />
6<br />
6<br />
6<br />
6<br />
6<br />
6<br />
6 see<br />
1<br />
6 *so<br />
4<br />
6 sea<br />
6 sea<br />
6 see<br />
6 ass<br />
6 eae<br />
60 EPA<br />
60 EPA<br />
2 EPA<br />
10 EPA<br />
0.2 EPA<br />
100 EPA<br />
6 EPA<br />
4 EPA<br />
4 EPA<br />
Silver<br />
Arsenic<br />
Mercury<br />
Selenium<br />
Endrin<br />
Methoxychlor<br />
Toxapheas<br />
Lindane, alpha-BHC<br />
Lindane, beta-BHC<br />
o 00<br />
a<br />
A38 Qp- 811C ppb<br />
A39 d-BHC ppb<br />
A61 LEADGF ppb<br />
C72 NITRATE ppb<br />
C74 FLUORID ppb<br />
H13 2,4-0 ppb<br />
H14<br />
H2O<br />
0.1<br />
0.1<br />
6<br />
600<br />
600<br />
2<br />
6<br />
6<br />
6<br />
6<br />
6<br />
6<br />
6 eee<br />
6 sea<br />
6 aaa<br />
1<br />
3<br />
6 ass<br />
4 EPA<br />
4 EPA<br />
60 EPA<br />
46000 EPA<br />
4000 EPA<br />
100 EPA<br />
Undone, gya mma-BHC<br />
Linden*, delta-BIIC<br />
Lea d (graphite furnace)<br />
Nitrate<br />
Fluoride<br />
2,4-0 ((2,4-Dichlorophonoxyacetic acid)<br />
2,4,6TP<br />
FBARIUM ppb 2 6 6 ppb<br />
H21 FCADMIU ppb<br />
H22 FCHROMI ppb<br />
H23 FSILVER ppb<br />
H37 FARSENI ppb<br />
11 3a FMERCUR ppb<br />
H39 FSELENI ppb<br />
H41 FLEAD ppb<br />
HBO TURBID ntu<br />
0<br />
2<br />
10<br />
10<br />
6<br />
0.1<br />
6<br />
6<br />
0.1<br />
6<br />
6<br />
6<br />
6<br />
6<br />
6<br />
6<br />
6<br />
6<br />
see<br />
0<br />
6 ass<br />
4<br />
6 sss<br />
1<br />
6 sss<br />
4<br />
6 aae<br />
0<br />
10 EPA<br />
1000 EPA<br />
10 EPA<br />
60 EPA<br />
60 EPA<br />
60 EPA<br />
2 EPA<br />
10 EPA<br />
60 EPA<br />
1 EPA xxx<br />
2,4 6-IP silvex<br />
Barium, filtered<br />
Cadmium, filtered<br />
Chromium filtered<br />
Sliver, filtered<br />
Arsenic, filtered<br />
Mercury, filtered<br />
Selenium filtered<br />
Lead il^terad<br />
Turb^dity, nopholometric
D<br />
v 0N<br />
N m<br />
Table D2-5. Constituent List and Summary of Sampling Results<br />
for the 2101-M Pond, May 1989. (sheet 2 of 7)<br />
------- ------------------------- ------ Constituent List=Water Quality Parameters -------------------------<br />
Constituent Detection Below Drinking Water Standards<br />
Code Name Units Limit Samples Detection Standard Agency Exceeded Full name<br />
All SODIUM ppb 200 6 0 Sodium<br />
All MANGESE ppb 6 6 1 60 EPAS Manganese<br />
A19 IRON ppb 30 6 0 300 EPAS xxx Iron<br />
C13 SULFATE ppb 600 6 0 260000 EPAS Sulfate<br />
C76 CHLORID ppb 600 6 0 260000 EPAS Chloride<br />
H24 FSODIUM ppb 200 6 0 Sodium, filtered<br />
H29 FMANGAN ppb 6 6 4 60 EPAS Manganese, filtered<br />
1131 FIRON ppb 30 6 2 300 EPAS Iron, filtered<br />
H67 LPHENOL ppb 10 6 6 ••• Phenol. low OL<br />
---------- ---------------------- Constituent List--<strong>Site</strong> Specific and Other Constituents -------------------<br />
Constltwnt Detection Below Drinklnp Water Standards<br />
Code Name Units Limit Samples Detection Standard Agency Excee ded Full come<br />
A01 BERYLUM ppb 6 6 6 ee• .. Beryllium<br />
A03 STRONUM ppb 20 6 0 Strontium<br />
A04 ZINC ppb 6 6 0 6000 EPAS Zinc<br />
A06 CALCIUM ppb 60 6 0 Calcium<br />
Al2 NICKEL ppb 10 6 0 Nickel<br />
A13 COPPER ppb 10 6 3 1300 EPAP Copper<br />
A14 VAHADUM ppb 6 6 0 Vanadium<br />
A16 ANTIONY ppb 100 6 6 e•• Antimony<br />
A18 ALUMNUM ppb 160 6 6 e•• Aluminum<br />
A18 POTASUM ppb 100 6 0 Potassium<br />
A60 4AGNES ppb 60 6 0 Magnesium<br />
C78 PHOSPHA ppb 1000 6 6 •e• Phosphate<br />
His FZINC ppb 6 6 4 6000 EPAS Zinc filtered<br />
H19 FCALCIU ppb 60 6 0 Calcium, filtered<br />
H26 FNICKEL ppb 10 6 3 Nickel, filtered<br />
1120 FCOPPER ppb 10 6 4 1300 EPAP Copper, filtered<br />
H27 FVANADI ppb 6 6 0 Vanadium, filtered<br />
H28 FALUMIN ppb 160 6 6 •e• Aluminum, filtered<br />
Ha g FPOTASS ppb 100 6 0 - Potassium, filtered<br />
H32 FMAGNES ppb 60 6 0 Magnesium, filtered<br />
H33 FBERYLL ppb 6 6 6 ••• Beryllium, filtered<br />
H36 FSTRONT ppb 20 6 0 Strontium, filtered<br />
H38 FANTIMO ppb 100 6 6 ••• Antimony, filtered<br />
1168 ALKALIN ppb 20000 4 0 Total alkalinity, as cocoa<br />
1188 BROMIDE ppb 1000 6 6 e•• Bromide<br />
11 87 NITRITE ppb 1000 6 6 ••• Nitrite<br />
1188 FBDflDN ppb 30 6 I Boron, filtered<br />
1187 FCOBALT pp b 20 6 6 •e• Cobalt, filtered<br />
0<br />
zo<br />
m m<br />
r<br />
r<br />
O co<br />
co<br />
i<br />
^.a
n vv<br />
0<br />
N<br />
N<br />
V<br />
Table D2-5. Constituent List and Summary of Sampling Results<br />
for the 2101-M Pond, May 1989. (sheet 3 of 7)<br />
-------------------------------- Constituent List=<strong>Site</strong> Specific and Other Constituents ------------<br />
Constituent Detection Below Drinklnp Water Standards<br />
Code Name Units Limit Samples Detection Standard Agency Exceeded Full name<br />
HBO FLITHIU ppb 10 6 6 see Lithium, filtered<br />
1189 FNOLY ppb 40 6 6 see Molybdenum filtered<br />
H90 FSILICO ppb 60 6 0 Silicon filtered<br />
H91 FTIN ppb 30 6 6 ass Tin,<br />
filtered<br />
H92 FTITAN ppb 80 6 6 *so Titanium, filtered<br />
H93 FZIRCON ppb 6O 6 6 see Zirconium, filtered<br />
P01 BORON ppb 10 6 0 Boron<br />
P02 COBALT ppb 20 6 6 sss Cobalt<br />
P03 LITHIUM ppb 10 6 6 sss Lithium<br />
PO4 HOLY -'ppb 40 6 6 •e• Molyybdenum<br />
POS SILICON ppb 60 6 0 Silicon<br />
P08 TIN ppb 30 6 6 *so Tin<br />
P07 TITAN ppb 80 6 6 *as Titanium<br />
POS ZIRCON ppb 60 6 6 ess Zirconium<br />
Constituent List=WAC 173-303-9906 Constituents<br />
Constituent Detection Below Drinkin3 Water Standards<br />
Code Name , Units Limit Samples Detection Standard Agency Exceeded Full name<br />
A81 TETRANE ppb 6 1 1 •se 6 EPA Totrachloromothane [Carbon Tetrachloride<br />
A82 BENZENE ppb 6 1 1 ess 6 EPA Benzene<br />
A64 METHONE ppb 10 1 1 ess Methyl ethyl ketone<br />
A8S TOLUENE ppb 6 1 1 *so 2000 EPAP Toluene<br />
A87 1,1,1-T ppb 6 1 1 see 200 EPA 1,1,1-Trlchloroethane<br />
A88 1,1 2-T ppb 6 1 1 see 1,1,2-Trlchloroethane<br />
A89 TRIEENE ppb 6 1 1 *as 6 EPA Trichloroethylone [1,1,2-Trlchloroethane<br />
A70 PERCENE ppb 6 1 1 ees Perchloroathyleno [Totrachloroothene]<br />
All OPXYLE ppb 6 1 1 *as 410 EPAP Xyy lone-o,p<br />
AOO CHLFORM ppb 6 1 1 eee 100 EPA Chloroform [Trichloromethano]<br />
AB9 1,1-DIC ppb 6 1 1 eee I,I-Dichloroothane<br />
A90 1 2-DIC ppb 6 1 1 eee 6 EPA 1,2-Olchloroothane<br />
A91 TAANDCE ppb 6 1 1 eee 70 EPAP trans- l,2-Dichloroethene<br />
A93 METHYCH ppb 6 1 1 ese Methylens chloride [Dichloromethano]<br />
813 VINYIDE ppb 10 1 1 •e• 2 EPA Vinyl chloride<br />
814 M-XYLE ppb 6 1 1 •e• 440 EPAP Xylene-m<br />
HIS 2,4,6-T ppb 2 6 6 eee 2,4,6-T<br />
H88 HEXONE ppb 20 1 1 eee Hexon• [Methyl Lsobutyl ketone]<br />
101 ACETONE ppb 10 1 1 ese Acetone by VOA<br />
I28 TAF ppb 10 1 1 eee Tetrahydorfuran<br />
L83 14DBEN ppb 6 1 1 eee 76 EPA 1,1-Dichiorobenzene Cp-Dichlorobenzone]<br />
CD m<br />
CD m<br />
N r-<br />
7 N<br />
I<br />
H ?
Table D2-5. Constituent List and Summary of Sampling Results<br />
for the 2101-M Pond, May 1989. (sheet 4 of 7)<br />
eea - Indicates all samples were reported as below contractual detection limits<br />
aas - Indicates that Drinking Water Standards wore exceeded<br />
EPA - based on Maximum Contaminant Levels given In 10 CFR Part 141 (July,1987)<br />
National Primary Drinking Water Re ulatlons as amended by 62 FR 26690<br />
EPAR - based on National Interim Primary gulations,<br />
Drinking Water Re<br />
Appendix IV, EPA-670/9-76-003<br />
EPAP - based on proposed Maximum Contaminant Level Goals In 60 FR 46936<br />
EPAS - based on Secondary Maximum Contaminant Levels given In 40 CFR Part 113<br />
National Secondary Drinking Water Regulations<br />
WDOE - based on addit tonal Secondary Maximum Contaminant Levels given In<br />
WAC 246-61, Public Water Suppliss<br />
a 0<br />
v z O<br />
m m<br />
O N rn r<br />
N o m<br />
Co 7 W I<br />
.p
D v<br />
v<br />
0N<br />
1<br />
N<br />
Table D2-5. Constituent List and Summary of Sampling Results<br />
for the 2101-M Pond, May 1989. (sheet 5 of 7)<br />
Quadruplicate Contamin at ion Indicator Parameters<br />
DuPIIcate CONDFLD CONOLAO PH-LAO PHFIELD TOC TOXLDL<br />
Wall Collection sample umho umho PPb PPb<br />
name Date number 1/700w . 1700w 0.01/8.6 0 0.1/8.6s 2000/. 10/.<br />
2-E18-1 28WYS9 660 603 8.00 7.89 1600 14<br />
1 649 474 8.00 7.89<br />
2 649 484 8.00 7.89 X300 13<br />
3 649 498 8.00 7.89 1800 13<br />
2-E19-2 OIJUN89 244 247 8.10 7.46 1400 16<br />
1 244 223 6.10 7.48 1800 14<br />
2 243 249 9.10 7.48 1600 12<br />
3 244 262 8.10 7.48 1400 13<br />
2-E19-3 O1J1N89 178 183 8.10 7.39 600 11<br />
I 178 178 8.20 7.40 600<br />
2 178 176 9.10 7.40 400<br />
21<br />
3 178 201 9.20 7.41 1400<br />
16<br />
2-E18-4 20WY89 266 208 9.20 8.06 900 6<br />
1 266 282 8.10 8.06 900 17<br />
2 266 294 8.10 8.06 11000 12<br />
3 266 293 8.10 8.06 1900 18<br />
0<br />
ID m<br />
N ^<br />
O W<br />
^ tb<br />
^a
a v-o<br />
0<br />
N 1<br />
w<br />
0<br />
Well<br />
name<br />
2-EIS-1<br />
2-EIS-2<br />
2-EIS-3<br />
2-EIS-1<br />
Dupllcat<br />
Collection sample<br />
Date lumber<br />
20MAYSO<br />
OIJUN89<br />
01"89<br />
•AIJUNB9 1<br />
28MAYSO<br />
Well Collection<br />
name Date<br />
2-EIS-1 25MAYBO<br />
2-E18-2: 01JON89<br />
2-EIS-3 01JUN89<br />
OIJUN89<br />
2-EIS-4 26MAY89<br />
Table D2-5. Constituent List and Summary of Sampling Results<br />
for the 2101-M Pond, May 1989. (sheet 6 of 7)<br />
Regular Monitoring Data<br />
- Daplicat ALKALIN ALPHAIII ARSENIC FARSENI BARIUM FBARIUM BETA<br />
Well Collection temple PPb pCi/L PPb PPb ppb ppb pCi/L<br />
name Date number 20000/. 4/16 6/60 6/60 6/1000 8/1000 8/60<br />
2-EIB-1 26MAY89 102,000 6.630 (6 (6 26 26 8.68<br />
2-EIS-2 OIJUN89 90,600 3.010 7 6 61 68 1.70<br />
2-EIG-3 OIJUNB9 98,800 0.931 14 11 63 66 6.81<br />
OIJUHRS 1 1.100 13 13 63 68 - 6.36<br />
2-EIS-4, 28MAYSS 106,000 2.330 11 12 67 67 8.08<br />
Dupllcat FCALCIU CALCIUM CHLORID FCHROMI CBROMUM COPPER FCOPPER<br />
Well Collection sample pPb pPb PPb Pb PPb PPb PPb<br />
As" Data number 60/. 60/. 600/260000s 10/60 30/60 30/1300p 10/1300p<br />
2-EIS-1 28MAY89 60,(00 68,000 7,100 (10 20 (10 (10<br />
2-EIS-2, OIJUNB9 28,300 27,700 8,000 (10 28 16 (10<br />
2-EIB-3 OIJUNS9 28,600 27, Boo 7,000 (10 30 (10 (10<br />
OIJUN89 1 27,900 27,700 8,900 12 36 (10 (10<br />
2-E18-4 26MAYSO 31,700 31,800 14,600 (10 21 18 11<br />
Dupl lcst FPOTASS POTASUM RADIUM FSELENI SELENUM FSILICO<br />
sample pb Ppb pCi/L ppb PPb PPb<br />
number 100/. 100/. 1/6 6/10 6/10 60/.<br />
6,810 6,780 0.4710 7 8 16, 400<br />
1,790 6,160 .0.0416' (6 (6 18,300<br />
6,060 4, 980 0.2620 (6 (6 18,100<br />
1 6,010 6,100 0.1380 (6 (6 17,600<br />
6,980 6,190 .0.1470 (6 (S 17,800<br />
80RON FBORON<br />
ppb PPb<br />
10/. 10/.<br />
37 34<br />
19 23<br />
IB (10<br />
13 11<br />
17 IB<br />
FLUORID<br />
600/4000<br />
600<br />
700<br />
(600<br />
(600<br />
(600<br />
IRON FIRON MAGUES FMAGNES FMANGAN MANOESE NICKEL FNICKEL NITRATE<br />
30%3002 30/300s 60/. 60/. 6/608 6%602 30%. 10/. 600/46000<br />
646 (30 14,800 16,100 (6 12<br />
121 (30 7,800 7,110 (6 9<br />
284 39 7,720 7,710 (6 7<br />
294 31 7,790 7,600 (6 1<br />
121 32 8,860 9,360 8 (6<br />
13 (10 12,000<br />
11 (10 Goo<br />
21 12 600<br />
22 (10 (600<br />
12 17 1,000<br />
SILICON SODIUM FSODIUM<br />
60/. 200/. 200/.<br />
16,000 27,800 28,600<br />
19,800 18,700 17,100<br />
17, Boo 6,710 6,980<br />
18,100 6,930 6,890<br />
18,300 8,790 31,400<br />
z°o<br />
m m<br />
N ^<br />
0 00<br />
= 00<br />
r-. A
Table D2-5. Constituent List and Summary of Sampling Results<br />
for the 2101-M Pond, May 1989. (sheet 7 of 7)<br />
Duplicate FSTRONT STRONUM SULFATE TURBID FVANADI VANADUM ZINC FZINC<br />
Wall Collectionsample ppb ppb ppb ntu ppb ppb ppb ppb<br />
name Dot* number 20/. 20/. 600/260000• 0.1/1 6/. 6/. 6/6000 0 6/6000s<br />
2-E18-1- 28MAYSS 268 267 161,000 18.6 2 1 8 30^ 12<br />
28MAYSO 1 4 19,2<br />
2-E18-2 OIJUN89 117 161 11,000 0.9 26 27 10 (6<br />
2-E18-3 OIJUN89 118 118 12,600 3.0 36 31 22 (6<br />
OIJUN89 1 113 119 12,800 31 29 9 (6<br />
2-E18-1 .2811AY89 171 173 36,100 1.4 26 27 a (6<br />
The column headers consist of Constituent Name<br />
Analy a is Units<br />
Contractual Detection Limit/Drinking Water Standard(suffix)<br />
Suffix<br />
v<br />
.o none - based on Maximum Contaminant Levels given In 40 CFR Part 111 (July,1987)<br />
National Primary Drinking Water Regulations as amended by 62 FR 26890<br />
o<br />
:v<br />
r - based on National Interim Primary Drinking Water Regulations,<br />
Appendix IV, EPA-670/9-78-003<br />
w p - b as ed onyroposed Maximum Contaminant Level Coals In 60 FR 18938<br />
'-' a - based on Secondary Maximum Contaminant Levels given In 10 CFR Part 113<br />
(July, 1987) National Secondary Drinking Water Regulations<br />
r - based on additional Secondary Maximum Contaminant Levels given in<br />
WAC 218-61, Public Water Supplies<br />
Data flags<br />
- Less than Contractual Detection Limit, reported as Limit<br />
- Less than Contractual Detection Limit, measured value reported<br />
• - For radioactive constituents, reported value Is less than 2-sigma error<br />
^°o<br />
M m<br />
N ^<br />
o cv<br />
3 CO<br />
I
Constituent<br />
Code Name Units<br />
068 CONDLAB umho<br />
191 CONOFLD umho<br />
199 PHFIELD<br />
207 PH-LAB<br />
C69 Inc ppb<br />
H42 TOXLDL ppb<br />
Constituent<br />
Code Name Units<br />
a<br />
M<br />
0<br />
N<br />
109 CGLIFRM HPN<br />
111 BETA pCl/L<br />
112 ALPHAHI pCl/L<br />
161 RADIUM pCl/L<br />
A08 BARIUM ppb<br />
A07 CADMIUM ppb<br />
ro A08 CHROMUM ppb<br />
AID SILVER ppb<br />
A20 ARSENIC ppb<br />
A22 MERCURY ppb<br />
A22 SELENUM ppb<br />
A33 ENDRIN ppb<br />
A34 METHLOR ppb<br />
ASS TOXAENE ppb<br />
A38 a-BHC<br />
A37 b-BHC<br />
A38 pp-B11C<br />
A39 d-BHC<br />
ppb<br />
ppb<br />
ppb<br />
ppb<br />
-<br />
A61 LEADGF ppb<br />
C72 NITRATE ppb<br />
04 FLUORID ppb<br />
H13 2,4-D ppb<br />
H14 2 4 6TP<br />
FhAIUM ppb<br />
H2O ppb<br />
H21 FCADMIU ppb<br />
H22 FCHROMI ppb<br />
H23 FSILVER ppb<br />
H37 FARSENI ppb<br />
H38 FMERCUR ppb<br />
H39 FSELENI ppb<br />
H41 FLEAD ppb<br />
HBO TURBID ntu<br />
P19 COLIMF IOOmL<br />
Table 02-6. Constituent Lists and Summary of Sampling Results<br />
for the 2101-M Pond, August 1989. (sheet 1 of 7)<br />
---------- -- Constituent List=Contamination Indicator Parameters ---------------------------------<br />
Detection Below Dr ink ln® Water Standards<br />
Limit Samples Detection Standard Agency Exceeded Full name<br />
16 0 700 WDOE Specific conductance, laboratory<br />
1 18 0 700 NDOE Sppecific conductance, field<br />
0.1 16 - 0 8.6 EPAS pH, field<br />
0.01 16 0 8.6 EPAS P11, laboratory<br />
2060 18 0 Total organic carbon<br />
10 16 0 Total organic halogens, low DL<br />
--------- Constituent List=Interlm Primary Drinking Water Parameters -----------------------------<br />
Detection Below Drinkinp Water Standards<br />
Limit Samples Detection Standard Agency Exceeded Full name<br />
2.2 3 3 so* 1 EPA Collform bacteria<br />
8 6 0 60 EPA Gross beta<br />
4 6 0 16 EPA Gross alpha, high DL<br />
1 6 0 6 EPA Radlum, total<br />
8 6 0 1000 EPA Barium<br />
2 6 6 sea 10 EPA Cadmium<br />
10 6 0 60 EPA xxx Chromium<br />
30 6 6 •se 60 EPA Silver<br />
6 6 1 60 EPA Arsenic<br />
0.1 6 6 sse 2 EPA Mercury<br />
6 6 4 10 EPA Selenium<br />
0.1 4 4 sse 0.2 EPA Endrin<br />
3 4 4 as* 100 EPA Msthoxychlor<br />
1 4 4 ess 6 EPA Toxaphene<br />
0.1 4 4 sss 4 EPA Lindane, alpha-BHC<br />
0.1 4 4 see 4 EPA Lindane, beta-BHC<br />
0.1 4 4 *so 4 EPA Lindane, gamma-BHC<br />
0.1 4 4 sss 4 EPA Lindane, delta-BHC<br />
6 6 6 *so 60 EPA Lead (graphite furnace)<br />
600 6 2 46000 EPA Nitrate<br />
600 6 3 4000 EPA Fluorkde<br />
2 4 4 se ► 100 EPA 2,4-D 2,4-Dichlorophenoxyacetic acid)<br />
2 4 4 so* 10 EPA 2,4 6- P $I vex<br />
8 6 0 1000 EPA Barium, filtered<br />
2 6 6 *so 10 EPA Cadmium, filtered<br />
10 6 6 see 60 EPA , Chromium filtered<br />
10 6 6 ess 60 EPA Silver, filtered<br />
6 6 1 60 EPA Arsenic, filtered<br />
0.1 6 6 see 2 EPA Mercury, filtered<br />
6 6 4 10 EPA Selenium filtered<br />
6 6 6 see 60 EPA<br />
Lead filtered<br />
0.1 4 0 1 EPA xxx Turbidity, neEhelometric<br />
1 1 0 1 EPA Collform (Membrane Filter)<br />
0<br />
M m<br />
w r<br />
0 0<br />
= Cn<br />
—a
a vv<br />
0N i<br />
w w<br />
Table D2-6. Constituent Lists and Summary of Sampling Results<br />
for the 2101-M Pond, August 1989. (sheet 2 of 7)<br />
Quadruplicate Contamination Indi ca tor Parameters<br />
Duplicate CONDFLD CONOLA 13 PH-LAB PHFIELD<br />
Well Collection Sample umho umho<br />
name Date number 1/700w ./700w 0.01/8.64 0.1/8.68<br />
2-E18-1 OBAUG89 684 633 8.00 7.89<br />
1 681 632 8.00 1.89<br />
2 688 634 8.00 7.88<br />
3 687 636 8.00 7.88<br />
2-EIS-2 IIAUG89 288 286 7.90 8.01<br />
1 286 204 8.00 8.00<br />
2 286 288 8.00 8.00<br />
3 288 286 6.00 8.00<br />
2-E18-3 08AUG89 168 232 8.10 8.20<br />
1 168 233 8.10 8.20<br />
2 168 232 8.10 8.20<br />
3 167 234 0.20 8.20<br />
2-EIS-4 OBAUG89 171 263 8.00 8.09<br />
1 171 264 8.10 8.08<br />
2 171 264 8.00 8.08<br />
3 171 261 8.10 8.09<br />
WeiI<br />
name<br />
2-EIS-1i<br />
2-E18-21<br />
2-E18-3 3<br />
2-EIB-4<br />
Wall<br />
name<br />
2-E18-1<br />
2-EIS-2<br />
2-EIS-3<br />
2-E18-4<br />
Duplicate ALKALIN<br />
Collection sample ppb<br />
Data number 20000/.<br />
OSAUG89 108,000<br />
11AUG89 90,000<br />
OBAU4089 98,000<br />
08AUG89 106,000<br />
OSAUG89 1<br />
Duplicate BORON<br />
Collection n am I• ppb<br />
Data number 10/.<br />
OBAUG89 38<br />
11AUG89 19<br />
OBAUG89 13<br />
08AUG89 16<br />
OBAUG89 1 16<br />
Regular Monitoring Data<br />
ALPHAHI ARSENIC FARSENI BARIUM FBARIUM<br />
ppb ppb ppb<br />
p16<br />
pb<br />
4/15 6/60 6/1000 8/1000<br />
6.630 (6
X 1I<br />
;<br />
,9.?<br />
Table D2-6. Constituent Lists and Summary of Sampling Results<br />
for the 2101-M Pond, August 1989. (sheet 3 of 7)<br />
------- Constituent List=<strong>Site</strong> Specific and Other Constituents ----------<br />
Constituent Detection Below Drinkin WitterStandards<br />
Code Name Units Limit Samples Detection Standard Agency Exceeded Full name<br />
H69 FMOLY ppb<br />
H90 FSILICO ppb<br />
1191 FTIN ppb<br />
1192 FTITAN ppb<br />
H93 FZIRCOH ppb<br />
POI BORON ppb<br />
P02 COBALT ppb<br />
P03 LITHIUM ppb<br />
PO4 HOLY ppb<br />
POE; SILICON ppb<br />
POO TIN — 'ppb<br />
P07 TITAN ppb<br />
Poe ZIRCON ppb<br />
40<br />
60<br />
30<br />
80<br />
60<br />
10<br />
20<br />
10<br />
40<br />
60<br />
30<br />
60<br />
60<br />
6<br />
6<br />
5<br />
6<br />
6<br />
6<br />
6<br />
6<br />
6<br />
6<br />
6<br />
6<br />
6<br />
6 see<br />
0<br />
6 see<br />
6 ass<br />
5 ese<br />
0<br />
6 sea<br />
6 *as<br />
6 see<br />
0<br />
6 see<br />
6 see<br />
6 *so<br />
.•<br />
Molybdenum filtered<br />
Silicon filtered<br />
Tin, filtered<br />
Titanium, filtered<br />
Zirconium, filtered<br />
Boron<br />
Cobalt<br />
Lithium<br />
Molyybdenum<br />
Silicon<br />
Tin<br />
Titanium<br />
Zirconium<br />
-o<br />
r`3<br />
--------------------------- Constituent List=WAC 173-303-9906 Constituents ------------------------------------<br />
Constituent Detection Below Drinking Water Standards m \<br />
Code Name Units Limit Samples Detection Standard Agency Exceeded Full name<br />
Ito r<br />
Wp A81 TETRANE ppb 5 1 1 ses 6 EPA Tetrachloromethane [Carbon Tetrachloride<br />
o<br />
A82 BENZENE ppb 6 1 1 ass 6 EPA Benzene<br />
A64 METHONE ppb 10 1 1 see Methyl ethyl ketone<br />
A88 TOLUENE ppb 6 1 1 *so 2000 EPAP Toluene<br />
A67 1,1,1-T ppb 5 1 1 ass 200 EPA 1,1,1-Trichloroothans `J<br />
A68 1 1 2-T ppb 6 1 1 ees 1,1,2-Trichloroethane<br />
A59 7AIIENE ppb 6 1 1 see 6 EPA Trlchloroethylene 1,1,2-Trichloroethene<br />
A70 PERCENE ppb 6 1 1 so* Perchloroothylens [Tetrtchloroethene]<br />
AllOPXYLE ppb 6 1 1 see 440 EPAP Xyylane-*,p<br />
Ago CNLFORM ppb 6 1 1 see 100 EPA CAloroform [Trichlorossethans]<br />
ASO 1,1-DIC ppb 6 1 1 ses 1,1-Dlchloroethans<br />
A90 1,2-DIC ppb 6 1 1 sea i EPA 1,2-Dichloroethans<br />
A91 TRANDCE ppb 6 1 1 so* 70 EPAP trans-1,2-Dichloroethene<br />
A93 METHYCH ppb 6 1 1 ses Methylene chloride [Olchloromethene]<br />
013 VINYIDE ppb 10 1 1 ese 2 EPA Vinyl chloride<br />
B14 M-XYLE ppb 6 1 1 ses 440 EPAP Xylene-m<br />
COO AMMONIU ppb 60 1 1 *so A monlym Ion<br />
NIS 2,4 6-T ppb 2 4 4 ees 2,4,6-T<br />
H82 LHYdRAZ ppb 30 1 1 ass Hydrazine, low DL<br />
Has HEXONE ppb 10 1 1 eee Haxone [Methyl isobutyl ketone]<br />
101 ACETONE ppb 10 1 1 so* A. ton* by VOA<br />
I211 TAP ppb 10 1 1 ass Tetrahydrofuran<br />
L83 14DOEN ppb 6 1 1 so* 76 EPA 1,4-D lchlorobenzene [p-Dichlorobsnzeno]<br />
- Indicates all samples were reported as below contractual detection limits<br />
xxx - Indicates that Drinking water star arch- were exceedttl<br />
EPA - based on Maxima Contaminant Levels in 40 CFR Part 141, Rational Primary Drinking Mater Regulations<br />
EPAR - based on Rational interim Primary Drinking Rater 8egutatimus, Appendix IV, EPA-570/9-76-003<br />
EPAP - based on proposed Maxima Contaminant Levet Goals in 50 fR 46936<br />
EPAS - based on Secondary Maxi" Contaminant Levels in 40 CFR Part 143, National Secondary Drinking tester Regulations<br />
DOE - based on Derived Concentration Guides in draft DOE ardor 5400.xx
Table D2-6. Constituent Lists and Summary of Sampling Results<br />
for the 2101-M Pond, August 1989. (sheet 4 of 7)<br />
Constituent List=Water quality Parameters<br />
Constituent Detection Below Drinking Water Standards<br />
Code Name Units Limit Samples Detection Standard Agency Exceeded Full name<br />
All SODIUM ppb 200 6 0 Sodium<br />
All MANGESE ppb 6 6 1 60 EPAS Manganese<br />
A18 IRON ppb 30 6 0 300 EPAS ,xxx Iron<br />
C73 SULFATE ppb 600 6 0 260000 EPAS Sulfate<br />
C76 Ci1LORID ppb 600 6 0 260000 EPAS Chloride<br />
H24 FSODIUM ppb 200 6 0 Sodium, filtered<br />
U28 FMANGAN ppb 6 6 4 60 EPAS Manganese, filtered<br />
1-131 FIRON ppb 30 6 3 EPAS Iron, filtered<br />
HSI LPHENOL ppb 10 4 ! *so Phenol, low DL<br />
-------------------------- ------ Constituent Llat=<strong>Site</strong> Specific and Other Constituents ------------------------------<br />
v<br />
IV<br />
Constituent<br />
Code Name Units<br />
Detection<br />
Limit Samples<br />
Below<br />
Detection<br />
Drinking Water Standards<br />
Standard Agency Exceeded Full name<br />
o<br />
;ao<br />
G) m<br />
CD<br />
ro<br />
to<br />
108 TRITIUM pCl/L<br />
A01 BERYLUM ppb<br />
A03 STRONUM ppb<br />
A04 ZINC ppb<br />
A06 CAL I M ppb<br />
Al2 NICKEL ppb<br />
A13 COPPER ppb<br />
A14 VAUADUM ppb<br />
A16 ANTIONY ppb<br />
A18 ALUMNUM ppb<br />
A18 POTASUM ppb<br />
A60 MAGNES ppb<br />
C78 PHOSPHA ppb<br />
H18 TC ppb<br />
H10 FZINC ppb<br />
H18 FCALCIU ppb<br />
H26 FNICKEL ppb<br />
H28 FCOPPER ppb<br />
H27 FVANADI ppb<br />
N28 FALUMIN ppb<br />
Hso FPOTASS ppb<br />
H32 FMAGNES ppb<br />
N33 FBERYLL ppb<br />
H36 FSTRONT ppb<br />
H36 FANTIMO ppb<br />
H68 ALKALIN ppb<br />
H88 BROMIDE ppb<br />
H67 NITRITE ppb<br />
N88 FBORON ppb<br />
H87 FCOBALT ppb<br />
H88 FLITHIU ppb<br />
600<br />
6<br />
30<br />
6<br />
60<br />
10<br />
10<br />
6<br />
100<br />
160<br />
100<br />
60<br />
3000<br />
1000<br />
6<br />
.60<br />
10<br />
10<br />
6<br />
160<br />
100<br />
60<br />
6<br />
10<br />
100<br />
20000<br />
1000<br />
1000<br />
10<br />
20<br />
10<br />
4<br />
6<br />
6<br />
6<br />
6<br />
6<br />
6<br />
6<br />
6<br />
6<br />
6<br />
6<br />
6<br />
1<br />
6<br />
6<br />
6<br />
6<br />
6<br />
6<br />
6<br />
6<br />
6<br />
6<br />
6<br />
4<br />
6<br />
6<br />
6<br />
6<br />
6<br />
D<br />
6 *so<br />
0<br />
0<br />
0<br />
0<br />
6 see<br />
0<br />
6 •ss<br />
6 •ss<br />
0<br />
0<br />
6 sss<br />
0<br />
0<br />
0<br />
4<br />
4<br />
0<br />
6 sss<br />
0<br />
0<br />
4<br />
0<br />
6 so*<br />
0<br />
6 •s•<br />
6 sss<br />
0<br />
6 •ss<br />
6 sss<br />
-<br />
20000 EPA<br />
6800 EPAS<br />
1300 EPAP<br />
.<br />
6000 EPAS<br />
1300 EPAP<br />
Tritium (H-3)<br />
Beryllium<br />
Strontium<br />
Zinc<br />
Calcium<br />
Nickel<br />
Copper<br />
Vanadium<br />
Antimony<br />
Aluminum<br />
Potassium<br />
Magnesium<br />
Phosphate<br />
Total carbon<br />
Zinc t filtered<br />
Calcium, filtered<br />
Nickel, filtered<br />
Copper, filtered<br />
Vanadium, filtered<br />
Aluminum, filtered<br />
Potassium, filtered<br />
Magnesium, filtered<br />
Beryllium, filtered<br />
Strontium, filtered<br />
Antimony, filtered<br />
Total alkalinity, as CaCO3 (Method 8)<br />
Bromide<br />
Nitrite<br />
Boron, filtered<br />
Cobalt, filtered<br />
Lithlum, filtered<br />
u,<br />
0 m<br />
C U<br />
,.., I
1) 1 1<br />
1 fl<br />
1<br />
0 7 1<br />
Table D2-6. Constituent Lists and Summary of Sampling Results<br />
for the 2101-M Pond, August 1989. (sheet 5 of 7)<br />
Duplicate HOPPER FLUORID IRON FIRON MAGNES FMAGNES FMANGAN MANGESE .<br />
Well Collection sampple ppb ppb ppb ppb ppb ppb ppb ppb<br />
name Date numbor 10/1300p 500/4000 30/300. 30/.* 60/. 60/. 6/60s 6/603<br />
2-EIS-1 08AUG89
n v0NIwV<br />
9 1 1 •: f ' ) 7" 2<br />
Table D2-6. Constituent Lists and Summary of Sampling Results<br />
for the 2101-M Pond, August 1989. (sheet 6 of 7)<br />
Constituent<br />
Code, Name. Units (b)n df tc<br />
Standard<br />
Average rage Deviation Critical Mean<br />
Conductivity, field<br />
pmho/cm 4 3 11.984 528.4 39.1 1,052.9<br />
pH, field 4 3 15.145 7.804 0.657 [3.316,18.9231<br />
Total Organic Carbon,<br />
ppb 4 3 11.984 387.6 156.2 2,480.5<br />
Total Organic<br />
Halogens, ppb 4 3 11.984 3.59 0.99 16.8<br />
(a) Background data collected between August 1988 and June 1989.<br />
(b) The following abbreviations are used in this table:<br />
df . Degrees of freedom (n-1).<br />
n - Number of background replicate averages.<br />
ppb = Parts per billion.<br />
tc - Bonferroni critical t-value for appropriate df and 16 comparisons<br />
(4 parameters * 4 wells).<br />
{mho/cm - Micromho per centimeter<br />
^o<br />
m m<br />
,n r<br />
0 00<br />
^00
av<br />
vN<br />
co<br />
co<br />
Table D2-6. Constituent Lists and Summary of Sampling Results<br />
for the 2101-M Pond, August 1989. (sheet 7 of 7)<br />
Constituent Well Sample Replicate Standard Coefficient<br />
Code Name Unite Name Date Reps Average Dev iation Yin l mum Maximum of Variation<br />
088 CONDLAB umho 2-EIB-1 08AUG89 4 634 1.3 632 636 0.2<br />
2-EIS-2 IIAUG99 4 286 2.1 284 208 0.7<br />
2-EIG-3 08AUG09 4 233 1.0 232 234 0.4<br />
2-EIB-4 08AUG89 4 263 1.4 261 264 0.6<br />
191 CONOFLD umho 2-E18-1 08AUG89 4 667 1.7 684 688 0.3<br />
2-E18-2 11AUGOO 4 288 1.4 286 208 0.6<br />
2-EIS-3 OBAUG89 4 166 0.6 168 167 0.3<br />
2-EIS-4 08AUG89 4 171 0.0 171 171 0.0<br />
199 PHFIELD 2-EIB-1 08AUG89 4 7.89 0.01 7.88 7.89 0.1<br />
2-EIS-2 11AUG89 4 9.00 0.01 8.00 8.01 0.1<br />
2-E19-3 OIAUG89 4 9.20 0.00 8.20 9.20 0.0<br />
2-EIS-4 08AUG89 4 9.09 0.01 9.08 9.09 0.1<br />
207 PH-LAB 2-EIB-1 08AUG89 4 8.00 0.00 8.0 6.0 0.0<br />
2-EIB-2 IIAUGB9 4 7.98 0.06 7.9 8.0 0.6<br />
2-EIS-3 OBAUG89 4 8.13 0.06 8.1 8.2 0.8<br />
2-EIS-4 OBAUG89 4 8.06 0.06 8.0 8.1 0.7<br />
C89 TOC ppb 2-EIB-1 08AUG89 4 326 60.1 300 400 16.4<br />
2-EIG-2 IIAUG89 4 676 222.0 300 800 38.6<br />
2-EIB-3 0 BAUG89 4 600 91.8 600 700 13.0<br />
2-EIS-4 08AUG69 4 460 67.7 400 600 12.6<br />
H42 , TOXLDL ppb 2-EIB-1 0 SAU489 4 3.26 0.96 2 4 29.6<br />
2-E18-2 IIAUGO9 4 10.60 3.88 6 13 36.9<br />
- 2-EIG-3 0BAUG89 4 _ 8.60 2.39 3 9 36.6<br />
2-EIS-4 OBAUGS9 4<br />
9.76 4.11 6 14 47.0<br />
0<br />
m m<br />
N ^<br />
o m 00<br />
i
Table D2-7. Constituent List and Summary of Sampling Results<br />
for the 2101-M Pond, November 1989. (sheet 1 of 16)<br />
Constituent List= Contamination Indi ca tor Parameters<br />
Constituent Detection Below Drinklny Water Standards<br />
Code Name Units Limit Samples Detection Standard Agency Exceeded Full Name<br />
088 CONDLAB UMHO 12 0 700 ?Be YDOE Conductivity, Laboratory<br />
181 CONDFLD UMHO " 1 17 0<br />
WDOE Sppecific conductance<br />
188 PHFIELD 100 17 0 6.6-8.6 EPAS pN, Field Measurement<br />
207 PH-LAB .0100 12 a 6.6-8.6 EPA$ pH. Laboratory Mea surement<br />
Co g TOC FPO 2000 17 17 see Total orgsnic carbon<br />
H42 TOXLDL FPO 10 17 30 Totai Organic Halogen, Low Dot. Level<br />
---------- -- Constituent List= Interim Primary Drinking Water Parameters -----------------------------------<br />
Constituent Detection Below Drinking Water Standards<br />
Coda Name Units Limit Sampl es Detection Standard_ Agency Exceeded Full Name<br />
108 COLIFRM MPN 2.20 1 1 ees 1 EPA Collform bacteria<br />
111 BETA PCI/L 8 6 0 60 EPA Gross bets<br />
v 112 ALPHAHI PCI/L 4 6 0 16 EPA Alpha, High Detection Level z CD<br />
181 RADIUM PCI/L 1 6 2 6 EPA Radium m M<br />
o A06 BARIUM FPS<br />
ro<br />
0 6 0 1000 EPA Barium<br />
A07 CADMIUM FPS 2 6 6 sea 10 EPA Cadmium 3+ r-<br />
AO8 CHROMUM FPS 10 6 0 60 EPA xxx Chromium J0 Co<br />
A10 SILVER FPS ]0 6 6 see 60 EPA Silver 00<br />
A20 ARSENIC PPB 6 6 1 60 EPA Arsenic<br />
A21 MERCURY FPS .lea 6 6 •s• 2 EPA Mercury .^<br />
A22 SELENUM FPS 6 6 4 18 EPA Selenlum<br />
A33 ENDRIN PPB .100 6 6 see .200 EPA Endrin<br />
A34 METHLOR FPS 3 6 6 sea 100 EPA Mothoxychlor<br />
A36 TOXAENE PPB FPO<br />
1 6 6 see 6 EPA Toxsphene<br />
A38 a-BHC<br />
.100 6 6 sss 4 EPA Alpha-BHC<br />
A37 b-BHC FPS .lea 6 6 ees 4 EPA Beta-BHC<br />
A38 pp-BHC FPS .100 6 6 ees 4 EPA Gamma-BHC<br />
A38 d-BHC FPS .100 6 6 sae 4 EPA Delta-BHC<br />
A61 LEADGF FPS 6 6 6 sss 60 EPA Lead (graphite furnace)<br />
C72 NITRATE FPS 600 4 1 46000 EPA Nitrate<br />
C14 FLUORID FPS 600 4 3 4000 EPA Fluoride<br />
H13 2,4-D ' PPB 2 6 6 *as 100 EPA 2,4-0<br />
H14 2 4, SIP<br />
FAARIUM FPS 2 6 6 ass 10 EPA 2 0 4 6-TP sllvex<br />
H2O FPS 0 6 0 1000 EPA Barium, filtered<br />
H21 FCADMIU FPS 2 6 6 sss 10 EPA Cadmium, filtered<br />
H22 FCHROMI FPS 10 6 6 see 66 EPA Chromium filtered<br />
H23 FSILVER FPS 10 6 6 see 60 EPA Silver, Filtered<br />
H37 FARSENI FPS 6 6 2 69 EPA Arsenic, filtered
p vv0Nia0<br />
Constituent<br />
Code Name Units<br />
H38 FMERCUR PPB<br />
U30 FSELENI PPB<br />
1111 FLEAD PPB<br />
1100 TURBID NTU<br />
P10 COLIMF PPB<br />
Constituent<br />
Code Name Unite<br />
All SODIUM PPB<br />
A17 MANOESE PPB<br />
A10 IRON PPB<br />
C67 PHENOL PPB<br />
C73 SULFATE PPB<br />
C76 CHLORID PPB<br />
H24 FSODIUM PPB<br />
H2O FMANOAN PPB<br />
H31 FIRON PPB<br />
Constituent<br />
Code Name Units<br />
810 CO-00 PCI/L<br />
024 CS-137 PCI/L<br />
831 RU-106 PCI/L<br />
100 PU30-40 PCI/L<br />
102 PU-238 PCI/L<br />
104 U PCI/L<br />
106 AM-241 PCI/L<br />
168 TRITIUM PCI/L<br />
121 SR 00 PCI/L<br />
A01 BERYLUM PPB<br />
A03 STRONUM PPB<br />
A04 ZINC PPB<br />
A06 CALCIUM PPB<br />
Al2 NICKEL PPB<br />
A13 COPPER PPB<br />
A14 VANADUM PPB<br />
A16 ANTIONY PPB<br />
A18 ALUMNUM PPB<br />
d i _ 7<br />
Table D2-7. Constituent List and Summary of Sampling Results<br />
for the 2101-M Pond, November 1989. (sheet 2 of 16)<br />
^- Constituent List= Interim Primary Drinking Water Parameters --------------------<br />
Detection Below Drinklny taster Standards<br />
Limit Samples Detection Standard Agency Exceeded Full Name<br />
.100<br />
6<br />
6<br />
.100<br />
1<br />
6<br />
6<br />
6<br />
4<br />
2<br />
6 see<br />
4<br />
6 eee<br />
0<br />
2 ses<br />
2 EPA<br />
10 EPA<br />
60 EPA<br />
1 EPA<br />
1 EPA<br />
xxx<br />
Mercury, filtered<br />
Selenium filtered<br />
Lead fil te red<br />
Turbidity<br />
Con form (Membrane Filter)<br />
---------- Constituent List= Water Quality Parameters ---- ------------------------ Detection Below Drinkinp Water Standards<br />
Limit Samples Detection Standard Agency Exceeded Full Name<br />
200 6 0 Sodium<br />
6 6 2 60 EPAS Ma nganese<br />
36 6 0 300 EPAS xxx Iron<br />
10 6 6 •ee Phenol<br />
600 4 0 260000 EPAS Sulfate<br />
600 4 0 260000 EPAS Chloride<br />
200 6 0 Sodium, fil te red<br />
6 6 6 so * 60 SPAS Manganese, fil te red<br />
30 6 4 300 EPAS Iron, filtered<br />
--- Constituent List: <strong>Site</strong> Specific and Other Constituents ----------------------<br />
Detection Below Drinking Wate r Standards<br />
Limit Samples Detection Standard Agency Exceeded Full Name<br />
22.6<br />
20<br />
172.6<br />
17<br />
17<br />
.600<br />
.100<br />
600<br />
6<br />
6<br />
10<br />
6<br />
60<br />
10<br />
106<br />
1<br />
1<br />
1<br />
1<br />
1<br />
1<br />
1<br />
1<br />
1<br />
1 sea<br />
1 eee<br />
1 eee<br />
1 sea<br />
1 eee<br />
0<br />
0<br />
1 see<br />
1 see<br />
eee<br />
eee<br />
100 EPAR<br />
200 EPAR<br />
30 EPAR<br />
1.20 DOE<br />
1.80 DOE<br />
600 DOE<br />
30 DOE<br />
20000 EPA<br />
0 EPA<br />
6000 EPAS<br />
1380 EPAP<br />
Cobalt-80<br />
Ceslum-137<br />
Ruthenium-108<br />
Plutonium-230/40<br />
Plutonium-230<br />
Uranium<br />
Americium-241<br />
Tritium<br />
Strontium-00<br />
Beryllium<br />
Strontium<br />
Zinc<br />
Calcium<br />
Nickel<br />
Copper<br />
Vanadium<br />
100<br />
160<br />
eee Antimony<br />
Aluminum<br />
^°o<br />
CD m<br />
^ ar-<br />
o m<br />
= CO<br />
a
a<br />
v<br />
0 N<br />
A<br />
'• 1 6 4 1 ) 9 " 6<br />
Table D2-7. Constituent List and Summary of Sampling Results<br />
for the 2101-M Pond, November 1989. (sheet 3 of 16)<br />
-------- - ----- Constituent List= <strong>Site</strong> Specific and Other Constituents ------------------<br />
- Constituent Detection Below Drinking Water Standards<br />
Code Name Units Limit Samples Detection Standard Agency Exceeded Full Name<br />
A18 POTASUM PPB 180 6 0 Potassium<br />
ASO NAONES_ WB 60 6 0 magnesium<br />
C78 PHOSPHA PPB 1008 4 4 see Phosphate<br />
HIB TC PPB 1880 6 8 Total carbon<br />
H17 IDS 6000 1 0 600000 EPAS Total dissolved solids<br />
His FZINC PPB 6 6 4 6000 EPAS Zinc flit* ad<br />
H19 FCALCIU PPB 68 6 0 Calcium, filtered<br />
H26 FNICKEL PPB 10 6 6 see Nickel, filtered<br />
020 KOPPER PPB Is 6 6 see 1300 EPAP Copper, filtered<br />
H27 FVANADI PPB 6 6 0 Vanadium, filtered<br />
H2O FALUMIN PPB 160 6 6 sea Aluminum, filtered<br />
H38 FPDTASS PPS 100 6 0 Potassium, filtered<br />
H32 FMAONES PPB Be 6 0 Magnesium, filtered<br />
H33 FBERYLL PPB 6 6 6 eee Beryilium, filtered<br />
H36 FSTRONT PPB 10 6 0 Strontium, filtered<br />
H38 FANTIMO PPB 100 6 6 see Antimony, filtered<br />
H68 ALKALIN 20000 6 0 Alkallni ty<br />
H88 BROMIDE PPB 1000 4 4 see Bromide<br />
H87 NITRITE PPB 1000 4 4 ass Nitrite<br />
HBO FBORON PPB 10 6 0 Boron, filtered<br />
H07 FCOBALT PPB 26 6 6 see Cobalt, filtered<br />
HBO FLITHIU PPS 10 6 6 eee Llthlum, filtered<br />
H89<br />
H90 FMOLY<br />
FSILICO PPB<br />
40 6<br />
6<br />
PPB<br />
60 6 0 see Molybdenum, iltered<br />
Sillcon filtered<br />
H9 FTIN PPB 30 6 6 eee Tin, fi^tared 1<br />
H92 FTITAN PPB 80 6 6 see Titanlum, filtered<br />
H93 FZIRCON PPB 60 6 6 see Zirconium, filtered<br />
P01 BORON PPB 10 6 0 Boron<br />
P02 COBALT PPB 20 6 6 eee Cobalt<br />
P03 LITHIUM PPB 18 6 6 see Lithium<br />
PO4 HOLY FPO 46 6 6 eee Molybdenum<br />
P06 SILICON PPB 60 6 0 Sill con<br />
POO TIN PPB 30 6 6 see Tin<br />
P07 TITAN PPB 80 6 6 eee Titanium<br />
P08 ZIRCON FPS 60 6 6 see Zirconium<br />
P12 ENDSFAN PPB .600 6 6 eee Endosulfan<br />
P13 PHORATE PPB 2 6 6 see PHORATE<br />
0<br />
(Do<br />
^ r<br />
o m<br />
= co
a vv<br />
v<br />
N<br />
1<br />
A<br />
N<br />
Table D2-7. Constituent List and Summary of Sampling Results<br />
for the 2101-M Pond, November 1989. (sheet 4 of 16)<br />
Constituent List= WAC 173-363-8006 Constituents<br />
Constituent Detection Below Drinkingg Water Standards<br />
Code Name Units Limit Samples Detection Stendord Agency Exceeded Full Name<br />
A23 THALIUM PP8 6 6 6 se• Thallium<br />
A24 IHIOURA PPB 206 6 6 sss Thiourea<br />
A26 ACETREA PP8 200 6 6 sss 1-acct I-2-thiourea<br />
A26 CHLOREA PPB 200 6 6 see 1-(o-chloropphenyl) thiourea<br />
A27 DIETROL PPB 200 6 6 •se Dlethylatllb*sterol<br />
A26 ETHYREA PPB 200 6 6 *so Ethylenethloures<br />
A28 NAPHREA PP8 200 6 6 see . 1-naphthyl-2-thloures<br />
A32 PHENBEA PPB 600 6 6 see N-phenylthlourea<br />
A40 DDD PPB .100 6 6 sss<br />
A41 ODE PPA .100 6 6 see DOE<br />
A42 DDT PPB .100 6 6 see DDT<br />
A43 HEPTLOR PPB .100 6 6 see 0 EPAP Heptachlor<br />
A44 HEPTIDE PPB .180 6 6 as* 0 EPAP Heptchlor spoxide<br />
A46 KEPONE PPB 1 6 6 sss Kepone<br />
A46 DIELRIN PPB .100 6 6 see Dleldrin<br />
A47 ALDRIN PPS .100 6 6 sss Aldrin<br />
A48 CHLOANE PPB 1 6 6 see 0 EPAP Chlordane<br />
A48 END01 PPB .100 6 6 see Endosulfan I<br />
A62 END02 PPB .100 6 6 see Endosulfan II<br />
A64 AR1016 PP8 1 6 6 so* 0 EPAP Arochlor 1010<br />
A66 AR1221 PPB 1 6 6 sse 8 EPAP Arochlor 1221<br />
ASO AR1232 PPS 1 6 6 see 0 EPAP Arochlor 1232<br />
A67 AR1242 PP8 1 6 6 sss 0 EPAP Arochlor 1242<br />
ASS AR1248 PPS 1 6 6 *so 0 EPAP Arochlor 1248<br />
A68 AR1264 PPB 1 6 6 *as 0 EPAP Arochlor 1264<br />
A00 AR1280 PPB 1 6 6 see 0 EPAP Arochlor 1280<br />
A01 TETRANE PP8 6 6 6 *so 6 EPA Carbon Tetrachloride by GC/MS<br />
A82 BENZENE PPB 6 6 6 *so 6 EPA Benzene<br />
A83 DIOXANE PPB 600 6 6 es0 Dloxone<br />
A64 METHOHE PPB 10 6 6 *so Methyl ethyl ketone<br />
A66 PYRIDIN PPB 600 6 6 so* Pyridine<br />
A88 TOLUENE PPB 6 6 6 see 2000 EPAP Toluene<br />
A87 1,1,1-T PP8 6 6 6 too 200 EPA 1.1,1-trlchloroethana<br />
ASO 1 1 2-T PPB<br />
6 6 6 see 1,1,2-trichloroethena<br />
A68 7AIEENE PPB<br />
6 6 6 see 6 EPA Trlchioroethylene<br />
A70 PERCENE PPB 6 6 6 aee TAtrachloroethylene<br />
All DPXYLE PPB 6 6 6 see 440 EPAP Xylene-o,p<br />
A72 ACROLIN PPB 10 6 6 sse Acroleln<br />
A73 ACRYILE PPB 10 6 6 *so Acrylonitrile<br />
A74 BIS7HER PP8 5 6 6 sea Ble(chloromethyl) ether<br />
DDS<br />
zo°<br />
m rn<br />
• A<br />
rn r<br />
o m<br />
= 001
Dv<br />
v 0N<br />
w<br />
Constituent<br />
Code Name Units<br />
A75 BROMONE PPS<br />
A78 METHBRO-PPS<br />
All CARBIDE PPS<br />
All CHLBENI PPB<br />
A79CHLTHER PPB<br />
ASO CHLFORY PPB<br />
A81 UETHCHL PPB<br />
A82 CHMTHER PPB<br />
A83 CROTONA PPB<br />
A8 4 DIBRCHL PPB<br />
ASS DIBRETH PPB<br />
A06 DIBRMET PPB<br />
A87 DIBUTEN PPB<br />
ASS DICDIFM PPB<br />
ASO 1,1-DIC PP8<br />
ASO 1 2-DIC PPB<br />
Ag l TAANDCE PPB<br />
A82 DICETHY PPB<br />
A93 METHYCH PPB<br />
A94 DICPANE PPS<br />
ASS DICPENE PPB<br />
A88 NNDIEHY PPB<br />
A97 1,1-DIM PPB<br />
A98 1 2-DIM PPB<br />
801 IGDOMET PPB<br />
802 METHACR PPB<br />
603 METHTHI PPB<br />
604 PENTACH FPS<br />
606 1112-tc PPB<br />
808 1122-tc PPB<br />
800 BROMORM PPB<br />
809 TRCMEOL PPB<br />
B10 TRCMFLM PPS<br />
B12 123-trp FPS<br />
B13 VINYIDE PPB<br />
814 M-XYLE PPB<br />
Bi g ACETILE PPB<br />
820 ACETOPH PPB<br />
B21 WARFRIN PPB<br />
822 ACEFENE PPB<br />
823 AMINDYL PPS<br />
B24 AMIISOX PPB<br />
626 AMITROL PPB<br />
828 ANILINE PPB<br />
-) 1 0 f 1,:<br />
7 I<br />
Table D2-7. Constituent List and Summary of Sampling Results<br />
for the 2101-M Pond, November 1989. (sheet 5 of 16)<br />
---- Constituent List= WAC 173-303-0906 Constituents<br />
Detection Below Drinking Water Standards<br />
Limit Samples Detection Standard Agency Exceeded Full Name<br />
6 6 6 so* Bramoacstono<br />
10 6 6 sss Methyl bromide<br />
10 6 6 as* Carbon disulfide<br />
6 6 6 so* 00 EPAP CAlorobensene<br />
6 6 6 *so 2-chloroethyl vinyl ether<br />
6 6 4 100 EPA Chloroform<br />
10 6 6 see Methyl chloride<br />
10 6 6 see Chloromethyyl methyl ether<br />
10 6 6 sea<br />
Crotonaldehyde<br />
10 6 6 sea<br />
0 EPAP 1,2-dibromo-3-chloropropane<br />
10 6 6 so* 1 2-dibromoethene<br />
10 6 6 sss Dlbromomethane<br />
10 6 6 so* 1 4-dichloro-2-butens<br />
18 6 6 so* Dichlorodifluoromethene<br />
6 6 6 see 1,1-dichloroothane<br />
6 6 6 sss 6 EPA 1,2-dlchloroethane<br />
6 6 6 so* 70 EPAP Trans -l,2-dichloroethene<br />
10 6 6 ass<br />
7'EPA 1.1 -dichloroethylone<br />
6 6 3 Methylene Chloride<br />
6 6 6 so* 0 EPAP 1,2-dichloropropane<br />
6 6 6 see 1,3-dichloropropene<br />
10 6<br />
6 so*<br />
N,N-diethrrlhyydrasino<br />
10 6<br />
6 so*<br />
1,1-dimethylhydrasine<br />
10 •6 6 *so<br />
1,2-dimethylhydraslns<br />
10 6 6 *as Iadomethane<br />
10 6 6 so* . Methacrylonitrile<br />
50 6 6 sss Methenethlol<br />
18 6 6 so* Pentachioroethans<br />
10 6 6 sea 1,1,1,2-tetrachlorethane<br />
6 6 6 sss 1,1,2 2- tetrachlorethano<br />
6 6 6 so* 100 EPA Bromoform<br />
10 6 6 sea<br />
Trichloromethanethiol<br />
10 6 6 sea<br />
Trichloromonofluoromethane<br />
10 6 6 so* 1 2,3-trichloropropsne<br />
10 6 6 so* 2 EPA V1nyl chloride<br />
6 6 6 *so 110 EPAP XyIone-m<br />
10 6 6 sea<br />
Acstonitrlle<br />
10 6 6 sss Acetophenons<br />
10 6 6 sss Warfarin<br />
10 6 6 so* 2-acetylaminofluorene<br />
10 6 6 sss 4-aminobyphenyl<br />
10 6 6 sss 6-(aminomethyl)-3-isoxazolol<br />
10 6 6 so* Amltrole<br />
10 6 6 so* Aniline<br />
;0 O<br />
m m<br />
N ^<br />
O OD<br />
= co
a vvONaA<br />
Constituent<br />
Code Name Units<br />
A76 BROMm1E PPS<br />
AM METHBRO PPS<br />
A77 CARBIDE PPS<br />
A18 CHLBENZ PPB<br />
A79 CHLTHER PPB<br />
ASS CHLFORM PPB<br />
A81 METHCHL PPB<br />
A02 CHMTHER PPB<br />
A63 CBpTONA PPB<br />
A64 DTTBRCHL PPB<br />
ASS DIBRETH PPB<br />
A88 DIBRMET PPB<br />
AST DIBUTEN PPB<br />
A88 DICDIFM PPB<br />
A88 1,1-DIC PPB<br />
A88 12-DIC PPB<br />
A91 TAANDCE PPB<br />
A92 DICETHY PPB<br />
A93 METHYCH PPB<br />
A94 DICPA14E PPB<br />
A96 DICPEHE PPB<br />
ASS NNDIEHY PPB<br />
A97 1,1-DIY PPB<br />
- ASS 1 2-DIY PPB<br />
B01 I6DOUET PPB<br />
602 METHACR PPB<br />
B03 METHTHI PPB<br />
884 PENTACH PPB<br />
B06 1112-tc PPB<br />
060 1122-tc PPB<br />
B88 BROMORM PPB<br />
889 TRCMEOL PPB<br />
B10 TRCMFLM PPB<br />
B12129-trp PPB<br />
B13 VINYIDE PPB<br />
014 M-XYLE PPB<br />
819 ACETILE PPB<br />
B28 ACETOPH PPB<br />
B21 WARFRIN PPB<br />
022 ACEFENE PPB<br />
B23 AMINDYL PPB<br />
824 AMIISOX PPB<br />
826 AMITROL PPB<br />
B28 ANILINE PPB<br />
Table 02-7. Constituent List and Summary of Sampling Results<br />
for the 2101-M Pond, November 1989. (sheet 6 of 16)<br />
------- Constituent List= WAC 173-303-9806 Constituents -------------------------------<br />
Detectlon Below Drinking Water Standards<br />
Limit Samples Detection Standard Agency Exceeded Full Name<br />
6 6 6 aaa Bramoacetone<br />
0 6 6 we Methyl bromide<br />
e 6 6 ees Carbon disulfide<br />
6 6 6 sea 60 EPAP Chlorobanzens<br />
6 6 6 see 2-chlorosthyi vinyl ether<br />
6 6 4 X100 EPA Chloroform<br />
8 6 6 s•• - Methyl chloride<br />
0 6 6 sae Chloromethyyl methyl ether<br />
0 6 6 a•• Crotonaldehyde<br />
9 6 6 se• 0 EPAP 1,2-dibromo-3-chloropropens<br />
•6•<br />
se•<br />
w•<br />
•ee 6 EPA<br />
ee• 70 EPAP<br />
7 EPA<br />
e•e 8 EPAP<br />
see<br />
ees<br />
Ne<br />
se•<br />
pe<br />
•s•<br />
•ee 180 EPA<br />
ee•<br />
••e<br />
•e• 2 EPA<br />
440 EPAP<br />
so*<br />
e••<br />
He<br />
s••<br />
•se<br />
e••<br />
•••<br />
1 4-dichloro<br />
Dichlorodifl<br />
1,1-dichloro<br />
1,2-dichloro<br />
Trans- 1 ,2-di<br />
1,1-dichlorc<br />
Msthvlene Ch<br />
N,N-dleth y Ihyydrazlas<br />
11-dimethylhyd^azine<br />
drazlne<br />
I:2-di hanilhy<br />
Methecrylonitrlle<br />
Methansthiol<br />
Pentachloroethans<br />
1,1,1,2-tetrachlorethane<br />
1,1,2 2-tetrachlorethans<br />
Bromolorm<br />
Trlchloromethanethlol<br />
Trichloromonotluoromsthans<br />
1 2,3-trichloropropens<br />
V^nyl chloride<br />
Xylene-m<br />
Acetonitrlle<br />
Acetophenone<br />
Wartarin<br />
2-acstylaminotluorene<br />
4-aminobyphanyyl<br />
6-(sminomsthyl)-3-laoxazolol<br />
Amitrole<br />
Aniline<br />
zo<br />
m m<br />
N (-<br />
O CO<br />
= 03
n vM<br />
D<br />
N i<br />
Constituent<br />
Code Nam* Units<br />
827 ARAYITE PPB<br />
628 AURAYIN PPB<br />
829 BENZCAC PP8<br />
830 BENZAAN PPB<br />
B31 BENDICII PPB<br />
B32 BENTHOL PPB<br />
B33 BEHOINE PPS<br />
834 BENZBFL PPB<br />
036 BENZJFL PPB<br />
038 PBENZQU PPB<br />
B37 BENZCHL PPB<br />
B38 BIS2CH4 PPB<br />
B39 BIS2CHE PPB<br />
840 BIS2EPH PPB<br />
841 BROPHEN PPB<br />
842 BUTBEUP PPB<br />
643 BUTDINP PPB<br />
844 CHALETH PPB<br />
846 CHLANIL PPB<br />
848 CHLCRES PPB<br />
047 CHLEPDX PPB<br />
B48 CHLNAPH PPB<br />
849 CHLPHEN PPB<br />
060 CHRYSEN PPB<br />
861 CRESOLS PPB<br />
862 CYCHDIN PPB<br />
863 DIBAJAC PPB<br />
064 DIBAJAC PPB<br />
866 DIBAHAN PPB<br />
860 DIBCOCA PPB<br />
B67 DIBAEPY PPB<br />
868 DIBAIPY PPB<br />
B69 DIBAIPY PPB<br />
806 DIBPHTH PPB<br />
881 12-dben PPB<br />
B82 13-dben PPB<br />
883 14-dben PPB<br />
804 DICHBEN PPB<br />
806 24-dchp PPB<br />
886 28-dchp PPB<br />
B87 DIEPHTH PPB<br />
B88 DIHYSAF PPB<br />
B09 DIIIETHS PPB<br />
870 DIUEA110 PPB<br />
Table D2-7. Constituent List and Summary of Sampling Results<br />
for the 2101-M Pond, November'1989. (sheet 7 of 16)<br />
Constituent List= WAC 173-303-0006 Constituents<br />
Detection Below Drinking Water Standards<br />
Limit Samples Detection Standard Agency Exceeded Full Name<br />
10 6 6 see<br />
10 6 6 see<br />
10 6 6 see<br />
10 6 6 *as<br />
10 6 6 *so<br />
10 6 6 see<br />
Is, 6 6 see<br />
10 6 6 see<br />
10 6 6 •e•<br />
10 6 6 *to<br />
10 6 6 *so<br />
30 6 6 *so<br />
10 6 6 so*<br />
10 6 6 sea<br />
10 6 6 so*<br />
10 6 6 e•e<br />
10 6 6 *so<br />
10 6 6 sss<br />
10 6 6 see<br />
10 6 6 see<br />
10 6 6 see<br />
10 6 6 eee<br />
10 6 6 see<br />
18 6 6 *so<br />
10 6 6 see<br />
10 6 6 *as<br />
10 6 6 see<br />
10 6 6 see<br />
10 6 6 •ss<br />
10 6 6 $to<br />
10 6 6 see<br />
10 6 6 ess<br />
10 6 6 eee<br />
10 6 6 *so<br />
10 6 6 ass<br />
10 6 6 see<br />
10 6 6 see<br />
10 6 6 so*<br />
10 6 6 ese<br />
10 6 6 see<br />
10 6 6 see<br />
10 6 6 ese<br />
10 6 6 see<br />
10 6 5 *so<br />
Aruaits<br />
Auramin•<br />
8•ni[c)acridin•<br />
Ben: • snthr•un•<br />
Benzene, dichloromethyl<br />
Benzenetholl<br />
B•nzldlne<br />
Benzo b fluoranthene<br />
Benno ) fluoranth•ne<br />
P benzoqulnone<br />
Benzyl chloride<br />
Bisl2-chloroethoxf) methane<br />
Bis2-chloroethyl ether<br />
81s 2-ethylhoxyl) phthalate<br />
4-bromophenylPhenyl other<br />
Butyl bonzyl phthalate<br />
2-sec-butyl-4,8-dinitrophsnol<br />
Chloro•Ikyl ethers<br />
P-chloro•nlllne<br />
P-chloro-o-cresol<br />
6 EPAP 1-chloro-2,3-%oxypropane<br />
2-chloronsphthal an.<br />
2-chlorophenol<br />
Chrysens<br />
Cresols<br />
2-eyelohex 1-4 0-dinitrophenol<br />
Olbenz[a,h •cridine<br />
Dibenz(s,) •cridin•<br />
Dlbenz a, anthracene<br />
7H-dlbenzo c, 9 1 carbazole<br />
Dlbenzo a,e pyrene<br />
Dlben zo a.A oyrone<br />
Dl-n-butyl phthalate<br />
1,2-dlchlorobenzene<br />
1,3-dichlorobenzene<br />
76 EPA p-Dichlorobenzene<br />
3,3'-dlchlorobenzidlne<br />
2,4-dlchlorophenol<br />
2 0-di chlorophenol<br />
D i othyl phthalate<br />
Dihydros afrole<br />
3,3'-dimethoxybenzidine<br />
P-dimathy laminoozobenzens<br />
Mo°<br />
M m<br />
N ^<br />
o Les<br />
= 00<br />
A
D<br />
M<br />
v 0Niarn<br />
Constituent<br />
Code Name Units<br />
871 DIi1BENZ PPS<br />
B72 DIWEYLB PPB<br />
B73 THIONOX PPB<br />
871 DIYPHAY PPB<br />
B76 DIYPHTH PPB<br />
B77 DINBENZ PPB<br />
676 DINCRES PPB<br />
B79 DINPHEN PPB<br />
1188 24-dint PPB<br />
881 26-dint PPB<br />
982 DIOPHTH PPB<br />
BOB DIPHAYI PP8<br />
B84 DIPHHYD PPB<br />
986 DIPRNIT PPB<br />
B88 ETHYINE PPB<br />
887 ETHIIETS PPB<br />
868 FLUORAN PPB<br />
889 HEXCBEN PPB<br />
898 HEXCBUT PPB<br />
891 HEXCCYC PPB<br />
B02 HEXCETH PPB<br />
1393 INDENOP PPB<br />
691 ISOSOLE PPB<br />
B96 YALOILE PPB<br />
896 YELPHAL PPB<br />
897 YETHAPY PPB<br />
BOO YETHNYL PPB<br />
BOO YETAZIR PPB<br />
C61 METCHAN PPB<br />
C52 IIETBISC PPB<br />
CO3 YETACTO PPB<br />
C04 YETACRY PPB<br />
CISYETYSUL PPB<br />
CBS UETPROP PPB<br />
C87 YETHIOU PP9<br />
Cos NAPH4UI PPB<br />
Cog I-naphs PPB<br />
C18 2-na A hs PPB<br />
CI1 NI7RANI PPB<br />
C12 NITBENZ PPB<br />
CIS NITPHEN PPB<br />
C14 HNIBUTY PPB<br />
C16 iNIDIEA PPS<br />
C18 NNIDIEY PPB<br />
Table D2- 7. Constituent List and Summary of Sampling Results<br />
for the 2101-M Pond, November 1989. (sheet 8 of 16)<br />
------- Constituent List= WAC 173-303-9906 Constituents<br />
Detection Below Drinking Water Standards<br />
Limit Sampl es Detection Standard Agency Ex ce eded<br />
I06 6 see<br />
10 6 6 *so<br />
10 6 6 see<br />
10 6 6 sss<br />
106 6 sea<br />
10 6 6 see<br />
70 6 6 sea<br />
is 6 6 see<br />
10 6 6 sss<br />
16 6 6 as*<br />
10 6 6 see<br />
10 6 6 sss<br />
I0 6 6 so*<br />
10 6 6 as*<br />
10 6 6 so*<br />
10 6 6 sea<br />
Is 6 6 as*<br />
10 6 6 *as<br />
106 6 see<br />
10 6 6 sss<br />
10 6 6 sss<br />
10 6 6 sea<br />
is 6 6 so*<br />
10 6 6 sea<br />
is 6 6 sss<br />
106 6 so*<br />
Is 6 6 so*<br />
16 6 6 so*<br />
is 6 6 see<br />
is 6 6 so*<br />
is 6 6 sss<br />
is 6 6 sss<br />
is 6 6 as*<br />
is 6 6 as*<br />
is 6 6 sea<br />
is 6 6 sea<br />
is6 6 ass<br />
Is 6 6 ees<br />
Is 6 6 *so<br />
is 6 6 sea<br />
10 6 6 ass<br />
10 6 6 so*<br />
10 6 6 sss<br />
Is 6 6 so*<br />
Full Name<br />
7 12-di"thylbenzialanthracone<br />
B,3'-dimethylbanx((d no<br />
Thlofanox<br />
Alpha alpha-dim thylphenethy lamine<br />
Dls»thyI phthalate<br />
Dlnitrobenzane<br />
4 , 6-dinitro-o-cresol and salts<br />
2,1-dlnitrophenol<br />
2.1-dlnitrotolueno<br />
2 6-din itrotoluene<br />
D I -n-octyl ►hthslato<br />
Olphenylamine<br />
1 2-diphenylhydrazine<br />
Dl -n-prolylnitro samine<br />
Ethylene mine<br />
Ethyl methaneaulfonate<br />
Fluoranthene<br />
Nexachlorobenzene<br />
Hexachlorobutadione<br />
Hexschlorocyclopontodions<br />
Haxaahloroethene<br />
Indano(12^3-cd),pyrane<br />
ISO fr0'a<br />
Yalononitrile<br />
YalpPhalon<br />
Yethapyrllane<br />
Yetholonyl<br />
none<br />
r-nitroonpone<br />
Nltrobenxlns<br />
pp Nitrophenol<br />
N-nitrosodl-n-butyylamino<br />
N-nitrosodlethanolamine<br />
N-nitrosodlethylamine<br />
a(2-chlorooniline)<br />
proplonaldehyde-<br />
0<br />
m m<br />
N ro<br />
co<br />
= 00
n v0Ni<br />
A<br />
V<br />
Table D2-7. Constituent List and Summary of Sampling Results<br />
for the 2101-M Pond, November 1989. (sheet 9 of 16)<br />
Constituent List= WAC 173-303-9006 Constituents<br />
Constituent Detection Below Drinklnp Water Standards<br />
Code Noma Units Limit Samples Detection Standard Agency Exceeded Full Name<br />
C17 NNIDIYE PPB 10 6 6 so * N-n i trosod I"thy l sml no<br />
Cis NNIUETH PPB 10 6 6 *so N-nitrosomethylethylemine<br />
CIO<br />
C20 NNIURET<br />
NIIVINY PPB<br />
10 6 6 p a N-nitroso-N-mathyylurethane<br />
PPB<br />
10 6 6 sss H-nItrosomsthyyIVInyI amino<br />
C21 NNIYORP PPB 10 6 6 ass N-nitrosomorphollne<br />
C22 NNINICO PPB 10 6 6 see N-nitrosonornlcotins<br />
C23 INIPIPE PPB 10 6 6 sss N-nitrosoplpsridine<br />
C24 NITRPYR PPB is 6 6 * as Nitro sopy rrolidine<br />
C26 NITRTOL PPB 10 6 6 se• 6-nitro-o-toluldins<br />
C28 PENTCHB PPB 10 6 6 *so Pentachlorobanzene<br />
C27 PENTCHN PPB is 6 6 sss Pentachloronitrsbonzone<br />
C28 PENTCHP PPB 69 6 6 see 220 EPAP Pentachloroph*nol<br />
C29 PHENTNN PPB 10 6 6 so* Phansc*tin<br />
C30 PHENINE PPB Is 6 6 see Ph*nylenediamine<br />
C31 PHTHEST PPB is 6 6 ees Phtholic acid *stars<br />
C32 PICOLIN PPB Is 6 6 sss 2-plcollne<br />
C33 PRONIOE PPB 10 6 6 sss Pronamld*<br />
C34 RESERPI PPB is 6 6 see Reserpine<br />
C36 RESORCI PPB is 6 6 sss Resorcinol<br />
C38 SAFROL PPB is 6 • 6 ass Salrol<br />
C37 TETRCHB PPB 18 6 6 ass 1, 2,4,6-totrachlorob*nxone<br />
C39 TETRCHP PPB is 6 6 sea 2,3,4,8-tatrachloroph*nol<br />
C40 THIURAY PPB 10 6 6 *as Thluram<br />
C41 TOLUDIA PPB Is 6 6 *so Toluenedlamin•<br />
C42 OTOLHYD PPB 10 6 6 see 0-toluldlne hydrochloride<br />
U3 TRICHLB PPB 10 6 6 sss 1,2,4-trichlorobenxeno<br />
C44 246-trp PPB 10 6 6 sss 2,4,6-trichlorophenol<br />
C46 248-trp PPB is 6 6 es• 2,1,8-trlchlorophenol<br />
C48 TRIMS PPB Is 6 6 see 0,0,0-triothyyl phosphorothloste<br />
C47 SYYTRIN PPB is 6 6 so* Sym-trinitrobenxen•<br />
U8 TRISPHO PPB is 6 6 sea Trls(2,3-dibromopropyl) phosphate<br />
C49 BENIOPY PPB is 6 6 sss Benz*[s]ppyrens<br />
C60 CHLNAPI PPB is 6 6 sss Chlorn•pphazlne<br />
C61 BIS2ETH PPB 10 6 6 *so Bls(2-ch l oro i sopropy l) ether<br />
C62 HEXAENE PPB is 6 6 sss Haxachloropropene<br />
C64 HEXACHL PPB 10 6 6 sss Nexachlorophane<br />
C66 NAPHTHA PPB Is 6 6 sss Naphthalene<br />
C66 123TRI PPB is 6 6 sss 1, 2,3-trlchlorobenzone<br />
CSB 13STRI PPB 10 6 6 *so 18 6-trlchlorobenzene<br />
C69 12347E PP8 10 6 6 so* 1,2,3,4-tetrachloro bo nzen*<br />
C80 1236TE PPB 10 6 6 sea 1 2 3 6-totrachlorobenzone<br />
C61<br />
C82 TETEPYR<br />
CHLLATE PPB<br />
2 6 6 ass Tot^oothylpy roph osphate<br />
PPB<br />
300 6<br />
6<br />
ChlorobenNiste<br />
C63 CARBPHT PPB<br />
2 6<br />
6 *so<br />
so * Carbophanothlon<br />
r<br />
0<br />
zo<br />
m m<br />
w ^<br />
O W<br />
= 00<br />
^+ A
a ^o<br />
v<br />
0<br />
N i<br />
oo<br />
ao<br />
.1 y<br />
Table D2-7. Constituent List and Summary of Sampling Results<br />
for the 2101-M Pond, November 1989. (sheet 10 of 16)<br />
--------- Constituent List= WAC 171-303-0906 Constituents<br />
Constituent Detection Below<br />
Code Nome Units Limit Samples Detection<br />
C64 DISULFO PPS 2 6 6 see<br />
C86 DIUETHO PPS 2 6 6 eee<br />
C88 UETHPAR PPB 2 6 6 see<br />
C87 PARATHI PPB 2 6 6 see<br />
C70 CYANIDE PPB 10 6 6 see<br />
C71 FORUALN PPB 600 6 6 see<br />
C77 PERCHLO PPB 600 6 6 *as<br />
CIS SULFIDE PPB 1000 6 6 see<br />
C79 KEROSEN PPB 10000 6 6 see<br />
CBS AUUDNIU`PPB 60 6 6 so*<br />
C87 CITRUSR PPB 1000 6 6 ass<br />
C88 PARALDE PPB 10000 6 6 see<br />
Cot STRYCHN PPB 68 6 6 ass<br />
C92 UALHYDR PPB 690 6 6 see<br />
COS NICOTIN PPB 109 6 6 ass<br />
C04 ACRYIDE PPB 10000 6 6 *as<br />
Cob ALLYLAL PPB 10000 6 6 *so<br />
Cob CHLPROP PPB 10000 6 6 ese<br />
Dal PCDD's PPB .0100 6 6 eee<br />
D02 PCDF's PPB .0109 6 6 see<br />
D03 2378TCO PPB .0100 6 6 see<br />
H03 ETHCARB PPB 10000 6 6 see<br />
H94 ETHCYAN PPB 10000 6 6 ass<br />
H06 ETHOXID PPB 10 6 6 ees<br />
Has ETHUETH PPB 30 6 6 *so<br />
Hog ISOBUTY PPB 10000 6 6 sea<br />
Hit PROPYLA PPB 10000 6 6 see<br />
H12 PROPYNO PPB 10000 6 6 ees<br />
H16 2 4 6-T PPB<br />
2 6<br />
6 ass<br />
H48 FIHALLI PPB<br />
6 6<br />
6 *so<br />
H82 LHYDRAI PPB 30 6 6 ass<br />
Hat HEXONE PPB 19 6 6 sae<br />
I01 ACETONE PPB 19 6 6 sea<br />
I08 ISOPHER PPB 19 6 6 ass<br />
109 BUTANOL PPB 10000 6 6 ese<br />
I21 TRIBUPH PPB 10 6 6 eee<br />
128 TAF PPB 10 6 6 ass<br />
I29 ACENAPH PPS 10 6 6 see<br />
I36 FLREHE PPB 10 6 6 see<br />
I31 ANTHRA PPB 10 6 6 *so<br />
132 PYRENE PPB 10 6 6 eee<br />
133 ETHBENI PPB 6 6 6 ass<br />
I34 STYRENE PPB 6 6 6 so*<br />
I42 BDCU PPB 6 6 6 ass<br />
Drinklnaa Water Standards<br />
$Landard Agency Exceeded Full Noma<br />
Disulfoton<br />
Dimethoote<br />
Methyl parathion<br />
Parathion<br />
Cyanide<br />
Formailn<br />
Perchlorate<br />
Sulfide<br />
Ker osene<br />
Ammonium Ion<br />
Citrus red<br />
Paraldehyde<br />
Strychnine<br />
Ualoic hydrizlde<br />
Nicotinic meld<br />
0 EPAP Aerylamide<br />
Allyyl alcohol<br />
3-chloroproplonitrlle<br />
Pcdd's<br />
Pcdf's<br />
_ 2,3,7,8 TCDD<br />
Ethyl carbom n te<br />
Ethyl cyanide<br />
Ethylene oxide<br />
Ethyyl mthacrylate<br />
butyl alcohol<br />
Is*<br />
N-propylamine<br />
2-prop -1-01<br />
2.4 6-T<br />
Thallium, filtered<br />
Hydrazine, Low Detection Level<br />
Ysthyl Isobutyl Ketone<br />
Tributylphosphoric Acid<br />
Acensphthens<br />
Fluorene<br />
Anthracene<br />
Pyrena<br />
X 680 EPAP Ethyl benzene<br />
140 EPAP Styrene<br />
100 EPA Bromodichloromethane.<br />
0<br />
m m<br />
N .Tr1<br />
O OJ<br />
00<br />
^ .aI
av<br />
v<br />
0<br />
N i<br />
A<br />
e<br />
Constituent Detection Below<br />
Cods Name Units Limit Samples Detection<br />
I43 CDBM PP8 6 5 6 sae<br />
I64 2NITPH PPB i0 5 6 ass<br />
I87 ETHANOL PPB 10000 5 6 ass<br />
I76 2MEHAPH PPB 10 6 6 ass<br />
I82 PHENANT PPB 10 6 6 ass<br />
J43 BENZALC PPB 10 6 6 as*<br />
J89 2HE%ANO PPB 60 5 6 so*<br />
J71 BHZKFLU PPB 10 6 6 sea<br />
J03 BGHTPER PPB 10 6 6 ses<br />
J86 DINOSEB PPB 10 6 6 sss<br />
J61 DIALLAT PPB 10 6 6 *so<br />
K62 NWIPHA PPB 10 6 6 so*<br />
K56 DIBENFR PPB 10 6 6 so*<br />
K68 ACENATL PP8 10 6 6 sss<br />
L28 MBP PPB 10000 6 6 ess<br />
L21 DBP PPB 10000 6 6 sea<br />
L46 ALLYLCL PPB 100 6 6 see<br />
L46 CLETHAN PPB 10 6 6 sss<br />
L48 PROM PPB 6 5 6 ses<br />
L49 VINYLAC PPB 6 6 6 sae<br />
LSD 02CLMEE PPB 10 6 6 sss<br />
L62 DIPHOS PPB 18 6 6 so*<br />
L53 ISODRIN PPS 10 6 6 as*<br />
L64 ONITANI PPB 18 6 6 sss<br />
L66 MNITANI PPB 10 6 6 see<br />
L68 4NITRUI PP8 10 6 6 see<br />
L67 ETHGLYC PPS 16000 6 6 sss<br />
L69 1PROPAN PPB 10000 6 6 *as<br />
L80 1BUTYN PPB 10000 6 6 so*<br />
L82 ACETONE PPB 10 6 6 sss<br />
L03 14DOEN PPB 5 6 6 sss<br />
L04 CHLR08 PPB 10 6 6 sss<br />
Table D2-7. Constituent List and Summary of Sampling Results<br />
for the 2101-M Pond, November 1989. (sheet 11 of 16)<br />
Constituent List= WAC 173-303-6006 Constituents<br />
Drinking Water Standards<br />
Standard Agency Exceeded Full Name<br />
100 EPA Chlorodibromomsthans<br />
o-Nltrophenol<br />
Ethanol<br />
2-Mothylnsphtholone<br />
Phonanthrsne<br />
8enzyl Alcohol<br />
2-Nexanone<br />
Benz: ( k)Fluorsnthono<br />
Benzo(G L)Porylene<br />
Dlnoseb<br />
Dlallato<br />
N-NITROSODIPHENYLAMINE<br />
DIBENZOFURAN<br />
ACENAPHTHYLENE<br />
Monobutyl Phosphate<br />
Dibutyl Phosphate<br />
Allyl Chloride<br />
Chloroethane<br />
Propionitrile<br />
Vinyl Acetate<br />
81a(2-ch loro-1-methy lathy l) ether<br />
iethyl-0,2-pyrazlnyl phosphorothion<br />
Mdrin o-141trosnlllne<br />
m-Nltroanlline<br />
4-Nltroqulnollne 1-oxide<br />
Ethylene Glycol<br />
1-Butynol<br />
Acetone - by ABN<br />
76 EPA p-Dlchlorobenzeno<br />
80 EPAP Chlorabonzane (by ABN)<br />
sss - Indicates all samples were reported as below contractua) detection limits<br />
xxx - Indicates that Drinking Water Standards were axceedod- -<br />
ITA - based onKaximum Contaminant tevets in 40 CFR Port 141,<br />
Rational Primary Drinking Mater Regulations<br />
EPAR - based an National Interim Primary Drinking Water Regulations,<br />
Appendix TV, EPA-670 1 8-70-003<br />
EPAP - based on proposed Maximum Cont n minsnt Level Goals In 60 FR 40030<br />
EPAS - based on Secondary Maximum Conteminsnt Levels given In 40 CFR Part 143<br />
Nstional Secondary Drinkln0 Water Ragulatlons<br />
DOE - based on Derived Concentration Guldos, Draft DOE Order 5400.xx, October 10, 1988<br />
'All OE - based on additional Secondary Maximum Contaminant Levels given In<br />
WAC 248-64, Public Water Supplies<br />
^°C<br />
m m<br />
H r<br />
o m<br />
= co
A<br />
v<br />
0 N<br />
1<br />
0<br />
Table D2-7. Constituent List and Summary of Sampling Results<br />
for the 2101-M Pond, November 1989. (sheet 12 of 16)<br />
Contamination Indicator Parameters<br />
DupIIcat* CONDFLD CONDLAB PH-LAB PHFIELD TOC TO%LDL<br />
Well Coll action SamQ I• u"o WHO PPB PPB<br />
nomo data number 1/700n ./700r .01/8.6-8.60 .10/0.6-8.is 2000/. 10/.<br />
2-E19-1 31OCT89 662 7.96 600 1<br />
-•• 29NOVOO 683 6i2 7.30 8.09 200 3<br />
29HOVOO 1 602 643 7.89 8.08 380 6<br />
29MV89 2 661 668 7.80 0.09 300 4<br />
29NOV89 3 689 662 7.89 0.10 300 8<br />
2-EIB-2 27NOV89 278 8.14 100 8<br />
27NOV89 1 283 6.12 700 8<br />
27NOV89 2 286 8.13 100 8<br />
21NOV89 3 201 8.11 800 7<br />
2-E19-3 27NOV09 238 2i7 a 8.08 700 7<br />
27NOV89 1 233 216 8 0.89 00 7<br />
27NOV89 2 236 217 0 8.09 400 6<br />
27NOV89 3 230 248 8.10 0.12 600 0<br />
2-EIB -4 21NOV69 238 278 7.90 8.69 400 0<br />
21NOV89 1 239 268 8 8.11 000 4<br />
21NOV89 2 234 201 9 8.10 700 1<br />
21NOV89 3 238 286 0 6.10 609 17<br />
z°C<br />
m m<br />
D<br />
v v<br />
0<br />
N i<br />
Table D2-7. Constituent List and Summary of Sampling Results<br />
for the 2101-M Pond, November 1989. (sheet 13 of 16)<br />
Duel lcate FSELENI FPOTASS FSTRONT ALKALIN ALPHAHI ALUMNUM AY-241 ARSENIC<br />
well Collection sample PPB PPB PPB PCI/L PPB PCI/L PPB<br />
name date number 6/10 100/. 10/. 20000/. 4/16 160/. .10/30d 6/68<br />
2-EIS-1 310[780 0 6700 286 4.62 244 .0208
D vv<br />
0<br />
N<br />
N<br />
Table D2-7. Constituent List and Summary of Sampling Results<br />
for the 2101-M Pond, November 1989. (sheet 14 of 16)<br />
Duplicate PU39 - 40 RADIUM RU-108 SELENUM SILICON FSILICO SODIUM FSODIUM<br />
Well Collection sample PCI/L PCI/L PCI/L PPB PPB PPB PPB PPB<br />
nerve date number 17/1.2d 1/6 172.6/36r 6/10 60/. 60/. 200/. 200/.<br />
2-EIB-1 31OCTSO •.00308 .248 a-28.2 0 16200 18900 26900 27000<br />
29NOVB9<br />
2-EIB - 2 27NOVOO .387 (6 18200 18400 17100 16300<br />
2-EIB-3 27NOVOO e.0742 (6 17206 17200 6410 6700<br />
21NOV89 1 0.0698 (6 17000 17400 6660 6110<br />
2-EIS-4 21NGVB9 .199 (6 17600 17300 10800 9280<br />
Duplicate SR 90 STRONUM SULFATE TC IDS TRITIUM TURBID U<br />
Wall Collection sample PCI/L PPB PPB PPB PCI/L NTU PCI/L<br />
name date number 6/8 10/. 600/260006s 1800/. 60001600000s 600/20000 .10/1 .60/800d<br />
2-E18-1 31OCTOO 0.429 260 146000 24000 347000 *88.3 11 4.68 -<br />
29NOVB9<br />
2-EIS-2<br />
2-EIB- 3<br />
2-EIB-4<br />
27NOVBO<br />
^27NOV89<br />
27NOV89<br />
21NOV89<br />
1<br />
163<br />
160<br />
146<br />
168<br />
16600<br />
16688<br />
23068<br />
21600<br />
24800<br />
26008<br />
23906<br />
700<br />
2.10<br />
1.18<br />
A o<br />
<<br />
Duplicate VANADUM FVANADI ZINC FZINC<br />
Well Collection sample PPB PPB PPB PPB<br />
nam d te number 6/. 6/.<br />
6/60008 616000s 0<br />
e<br />
ca<br />
ai<br />
2-EIS-1 31oCT89 9 a 26 7<br />
20NOV89<br />
2-EIS-2 27NOV89 2Q 22 6 (6<br />
2-EIB-3 27NDVOO 28 27 I6 (6<br />
27NOV89 1 27 ) 28 8 (6<br />
2-EIB-4 21ROV89 21 29 8 (6<br />
Suffix<br />
nano - based onMaximum Contaminant Levels in 40 CFR Part 141,<br />
National Primary Drinking Mater Reputations<br />
r - based on National Interim Primary Drinking Water Regulations,<br />
Appendix IV, EPA-670/9-78-003<br />
p - based on proposed Maximum Contaminant Level Goals In 60 FR 46938<br />
• - based on Secondary Maximum Contaminant Levels given In 40 CFO Part 143<br />
National Secondary Drinking Water Regulations<br />
d - based on Derived Concentration Guides, Draft DOE Order 5400.xx, October 10, 1988<br />
w - based on additional Sacondery Maximum Contaminant Levels given In<br />
WAC 248-54, Public Water Supplies<br />
Data Flags<br />
( - Less than Contractual Detection Limit, reported as Limit<br />
- Less t it an Contractual Detection Limit, me as ured value reported<br />
- For radioactive Constituents, reported value is lass than 2-slgms error
n v0N1<br />
w<br />
Table D2-7. Constituent List and Summary of Sampling Results<br />
for the 2101-M Pond, November 1989. (sheet 15 of 16)<br />
Constit4^pt, Standard<br />
Unitsll 11 n df tc Average Deviation Critical Meg<br />
Conductivity in the<br />
field, who/cm 4 3 11.984 528.4 39.1 1,052.9<br />
pH, field , 4 3 15.145 7.804 0.657 3.316, 18.9.<br />
Total organic carbon,<br />
ppb 4 3 11.984 387.6 156.2 2,480.5<br />
Total organic<br />
halogens, ppb 4 3 .11.984 3.59 0.99 16.8<br />
(a) Data collected August 1988 to June 1989. Values calculated based on<br />
16 comparisons.<br />
(b) The following notations are used in this table:<br />
df - degrees of freedom (n-1).<br />
n = number of background replicate averages.<br />
tc = Bonferroni critical t-value for appropriate df and 16 comparisons.<br />
.'o O<br />
M m<br />
N1'"'<br />
o m<br />
= 00
a<br />
^o<br />
v<br />
0 NI<br />
w<br />
.P<br />
Table D2-7. Constituent List and Summary of Sampling Results<br />
for the 2101-M Pond, November 1989. (sheet 16 of 16)<br />
jARIE 137. Contamination Indicator Parameter Replicate Averages for the<br />
2101-M Pond, November 1989<br />
Constituent Well Semple Replicate Standard Coefficient<br />
Code He" Unite Name Oat* Reps Average Deviation Minimum maximum of variation<br />
088 CONDLAB umho 2-E18-1 29NOVOO 4 647 4.88 642 662 0.8<br />
2-E18-3 27NOVOO 4 247 1.28 246 248 0.6<br />
2-EIS-4 21NOVOO 4 284 4.08 278 287 1.4<br />
181 CONDFLD umho 2-EIB-1 20NOVOO 4 662 1.28 660 663 0.2<br />
2-EIS-2 27NOV89 4 282 2.88 278 286 1.1<br />
2-E18-3 27NOV89 4 234 8.37 230 238 1.4<br />
2-Eli-4 21NOVOO 4 236 2.06 234 238 0.8<br />
188 PHFIELD 2-EIS-1 29NOVOO 4 8.08 0.008 8.08 8.10 0.1<br />
2-E18-2 27NOVOO 4 8.13 0.013 8.11 8.14 0.2<br />
2-E18-3 27NOV89 4 8.10 0.017 8.08 8.12 0.2<br />
2-E18-4 21NOVOO 4 6.10 0.008 8.08 8.11 0.1<br />
207 PH-LAB 2-EIS-1 29NOV89 4 7.68 0.26 7.3 7.8 3.3<br />
2-EIS-3 27NOV89 4 8.02 0.06 8.0 8.1 0.6<br />
2-EIB-4 21NOVOO 4 7.98 0.06 7.9 8.0 0.6<br />
C69 TOC ppb 2-EIB-1 29NOV89 4 276 60 260 300 18.2<br />
2-EIS-2 27NOV69 4 626 160 400 700 28.6<br />
2-EIS-3 27NOV89 4 600 141 400 700 28.3<br />
2-E18-4 21NOV89 4 676 128 400 700 21.9<br />
H42 TOXLDL ppb 2-EIS-1 29NOVOO 4 6.0 2.18 3 e 43.2<br />
2-EIS-2 27NOV89 4 7.3 0.96 6 e 13.2<br />
2-EIB-3 27NOVOO 4 6.3 0.98 6 7 16.3<br />
2-E18-4 21NOV69 4 7.6 2.69 4 11 38.6<br />
0<br />
^o<br />
m m<br />
ti r<br />
o co<br />
= co<br />
a
DOE/RL 88-41<br />
Revision 1<br />
Table 02-8. Concentrations Used for Calculation of<br />
Baseline Values. (sheet 1 of 11)<br />
Collection Analyte Detect.<br />
Well Date No. Analyte Name Limit Units Conc.<br />
6-19-43 28-Dec-87 191 Specific conductance 1 UMHO 312<br />
6-19-43 3-Feb-88 191 Specific conductance 1 UMHO 310<br />
6-19-43 22-May-88 191 Specific conductance 1 UMHO 380<br />
6-19-43 16-Sep-88 191 Specific conductance 1 UMHO 390<br />
6-32-77 5-Feb-86 191 Specific conductance 1 UMHO 287<br />
6-32-77 15-Nov-87 191 Specific conductance 1 UMHO 213<br />
6-32-77 4-Jan-88 191 Specific conductance 1 UMHO 259<br />
6-32-77 11-May-88 191 Specific conductance 1 UMHO 260<br />
6-32-77 24-Aug-88 191 Specific conductance 1 UMHO 228<br />
6-55-76 2-Dec-87 191 Specific conductance 1 UMHO 279<br />
C. 6-55-76 12-Feb-88 191 Specific conductance 1 UMHO 332<br />
6-55-76 6-Jun-88 191 Specific conductance 1 UMHO 307<br />
6-55-76 21-Nov-88 191 Specific conductance 1 UMHO 369<br />
r 6-55-76 21-Nov-88 191 Specific conductance 1 UMHO 370<br />
6-67-86 22-Dec-87 191 Specific conductance 1 UMHO 286<br />
r^4 6-67-86 23-Feb-88 191 Specific conductance 1 UMHO 279<br />
6-67-86 22-Jun-88 191 Specific conductance 1 UMHO 294<br />
6-67-86 30-Aug-88 191 Specific conductance 1 UMHO 194<br />
6-67-86 13-Jan-89 191 Specific conductance 1 UMHO 295<br />
6-S3-25 8-Jun-87 191 Specific conductance 1 UMHO 492<br />
6-S3-25 15-Sep-87 191 Specific conductance 1 UMHO 455<br />
6-S31-1 17-Oct-85 191 Specific conductance 1 UMHO 235<br />
= 6-S31-1 22-Jun-87 191 Specific conductance 1 UMHO 220<br />
6-S31-1 24-Aug-87 191 Specific conductance 1 UMHO 197<br />
6-S31-1 4-Aug-88 191 Specific conductance 1 UMHO 220<br />
6-19-43 28-Dec-87 199 pH, Field Measurement 0.1 7.70<br />
6-19-43 3-Feb-88 199 pH, Field Measurement 0.1 7.60<br />
6-19-43 22-May-88 199 pH, Field Measurement 0.1 8.00<br />
6-19-43 16-Sep-88 199 pH, Field Measurement 0.1 7.80<br />
6-32-77 5-Feb-86 199 pH, Field Measurement 0.1 7.80<br />
6-32-77 15-Nov-87 199 pH, Field Measurement 0.1 7.50<br />
6-32-77 4-Jan-88 199 pH, Field Measurement 0.1 6.30<br />
6-32-77 11-May-88 199 pH, Field Measurement 0.1 7.70<br />
6-32-77 24-Aug-88 199 pH, Field Measurement 0.1 7.50<br />
6-55-76 2-Dec-87 199 pH, Field Measurement 0.1 7.70<br />
6-55-76 12-Feb-88 199 pH, Field Measurement 0.1 7.50<br />
6-55-76 6-Jun-88 199 pH, Field Measurement 0.1 7.70<br />
6-55-76 21-Nov-88 199 pH, Field Measurement 0.1 8.00<br />
6-55-76 21-Nov-88 199 pH, Field Measurement 0.1 8.10<br />
6-55-76 21-Nov-88 199 pH, Field Measurement 0.1 8.20<br />
6-67-86 22-Dec-87 199 pH, Field Measurement 0.1 6.80<br />
6-67-86 23-Feb-88 199 pH, Field Measurement 0.1 7.90<br />
6-67-86 22-Jun-88 199 pH, Field Measurement 0.1 7.50<br />
APP D2-55
_.<br />
DOE/RL 88-41<br />
Revision 1<br />
Table D2-8. Concentrations Used for Calculation of<br />
Baseline Values. (sheet 2 of 11)<br />
Collection Analyte Detect.<br />
Well Date NO. Analvte Name Limit Units Conc.<br />
6-67-86 30-Aug-88 199 pH, Field Measurement 0.1 7.60<br />
6-67-86 13-Jan-89 199 pH, Field Measurement 0.1 7.60<br />
6-S3-25 8-Jun-87 199 pH, Field Measurement 0.1 7.20<br />
6-S3-25 15-Sep-87 199 pH, Field Measurement 0.1 7.10<br />
6-S31-1 17-Oct-85 199 pH, Field Measurement 0.1 7.70<br />
6-S31-1 22-Jun-87 199 pH, Field Measurement 0.1 7.30<br />
6-S31-1 24-Aug-87 199 pH, Field Measurement 0.1 7.30<br />
6-S31-1 4-Aug-88 199 pH, Field Measurement 0.1 7.70<br />
6-19-43 28-Dec-87 C69 Total organic carbon 2000 PPB 335<<br />
6-19-43 3-Feb-88 C69 Total organic carbon 2000 PPB 237<<br />
6-19-43 22-May-88 C69 Total organic carbon 2000 PPB 359<<br />
6-19-43 16-Sep-88 C69 Total organic carbon 2000 PPB 200<<br />
6-32-77 5-Feb-86 C69 Total organic carbon 2000 PPB 598<<br />
6-32-77 15-Nov-87 C69 Total organic carbon 2000 PPB 276<<br />
6-32-77 4-Jan-88 C69 Total organic carbon 2000 PPB 358<<br />
6-32-77 11-May-88 C69 Total organic carbon 2000 PPB 263<<br />
6-32-77 24-Aug-88 C69 Total organic carbon 2000 PPB 304<<br />
6-55-76 2-Dec-87 C69 Total organic carbon 2000 PPB 228<<br />
6-55-76 12-Feb-88 C69 Total organic carbon 2000 PPB 170<<br />
6-55-76 6-Jun-88 C69 Total organic carbon 2000 PPB 234<<br />
6-55-76 21-Nov-88 C69 Total organic carbon 2000 PPB 200<<br />
6-55-76 21-Nov-88 C69 Total organic carbon 2000 PPB 300<<br />
6-67-86 22-Dec-87 C69 Total organic carbon 2000 PPB 175<<br />
° 6-67-86 23-Feb-88 C69 Total organic carbon 2000 PPB 431<<br />
6-67-86 22-Jun-88 C69 Total organic carbon 2000 PPB 339<<br />
6-67-86 30-Aug-88 C69 Total organic carbon 2000 PPB 455<<br />
6-67-86 13-Jan-89 C69 Total organic carbon 2000 PPB 200<<br />
6-S3-25 8-Jun-87 C69 Total organic carbon 2000 PPB 260<<br />
6-S3-25 15-Sep-87 C69 Total organic carbon 2000 PPB 418<<br />
6-S31-1 17-Oct-85 C69 Total organic carbon 2000 PPB 1500<br />
6-S31-1 18-Jul-86 C69 Total organic carbon 2000 PPB 1000<br />
6-S31-1 22-Jun-87 C69 Total organic carbon 2000 PPB 1380<br />
6-S31-1 24-Aug-87 C69 Total organic carbon 2000 PPB 1190<br />
6-S31-1 4-Aug-88 C69 Total organic carbon 2000 PPB 301<<br />
6-19-43 28-Dec-87 H42 Total Organic Halogen 10 PPB 4<<br />
6-19-43 3-Feb-88 H42 Total Organic Halogen 10 PPB 5.3<<br />
6-19-43 22-May-88 H42 Total Organic Halogen 10 PPB 5<<br />
6-32-77 15-Nov-87 H42 Total Organic Halogen 10 PPB 3<<br />
6-32-77 4-Jan-88 H42 Total Organic Halogen 10 PPB 3.2<<br />
6-32-77 11-May-88 H42 Total Organic Halogen 10 PPB 20<<br />
6-55-76 2-Dec-87 H42 Total Organic Halogen 10 PPB 0.7<<br />
APP D2-56
DOE/RL 88-41<br />
Revision 1<br />
Table D2-8. Concentrations Used for Calculation of<br />
Baseline Values. (sheet 3 of 11)<br />
Collection Analyte Detect.<br />
wel l Date NO. Analyte Name Limit Units Conc.<br />
6-55-76 12-Feb-88 H42 Total Organic Halogen 10 PPB 2.4<<br />
6-55-76 6-Jun-88 H42 Total Organic Halogen 10 PPB 11.5<<br />
6-55-76 21-Nov-88 H42 Total Organic Halogen 10 PPB 2<<br />
6-55-76 21-Nov-88 H42 Total Organic Halogen 10 PPB 4<<br />
6-55-76 21-Nov-88 H42 Total Organic Halogen 10 PPB 10<<br />
6-67-86 22-Dec-87 H42 Total Organic Halogen 10 PPB 2<<br />
6-67-86 23-Feb-88 H42 Total Organic Halogen 10 PPB 3.3<<br />
6-67-86 22-Jun-88 H42 Total Organic Halogen 10 PPB 5.9<<br />
6-S3-25 8-Jun-87 H42 Total Organic Halogen 10 PPB 20<<br />
cm 6-S3-25 15-Sep-87 H42 Total Organic Halogen 10 PPB 37.6<br />
6-S31-1 22-Jun-87 H42 Total Organic Halogen 10 PPB 60.8<br />
a 6-S31-1 24-Aug-87 H42 Total Organic Halogen 10 PPB 5.6<<br />
6-S31-1 4-Aug-88 H42 Total Organic Halogen 10 PPB 0.9<<br />
6-19-43 28-Dec-87 C75 Chloride 500 PPB 7880<br />
6-19-43 3-Feb-88 C75 Chloride 500 PPB 6590<br />
6-19-43 22-May-88 C75 Chloride 500 PPB 6550<br />
6-19-43 16-Sep-88 C75 Chloride 500 PPB 6490<br />
6-32-77 5-Feb-86 C75 Chloride 500 PPB 7480<br />
6-32-77 15-Nov-87 C75 Chloride 500 PPB 7530<br />
€ 6-32-77 4-Jan-88 C75 Chloride 500 PPB 8130<br />
6-32-77 11-May-88 C75 Chloride 500 PPB 7220<br />
i 6-32-77 24-Aug-88 C75 Chloride 500 PPB 5810<br />
6-55-76 2-Dec-87 C75 Chloride 500 PPB 22900<br />
6-55-76 12-Feb-88 C75 Chloride 500 PPB 24500<br />
6-55-76 6-Jun-88 C75 Chloride 500 PPB 23900<br />
6-55-76 21-Nov-88 C75 Chloride 500 PPB 22200<br />
6-67-86 22-Dec-87 C75 Chloride 500 PPB 4960<br />
6-67-86 23-Feb-88 C75 Chloride 500 PPB 4860<br />
6-67-86 22-Jun-88 C75 Chloride 500 PPB 5190<br />
6-67-86 30-Aug-88 C75 Chloride 500 PPB 4770<br />
6-67-86 13-Jan-89 C75 Chloride 500 PPB 4700<br />
6-S3-25 8-Jun-87 C75 Chloride 500 PPB 24100<br />
6-S3-25 15-Sep-87 C75 Chloride 500 PPB 22700<br />
6-S31-1 17-Oct-85 C75 Chloride 500 PPB 4680<br />
6-S31-1 22-Jun-87 C75 Chloride 500 PPB 5540<br />
6-S31-1 24-Aug-87 C75 Chloride 500 PPB 5330<br />
6-S31-1 4-Aug-88 C75 Chloride 500 PPB 5120<br />
6-19-43 28-Dec-87 A17 Manganese 5 PPB 6<br />
6-32-77 5-Feb-86 A17 Manganese 5 PPB 8<br />
6-55-76 21-Nov-88 A17 Manganese 5 PPB 21<br />
APP D2-57
DOE/RL 88-41<br />
Revision 1<br />
Table D2-8. Concentrations Used for Calculation of<br />
Baseline Values. (sheet 4 of 11)<br />
Collection Analyte Detect.<br />
Well Date No. Analvte Name Limit nits Conc.<br />
6-S31-1 17-Oct-85 A17 Manganese 5 PPB 5<br />
6-S31-1 4-Aug-88 A17 Manganese 5 PPB 5<<br />
6-19-43 3-Feb-88 H29 Manganese, filtered 5 PPB 5<<br />
6-19-43 22-May-88 H29 Manganese, filtered 5 PPB 5<<br />
6-19-43 16-Sep-88 H29 Manganese, filtered 5 PPB 7<br />
6-32-77 15-Nov-87 H29 Manganese, filtered 5 PPB 5<<br />
r- 6-32-77 4-Jan-88 H29 Manganese, filtered 5 PPB 5<<br />
6-32-77 11-May-88 H29 Manganese, filtered 5 PPB 5<<br />
6-32-77 24-Aug-88 H29 Manganese, filtered 5 PPB 5<<br />
r<br />
6-55-76 2-Dec-87 H29 Manganese, filtered 5 PPB 47<br />
6-55-76 12-Feb-88 H29 Manganese, filtered 5 PPB 20<br />
6-55-76 6-Jun-88 H29 Manganese, filtered 5 PPB 30<br />
6-55-76 21-Nov-88 H29 Manganese, filtered 5 PPB 15<br />
6-67-86 22-Dec-87 H29 Manganese, filtered 5 PPB 5<<br />
6-67-86 23-Feb-88 H29 Manganese, filtered 5 PPB 5<<br />
6-67-86 22-Jun-88 H29 Manganese, filtered 5 PPB 5<<br />
6-67-86 30-Aug-88 H29 Manganese, filtered 5 PPB 5<<br />
6-67-86 13-Jan-89 H29 Manganese, filtered 5 PPB 5< .<br />
6-S31-1 22-Jun-87 H29 Manganese, filtered 5 PPB 5<<br />
6-S31-1 24-Aug-87 H29 Manganese, filtered 5 PPB 5<<br />
6-S31-1 4-Aug-88 H29 Manganese, filtered 5 PPB 5<<br />
w 6-19-43 28-Dec-87 All Sodium 200 PPB 20100<br />
6-32-77 5-Feb-86 All Sodium 200 PPB 21500<br />
6-55-76 21-Nov-88 All Sodium 200 PPB 9950<br />
6-S31-1 17-Oct-85 All Sodium 200 PPB 8580<br />
6-S31-1 4-Aug-88 All Sodium 200 PPB 9440<br />
6-19-43 3-Feb-88 H24 Sodium, filtered 200 PPB 17400<br />
6-19-43 22-May-88 H24 Sodium, filtered 200 PPB 18400<br />
6-19-43 16-Sep-88 H24 Sodium, filtered 200 PPB 21800<br />
6-32-77 15-Nov-87 H24 Sodium, filtered 200 PPB 21600<br />
6-32-77 4-Jan-88 H24 Sodium, filtered 200 PPB 19800<br />
6-32-77 11-May-88 H24 Sodium, filtered 200 PPB 17700<br />
6-32-77 24-Aug-88 H24 Sodium, filtered 200 PPB 19500<br />
6-55-76 2-Dec-87 H24 Sodium, filtered 200 PPB 9160<br />
6-55-76 12-Feb-88 H24 Sodium, filtered 200 PPB 9270<br />
6-55-76 6-Jun-88 H24 Sodium, filtered 200 PPB 10100<br />
6-55-76 21-Nov-88 H24 Sodium, filtered 200 PPB 10200<br />
6-67-86 22-Dec-87 H24 Sodium, filtered 200 PPB 18000<br />
APP D2-58
DOE/RL 88-41<br />
Revision 1<br />
Table D2-8. Concentrations Used for Calculation of<br />
Baseline Values. (sheet 5 of 11)<br />
Collection Analyte Detect.<br />
Well Date NO. Analyte Name lima Units Conc.<br />
6-67-86 23-Feb-88 H24 Sodium, filtered 200 PPB 15700<br />
6-67-86 22-Jun-88 H24 Sodium, filtered 200 PPB 15700<br />
6-67-86 30-Aug-88 H24 Sodium, filtered 200 PPB 18600<br />
6-67-86 13-Jan-89 H24 Sodium, filtered 200 PPB 16000<br />
6-S3-25 8-Jun-87 H24 Sodium, filtered 200 PPB 25300<br />
6-S3-25 15-Sep-87 H24 Sodium, filtered 200 PPB 22200<br />
6-S31-1 22-Jun-87 H24 Sodium, filtered 200 PPB 8990<br />
6-S31-1 24-Aug-87 H24 Sodium, filtered 200 PPB 8500<br />
6-S31-1 4-Aug-88 H24 Sodium, filtered 200 PPB 9060<br />
6-19-43 28-Dec-87 C73 Sulfate 500 PPB 60400<br />
6-19-43 3-Feb-88 C73 Sulfate 500 PPB 59000<br />
r: 6-19-43 22-May-88 C73 Sulfate 500 PPB 51500<br />
6-19-43 16-Sep-88 C73 Sulfate 500 PPB 60500<br />
6-32-77 5-Feb-86 C73 Sulfate 500 PPB 18900<br />
6-32-77 15-Nov-87 C73 Sulfate 500 PPB 20300<br />
6-32-77 4-Jan-88 C73 Sulfate 500 PPB 19700<br />
6-32-77 11-May-88 C73 Sulfate 500 PPB 18600<br />
6-32-77 24-Aug-88 C73 Sulfate 500 PPB 19800<br />
r_ 6-55-76 2-Dec-87 C73 Sulfate 500 PPB 42900<br />
6-55-76 12-Feb-88 C73 Sulfate 500 PPB 47300<br />
6-55-76 6-Jun-88 C73 Sulfate 500 PPB 43000<br />
6-55-76 21-Nov-88 C73 Sulfate 500 PPB 48100<br />
"y6-67-86 22-Dec-87 C73 Sulfate 500 PPB 38000<br />
6-67-86 23-Feb-88 C73 Sulfate 500 PPB 37800<br />
6-67-86 22-Jun-88 C73 Sulfate 500 PPB 37300<br />
6-67-86 30-Aug-88 C73 Sulfate 500 PPB 36100<br />
6-67-86 13-Jan-89 C73 Sulfate 500 PPB 36200<br />
6-S3-25 8-Jun-87 C73 Sulfate 500 PPB 82400<br />
6-S3-25 15-Sep-87 C73 Sulfate 500 PPB 71900<br />
6-S31-1 17-Oct-85 C73 Sulfate 500 PPB 16500<br />
6-S31-1 22-Jun-87 C73 Sulfate 500 PPB 17700<br />
6-S31-1 24-Aug-87 C73 Sulfate 500 PPB 16600<br />
6-S31-1 4-Aug-88 C73 Sulfate 500 PPB 17200<br />
6-19-43 28-Dec-87 A20 Arsenic 5 PPB 5<<br />
6-32-77 5-Feb-86 A20 Arsenic 5 PPB 5<<br />
6-55-76 21-Nov-88 A20 Arsenic 5 PPB 5<<br />
6-S31-1 17-Oct-85 A20 Arsenic 5 PPB 5<<br />
6-S31-1 4-Aug-88 A20 Arsenic 5 PPB 6<br />
APP D2-59
DOE/RL 88-41<br />
Revision 1<br />
Table D2-8. Concentrations Used for Calculation of<br />
Baseline Values. (sheet 6 of 11)<br />
Collection Analyte Detect.<br />
Well Date No. Analvte Name Limit Units Conc.<br />
6-19-43 3-Feb-88 H37 Arsenic, filtered 5 PPB 5<<br />
6-19-43 22-May-88 H37 Arsenic, filtered 5 PPB 5<<br />
6-32-77 15-Nov-87 H37 Arsenic, filtered 5 PPB 5<<br />
6-32-77 4-Jan-88 H37 Arsenic, filtered 5 PPB 5<<br />
6-32-77 11-May-88 H37 Arsenic, filtered 5 PPB 5<<br />
6-55-76 2-Dec-87 H37 Arsenic, filtered 5 PPB 5<<br />
6-55-76 12-Feb-88 H37 Arsenic, filtered 5 PPB 5<<br />
6-55-76 6-Jun-88 H37 Arsenic, filtered 5 PPB 5<<br />
6-55-76 21-Nov-88 H37 Arsenic, filtered 5 PPB 5<<br />
LC! 6-67-86 22-Dec-87 H37 Arsenic, filtered 5 PPB 5<<br />
6-67-86 23-Feb-88 H37 Arsenic, filtered 5 PPB 5<<br />
6-67-86 22-Jun-88 H37 Arsenic, filtered 5 PPB 5<<br />
Cn.<br />
6-S3-25 8-Jun-87 H37 Arsenic, filtered 5 PPB 5<<br />
6-S3-25 15-Sep-87 H37 Arsenic, filtered 5 PPB 5<<br />
6-S31-1 22-Jun-87 H37 Arsenic, filtered 5 PPB 5<<br />
6-S31-1 24-Aug-87 H37 Arsenic, filtered 5 PPB 6<br />
6-S31-1 4-Aug-88 H37 Arsenic, filtered 5 PPB 6<br />
6-19-43 28-Dec-87 A06 Barium 6 PPB 56<br />
6-32-77 5-Feb-86 A06 Barium 6 PPB 21<br />
6-55-76 21-Nov-88 A06 Barium 6 PPB 20<br />
` 6-S31-1 17-Oct-85 A06 Barium 6 PPB 12<br />
.c. 6-S31-1 4-Aug-88 A06 Barium 6 PPB 12<br />
w<br />
6-19-43 3-Feb-88 H2O Barium, filtered 6 PPB 54<br />
6-19-43 22-May-88 H2O Barium, filtered 6 PPB 50<br />
6-19-43 16-Sep-88 H2O Barium, filtered 6 PPB 58<br />
6-32-77 15-Nov-87 H2O Barium, filtered 6 PPB 27<br />
6-32-77 4-Jan-88 H2O Barium, filtered 6 PPB 7<br />
6-32-77 11-May-88 H2O Barium, filtered 6 PPB 24<br />
6-32-77 24-Aug-88 H2O Barium, filtered 6 PPB 22<br />
6-55-76 2-Dec-87 H2O Barium, filtered 6 PPB 23<br />
6-55-76 12-Feb-88 H2O Barium, filtered 6 PPB 24<br />
6-55-76 6-Jun-88 H2O Barium, filtered 6 PPB 27<br />
6-55-76 21-Nov-88 H2O Barium, filtered 6 PPB 19<br />
6-67-86 22-Dec-87 H2O Barium, filtered 6 PPB 17<br />
6-67-86 23-Feb-88 H2O Barium, filtered 6 PPB 13<br />
6-67-86 22-Jun-88 H2O Barium, filtered 6 PPB 14<br />
6-67-86 30-Aug-88 H2O Barium, filtered 6 PPB 17<br />
6-67-86 13-Jan-89 H2O Barium, filtered 6 PPB 12<br />
6-S3-25 8-Jun-87 H2O Barium, filtered 6 PPB 66<br />
6-S3-25 15-Sep-87 H2O Barium, filtered 6 PPB 64<br />
6-S31-1 22-Jun-87 H2O Barium, filtered 6 PPB 19<br />
APP D2-60
DOE/RL 88-41<br />
Revision 1<br />
Table D2-8. Concentrations Used for Calculation of<br />
Baseline Values. (sheet 7 of 11)<br />
Collection Analyte Detect.<br />
Well Date No. Analyte Name Limit Units Conc.<br />
6-S31-1 24-Aug-87 H2O Barium, filtered 6 PPB 19<br />
6-S31-1 4-Aug-88 H2O Barium, filtered 6 PPB 6<<br />
6-19-43 28-Dec-87 A07 Cadmium 2 PPB 2<<br />
6-32-77 5-Feb-86 A07 Cadmium 2 PPB 2<<br />
6-55-76 21-Nov-88 A07 Cadmium 2 PPB 2<<br />
6-S31-1 17-Oct-85 A07 Cadmium 2 PPB 2<<br />
6-S31-1 4-Aug-88 A07 Cadmium 2 PPB 2<<br />
R 6-19-43 3-Feb-88 H21 Cadmium, filtered 2 PPB 2<<br />
6-19-43 22-May-88 H21 Cadmium, filtered 2 PPB 2<<br />
F - 6-19-43 16-Sep-88 H21 Cadmium, filtered 2 PPB 2<<br />
6-32-77 15-Nov-87 H21 Cadmium, filtered 2 PPB 2<<br />
6-32-77 4-Jan-88 H21 Cadmium, filtered 2 PPB 2<<br />
6-32-77 11-May-88 H21 Cadmium, filtered 2 PPB 2<<br />
6-32-77 24-Aug-88 H21 Cadmium, filtered 2 PPB 2<<br />
6-55-76 2-Dec-87 H21 Cadmium, filtered 2 PPB 2<<br />
6-55-76 12-Feb-88 H21 Cadmium, filtered' 2 PPB 2<<br />
x- 6-55-76 6-Jun-88 H21 Cadmium, filtered 2 PPB 2<<br />
6-55-76 21-Nov-88 H21 Cadmium, filtered 2 PPB 2<<br />
6-67-86 22-Dec-87 H21 Cadmium, filtered 2 PPB 2<br />
6-67-86 23-Feb-88 H21 Cadmium, filtered 2 PPB 2<<br />
6-67-86 22-Jun-88 H21 Cadmium, filtered 2 PPB 2<<br />
6-67-86 30-Aug-88 H21 Cadmium, filtered 2 PPB 2<<br />
6-67-86 13-Jan-89 H21 Cadmium, filtered 2 PPB 2<<br />
£3, 6-S3-25 8-Jun-87 H21 Cadmium, filtered 2 PPB 2<<br />
6-S3-25 15-Sep-87 H21 Cadmium, filtered 2 PPB 2<<br />
6-S31-1 22-Jun-87 H21 Cadmium, filtered 2 PPB 2<<br />
6-S31-1 24-Aug-87 H21 Cadmium, filtered 2 PPB 2<<br />
6-S31-1 4-Aug-88 H21 Cadmium, filtered 2 PPB 2<<br />
6-19-43 28-Dec-87 A08 Chromium 10 PPB 10<<br />
6-32-77 5-Feb-86 A08 Chromium 10 PPB 10<<br />
6-55-76 21-Nov-88 A08 Chromium 10 PPB 10<<br />
6-S31-1 17-Oct-85 A08 Chromium 10 PPB 10<<br />
6-S31-1 4-Aug-88 A08 Chromium 10 PPB 10<<br />
6-19-43 3-Feb-88 H22 Chromium, filtered 10 PPB 10<<br />
6-19-43 22-May-88 H22 Chromium, filtered 10 PPB 10<<br />
6-19-43 16-Sep-88 H22 Chromium, filtered 10 PPB 10<<br />
6-32-77 15-Nov-87 H22 Chromium, filtered 10 PPB 10<<br />
APP D2-61
Pte,<br />
rq<br />
°.r<br />
DOE/RL 88-41<br />
Revision 1<br />
Table D2-8. Concentrations Used for Calculation of<br />
Baseline Values. (sheet 8 of 11)<br />
Collection Analyte Detect.<br />
Well Date No. Analyte Name Limit Units Conc.<br />
6-32-77 4-Jan-88 H22 Chromium, filtered 10 PPB 10<<br />
6-32-77 11-May-88 H22 Chromium, filtered 10 PPB 10<<br />
6-32-77 24-Aug-88 H22 Chromium, filtered 10 PPB 10<<br />
6-55-76 2-Dec-87 H22 Chromium, filtered 10 PPB 10<<br />
6-55-76 12-Feb-88 H22 Chromium, filtered 10 PPB 10<<br />
6-55-76 6-Jun-88 H22 Chromium, filtered 10 PPB 10<<br />
6-55-76 21-Nov-88 H22 Chromium, filtered 10 PPB 10<<br />
6-67-86 22-Dec-87 H22 Chromium, filtered 10 PPB 18<br />
6-67-86 23-Feb-88 H22 Chromium, filtered 10 PPB 20<br />
6-67-86 22-Jun-88 H22 Chromium, filtered 10 PPB 21<br />
6-67-86 30-Aug-88 H22 Chromium, filtered 10 PPB 26<br />
6-67-86 13-Jan-89 H22 Chromium, filtered 10 PPB 25<br />
6-S3-25 8-Jun-87 H22 Chromium, filtered 10 PPB 10<<br />
6-S3-25 15-Sep-87 H22 Chromium, filtered 10 PPB 10<<br />
6-S31-1 22-Jun-87 H22 Chromium, filtered 10 PPB 10<<br />
6-S31-1 24-Aug-87 H22 Chromium, filtered 10 PPB 10<<br />
6-S31-1 4-Aug-88 H22 Chromium, filtered 10 PPB 10<<br />
6-S31-1 17-Oct-85 A09 Lead 30 PPB 30<<br />
6-19-43 3-Feb-88 H41 Lead, filtered 5 PPB 5<<br />
6-19-43 22-May-88 H41 Lead, filtered 5 PPB 5<<br />
6-32-77 15-Nov-87 H41 Lead, filtered 5 PPB 5<<br />
6-32-77 4-Jan-88 H41 Lead, filtered 5 PPB 5<<br />
6-32-77 11-May-88 H41 Lead, filtered 5 PPB 5<<br />
6-55-76 2-Dec-87 H41 Lead, filtered 5 PPB 5<<br />
6-55-76 12-Feb-88 H41 Lead, filtered 5 PPB 5<<br />
6-55-76 6-Jun-88 H41 Lead, filtered 5 PPB 5<<br />
6-55-76 21-Nov-88 H41 Lead, filtered 5 PPB 5<<br />
6-67-86 22-Dec-87 H41 Lead, filtered 5 PPB 5<<br />
6-67-86 23-Feb-88 H41 Lead, filtered 5 PPB 5<<br />
6-67-86 22-Jun-88 H41 Lead, filtered 5 PPB 5<<br />
6-S3-25 8-Jun-87 H41 Lead, filtered 5 PPB 5<<br />
6-S3-25 15-Sep-87 H41 Lead, filtered 5 PPB 5<<br />
6-S31-1 22-Jun-87 H41 Lead, filtered 5 PPB 5<<br />
6-S31-1 24-Aug-87 H41 Lead, filtered 5 PPB 5<<br />
6-S31-1 4-Aug-88 H41 Lead, filtered 5 PPB 5<<br />
6-19-43 28-Dec-87 A22 Selenium 5 PPB 5<<br />
6-32-77 5-Feb-86 A22 Selenium 5 PPB 5<<br />
6-55-76 21-Nov-88 A22 Selenium 5 PPB 5<<br />
APP D2-62
DOE/RL 88-41<br />
Revision 1<br />
Table D2-8. Concentrations Used for Calculation of<br />
Baseline Values. (sheet 9 of 11)<br />
Collection Analyte Detect.<br />
Well Oate No, Analvte Name Limit Units Conc.<br />
6-S31-1 17-Oct-85 A22 Selenium 5 PPB 5<<br />
6-S31-1 4-Aug-88 A22 Selenium 5 PPB 5<<br />
6-19-43 3-Feb-88 H39 Selenium, filtered 5 PPB 5<<br />
6-19-43 22-May-88 H39 Selenium, filtered 5 PPB 5<<br />
6-32-77 15-Nov-87 H39 Selenium, filtered 5 PPB 5<<br />
6-32-77 4-Jan-88 H39 Selenium, filtered 5 PPB 5<<br />
6-32-77 11-May-88 H39 Selenium, filtered 5 PPB 5<<br />
6-55-76 2-Dec-87 H39 Selenium, filtered 5 PPB 5<<br />
6-55-76 12-Feb-88 H39 Selenium, filtered 5 PPB 5<<br />
^. 6-55-76 6-Jun-88 H39 Selenium, filtered 5 PPB 5<<br />
6-55-76 21-Nov-88 H39 Selenium, filtered 5 PPB 5<<br />
6-67-86 22-Dec-87 H39 Selenium, filtered 5 PPB 5<<br />
6-67-86 23-Feb-88 H39 Selenium, filtered 5 PPB 5<<br />
6-67-86 22-Jun-88 H39 Selenium, filtered 5 PPB 5<<br />
6-S3-25 8-Jun-87 H39 Selenium, filtered 5 PPB 5<<br />
6-S3-25 15-Sep-87 H39 Selenium, filtered 5 PPB 5<<br />
6-S31-1 22-Jun-87 H39 Selenium, filtered 5 PPB 5<<br />
6-S31-1 24-Aug-87 H39 Selenium, filtered 5 PPB 5<<br />
6-S31-1 4-Aug-88 H39 Selenium, filtered 5 PPB 5<<br />
k<br />
6-19-43 28-Dec-87 A21 Mercury 0.1 PPB 0.1<<br />
6-32-77 5-Feb-86 A21 Mercury 0.1 PPB 0.1<<br />
6-55-76 21-Nov-88 A21 Mercury 0.1 PPB 0.1<<br />
6-S31-1 17-Oct-85 A21 Mercury 0.1 PPB 0.1<<br />
6-S31-1 4-Aug-88 A21 Mercury 0.1 PPB 0.1<<br />
6-19-43 3-Feb-88 H38 Mercury, filtered 0.1 PPB 0.1<<br />
6-19-43 22-May-88 H38 Mercury, filtered 0.1 PPB 0.1<<br />
6-32-77 15-Nov-87 H38 Mercury, filtered 0.1 PPB 0.1<<br />
6-32-77 4-Jan-88 H38 Mercury, filtered 0.1 PPB 0.1<<br />
6-32-77 11-May-88 H38 Mercury, filtered 0.1 PPB 0.1<<br />
6-55-76 2-Dec-87 H38 Mercury, filtered 0.1 PPB 0.1<<br />
6-55-76 12-Feb-88 H38 Mercury, filtered 0.1 PPB 0.1<<br />
6-55-76 6-Jun-88 H38 Mercury, filtered 0.1 PPB 0.1<<br />
6-55-76 21-Nov-88 H38 Mercury, filtered 0.1 PPB 0.1<<br />
6-67-86 22-Dec-87 H38 Mercury, filtered 0.1 PPB 0.1<<br />
6-67-86 23-Feb-88 H38 Mercury, filtered 0.1 PPB 0.1<<br />
6-67-86 22-Jun-88 H38 Mercury, filtered 0.1 PPB 0.1<<br />
6-S3-25 8-Jun-87 H38 Mercury, filtered 0.1 PPB 0.1<<br />
6-S3-25 15-Sep-87 H38 Mercury, filtered 0.1 PPB 0.1<<br />
6-S31-1 22-Jun-87 H38 Mercury, filtered 0.1 PPB 0.1<<br />
APP D2-63
DOE/RL 88-41<br />
Revision 1<br />
Table D2-8. Concentrations Used for Calculation of<br />
Baseline Values. (sheet 10 of 11)<br />
Collection Analyte Detect.<br />
Well Date No. Analyte Name Limit Units Conc,<br />
6-S31-1 24-Aug-87 H38 Mercury, filtered 0.1 PPB 0.1<<br />
6-S31-1 4-Aug-88 H38 Mercury, filtered 0.1 PPB 0.1<<br />
6-19-43 28-Dec-87 AN Silver 10 PPB 10<<br />
6-32-77 5-Feb-86 AN Silver 10 PPB 10<<br />
6-55-76 21-Nov-88 AN Silver 10 PPB 10<<br />
6-S31-1 17-Oct-85 AN Silver 10 PPB 10<<br />
6-S31-1 4-Aug-88 A10 Silver 10 PPB 10<<br />
^. 6-19-43 3-Feb-88 H23 Silver, filtered 10 PPB 10<<br />
6-19-43 22-May-88 H23 Silver, filtered 10 PPB 10<<br />
ar° 6-19-43 16-Sep-88 H23 Silver, filtered 10 PPB 10<<br />
6-32-77 15-Nov-87 H23 Silver, filtered 10 PPB 10<<br />
6-32-77 4-Jan-88 H23 Silver, filtered 10 PPB 10<<br />
6-32-77 11-May-88 H23 Silver, filtered 10 PPB 10<<br />
6-32-77 24-Aug-88 H23 Silver, filtered 10 PPB 10<<br />
6-55-76 2-Dec-87 H23 Silver, filtered 10 PPB 10<<br />
6-55-76 12-Feb-88 H23 Silver, filtered 10 PPB 10<<br />
u-- 6-55-76 6-Jun-88 H23 Silver, filtered 10 PPB 10<<br />
6-55-76 21-Nov-88 H23 Silver, filtered 10 PPB 10<<br />
6-67-86 22-Dec-87 H23 Silver, filtered 10 PPB 10<<br />
6-67-86 23-Feb-88 H23 Silver, filtered 10 PPB 10<<br />
6-67-86 22-Jun-88 H23 Silver, filtered 10 PPB 10<<br />
6-67-86 30-Aug-88 H23 Silver, filtered 10 PPB 10<<br />
6-67-86 13-Jan-89 H23 Silver, filtered 10 PPB 10<<br />
r. 6-S3-25 8-Jun-87 H23 Silver, filtered 10 PPB 10<<br />
6-S3-25 15-Sep-87 H23 Silver, filtered 10 PPB 10<<br />
6-S31-1 22-Jun-87 H23 Silver, filtered 10 PPB 10<<br />
6-S31-1 24-Aug-87 H23 Silver, filtered 10 PPB 10<<br />
6-S31-1 4-Aug-88 H23 Silver, filtered 10 PPB 10<<br />
6-19-43 28-Dec-87 A13 Copper 10 PPB 10<<br />
6-32-77 5-Feb-86 A13 Copper 10 PPB 10<<br />
6-55-76 21-Nov-88 A13 Copper 10 PPB 10<<br />
6-S31-1 17-Oct-85 A13 Copper 10 PPB 10<<br />
6-S31-1 4-Aug-88 A13 Copper 10 PPB 10<<br />
6-19-43 3-Feb-88 H26 Copper, filtered 10 PPB 10<<br />
6-19-43 22-May-88 H26 Copper, filtered 10 PPB 10<<br />
6-19-43 16-Sep-88 H26 Copper, filtered 10 PPB 10<<br />
6-32-77 15-Nov-87 H26 Copper, filtered 10 PPB 10<<br />
APP D2-64
-:<br />
DOE/RL 88-41<br />
Revision 1<br />
Table D2-8. Concentrations Used for Calculation of<br />
Baseline Values. (sheet 11 of 11)<br />
Collection Analyte Detect.<br />
Well Date No. Analvte Name ligil Units Conc.<br />
6-32-77 4-Jan-88 H26 Copper, filtered 10 PPB 10<<br />
6-32-77 11-May-88 H26 Copper, filtered 10 PPB 10<<br />
6-32-77 24-Aug-88 H26 Copper, filtered 10 PPB 10<<br />
6-55-76 2-Dec-87 H26 Copper, filtered 10 PPB 10<<br />
6-55-76 12-Feb-88 H26 Copper, filtered 10 PPB 10<<br />
6-55-76 6-Jun-88 H26 Copper, filtered 10 PPB 10<<br />
6-55-76 21-Nov-88 H26 Copper, filtered 10 PPB 10<<br />
6-67-86 22-Dec-87 H26 Copper, filtered 10 PPB 10<<br />
6-67-86 23-Feb-88 H26 Copper, filtered 10 PPB 12<br />
6-67-86 22-Jun-88 H26 Copper, filtered 10 PPB 10<<br />
6-67-86 30-Aug-88 H26 Copper, filtered 10 PPB 10<<br />
6-67-86 13-Jan-89 H26 Copper, filtered 10 PPB 10<<br />
6-S3-25 8-Jun-87 H26 Copper, filtered 10 PPB 10<<br />
6-S3-25 15-Sep-87 H26 Copper, filtered 10 PPB 10<<br />
6-S31-1 22-Jun-87 H26 Copper, filtered 10 PPB 10<<br />
6-S31-1 24-Aug-87 H26 Copper, filtered 10 PPB 10<<br />
6-S31-1 4-Aug-88 H26 Copper, filtered 10 PPB 10<<br />
APP D2-65
^-B<br />
DOE/RL 88-41<br />
Revision 1<br />
1<br />
2<br />
3<br />
4<br />
5 This page intentionally left blank.<br />
APP D2-66
p. .<br />
f°°s<br />
DOE/RL 88-41<br />
Revision 1<br />
1 APPENDIX E-1<br />
2<br />
3 PHASE II SAMPLING PLAN FOR 2101-M POND<br />
4 AND<br />
5 ADJACENT RAINWATER RUN-OFF DITCH<br />
910313.1346<br />
APP El-i
P^<br />
f<br />
M'Y<br />
1<br />
910313.1346<br />
DOE/RL 88-41<br />
Revision 1<br />
This page intentionally left blank.<br />
APP E1-ii
1<br />
2<br />
3<br />
4<br />
5<br />
6<br />
7<br />
8<br />
9<br />
10<br />
11<br />
12<br />
13<br />
14<br />
15<br />
16<br />
17<br />
X1'8<br />
19<br />
` 20<br />
e.21<br />
22<br />
C13<br />
24<br />
25<br />
26<br />
27<br />
_28<br />
29<br />
"30<br />
31<br />
32<br />
33<br />
—34<br />
X35<br />
36<br />
37<br />
38<br />
39<br />
40<br />
41<br />
42<br />
43<br />
910313.1346<br />
DOE/RL 88-41<br />
Revision 1<br />
CONTENTS<br />
1.0 PHASE II SAMPLING PLAN FOR 2101-M POND<br />
AND ADJACENT RAINWATER RUN-OFF DITCH . . . . . . . . . . . . . E1-1<br />
1.1 INTRODUCTION . . . . . . . . . . . . . . . . . . . . . . . El-1<br />
2.0 BACKGROUND INFORMATION . . . . . . . . . . . . . . . . . . . . E1-1<br />
2.1 SOIL DESCRIPTION . . . . . . . . . . . . . . . . . . . . . E1-2<br />
2.2 SITE TOPOGRAPHY . . . . . . . . . . . . . . . . . . . . . E1-2<br />
2.3 EFFLUENT SOURCES . . . . . . . . . . . . . . . . . . . . . E1-2<br />
3.0 POND WATER SAMPLING DESIGN . . . . . . . . . . . . . . . . . . E1-2<br />
3.1 SAMPLE DESIGN . . . . . . . . . . . . . . . . E1-3<br />
3.1.1 Size, Shape, and Dimensions . . . . . . . . . . . . E1-3<br />
3.1.2 Inflow and Outflow Rates . . . . . . . . . . . . . E1-5<br />
3.1.3 Flow Velocities . . . . . . . . . . . . . E1-6<br />
3.1.4 Sampling Point Accessibility . . . . . . . . . . . E1-6<br />
3.1.5 Sample Point Selection . . . . . . . . . . . . . . E1-6<br />
3.1.6 Sampling Methods . . . . . . . . . . . . . . . . . El-7<br />
4.0 SOIL SAMPLING DESIGN . . . . . . . . . . . . . . . . . . . . . E1-7<br />
4.1 SAMPLING DESIGN . . . . . . . . . . . . . . . . . . . . . E1-10<br />
4.2 SAMPLE LOCATIONS . . . . . . . . . . . . . . . . . . E1-11<br />
4.2.1 Effluent Depression . . . . . . . . . . . . . . . . E1-11<br />
4.2.2 Pond Arms . . E1-11<br />
4.2.3 Rainwater Run-off Ditch E1-11<br />
4.3 SELECTION OF SAMPLING METHOD . . . . . . . . . .. E1-11<br />
4.4 SELECTION OF ANALYTICAL PARAMETERS FOR<br />
2101-M POND SOIL . . . . . . . . . . . . . . . . E1-13<br />
4.5 APPENDIX IX SAMPLE ANALYSIS . . . . . . . . . . . . E1-15<br />
4.6 SAMPLING AND DATA ANALYSIS SCHEDULE . . . . . . . . . . . E1-15<br />
5.0 SAMPLING QUALITY ASSURANCE AND QUALITY CONTROL . . . . . . . . E1-15<br />
5.1 SAMPLE HANDLING . . . . . . . . . . . . . . . . . . E1-15<br />
5.2 SAMPLE PACKAGING AND SHIPPING . . . . . . . . . . . . . . E1-15<br />
5.3 CHAIN OF CUSTODY . . . . . . . . . . . . . . . . . . . . . E1-15<br />
5.4 FIELD LOGBOOK . . . . . . . . . E1-16<br />
5.5 QUALITY ASSURANCE/QUALITY CONTROL SAMPLES . . . . . . . . E1-16<br />
6.0 DATA ANALYSIS . . . . . . . . . . . . . . . . . . . . . . . . . E1-16<br />
7.0 REFERENCES E1-16<br />
APP E1-iii
1<br />
2<br />
3<br />
4<br />
5<br />
6<br />
7<br />
8<br />
9<br />
10<br />
11<br />
12<br />
13<br />
14<br />
15<br />
16<br />
Ltt 17<br />
18<br />
r<br />
r<br />
e^+<br />
^s<br />
910313.1346<br />
DOE/RL 88-41<br />
Revision 1<br />
LIST OF FIGURES<br />
E1-1 Proposed Pond Water Sample Areas . . . . . . . . . . . . . . . E1-9<br />
E1-2 Sample Points for 2101-M Pond . . . . . . . . . . . . . . . . Ei-12<br />
LIST OF TABLES<br />
E1-1 Analyte List for 2101-M Pond Water . . . . . . . . . . . . . .<br />
E 1-2 Random Numbers Table . . . . . . . . . . . . . . . . . . . . .<br />
E1-3 Selected Constituents for Analysis in<br />
2101-M Pond Soils . . . . . . . . . . . . . . . . . . . . . .<br />
APP E1-iv<br />
E1-4<br />
E1-8<br />
E1-14
910313.1346<br />
1.1 INTRODUCTION<br />
DOE/RL 88-41<br />
Revision 1<br />
APPENDIX E-1<br />
1.0 PHASE II SAMPLING PLAN FOR 2101-M POND<br />
This sampling plan is designed to complement the original site<br />
characterization effort at the 2101-M Pond done during 1988 (see<br />
Section B-5). Based on the information learned in the statistical analysis<br />
of the initial sampling data, the top 2 ft of the pond soil need further<br />
evaluation (see Section B-5f and Appendix C-5 for further information). To<br />
do this, the pond soil will be sampled to a depth of 2 ft. There will be<br />
two samples taken from each sampling point. The first sample will be from<br />
0 - 6 in., and the second sample will be from 18 - 24 in. The pond water<br />
also will be sampled to determine the presence of any soluble constituents.<br />
During the 1988 sampling effort the rainwater run-off ditch located<br />
south of the pond, was sampled to determine if its soils had been<br />
contaminated by any of the water from the 2101-M Pond. Because of problems<br />
with laboratory holding times, some of the data obtained from these samples<br />
was useful only as informational data. Therefore, the rainwater run-off<br />
ditch also will be sampled to close the data gaps that exist from the<br />
1988 effort.<br />
The sampling plan is laid out in the following way:<br />
• Background Information<br />
• Pond Water Sampling Design<br />
• Soil Sampling Design<br />
• Sampling Quality Assurance and Quality Control.<br />
2.0 BACKGROUND INFORMATION<br />
The 2101-M Pond environment is a unique environment on the <strong>Hanford</strong><br />
<strong>Site</strong>. The average annual discharge volume to the pond is roughly 1.3 M gal.<br />
(Section B, Table B-1). Visually, the site is best described as a U-shaped<br />
surface impoundment, as opposed to a pond. The banks are mild to moderately<br />
steep in nature, depending on location. This, along with heavy vegetation,<br />
make getting large equipment on site without radically disturbing the area<br />
difficult (as was learned during the 1988 sampling effort). This uniqueness<br />
also leads to challenges in sampling the soil on a small interval while<br />
maintaining sample integrity.<br />
APP E1-1
o<br />
F<br />
R-<br />
1<br />
2<br />
3<br />
4<br />
5<br />
6<br />
7<br />
8<br />
9<br />
10<br />
11<br />
12<br />
13<br />
14<br />
15<br />
16<br />
17<br />
18<br />
19<br />
20<br />
21<br />
22<br />
23<br />
24<br />
25<br />
26<br />
27<br />
28<br />
29<br />
30<br />
31<br />
32<br />
33<br />
34<br />
35<br />
36<br />
37<br />
38<br />
39<br />
40<br />
41<br />
42<br />
43<br />
44<br />
45<br />
46<br />
47<br />
48<br />
49<br />
50<br />
51<br />
52<br />
910313.1346<br />
2.1 SOIL DESCRIPTION<br />
DOE/RL 88-41<br />
Revision 1<br />
The near surface soils at 2101-M Pond range in texture from a gravellymuddy<br />
sand to a slightly muddy-fine to very-fine sand. These soils have<br />
an approximate hydraulic conductivity (K) of about 1.1 x 10 -2 to<br />
3.5 x 10' 5 cm/sec (Chamness et al. 1990). This sandy soil lends itself well<br />
to percolation of liquids because of high hydraulic conductivity. The soils<br />
beneath the 2101-M Pond vary in texture from coarse, medium, and fine sands<br />
in the upper 200 ft, to gravels and sandy gravels below this depth. The<br />
depth to groundwater in the area is 311 ft (95 m) below ground surface<br />
(Chamness et al. 1990).<br />
2.2 SITE TOPOGRAPHY<br />
The 2101-M Pond area has a general topography that is extremely flat,<br />
averaging roughly 3 ft of slope change in 1,000 ft of distance. The<br />
2101-M Pond and the rainwater run-off ditch are the only major topographic<br />
points of consequence to natural surface drainage patterns. This natural<br />
topography has been altered by the construction of buildings, streets, and<br />
parking lots to the south and east end of the pond area. The drainage of<br />
these features is taken care of through subsurface drains that empty into<br />
the rainwater run-off ditch at its southern end (see Figures I-4 and I-8).<br />
2.3 EFFLUENT SOURCES<br />
There is one source of known inflow to the 2101-M Pond, and one<br />
potential source of inflow. These are the 2101-M Building drain (which is<br />
known), and surface waters by way of surface run-off and subsurface drains<br />
leading to the rainwater run-off ditch (that is indeterminate). Surface<br />
run-off into the pond is generally limited to precipitation off the berms to<br />
the north and south of the pond and the dirt road east of the pond.<br />
The rainwater run-off ditch, as reviewed in previous sections, does not<br />
appear to currently be, or appear to have ever been, connected to the<br />
2101-M Pond system. This ditch receives surface run-off water as described<br />
previously. The movement of this water through the barrier that separates<br />
the 2101-M Pond and the rainwater run-off ditch, is an unlikely occurrence<br />
as discussed in Section I.<br />
3.0 POND WATER SAMPLING DESIGN<br />
This section details the procedures and criteria that will be used in<br />
the sampling of surface waters at the 2101-M Pond. The following are<br />
informational objectives to the sampling of the pond water:<br />
• Comparison of pond water analysis to historical effluent stream<br />
data<br />
APP E1-2
910313.1346<br />
DOE/RL 88-41<br />
Revision 1<br />
Use pond water analysis as a screening device for the potential<br />
determination of any additional soil analytes.<br />
In the case of 2101-M Pond, where the effluent water has been<br />
previously characterized at the effluent point, the relative composition of<br />
the pond water will be assumed to be consistent with the results of this<br />
characterization effort (see Section B-3a(4) for further discussion). To<br />
establish validity of this assumption, the samples will be analyzed for<br />
constituents found in Appendix IX of 40 CFR 264 plus certain constituents<br />
specific to the <strong>Hanford</strong> <strong>Site</strong>. Table E1-1 lists the target compounds or<br />
group of compounds to be evaluated in 2101-M Pond water.<br />
3.1 POND WATER SAMPLE DESIGN<br />
The nature of the 2101-M Pond environment will affect the method of<br />
sampling chosen. The following factors were considered in the development<br />
of this sampling plan:<br />
• Pond size, shape, and dimensions<br />
• Rates of inflows and outflows from the sample environment<br />
• Flow velocities within the sample environment<br />
• Accessibility of the sample locations.<br />
Each of these bring about the selection of a sampling method by<br />
influencing the number of sampling points, the location of the sampling<br />
points, and the extent of the sampling.<br />
3.1.1 Size, Shape, and Dimensions<br />
From a water sampling standpoint, the 2101-M Pond is more closely<br />
described as a ditch. The bottom of the south arm is at a higher elevation<br />
than that of the north arm. Also, it is wider and slightly longer than the<br />
north arm. The east arm is basically at the same base elevation as the<br />
south arm, and the width is roughly 5 to 10 ft. Because of their proximity<br />
to the effluent discharge pipe, the east and south arm contain water on a<br />
perennial (or nearly so) basis. The north arm contains water only during<br />
those periods when discharge to the pond exceeds the carrying capacity of<br />
the other two arms. Therefore, sampling of pond water will most likely<br />
occur in the south and potentially the east arms, unless at the time of<br />
sampling the north arm also contains a sufficient amount of water.<br />
APP E1-3
12<br />
13<br />
14<br />
15<br />
16<br />
17<br />
18<br />
19<br />
20<br />
21<br />
22<br />
a_ 23<br />
24<br />
DOE/RL 88-41<br />
Revision 1<br />
1 Table E1-1. Analyte List for 2101-M Pond Water.<br />
2<br />
3 Ammonium Sulfide<br />
4 Arsenic Thallium<br />
5 Cyanide Total organic carbon (TOC)<br />
6 ICP Metals' Total organic halides (TOX)<br />
7 Fluoride pH<br />
8 Lead Reactivity<br />
9 Mercury Volatile organics<br />
10 Selenium<br />
fS^<br />
11 Semi-volatile organics<br />
910313.1426<br />
NOTE: Information on the method of chemical analysis and the<br />
required precision, accuracy, and minimum detection limits can be found<br />
in Table E2-1.<br />
'ICP targeted metals include:<br />
Barium Sodium<br />
Chromium Strontium<br />
Copper Vanadium<br />
Nickel Zinc.<br />
Silver<br />
b Ion chromatography, includes bromide, chloride, fluoride, nitrate,<br />
nitrite, phosphate, and sulfate, but only fluoride is targeted because of<br />
its concentration level in the 2101-M Pond soils.<br />
APP E1-4
990313.1346<br />
3.1.2 Inflow and Outflow Rates<br />
DOE/RL 88-41<br />
Revision 1<br />
The only established, consistent source of inflow to the 2101-M Pond is<br />
the 2101-M Building effluent pipe. An average flow rate from the pipe has<br />
never been measured. To determine an average flow rate into the pond from<br />
the discharge pipe, the average annual inflow to the pond from Table B-1 is<br />
used. This average estimate is 1,391,296 million gal/yr. This average is<br />
suspected to have varied over the 6 yr period of estimated quantities, and<br />
throughout each year because of variations in seasonal and diurnal demands<br />
on the building HVAC system.<br />
There are no outlets from the pond to other surface water bodies. This<br />
makes the only points of discharge from the pond to the atmosphere by way of<br />
evaporation, and to the soil and underlying sediments by way of percolation.<br />
The rate of evaporation on the <strong>Hanford</strong> <strong>Site</strong> is estimated to be 60 in./yr<br />
(Field et al. 1990). For a facility the size of 2101-M Pond this would<br />
equate to roughly 60,780 gal/yr of evaporation. This is based on a<br />
250-ft long trench, with a average width of 6.5 ft (a length of only 250 ft<br />
is used because the entire pond does not contain water on a perennial<br />
basis). Precipitation over the same time frame would add roughly<br />
12,760 gal/yr of water, based on the <strong>Hanford</strong> <strong>Site</strong> average annual<br />
precipitation of 6.3 in./yr (Stone et al. 1983), and a surface area of<br />
500 ft x 6.5 ft (the average surface area of the entire pond).<br />
Evapotranspiration through the local plant community is another source of<br />
water loss. The 2101-M Pond plant life consists of grasses, reeds,<br />
cattails, shrubs and trees. The annual evapotranspiration rate for the<br />
<strong>Hanford</strong> <strong>Site</strong> is calculated to be 54.75 in. which is roughly 0.15 in./d<br />
(Field et al. 1990). Assuming plant life occupies an area equal to<br />
approximately three-quarters that of the pond, 88,200 gal/yr of water<br />
evapotranspirate. By summing these three components, the annual water loss;<br />
other than percolation, would be calculated as follows:<br />
Evaporation 60,780<br />
Precipitation -12,760 (inflow)<br />
Evapotranspiration 88.200<br />
Total 136,220 gal/yr<br />
(370 gal/d)<br />
The minimum average annual inflow to the pond for the years 1982 - 1988<br />
is 1,391,296 gal/yr as stated earlier. If 136,216 gal/yr of water leaves<br />
the 2101-M Pond environment through evaporation and evapotranspiration an<br />
estimated annual total of 1,255,080 gal/yr to percolates through the soils<br />
beneath the pond. Assuming that the soils beneath the 2101-M Pond have<br />
achieved a state of moisture content equilibrium over the 30 - 40 years that<br />
the pond has received discharges, and is not in a state of annual flux, the<br />
total contribution to the groundwater from the 2101-M Pond is 2-3 gpm.<br />
These numbers seem to indicate that the inflow and outflow rates of the<br />
pond are virtually equal during average conditions. The only difference<br />
APP E1-5
^.s<br />
DOE/RL 88-41<br />
Revision 1<br />
1 being in the location of the flows. While the outflow is from the entire<br />
2 pond surface or through the pond soil, the inflow is concentrated at a<br />
3 single point. The water at this point is potentially chemically different<br />
4 from the water in the rest of the pond. Therefore, it is concluded that the<br />
5 water at the discharge must be evaluated separately from the rest of the<br />
6 pond.<br />
7<br />
8<br />
9 3.1.3 Flow Velocities<br />
10<br />
11 The source of any measurable flow velocity within the pond is at the<br />
12 effluent pipe. But, because of the size of the effluent depression (1.5-ft<br />
13 deep) formed by over 30+ yr of service (roughly 8 - 10 ft in diameter) the<br />
14 water within the depression, and the pond, remains fairly still.<br />
15<br />
16 The previous information indicates inflow to the pond under average<br />
17 conditions is roughly 2.6 gpm. This yields an average retention time in the<br />
18 depression area of roughly 3.5 hr. Therefore, flow velocities out of the<br />
19 depression area are very small. Because the 2101-M Pond has no outlet other<br />
20 than to groundwater or to the atmosphere, flow velocities are determined to<br />
21 not be of concern when designing the sampling plan.<br />
22<br />
23<br />
24 3.1.4 Sampling Point Accessibility<br />
25<br />
26 The accessibility of the desired sample points is a concern when<br />
27 selecting a sampling method. The 2101-M Pond is an excavated impoundment<br />
28 with both gradual to steep embankments depending on location. To avoid<br />
29 unnecessary contact with the pond water, and to avoid the accidental<br />
30 disturbance of the pond soils or the bank soils during sampling, sampling<br />
31 will need to be performed so that minimal disturbance to the surrounding<br />
32 soils is achieved.<br />
33<br />
34<br />
35 3.1.5 Sample Point Selection<br />
36<br />
37 The previous information indicates that the pond should be divided into<br />
38 two areas for taking water samples. These two areas would be the area that<br />
39 is in the immediate vicinity of the discharge pipe, and the rest of the<br />
40 pond.<br />
41<br />
42 The entire pond, outside of the 10-ft radius of the discharge pipe, was<br />
43 candidate for these sample sites. There is a high probability that the<br />
44 north arm of the pond will not have any water in it at the time of sampling.<br />
45 Therefore, any sample area randomly selected in the north arm also will have<br />
46 a substitute area for it located in either the south or east arm. The east<br />
47 arm areas also may require that a substitute area be selected depending on<br />
48 the time of the year and the amount of water present at the time of<br />
49 sampling. If there is water present in the east arm, but not of sufficient<br />
50 depth or quantity, a substitution area may be required. All such selections<br />
51 will be documented in the field logbook with justification for the selection<br />
52 of the substitute sample area.<br />
910313.1346<br />
APP E1-6
910313.1346<br />
DOE/RL 88-41<br />
Revision 1<br />
Because the linear dimension of the pond is roughly 500 ft, four random<br />
numbers between 1 and 50 were selected from a random number table. The<br />
random numbers table used to generate these numbers is presented in<br />
Table E1-2. To determine the random numbers, the process described in<br />
Section B5-a (1.1) was used. The starting point in the table was the<br />
2nd row, 8th column. Each number represents a 10-ft section of the pond<br />
(the first 10 ft, the second 10 ft, and so on) from which a sample can be<br />
taken. Numbers for which a duplicate were required were 14, 20, 26; numbers<br />
not eligible for selection because of proximity to the discharge pipe were<br />
27 and 28. Figure E1-1 shows the selected water sampling areas. Those<br />
areas followed by an (*) are substitutes for north arm areas, those followed<br />
by (**) are substitutes for east arm areas. A fifth water sample will be<br />
taken at the effluent.<br />
3.1.6 Sampling Methods<br />
To achieve proper sampling of the pond water while minimizing sources<br />
of error is complicated by the sometimes shallow depth of the 2101-M Pond.<br />
The preferred sampling method will be the use of a pair of tongs to hold the<br />
sample bottle while a sample is collected by submerging the sample bottle.<br />
If it is determined that there is insufficient depth to use this method,<br />
then a secondary method will be used at the same site. The substitute<br />
method to sample the pond water will involve the use of glass pipettes and a<br />
way of pulling the water into the pipettes by means of a pipette suction<br />
bulb. An array of pipettes of differing volumes will be employed so that<br />
each sample container can be filled with one use of the pipette if possible.<br />
The filling of the sample bottle with a pipette also will minimize the<br />
amount of disturbance to the water as it is put into the sample container.<br />
The pipette will be placed at the bottom of the sample bottle, and then the<br />
water will be slowly released into the container with the pipette remaining<br />
submerged.<br />
4.0 SOIL SAMPLING DESIGN<br />
This section details the procedures and criteria that will be used in<br />
the sampling of soils in the 2101-M Pond. The site has previously been<br />
characterized to a depth of 12 ft. For a discussion of that sampling<br />
effort, refer to Section B-5.<br />
The objectives of Phase II sampling are described as follows:<br />
Characterize the top 2 ft of soils to identify any location or<br />
depth effects of target analytes in these soils<br />
APP E1-7
910313.1346<br />
DOE/RL 88-41<br />
Revision 1<br />
Table E1-2. Random Numbers Table.<br />
03 47 43 73 86 36 96 47 36 61 46 98 63 71 62<br />
97 74 24 67 62 42 81 14 57 20 42 53 32 37 32<br />
16 76 62 27 66 56 50 26 71 07 32 90 79 78 53<br />
12 56 85 99 26 96 96 68 27 31 05 03 72 93 15<br />
55 59 56 35 64 38 54 82 46 22 31 62 43 09 90<br />
16 22 77 94 39 49 54 43 54 82 17 37 93 23 78<br />
84 42 17 53 31 57 24 55 06 88 77 04 74 47 67<br />
63 01 63 78 59 16 95 55 67 19 98 10 50 71 75<br />
33 211 12 34 29 78 64 56 07 82 52 42 07 44 38<br />
57 60 86 32 44 09 47 27 96 54 49 17 46 09 62<br />
18 18 07 92 46 44 17 16 58 09 79 83 86 19 62<br />
26 62 38 97 75 84 16 07 44 99 83 11 46 32 24<br />
23 42 40 64 74 82 97 77 77 81 07 45 32 14 08<br />
52 36 28 19 95 50 92 26 11 97 00 56 76 31 38<br />
37 85 94 35 12 83 39 50 08 30 42 34 07 96 88<br />
70 29 17 12 13 40 33 20 38 26 13 89 51 03 74<br />
56 62 18 37 35 96 83 50 87 75 97 12 25 93 47<br />
99 49 57 22 77 88 42 95 45 72 16 64 36 16 00 -<br />
16 08 15 04 72 33 27 14 34 09 45 59 34 68 49<br />
31 16 93 32 43 50 27 89 87 19 20 15 37 00 49<br />
APP E1-8
a vM<br />
w<br />
v 00<br />
3»N 3P.<br />
0 50 100<br />
0 1 1 1, 1 1 1 1 1 1 1<br />
sod* In Feet<br />
Rain Water<br />
Run— off Ditch<br />
9 - q<br />
5 8ertn9 ^( II H 1,42<br />
Storm Drain ^<br />
High Berm<br />
• Substitute for North<br />
Arm Sample Area<br />
t7<br />
A O<br />
•• Substitute for Ea st m m<br />
14 Arm Sample Area<br />
® Not Eilillbie to h<br />
be Sampled<br />
o Co<br />
= co<br />
20<br />
11 Dirt Road<br />
Proposed Water Sample Areas<br />
2101—M Phase a<br />
1 Figure E1-l. Proposed Pond Water Sample Areas.<br />
Effluent from 2101—M 140\0e70e0--A
1)<br />
rl-t<br />
-s<br />
ON<br />
DOE/RL 88-41<br />
Revision 1<br />
1 • Analyze soil samples from the rainwater run-off ditch for those<br />
2 compounds whose holdings times were exceeded during the initial<br />
3 sampling effort<br />
4<br />
5 • Corroborate Phase I soil sample data analysis.<br />
6<br />
7 This previous sampling effort (summer 1988) seems to indicate a<br />
8 variability with location for some of the analytes. To pinpoint these<br />
9 potential variabilities, characterization of the top 2 ft of pond soil on a<br />
10 smaller sampling interval and greater spatial detail, is necessary.<br />
11<br />
12 The one basic criterion analyzed to choose the sampling strategy was<br />
13 pond geometry. The 2101-M Pond is a U-shaped ditch, into which the flows<br />
14 are unequal. As described earlier, the south arm of the system is the arm<br />
15 of preferential flow. It is wider, and slightly longer than the north arm.<br />
16 It is also the area of heavier vegetative growth. However, from the<br />
17 statistical analysis done for the first round of sampling this area of the<br />
18 pond has fewer background exceedances than the other areas. It is theorized<br />
19 that this is because of the leaching effects of the water, that this arm<br />
20 experiences.<br />
21<br />
22 The north arm has historically only contained water when the discharge<br />
23 volume is highest. The statistical analysis would seem to support the<br />
24 theory that because there is variable flow to this arm, there is less<br />
25 leaching of constituents, and therefore, potential buildup.<br />
26<br />
27 The discharge depression area deserves attention for entirely different<br />
28 reasons. Because it is the initial point of discharge and contains water on<br />
29 a perennial basis, preferential sorbing of constituents (especially metals)<br />
30 is theorized in this area. This is supported by the number of exceedances<br />
31 noted in the initial round of sampling (Section C-5).<br />
32<br />
33<br />
34 4.1 SAMPLING DESIGN<br />
35<br />
36 Simple random, stratified random, judgmental, and systematic sampling<br />
37 were evaluated as possible methods for sampling the 2101-M Pond soil and<br />
38 rainwater run-off ditch. Based on statistical information from the initial<br />
39 round of sampling, a combination of judgmental and systematic sampling will<br />
40 be used.<br />
41<br />
42 This selected approach is based on the information from the initial<br />
43 round of sampling that suggests that the areas of greatest concern are in<br />
44 order: (1) the effluent discharge, (2) the north arm, (3) the east arm, and<br />
45 (4) the south arm. With this knowledge, sampling emphasis.will be placed on<br />
46 the discharge area with the rest of the pond receiving uniform coverage.<br />
910313.1346<br />
APP E1-10
910313.1346<br />
4.2 SAMPLE LOCATIONS<br />
4.2.1 Effluent Depression<br />
DOE/RL 88-41<br />
Revision i<br />
The effluent depression point will be sampled once at its center<br />
(point G) and twice at its outer perimeter points F and H (Figure E1-2).<br />
The outer perimeter sample sites will be on the edges leading into the east<br />
and south arms. The next sample points (E and I) will be 10 ft beyond the<br />
perimeter points.<br />
4.2.2 Pond Arms<br />
The three arms of the pond will each contain a minimum of two sample<br />
points. The initial sample points (D and J) will be located 50 ft from the<br />
sample points E and I, along the centerline of the arm. Subsequent sampling<br />
points (A, B, C, K, L) will be located 50 ft apart (Figure E1-2). This<br />
configuration will yield 12 sample points and provide a spatial picture of<br />
the surface soils in the pond.<br />
The sampling points will be located as close to the centerlines of the<br />
pond arms as possible. At points where cobbles make it impossible to obtain<br />
an adequate volume of material to perform analysis, a point as close as<br />
possible to the original one will be used.<br />
4.2.3 Rainwater Run-off Ditch<br />
Because the objective in resampling the rainwater run-off ditch is to<br />
close data gaps that exist because of exceeded sample holding times, the<br />
sampling effort for the ditch in this phase will duplicate the first effort.<br />
The sample points will be as close as possible to those used in the initial<br />
effort (Figure E1-2). A 1-ft sample will be taken from these points and<br />
homogenized, and then a composite taken.<br />
4.3 SELECTION OF SAMPLING METHOD<br />
The sampling method chosen to collect samples from the top 2 ft of the<br />
2101-M Pond soil and the top foot of the rainwater run-off ditch is ASTM<br />
method D 1452-80 (Standard Practice for Soil Investigations and Sampling by<br />
Auger Borings (ASTM 1990)]. At each sampling site, two samples will be<br />
taken: One from 0-6 in. and the other at 18-24 in. To ensure adequate soil<br />
for laboratory analysis, more than one core may need to be taken at each<br />
site. Samples will be combined with their respective depths. The type of<br />
auger bit to be used will be an open tubular or orchard barrel type auger<br />
made of stainless steel and fitted with solid stainless-steel inner rings or<br />
a split sleeve. This method provides a disturbed but representative soil<br />
sample. Because of the vegetation and the steep banks that are present at<br />
the site, a mobile drill rig will not be used to drive the sampling<br />
APP E1-11
n<br />
ro<br />
v<br />
M<br />
N)<br />
N<br />
z<br />
E<br />
t<br />
Proposed Sall Sample Points<br />
2101-M Phase 11<br />
i<br />
1 Figure E1-2. Sample Points for 2101-M Pond.<br />
w"mco-A<br />
0<br />
Mo<br />
M m<br />
w<br />
< a<br />
z<br />
a r<br />
o CO<br />
=m<br />
F+ p
910313.1346<br />
DOE/RL 88-41<br />
Revision 1<br />
equipment. The basic sampling methodology is described in WHC-CM-7-7,<br />
Environmental Investigations and <strong>Site</strong> Characterization Manual (WHC 1989)<br />
4.4 SELECTION OF ANALYTICAL PARAMETERS<br />
FOR 2101-M POND SOIL<br />
Section B-5 of the 2101-M Pond Closure Plan gives a detailed<br />
explanation of the principles used in the initial round of sampling<br />
activities at 2101-M Pond. The data from this initial sampling effort<br />
suggests that there are only a few potential constituents of concern because<br />
of exceedances of background threshold values in the soils at the<br />
2101-M Pond (Appendix C-5). This should not be construed to exempt other<br />
constituents from further evaluation. Constituents that will compose the<br />
target analyte list for this Phase II sampling plan include the following<br />
general list:<br />
• Constituents known to have been discharged to the pond<br />
• Constituents determined to have exceeded the background threshold<br />
value (Phase I sampling data)<br />
• Constituents whose presence in the initial sample results is of<br />
questionable validity or are present for unknown reasons<br />
• Metals, because of theorized preferential sorbing<br />
• Any constituents that are detected in 2101-M Pond water above<br />
established drinking water standard maximum contamination levels.<br />
A list of those constituents that meet any of the above criteria,<br />
except for the last one, appear in Table E1-3.<br />
There are six organic compounds that were identified in the initial<br />
round of sampling as being present in the 2101-M Pond soils (acetone,<br />
toluene, methylene chloride, ethanol, propanol, and butanoic acid). Three<br />
of which are naturally occurring organic compounds. These three are<br />
butanoic acid, ethanol, and propanol. Butanoic acid occurs naturally at<br />
concentrations of up to 600 ppb, ethanol at concentrations up to 52 ppm, and<br />
propanol at concentrations up to 54 ppm (Dragun 1988). For ethanol and<br />
propanol, the concentration levels found in the first round of sampling are<br />
more than 3 orders of magnitude below naturally occurring levels.<br />
Therefore, ethanol and propanol are not being proposed for revaluation in<br />
this phase of soil sampling. Because butanoic acid was detected at twice a<br />
natural level, it will be revaluated.<br />
APP E1-13
0%<br />
1<br />
2<br />
3<br />
4<br />
5<br />
6<br />
7<br />
8<br />
9<br />
10<br />
11<br />
12<br />
13<br />
14<br />
15<br />
16<br />
17<br />
18<br />
19<br />
20<br />
21<br />
22<br />
23<br />
24<br />
25<br />
26<br />
27<br />
28<br />
29<br />
30<br />
31<br />
32<br />
33<br />
34<br />
35<br />
36<br />
37<br />
38<br />
39<br />
910313.1346<br />
DOE/RL 88-41<br />
Revision 1<br />
Table E1-3. Selected Constituents for Analysis in<br />
2101-M Pond Soils.<br />
Constituent Criteria met<br />
Acids (nitric, hydrochloric)' 1<br />
Acetone 3<br />
Methylene chloride 3<br />
Toluene 3<br />
Butanoic acid 3<br />
Copper 2,4<br />
Barium 1,4<br />
Manganese 4<br />
Silver 3,4<br />
Strontium 2,4<br />
Zinc 2,4<br />
Calcium 2,4<br />
Chromium 4<br />
Sodium 4<br />
Nickel 4<br />
Vanadium 2,4<br />
Aluminum 2,4<br />
Potassium 4<br />
Iron 2,4<br />
Magnesium 2,4<br />
Lead 2,4<br />
Fluoride 2<br />
Ammonium 2<br />
TOC 2<br />
'Because detection of a specific acid so long after<br />
discharge is not possible, pH is used to indicate acidic<br />
conditions.<br />
TOC = total organic carbon<br />
1 = known or highly suspected discharge to pond<br />
2 - exceedance of background threshold level<br />
3 = validity of presence in samples from initial<br />
sampling effort is questionable or is present for<br />
unknown reason<br />
4 = metal (preferential sorbing in upper 2 ft<br />
suspected).<br />
APP E1-14
DOE/RL 88-41<br />
Revision 1<br />
1 4.5 APPENDIX IX SAMPLE ANALYSIS<br />
2<br />
3 In addition to the target compound analysis that will be requested for<br />
4 the 2101-M Pond soil samples, a specified portion of the 2101-M Pond soil<br />
5 samples will be tested for constituents listed in Appendix IX of 40 CFR 264.<br />
6 This will be done to corroborate the data from the initial sampling effort.<br />
7 Sample points, which will have the Appendix IX list requested, will be the<br />
8 top 6 in, of sample points G and B (Figure E1-2). In addition, the top 2 ft<br />
9 of the dry background site also will be resampled on the same sample<br />
10 interval as the pond and have the Appendix IX analysis run on these<br />
11 two samples. The dry background location can be seen in Figure B-4 and<br />
12 Appendix C-2.<br />
13<br />
14<br />
15 4.6 SAMPLING AND DATA ANALYSIS SCHEDULE<br />
16<br />
c- Figure B-22 (in Section B) establishes a sampling and data analysis<br />
18<br />
schedule for 2101-M Phase II sampling. This schedule is preliminary in<br />
°19 nature and will be dependant upon variables such as regulatory concurrence,<br />
20 analytical laboratory procurement, weather, etc.<br />
E11<br />
2<br />
°,23<br />
-24 5.0 SAMPLING QUALITY ASSURANCE AND QUALITY CONTROL<br />
25<br />
-26<br />
27 5.1 SAMPLE HANDLING<br />
Gu-28<br />
29 The handling of soil samples will follow the procedures outlined in<br />
"30 WHC-CM-7-7, EII 5.2 (WHC 1989). Included in this environmental<br />
31 investigation instruction (EII) are outlines for addressing the following<br />
-32 topics:<br />
_,3<br />
34 • Safety<br />
a35<br />
36 • Records management<br />
37<br />
38 • Training<br />
39<br />
40 • Sampling procedure.<br />
41<br />
42<br />
43 5.2 SAMPLE PACKAGING AND SHIPPING<br />
44<br />
45 Sample packaging and shipping procedures will be followed as required<br />
46 in WHC-CM-7-7 (WHC 1989).<br />
47<br />
48<br />
49 5.3 CHAIN OF CUSTODY<br />
50<br />
51 Chain of Custody will be followed as required by WHC-CM-7-7 (WHC 1989).<br />
910313.1346<br />
APP E1 -15
1<br />
2<br />
3<br />
4<br />
5<br />
6<br />
7<br />
8<br />
9<br />
10<br />
11<br />
12<br />
13<br />
14<br />
5.4 FIELD LOGBOOK<br />
DOE/RL 88-41<br />
Revision 1<br />
A field logbook will maintained as required by WHC-CM-7-7 (WHC 1989).<br />
5.5 QUALITY ASSURANCE/QUALITY CONTROL SAMPLES<br />
The following sampling quality assurance/quality control (QA/QC) steps<br />
will be used to establish sample data integrity and to identify any<br />
anomalies within the sampling activities. This is in accordance with "EPA<br />
Administered Permit Programs: The Hazardous Waste Permit Program"<br />
(EPA 1989).<br />
15 Control Frequency of occurrence<br />
_ 16 Trip blanks 1/d<br />
17 (Pond water samples only)<br />
18 Equipment blanks 1/20 samples<br />
° 19 Split/duplicate samples 1/20 samples<br />
" 20 All QA/QC samples will be handled as outlined above.<br />
^.a<br />
21<br />
22<br />
23<br />
24 6.0 DATA ANALYSIS<br />
25<br />
f 26<br />
27 Data analysis will follow the steps outlined in Section B-5c.<br />
28<br />
29<br />
30<br />
31 7.0 REFERENCES<br />
32<br />
33<br />
34 ASTM, 1990, Standard Practice for Soil Investigations and Sampling by Auger<br />
35 Borings,<br />
36<br />
37 Chamness, M. A., S. P. Luttrell, and W. J. Martin, 1990, 2101-M Pond<br />
38 Hydrogeologic Characterization Report, PNL-7468, Pacific Northwest<br />
39 Laboratory, Richland, Washington.<br />
40<br />
41 Dragun, J., 1988, The Soil Chemistry of Hazardous Materials, Hazardous<br />
42 Materials Control Research Institute, Silver Spring, Maryland,<br />
43 pp. 343-345.<br />
44<br />
45 EPA, 1989, "EPA Administered Permit Programs: The Hazardous Waste Permit<br />
46 Program", Federal Register, (Proposed Rules), Vol. 54, No. 13, p. 3227,<br />
47 Environmental Protection Agency, Washington, D.C.<br />
48<br />
910313.1346<br />
APP E1-16
DOE/RL 88-41<br />
Revision 1<br />
1 Field, J. G., J. M. Frain, M. A. Olascoaga, 1990, Engineering Study for<br />
2 Purgewater Treatment, WHC-SD-EN-ES-001, Westinghouse <strong>Hanford</strong> Company,<br />
3 p. 61.<br />
4<br />
5 Stone, W. A., J. M. Thorp, 0. P. Gifford, and D. J. Hoitink, 1983,<br />
6 Climatological Summary for the <strong>Hanford</strong> Area, PNL-4622, Pacific<br />
7 Northwest Laboratory, Richland, Washington, p. IV-2.<br />
8<br />
9 WHC, 1989, Environmental Investigations and <strong>Site</strong> Characterization Manual,<br />
10 WHC-CM-7-7, Westinghouse <strong>Hanford</strong> Company, Richland, Washington.<br />
N<br />
P1R<br />
L P^<br />
910313.1346<br />
APP E1-17
M<br />
1<br />
910313.1346<br />
DOE/RL 88-41<br />
Revision 1<br />
This page intentionally left blank.<br />
APP E1-18
c-<br />
a-<br />
DOE/RL 88-41<br />
Revision 1<br />
1 APPENDIX E-2<br />
2<br />
3 QUALITY ASSURANCE PROJECT PLAN FOR NEAR SURFACE SOIL<br />
4 SAMPLING AND SURFACE WATER SAMPLING AT<br />
5 THE 2101-M POND AND RAINWATER RUN-OFF DITCH<br />
6<br />
APP E2-i
lf7<br />
r<br />
rs<br />
DOE/RL 88-41<br />
Revision 1<br />
1 QUALITY ASSURANCE PROJECT PLAN FOR NEAR SURFACE SOIL<br />
2 SAMPLING AND SURFACE WATER SAMPLING AT<br />
3 THE 2101-M POND AND RAINWATER RUN-OFF DITCH<br />
4<br />
5<br />
6 Revision 0<br />
7<br />
8<br />
Westinghouse <strong>Hanford</strong> Company<br />
9 Environmental Engineering, Technology & Permitting Function<br />
10 Richland, Washington<br />
APP E2-ii
DOE/RL 88-41<br />
Revision 1<br />
1 CONTENTS<br />
2<br />
3 DEFINITION OF TERMS . . . . . . . . . . . . . . . . . . . . . . . E2-v<br />
4<br />
5 1.0 PROJECT DESCRIPTION . . . . . . . . . . . . . . . . . . . E2-1<br />
6 1.1 PROJECT OBJECTIVE . . . . . . . . . . . . . . . . . E2-1<br />
7 1.2 BACKGROUND INFORMATION . . . . E2-1<br />
8 1.3 QUALITY ASSURANCE PROJECT PLAN APPLICABILITY AND<br />
9 RELATIONSHIP TO THE WESTINGHOUSE HANFORD COMPANY<br />
10 QUALITY ASSURANCE PROGRAM . . . . . . . . . . . . E2-1<br />
11 1.4 SAMPLING AND TESTING ACTIVITIES . . . . . . . . . . . . E2-1<br />
12<br />
13 2.0 PROJECT ORGANIZATION AND RESPONSIBILITIES . . . . . . . . . E2-2<br />
14 2.1 PROJECT MANAGEMENT RESPONSIBILITIES . . . . . . . . . . E2-2<br />
15 2.2 ANALYTICAL LABORATORIES . . . . . . . . . . . . . . . E2-4<br />
16 2.3 OTHER SUPPORT CONTRACTORS . . . . . . . . . . . . . . . E2-4<br />
h77<br />
.._18 3.0 OBJECTIVES FOR MEASUREMENTS . . . . . . . . . . . . . . . . E2-4<br />
19<br />
X20 4.0 SAMPLING PROCEDURES E2-8<br />
21 4.1 PROCEDURE APPROVALS AND CONTROL E2-8<br />
r^a2 4.1.1 Westinghouse <strong>Hanford</strong> Procedures . . E2-8<br />
23 4.1.2 Participant Contractor/Subcontractor Procedures E2-9<br />
'24 4.2 SAMPLING AND INVESTIGATIVE PROCEDURES . . . . . . . . . 'E2-9<br />
25 4.3 PROCEDURE ADDITIONS AND CHANGES . . . . . . . . . . . . E2-9<br />
26<br />
^27 5.0 SAMPLE CUSTODY . . . . . . . . . . . . . . . . . . E2-10<br />
28<br />
2-9<br />
30<br />
6.0 CALIBRATION PROCEDURES . . . . . . . . . . . . . . . . . . . E2-10<br />
34 7.0 ANALYTICAL PROCEDURES . . . . . . . . . . . . . . . . . . . E2-11<br />
32<br />
-33 8.0 DATA REDUCTION, VALIDATION, AND REPORTING . . . . . . E2-11<br />
4 8.1 DATA REDUCTION AND DATA PACKAGE PREPARATION . . . . . . E2-11<br />
5 8.2 VALIDATION. ..................<br />
36<br />
37<br />
8.3 FINAL REVIEW AND RECORDS MANAGEMENT CONSIDERATIONS E2-13<br />
38<br />
39<br />
9.0 INTERNAL QUALITY CONTROL . . . . . . . . . . . . . . . . . E2-14<br />
40<br />
41<br />
10.0 PERFORMANCE AND SYSTEM AUDITS . . . . . . . . . . . . . . . . E2-15<br />
42<br />
43<br />
11.0 PREVENTIVE MAINTENANCE . . . . . . . . . . . . . . . . . . E2-15<br />
44<br />
45<br />
12.0 DATA ASSESSMENT PROCEDURES . . . . . . . . . . . . . . . . E2-16<br />
46<br />
47<br />
13.0 CORRECTIVE ACTION . . . . . . . . . . . . . . . . . . . . . E2-16<br />
48<br />
49<br />
14.0 QUALITY ASSURANCE REPORTS . . . . . . . . . . . . . . . . . E2-16<br />
50 15.0 REFERENCES . . . . . . . . . . . . . . . . . . . . . . E2-17<br />
APP E2-iii
DOE/RL 88-41<br />
Revision 1<br />
1 LIST OF FIGURES<br />
2<br />
3<br />
4 E2-1 Project Organization, Sampling at 2101-M Pond . . . . . . . . E2-3<br />
5<br />
6<br />
7 LIST OF TABLES<br />
8<br />
9<br />
10 E2-1 Analytes of Interest and Analytical Methods<br />
11 for2101-M Pond . . . . . . . . . . . . . . . . . . . . . . . E2-5<br />
12<br />
13 E2-2 Investigative Procedures for 2101-M Pond Water and<br />
14 Near Surface Soil Sampling . . . . . . . . . . . . . . . . . . E2-7<br />
APP E2-iv
DEFINITIONS OF TERMS<br />
DOE/RL 88-41<br />
Revision 1<br />
Accuracy. For the purposes of closure activities, accuracy may be<br />
interpreted as the measure of the bias in a system. Sampling accuracy<br />
normally is assessed through the evaluation of matrix spiked samples and<br />
reference samples.<br />
Audit. For the purposes of closure activities, audits are considered to<br />
be systematic checks to verify the quality of operation of one or more<br />
elements of the total measurement system. In this sense, audits may be of two<br />
types: (1) performance audits, in which quantitative data are independently<br />
obtained for comparison with data routinely obtained in a measurement system<br />
or, (2) system audits, involving a qualitative onsite evaluation of<br />
laboratories or other organizational elements of the measurement system for<br />
compliance.with established quality assurance program and procedure<br />
requirements. For environmental investigations at the <strong>Hanford</strong> <strong>Site</strong>,<br />
performance audit requirements are fulfilled by periodic submittal of blind<br />
samples to the primary laboratory or the analysis of split samples by an<br />
independent laboratory. System audit requirements are implemented through the<br />
use of standard surveillance procedures.<br />
Comparability. For the purposes of closure activities, comparability is<br />
an expression of the relative confidence with which one data set may be<br />
compared with another.<br />
Completeness. For the purposes of closure activities, completeness may<br />
be interpreted as a qualitative parameter expressing the percentage of<br />
measurements judged to be valid.<br />
Deviation. For the purpose of closure activities, deviation refers to a<br />
planned departure from established criteria that may be required as a result<br />
of unforeseen field situations or that may be required to correct ambiguities<br />
in procedures that may arise in practical applications.<br />
Eouipment Blanks. Equipment blanks consist of pure deionized, distilled<br />
water washed through decontaminated sampling equipment and placed in<br />
containers identical to those used for actual field samples; they are used to<br />
verify the adequacy of sampling equipment decontamination procedures, and are<br />
normally collected at the same frequency as field duplicate samples.<br />
Field Blanks. Field blanks consist of pure deionized, distilled water,<br />
transferred to a sample container at the site and preserved with the reagent<br />
specified for the analytes of interest; they are used to check for possible<br />
contamination originating with the reagent or the sampling environment, and<br />
are normally collected at the same frequency as field duplicate samples.<br />
Duplicate Sample. Field duplicate samples are samples retrieved from the<br />
same sampling location using the same equipment and sampling technique and<br />
analyzed independently. Laboratory duplicate samples are samples taken<br />
successively from the same sample bulb. Duplicate samples generally are used<br />
to verify the repeatability or reproduceability of analytical data and<br />
APP E2-v
52<br />
itz<br />
DOE/RL 88-41<br />
Revision 1<br />
1 normally are analyzed with each analytical batch or every 20 samples,<br />
2 whichever is greater.<br />
3<br />
4 Matrix Spiked Samples. Matrix spiked samples are a type of laboratory<br />
5 quality control sample; the samples are prepared by splitting a sample<br />
6 received from the field into two homogeneous aliquots (i.e., replicate<br />
7 samples), and adding a known quantity of a representative analyte of interest<br />
8 to one aliquot in order to calculate percentage of recovery.<br />
9<br />
10 Nonconformance. A nonconformance is a deficiency in characteristic,<br />
11 documentation, or procedure that renders the quality of material, equipment,<br />
12 services, or activities unacceptable or indeterminate. When the deficiency is<br />
13 of a minor nature; does not effect a permanent or significant change in<br />
14 quality if it is not corrected; can be brought into conformance with immediate<br />
15 corrective action; it shall not be categorized as a nonconformance. However,<br />
16 if the nature of the condition is such that it cannot be immediately and<br />
17 satisfactorily corrected, it shall be documented in compliance with approved<br />
18 procedures and brought to the attention of management for disposition and<br />
19 appropriate corrective action.<br />
20<br />
21 Precision. Precision is a measure of the repeatability or<br />
22 reproducibility of specific measurements under a given set of conditions.<br />
23 Specifically, it is a quantitative measure of the variability of a group of<br />
24 measurements compared to their average value. Precision normally is expressed<br />
25 in terms of standard deviation, but also may be expressed as the coefficient<br />
26 of variation (i.e., relative standard deviation) and range (i.e., maximum<br />
27 value minus minimum value). Precision is assessed by means of<br />
28 duplicate/replicate sample analysis.<br />
29<br />
30 Quality Assurance For the purposes of closure activities, Quality<br />
31 Assurance (QA) refers to the total integrated quality planning, quality<br />
32 control, quality assessment, and corrective action activities that<br />
33 collectively ensure that the data from monitoring and analysis meets all end<br />
34 user requirements and/or the intended end use of the data.<br />
35<br />
36 Ouality Assurance Project Plan. The quality assurance project plan<br />
37 (QAPP) is an orderly assembly of management policies, project objectives,<br />
38 methods, and procedures that defines how data of known quality will be<br />
39 produced for a particular project or investigation.<br />
40<br />
41 Quality Control. For the purposes of closure activities, Quality Control<br />
42 (QC) refers to the routine application of procedures and defined methods to<br />
43 the performance of sampling, measurement, and analytical processes.<br />
44<br />
45 Reference Samples. Reference samples are a type of laboratory quality<br />
46 control sample prepared from an independent, traceable standard at a<br />
47 concentration other than that used for analytical equipment calibration, but<br />
48 within the calibration range. Such reference samples are required for every<br />
49 analytical batch or every 20 samples, whichever is greater.<br />
50<br />
APP E2-vi
DOE/RL 88-41<br />
Revision 1<br />
1 Rep licate Sample. Replicate samples are two aliquots removed from the<br />
2 same sample container in the laboratory and analyzed independently.<br />
3<br />
4 Representativeness. For the purposes of closure activities,<br />
5 representativeness may be interpreted as the degree to which data accurately<br />
6 and precisely represent a characteristic of a population parameter, variations<br />
7 at a sampling point, or an environmental condition. Representativeness is a<br />
8 qualitative parameter which is most concerned with the proper design of a<br />
9 sampling program.<br />
10<br />
11 Split Sample. A split sample is produced through homogenizing a field<br />
12 sample and separating the sample material into two equal aliquots. Field<br />
13 split samples usually are routed to separate laboratories for independent<br />
14 analysis, generally for the purposes of auditing the performance of the<br />
15 primary laboratory relative to a particular sample matrix and analytical<br />
16 method (see the glossary entry for audit). In the laboratory, samples<br />
07 generally are split to create matrix spiked samples (see the glossary entry<br />
18 matrix spiked samples).<br />
'19<br />
20 Validation. For the purposes of closure activities, validation refers to<br />
` 21 a-systematic process of reviewing a body of data against a set of criteria to<br />
2 provide assurance that the data are acceptable for their intended use.<br />
23 Validation methods may include review of verification activities, editing,<br />
24 screening, cross-checking, or technical review.<br />
25<br />
-26 Verification. For the purposes of closure activities, verification<br />
27 refers to the process of determining whether procedures, processes, data, or<br />
-28 documentation conform to specified requirements. Verification activities may<br />
.?9 include inspections, audits, surveillances, or technical review.<br />
30<br />
r^<br />
APP E2-vii
:<br />
n<br />
a<br />
t3ti<br />
1<br />
DOE/RL 88-41<br />
Revision 1<br />
2<br />
3<br />
4<br />
5 This page intentionally left blank.<br />
APP E2-viii
1.1 PROJECT OBJECTIVE<br />
DOE/RL 88-41<br />
Revision 1<br />
1.0 PROJECT DESCRIPTION<br />
The primary objective of the Phase II sampling of the 2101-M Pond<br />
environment is to determine the presence (or lack thereof) of constituents in<br />
the top 2 ft of the soil column of the 2101-M Facility.<br />
1.2 BACKGROUND INFORMATION<br />
The location of 2101-M Pond and general background information are<br />
provided in the closure plan developed for the facility (see<br />
Sections A and B).<br />
1.3 QUALITY ASSURANCE PROJECT PLAN APPLICABILITY AND<br />
RELATIONSHIP TO THE WESTINGHOUSE HANFORD<br />
COMPANY QUALITY ASSURANCE PROGRAM<br />
This quality assurance project plan (QAPP) applies specifically to the<br />
field activities and laboratory analyses performed as part of sampling and<br />
testing investigations supporting the closure of the 2101-M Pond at the<br />
<strong>Hanford</strong> <strong>Site</strong>. The plan is designed to be implemented in conjunction with the<br />
specific requirements of the 2101-M Pond Closure Plan. The QAPP is prepared<br />
in compliance with the Environmental Engineering. Technology and Permitting<br />
runction uuatity Hssurance vrogram Tian (wmu-tv -U383) (wnlcn is in<br />
preparation). This plan describes the means selected to implement the overall<br />
QA program requirements defined by the Westinghouse <strong>Hanford</strong> Quality Assurance<br />
Manual (WHC 1989b), as applicable to environmental investigations, while<br />
accommodating the specific requirements for project plan format and content<br />
agreed upon in the <strong>Hanford</strong> Federal Facility Agreement and Consent Order<br />
(Ecology et al. 1989). The program plan contains a matrix of procedural<br />
resources [from WHC-CM-4-2 and from the Westinghouse <strong>Hanford</strong> Environmental<br />
investigations ana aize cnaracierization manual (wnu i y a y a)1 tnat nave Deen<br />
drawn upon to support this QAPP. This QAPP is subject to mandatory review and<br />
revision before use on subsequent phases of the investigation. Distribution<br />
and revision control of this plan will be in compliance with procedures QR<br />
6.0, "Document Control," and QI 6.1, "Quality Assurance Document Control," all<br />
from WHC-CM-4-2 (WHC 1989b). All plans and procedures referenced in the QAPP<br />
are available for regulatory review on request by the direction of the<br />
Technical Lead.<br />
1.4 SAMPLING AND TESTING ACTIVITIES<br />
Field sampling activities will include surface water sampling and near<br />
surface soil sampling. A complete description of all activities is provided<br />
in Appendix E-1 of the 2101-M Pond Closure Plan.<br />
APP E2-1
1^<br />
r^<br />
y<br />
DOE/RL 88-41<br />
Revision 1<br />
1 2.0 PROJECT ORGANIZATION AND RESPONSIBILITIES<br />
2<br />
3<br />
4 The following sections describe the organizations and their<br />
5 responsibilities in conducting investigations at 2101-M Pond.<br />
6<br />
7<br />
8 2.1 PROJECT MANAGEMENT RESPONSIBILITIES<br />
9<br />
10 The Environmental Engineering, Technology and Permitting Function of<br />
11 Westinghouse <strong>Hanford</strong> Company (Westinghouse <strong>Hanford</strong>) has primary<br />
12 responsibilities for conducting this investigation. An organizational chart<br />
13 is included as Figure E2-1. The following describe responsibilities of key<br />
14 test personnel and organizations.<br />
15<br />
16 Closure Plan Lead (Regulatory Permitting/NEPA Group)--The Closure Plan<br />
17 Lead is responsible for overall project organization and interface with<br />
18 the regulatory agencies and the DOE.<br />
19<br />
20 Technical Lead--The Technical Lead is responsible for overall direction<br />
21 of sampling and testing activities; responsibilities include the planning<br />
22 and authorization of all work and management of any subcontracted<br />
23 activities, as well as overall technical schedule and budgetary<br />
24 performance.<br />
25<br />
26 Quality Assurance Officer--The Quality Assurance Officer is responsible<br />
27 for overall direction of sampling and testing activities;<br />
28 responsibilities include the planning and authorization of all work and<br />
29 management of any subcontracted activities, as well, as overall technical<br />
30 schedule and budgetary performance.<br />
31<br />
32 Heath and Safety Officer (Environmental Division/Environmental Field<br />
33 Services)--The Health and Safety Officer is responsible for determining<br />
34 potential health and safety hazards from volatile, and/or toxic compounds<br />
35 during sample handling and sampling decontamination activities and has<br />
36 the responsibility and authority to halt field activities because of<br />
37 unacceptable health and safety concerns.<br />
38<br />
39 Field Team Leader--The field team leader is responsible for onsite<br />
40 direction of sampling technicians in compliance with the requirements of<br />
41 the closure plan, this QAPP, and implementing all Environmental<br />
42 Investigations Instructions (EIIs).<br />
43<br />
44 Office of Sample Management (OSM)--The Westinghouse <strong>Hanford</strong> OSM is<br />
45 responsible for coordinating sample shipments between the field team and<br />
46 the analytical laboratory, resolution of any chain-of-custody issues, and<br />
47 for validation of all analytical data as discussed in Section 8.0.<br />
APP E2-2
.-r<br />
e<br />
F'x<br />
1<br />
U.S. Environmental<br />
Protection Agency<br />
Project Manager<br />
U.S. Environmental<br />
Protection Agency<br />
Unit Manager<br />
Quality Assurance<br />
Officer<br />
Soil and<br />
Sediment Sampling<br />
Technicians<br />
DOE/RL 88-41<br />
Revision 1<br />
U.S. Department<br />
of Energy<br />
Project Manager<br />
--- { U.S. Department<br />
1 of Energy<br />
Unit Manager<br />
Closure Plan Lead<br />
(Westinghouse <strong>Hanford</strong><br />
Company Regulatory<br />
Permitting)<br />
LEAD AGENCY<br />
State of Washington<br />
Department of EcoloC<br />
Project Manager<br />
State of Washington<br />
--- J Department of Ecolo(<br />
Unit Manager<br />
Technical Lead----- I Industrial Safety<br />
and Fire Protection<br />
L<br />
Health and<br />
-----Safety Officer<br />
Office of Sample Analytical<br />
Management Laboratory<br />
(OSM)<br />
Figure E2-1. Project Organization, Sampling at 2101-M Pond.<br />
APP E2-3
C71<br />
+e<br />
rn<br />
DOE/RL 88-41<br />
Revision 1<br />
1 2.2 ANALYTICAL LABORATORIES<br />
2<br />
3 Samples shall be routed to an approved Westinghouse <strong>Hanford</strong>, participant<br />
4 contractor, or subcontractor laboratory, who shall be responsible for<br />
5 performing the analyses identified in this plan in compliance with work orders<br />
6 or contractual requirements and Westinghouse <strong>Hanford</strong>-approved procedures<br />
7 (Section 4.1.2). At the direction of the Technical Lead, services of<br />
8 alternate qualified laboratories may be procured for the performance of split<br />
9 sample analyses for performance audit purposes. If such an option is<br />
10 selected, the QA plan and applicable analytical procedures from the alternate<br />
11 laboratory also shall be approved by Westinghouse <strong>Hanford</strong> before their use in<br />
12 compliance with Section 4.1.2 requirements. All analytical laboratory work<br />
13 shall be subject to the surveillance controls invoked by QI 7.3, "Source<br />
14 Surveillance and Inspection" (WHC 1989b).<br />
15<br />
16<br />
17 2.3 OTHER SUPPORT CONTRACTORS<br />
18<br />
19 Support contractors may be assigned project responsibilities at the<br />
20 direction of the Technical Lead. Such services shall be in compliance with<br />
21 standard Westinghouse <strong>Hanford</strong> procurement procedure requirements as discussed<br />
22 in Section 4.1.2. All work shall be performed in compliance with Westinghouse<br />
23 <strong>Hanford</strong> approved QA plans and/or procedures, subject to controls of QI 7.3,<br />
24 "Source Surveillance and Inspection" (WHC 1989b).<br />
25<br />
26<br />
27<br />
28 3.0 OBJECTIVES FOR MEASUREMENTS<br />
29<br />
30<br />
31 The purpose of this investigation is to assess the existence, nature, and<br />
32 extent of any contamination in the near surface soils of the 2101-M Pond and<br />
33 rainwater run-off ditch, and the chemical composition of the pond water as it<br />
34 relates to the surrounding environment. As noted in Section 4.6 of Data<br />
35 Quality Objectives for Remedial Response Activities: Volume I Development<br />
36 Process (EPA 1987), universal goals for precision, accuracy,<br />
37 representativeness, completeness, and comparability cannot be practically<br />
38 established at the outset of an investigation. However, data is available<br />
39 from previously negotiated analytical contracts for <strong>Hanford</strong> <strong>Site</strong><br />
40 investigations, the data quality objectives guidance document cited previously<br />
41 (EPA 1987), and from typical capabilities currently expected for laboratories<br />
42 involved in environmental analyses that may be used as minimum guidelines for<br />
43 the selection of analytical methods appropriate for this investigation.<br />
44 Table E2-1 provides preliminary target values for detection limits, precision,<br />
45 and accuracy that are intended for use in initial procurement negotiations<br />
46 with the analytical laboratory. After individual laboratory statements of<br />
47 work are negotiated, and procedures are developed and approved as noted in<br />
48 Section 4.1 and Table E2-2, this section will be revised to reference approved<br />
49 detection limit, precision, and accuracy criteria as project requirements.<br />
50<br />
APP E2-4
19 1 1 1 I : 3<br />
T 1<br />
I Table E2-1. Analytes of Interest and Analytical Methods for 2101-M Pond. ( sheet 1 of 2)<br />
3<br />
4<br />
5<br />
6<br />
7<br />
8 9<br />
10<br />
112<br />
14 n<br />
-o<br />
15 m<br />
N<br />
16<br />
17<br />
18<br />
Analytical<br />
category<br />
Volatile<br />
organics<br />
Analyte of interest<br />
Standard<br />
referen<br />
method<br />
p<br />
MethySene chloride 8240<br />
(Dtc loromethane)<br />
MinimumsMinimum<br />
detecti n<br />
limit`<br />
pp qq<br />
25mmg^Rg<br />
Precision` Accuracy` Comments<br />
p<br />
f 25%<br />
R p<br />
RPD ±25%<br />
Purgeable Toluene 8020 25 mg/Kg ±25% RPD ±25% d<br />
Aromatics<br />
Semi-volatile Butanoic acid 8270 e e e d<br />
organics<br />
Total organic 9060 1.0 mg/Kg ±25% RPD ±25% d<br />
carbon (TOC)<br />
Total organic 9030 , h ±25% RPD ±25% d<br />
(Gdos<br />
Inorganics Aluminium<br />
Cg<br />
Chromium<br />
Calcium<br />
ynese<br />
ckel<br />
tassium<br />
1ver<br />
dium<br />
ro tium<br />
naeium<br />
nr<br />
45.0 m Kg<br />
2.0 mg. g<br />
7.0 mg/K//^<br />
1 0. 0 mIg<br />
7 .0 mg/ Kg<br />
30.0 mg Kg<br />
1.0 mg/Kg<br />
/Rg<br />
15.0 mg<br />
7.0 mg/K^<br />
29.0 m g<br />
2.0 mg^ g<br />
8.0 mg Kg<br />
2.0 mg Kg<br />
mg Kg<br />
250<br />
0.04 m Xg<br />
1.0 mg^ g<br />
2.0 mg/Kg<br />
d<br />
d<br />
0<br />
0<br />
zo<br />
CD m<br />
r<br />
° CO<br />
o oo<br />
s+ 4c
3<br />
5<br />
30<br />
1 Table E2-1. Analytes of Interest and Analytical Methods for 2101-M Pond. (sheet 2 of 2)<br />
nv<br />
m<br />
N 0)<br />
Analytical<br />
category<br />
Analyte of interest<br />
Standard<br />
refelege<br />
method<br />
Minimum<br />
detectipn<br />
limit<br />
Precision ` Accuracy`Comments<br />
Inoranics SulfideP 90300 50 mg/Kg ±25% RPD t25% d<br />
(con ?.)<br />
Fluoride 300 1.0 mg/gg ±25% RPp t25%<br />
Ammonium Am g 45D1426 0.5 mg/Rg #25% RPD t25%<br />
d<br />
8Unless otherwise specified, methods are from Test Methods for Evaluating Solid Waste ( SW-846)<br />
(EPA 1986).<br />
bAnalytical methods shall be in compliana with approved Westingho qga <strong>Hanford</strong> or We inghouse<br />
<strong>Hanford</strong> -approved participant contractor or subcontractor procedures. All procedures shall be reviewed<br />
a u a proved in roip ) lance with requirements specified to the Westinghouse <strong>Hanford</strong> QA program for<br />
CPRCL^1 RI/FS activi^ies.<br />
`Mimimum requirements for method detection levels precision, and accuracy will 4e method-<br />
pTcific, and sha 1 be negotiated 4nd established in the procedure review and a prova s process. Target<br />
va ues are indicated where appropriate; precision is expressed in terms of rela^ive percent different<br />
(RPD) and accuracy as percentage recovery.<br />
dAnalyses shall be performed by an approved participant contractor or subcontractor laboratory.<br />
eHot a normally analyzed for constituent, therefore there are no established values.<br />
(Highly dependant on operating conditions and plasma position.<br />
gFrom Methods for Chemical Analysis of Water and Waste, EPA 600 /4-79-020 (EPA 1983x).<br />
h Species dependant.<br />
PPond water target analyte only.<br />
0<br />
m°m<br />
c^<br />
V1 1-<br />
0 CO<br />
7 00<br />
H I
M<br />
N<br />
I Table E2-2. Investigative Procedures for 2101-M Pond Water and Near Surface Soil<br />
2 Sampling.<br />
Task 1: Task 2:<br />
3 Procedure Titles Surface water Soil<br />
sampling sampling<br />
4 EII 1.2 Preparation and revision of environmental X X<br />
investigation instructions<br />
5 EII 1.4 Deviation from environmental investigation X X<br />
instruction<br />
6 EII 1.5 Field logbooks X X<br />
7 EII 1.6 Records management X X<br />
8 EII 1.7 Indoctrination, training and qualification X X<br />
9 EII 2.1 Preparation of health and safety plans X X y<br />
10 EII 3.1 User calibration of health and safety<br />
measuring and test equipment ( M&TE)<br />
X X<br />
11 EII 5.0 Sample identification and entry into the X X<br />
(HEIS) database<br />
12 EII 5.1 Chain of custody X X<br />
13 EII 5.2 Soil and sediment sampling X<br />
14 EII 5.5 Decontamination of equipment for X X<br />
RCRA/CERCLA sampling<br />
15 EII 5.11 Sample packaging and shipping X X<br />
16 'Procedures are EIIs selected from the latest approved version of WHC-CM-7-7<br />
17 (WHC 1989a).<br />
18<br />
o<br />
m m<br />
ON<br />
= CO<br />
4.
l•<br />
DOE/RL 88-41<br />
Revision 1<br />
1 Goals for data representativeness are addressed qualitatively by the<br />
2 specification of sampling locations and intervals within Appendix E-1 of the<br />
3 closure plan. Objectives for completeness for this investigation shall<br />
4 require that contractually or procedurally established requirements for<br />
5 precision and accuracy be met for at least 90% of the total number of<br />
6 requested determinations. Failure to meet this criterion shall be documented<br />
7 in data summary reports as described in Section 8.1, and shall be considered<br />
8 in the validation process discussed in Section 8.2. Corrective action<br />
9 measures shall be initiated by the Technical Lead as appropriate, as noted in<br />
10 Section 13.0. Approved analytical procedures shall require the use of the<br />
11 reporting techniques and units consistent with the Environmental Protection<br />
12 Agency (EPA) reference methods listed in Table E2-1 to facilitate the<br />
13 comparability of data sets in terms of precision and accuracy.<br />
14<br />
15<br />
16<br />
17 4.0 SAMPLING PROCEDURES<br />
18<br />
19<br />
20 The following sections provide information on procedure approvals and<br />
21 controls, investigative procedures, and additions and changes to procedures.<br />
22<br />
23<br />
24 4.1 PROCEDURE APPROVALS AND CONTROL<br />
25<br />
26 Procedure approvals and controls are discussed in the following sections.<br />
27<br />
28<br />
29 4.1.1 Westinghouse <strong>Hanford</strong> Procedures<br />
30<br />
31 The Westinghouse <strong>Hanford</strong> procedures that will be used to support the<br />
32 closure plan have been selected from the quality assurance program index<br />
33 (QAPI) included in the Westinghouse <strong>Hanford</strong>, Environmental Engineering.<br />
34 Technology and Permitting Function Quality Assurance Program Plan<br />
35 (WHC-EP-0330). Selected procedures include Environmental investigation and<br />
36 instructions (EIIs) from the Environmental Investigations and <strong>Site</strong><br />
37 Characterization Manual (WHC 1989a), and quality requirements (QR) and quality<br />
38 instructions (QI) from the Westinghouse <strong>Hanford</strong> Quality Assurance Manual (WHC<br />
39 1989b). Procedure approval, revision, and distribution control requirements<br />
40 applicable to EIIs are addressed in EII 1.2, "Preparation and Revision of<br />
41 Environmental Investigation Instructions" (WHC 1989a); requirements applicable<br />
42 to QIs and QRs are addressed in QR 5.0, "Instructions, Procedures, and<br />
43 Drawings"; QI 5.1, "Preparation of Quality Assurance Documents"; QR 6.0,<br />
44 "Document Control"; and QI 6.1, "Quality Assurance Document Control" (WHC<br />
45 1989b). Other procedures applicable to the preparation, review, and revision<br />
46 of OSM and other <strong>Hanford</strong> analytical laboratory procedures shall be defined in<br />
47 the various procedures and manuals identified in the Environmental<br />
48 Engineering. Technology and Permitting Function Quality Assurance Program Plan<br />
49 (WHC-EP-0383) under criteria 5.00 and 6.00. All procedures are available for<br />
50 regulatory review on request at the direction of the Technical Lead.<br />
51<br />
APP E2-8
DOE/RL 88-41<br />
Revision 1<br />
4.1.2 Participant Contractor/Subcontractor Procedures<br />
As noted in Section 2.1, participant contractor and/or subcontractor<br />
services may be procured at the direction of the Technical Lead. All such<br />
procurements shall be subject to the applicable requirements of<br />
QR 4.0, "Procurement Document Control"; QI 4.1, "Procurement Document<br />
Control"; QI 4.2, "External Services Control"; QR 7.0, "Control of Purchased<br />
Items and Services"; QI 7.1, "Procurement Planning and Control"; and/or<br />
QI 7.2, "Supplier Evaluation" (WHC 1989b). Whenever such services require<br />
procedural controls, requirements for use of Westinghouse <strong>Hanford</strong> procedures<br />
or for submittal of contractor procedures for Westinghouse <strong>Hanford</strong> review and<br />
approval before use, shall be included in the procurement document or work<br />
order, as applicable. In addition to the submittal of analytical procedures,<br />
analytical laboratories shall be required to submit the current version of<br />
their internal QA program plans. Before use, all analytical laboratory plans<br />
and procedures shall be reviewed and approved by qualified personnel from the<br />
OSM, Westinghouse <strong>Hanford</strong> analytical laboratories organizations, or other<br />
qualified personnel, as directed by the Technical Lead. All reviewers shall<br />
be qualified under the requirements of EII 1.7, "Indoctrination, Training, and<br />
Qualification" (WHC 1989a). All participant contractor or subcontractor<br />
procedures, plans, and/or manuals shall be retained as project quality records<br />
in compliance with EII 1.6, "Records Management" (WHC 1989a); QR 17.0,<br />
"Quality Assurance Records"; and QI 17.1, "Quality Assurance Records Control"<br />
(WHC 1989b). All such documents shall be available for regulatory review on<br />
request, at the direction of the Technical Lead.<br />
4.2 SAMPLING AND INVESTIGATIVE PROCEDURES<br />
All soil sampling activities shall be performed in compliance with<br />
EII 5.2, "Soil and Sediment Sampling" (WHC 1989a). Additional EIIs that have<br />
been selected to support this activity are identified in Table E2-2. Sample<br />
identification requirements and containertype, preparation, and preservation<br />
requirements shall be as specified in EII 5.11. Procedures to support data<br />
interpretation shall be developed as modifications to EII 11.2, as contractor<br />
procedures, or may be incorporated as addenda to this QAPP as necessary to<br />
support the detailed requirements of the 2101-M Pond Closure Plan.<br />
4.3 PROCEDURE ADDITIONS AND CHANGES<br />
Additional EIIs or EII updates that may be required as a consequence<br />
of closure plan requirements shall be developed in compliance with<br />
EII 1.2, "Preparation and Revision of Environmental Investigations<br />
Instructions" (WHC 1989x). Should deviations from established EIIs be<br />
required to accommodate unforseen field situations, the field team leader can<br />
authorize any such deviation in accordance with the requirements of<br />
EII 1.4, "Deviation from Environmental Investigations Instructions"<br />
(WHC 1989a). Documentation, review, and disposition of instruction change<br />
authorization forms are defined within EII 1.4. Other types of document<br />
APP E2-9
DOE/RL 88-41<br />
Revision 1<br />
1 change requests shall be completed as required by the Westinghouse <strong>Hanford</strong><br />
2 procedures governing their preparation and revision.<br />
3<br />
4<br />
5<br />
6 5.0 SAMPLE CUSTODY<br />
7<br />
8<br />
9 All samples obtained during the course of this investigation shall be<br />
10 controlled as required by EII 5.1, "Chain of Custody" (WHC 1989) from the<br />
11 point of origin to the analytical laboratory. Laboratory chain-of-custody<br />
12 procedures shall be reviewed and approved as required by Westinghouse <strong>Hanford</strong><br />
13 procurement control procedures as noted in Section 4.1, and shall ensure the<br />
14 maintenance of sample integrity and identification throughout the analytical<br />
15 process. At the direction of the Technical Lead, requirements for return of<br />
16 residual sample materials after completion of analysis shall be defined in<br />
17 accordance with those procedures defined in the procurement documentation to<br />
18 subcontractor or participant contractor laboratories. Chain-of-custody forms<br />
19 shall be initiated for returned residual samples as required by the approved<br />
20 procedures applicable within the participating laboratory. Results of<br />
21 analyses shall be traceable to original samples through the unique code or<br />
22 identifier specified in Section 4.0. All results of analyses shall be<br />
23 controlled as permanent project quality records as required by QR 17.0,<br />
24 "Quality Assurance Records" (WHC 1989b) and EII 1.6, "Records Management"<br />
25 (WHC 1989a).<br />
26<br />
27<br />
28<br />
29 6.0 CALIBRATION PROCEDURES<br />
30<br />
31<br />
32 Calibration of all Westinghouse <strong>Hanford</strong> measuring and test equipment,<br />
33 whether in existing inventory or purchased for this investigation, shall be<br />
34 controlled as required by QR 12.0, "Control of Measuring and Test Equipment";<br />
35 QI 12.1, "Acquisition and Calibration of Portable Measuring and Test<br />
36 Equipment"; QI 12.2, "Measuring and Test Equipment Calibration by User"<br />
37 (WHC 1989b); and/or EII 3.1, "User Calibration of Health and Safety Measuring<br />
38 and Test Equipment" (WHC 1989a). Routine operational checks for Westinghouse<br />
39 <strong>Hanford</strong> field equipment shall be as defined within applicable EIIs or<br />
40 procedures; similar information shall be provided in Westinghouse <strong>Hanford</strong>-<br />
41 approved participant contractor or subcontractor procedures.<br />
42<br />
43 Calibration of Westinghouse <strong>Hanford</strong>, participant contractor, or<br />
44 subcontractor laboratory analytical equipment shall be as defined by<br />
45 applicable standard analytical methods, subject to Westinghouse <strong>Hanford</strong> review<br />
46 and approval.-<br />
47<br />
APP E2-10
DOE/RL 88-41<br />
Revision 1<br />
7.0 ANALYTICAL PROCEDURES<br />
Analytical methods or procedures based on the reference methods<br />
identified in Table E2-1 and Section 3.0 shall be selected or developed and<br />
approved before use in compliance with appropriate Westinghouse <strong>Hanford</strong><br />
procedure and/or procurement control requirements as noted in Section 4.1.<br />
8.0 DATA REDUCTION, VALIDATION, AND REPORTING<br />
The following sections contain information concerning data reporting,<br />
data validation, and data review and management.<br />
8.1 DATA REDUCTION AND DATA PACKAGE PREPARATION<br />
All analytical laboratories shall be responsible for preparing a report<br />
summarizing the results of analysis and for preparing a detailed data package<br />
that includes all information necessary to perform data validation to the<br />
extent indicated by the minimum requirements of Section 8.2. Data summary<br />
report format and data package content shall be defined in procurement<br />
documentation subject to Westinghouse <strong>Hanford</strong> review and approval as noted in<br />
Section 4.1. At a minimum, laboratory data packages shall include the<br />
following:<br />
• Sample receipt and tracking documentation (including identification<br />
of the organization and individuals performing the analysis, the<br />
names and signatures of the responsible analysts, sample holding<br />
time requirements, references to applicable chain-of-custody<br />
procedures, and the dates of sample receipt, extraction, and<br />
analysis)<br />
• Instrument calibration documentation, including equipment type and<br />
model, with continuing calibration data for the time period in which<br />
the analysis was performed<br />
• Quality control data, as appropriate for the methods used, including<br />
matrix spike/matrix spike duplicate data, recovery percentages,<br />
precision data, laboratory blank data, and identification of any<br />
nonconformances that may have affected the laboratory's measurement<br />
system during the time period in which the analysis was performed<br />
• The analytical results or data deliverables, including reduced data,<br />
reduction formulas or algorithms, and identification of data<br />
outliers or deficiencies.<br />
APP E2-11
M<br />
DOE/RL 88-41<br />
Revision 1<br />
1 Other supporting information, such as initial calibration data,<br />
2 reconstructed ion chromatographs, spectrograms, traffic reports, and raw data,<br />
3 need not be included in the submittal of individual data packages unless<br />
4 specifically requested by the Technical Lead or the OSM. However, all sample<br />
5 data shall be retained by the analytical laboratory and made available for<br />
6 systems or program audit purposes upon request by Westinghouse <strong>Hanford</strong>,<br />
7 U.S. Department of Energy-Richland Operations Office (DOE-RL), or regulatory<br />
8 agency representatives (Section 10.0). Such data shall be retained by the<br />
9 analytical laboratory through the duration of contractual statement of work,<br />
10 at which point the data shall be turned over to Westinghouse <strong>Hanford</strong> for<br />
11 archiving.<br />
12<br />
13 The completed data package shall be reviewed and approved by the<br />
14 analytical laboratory's QA Manager before submittal to the OSM for validation<br />
15 as discussed in Section 8.2. The requirements of this section shall be<br />
16 included in procurement documentation or work orders, as appropriate, in<br />
17 compliance with the standard Westinghouse <strong>Hanford</strong> procurement control<br />
18 procedures referenced in Section 4.1.<br />
19<br />
20<br />
21 8.2 VALIDATION<br />
22<br />
23 Validation of the completed data package shall be performed by<br />
24 Westinghouse <strong>Hanford</strong> OSM personnel. Validation requirements shall be defined<br />
25 within approved OSM data validation procedures, but at a minimum shall require<br />
26 the following:<br />
27<br />
28 For organic analyses, validation reports shall be prepared documenting<br />
29 validation of the following areas as recommended in Laboratory Data Validation<br />
30 Functional Guidelines for Evaluating Organics Analyses (EPA 1988b):<br />
31<br />
32 • Data summary narrative<br />
33<br />
34 . Sample holding times<br />
35<br />
36 . Gas chromatograph/mass spectrometer tuning and mass calibration<br />
37 requirements<br />
38<br />
39 . Continuing calibration requirements<br />
40<br />
41 . Method blank sample requirements<br />
42<br />
43 . Surrogate recovery requirements<br />
44<br />
45 . Matrix spike/matrix spike duplicate requirements<br />
46<br />
47 . Internal standards performance requirements<br />
48<br />
49 . Target compound identification requirements<br />
50<br />
APP E2-12
DOE/RL 88-41<br />
Revision 1<br />
• Target compound quantitation requirements and reported detection<br />
limits<br />
• Any tentatively identified compounds, library search, assessment,<br />
and quantitation requirements<br />
• Overall data assessment requirements.<br />
For inorganic analyses, validation reports shall be prepared documenting<br />
validation of the following areas, as recommended in Laboratory Data<br />
Validation Functional Guidelines for Evaluatin4 Inor q anics Analyses<br />
(EPA 1988a):<br />
• Data summary narrative<br />
• Sample holding times<br />
• Continuing calibration requirements<br />
• Method blank sample requirements<br />
• Interference check sample requirements<br />
• Laboratory control sample requirements<br />
• Duplicate sample analysis<br />
• Matrix spike sample requirements<br />
• Atomic absorption quality control requirements<br />
• Inductively coupled plasma serial dilution requirements<br />
• Overall data assessment requirements.<br />
8.3 FINAL REVIEW AND RECORDS MANAGEMENT CONSIDERATIONS<br />
All validation reports and supporting analytical data packages shall be<br />
subjected to a final technical review by a qualified reviewer at the direction<br />
of the Technical Lead before submittal to regulatory agencies or inclusion in<br />
reports or technical memoranda. All validation reports, data packages, and<br />
review comments shall be retained as permanent project quality records in<br />
compliance with EII 1.6, "Records Management" (WHC 1989a) and QA 17.0,<br />
"Quality Assurance Records" (WHC 1989b).<br />
APP E2-13
fdT<br />
e_<br />
tS^<br />
DOE/RL 88-41<br />
Revision 1<br />
1 9.0 INTERNAL QUALITY CONTROL<br />
2<br />
3<br />
4 All analytical samples shall be subject to in-process quality control<br />
5 measures in both the field and laboratory. Unless superseded by specific<br />
6 directions provided in Appendix J of the closure plan, the following minimum<br />
7 field quality control requirements apply. These requirements are adapted from<br />
8 Test Methods for Evaluating Solid Waste (SW-846) (EPA 1986), as modified by<br />
9 the proposed rule changes included in the Federal Register, Volume 54, No. 13<br />
10 (EPA 1989).<br />
11<br />
12 Duplicate samples--For each shift of sampling activity under an<br />
13 individual sampling subtask, a minimum of 5% of the total collected<br />
14 samples shall be duplicated. Field duplicate samples are samples<br />
15 retrieved from the same sampling location using the same equipment<br />
16 and sampling technique, but analyzed_ independently. Laboratory<br />
17 duplicate samples are samples taken successively from the same bulb.<br />
18 Duplicate samples are generally used to verify the repeatability or<br />
19 reproducibility of the analytical data.<br />
20<br />
21 Split samples--At the Technical Lead's direction, field or field<br />
22 duplicate samples may be split in the field and sent to an<br />
23 alternative laboratory . as a performance audit of the primary<br />
24 laboratory. Frequency shall meet the minimum schedule requirements<br />
25 of Section 10.0.<br />
26<br />
27 Field/Equipment Blanks--A water blank consists of pure deionized,<br />
28 distilled water whose chemical composition is known, drawn through<br />
29 decontaminated sampling equipment and taken as a sample. Blanks are<br />
30 used to verify the adequacy of sampling equipment decontamination<br />
31 procedures and are used to check for possible contamination<br />
32 originating with the sampling environment. Blanks will be run<br />
33 before the initiation of sampling each day or if blank contamination<br />
34 is suspected or detected.<br />
35<br />
36 The internal quality control checks performed by analytical laboratories'<br />
37 laboratory analyses shall meet the following minimum requirements.<br />
38<br />
39 Matrix spiked and matrix spiked duplicate samples--Matrix spiked and<br />
40 matrix spiked duplicate samples require the addition of a known<br />
41 quantity of a representative analyte of interest to the sample as a<br />
42 measure of recovery percentage. The spike shall be made in a<br />
43 replicate of a field sample. Spike compound selection, quantities,<br />
44 and concentrations shall be described in the laboratories analytical<br />
45 procedures. One sample shall be spiked for each analytical batch,<br />
46 or once every 20 samples, whichever is greater.<br />
47<br />
48 Quality control reference samples--A quality control reference<br />
49 sample shall be prepared from an independent standard at a<br />
50 concentration other than that used for calibration, but within the<br />
51 calibration range. Reference samples are required as an independent<br />
APP E2-14
DOE/RL 88-41<br />
Revision 1<br />
check on analytical technique and methodology, and shall be run with<br />
every analytical batch, or every 20 samples, whichever is greater.<br />
Other requirements specific to laboratory analytical equipment<br />
calibration are included in Section 6.0. The minimum requirements of this<br />
section shall be invoked in procurement documents or work orders in compliance<br />
with standard Westinghouse <strong>Hanford</strong> procedures as noted in Section 4.1.<br />
10.0 PERFORMANCE AND SYSTEM AUDITS<br />
Performance, system, and program audits are scheduled to begin early in<br />
the execution of this closure plan and to continue through to completion.<br />
Collectively, the audits address quality affecting activities that include,<br />
but are not limited to measurement accuracy, intramural and extramural<br />
analytical laboratory services, field activities, and data collection,<br />
processing, validation, and management.<br />
Performance audits of the accuracy of laboratory analyses are implemented<br />
in accordance with Standard Operating Procedure EII 1.12 "Laboratory Analysis<br />
Performance Audits." System audit requirements are implemented in accordance<br />
with Standard Operating Procedure QI 10.4, "Surveillance" (WHC 1989b).<br />
Surveillances will be performed regularly throughout the course of the closure<br />
plan activities. Additional performance and system "surveillances" may be<br />
scheduled as a consequence of corrective action requirements, or may be<br />
performed upon request. All quality affecting activities are subject to<br />
surveillance.<br />
All aspects of closu<br />
environmental restoration<br />
requirements of WHC-CM-4accordance<br />
with QR 18.0.<br />
Scheduling"; and QI 18. -<br />
Quality Audits" by audi,.<br />
"Qualification of Quali-<br />
re plan activities will also be evaluated as part of<br />
program wide QA audits under the procedural<br />
(WHC 1989b). Program audits shall be conducted in<br />
Bits"; QI 18.1, "Audit Programming and<br />
anning, Performing, Reporting, and Follow-up of<br />
, alified in compliance with QI 2.5,<br />
rance Program Audit Personnel" (WHC 1989b).<br />
i PREVENTIVE MAINTENANCE<br />
All measurement and testing equipment used in the field and laboratory<br />
that directly affects the quality of the analytical data shall be subject to<br />
preventive maintenance measures that ensure minimization of measurement system<br />
downtime. Field equipment maintenance instructions shall be as defined by the<br />
approved procedures governing their use. Laboratories shall be responsible<br />
for performing or managing the maintenance of their analytical equipment;<br />
maintenance requirements, spare parts lists, and instructions shall be<br />
included in individual methods or in laboratory QA plans, subject to<br />
APP E2-15
h<br />
G.<br />
1^ 4<br />
N<br />
DOE/RL 88-41<br />
Revision 1<br />
1 Westinghouse <strong>Hanford</strong> review and approval. When samples are analyzed using EPA<br />
2 reference methods, the requirements for preventive maintenance of laboratory<br />
3 analytical equipment as defined by the reference method shall apply.<br />
4<br />
5<br />
6<br />
7 12.0 DATA ASSESSMENT PROCEDURES<br />
8<br />
9<br />
10 Test data from this investigation will be assessed as required by<br />
11 Appendix E-1, of this closure plan. Analytical data shall first be compiled<br />
12 and summarized by the laboratory and validated in compliance with approved OSM<br />
13 procedures meeting all minimum requirements of Section 8.0.<br />
14<br />
15<br />
16<br />
17 13.0 CORRECTIVE ACTION<br />
18<br />
19<br />
20 Corrective action requests required as a result of surveillance reports,<br />
21 nonconformance reports, or audit activity shall be documented and<br />
22 dispositioned as required by QR 16.0, "Corrective Action"; QI 16.1,<br />
23 "Trending/Trend Analysis"; and QI 16.2, Corrective Action Reporting,"<br />
24 (WHC 1989b). Primary responsibilities for corrective action resolution are<br />
25 assigned to the Technical Lead and the QA Coordinator. Other measurement<br />
26 systems, procedures, or plan corrections that may be required as a result of<br />
27 routine review processes shall be resolved as required-by governing procedures<br />
28 or shall be referred to the Technical Lead for resolution. Copies of all<br />
29 surveillance, nonconformance, audit, and corrective action documentation shall<br />
30 be routed to the project QA records upon completion or closure.<br />
31<br />
32<br />
33<br />
34 14.0 QUALITY ASSURANCE REPORTS<br />
35<br />
36<br />
37 As previously stated in Sections 10.0 and 13.0, project activities shall<br />
38 be assessed regularly by auditing and surveillance processes. Surveillance,<br />
39 nonconformance, audit, and corrective action documentation shall be routed to<br />
40 the project quality records upon completion or closure of the activity.<br />
41 A report summarizing all audit, surveillance, and instruction change<br />
42 authorization activity (see Section 4.4), as well as any associated corrective<br />
43 actions, shall be prepared by the QA Coordinator at the completion of the<br />
44 activity or annually beginning one year after approval of the closure plan,<br />
45 whichever is sooner. The report(s) shall be submitted to the Technical Lead<br />
46 for incorporation into the final report prepared at the end of the<br />
47 investigation. The final report shall include an assessment of the overall<br />
48 adequacy of the total measurement system with regard to the data quality<br />
49 objectives of the investigation.<br />
50<br />
51<br />
APP E2-16
DOE/RL 88-41<br />
Revision 1<br />
1 15.0 REFERENCES<br />
2<br />
3<br />
4 Ecology, EPA and DOE, 1989, <strong>Hanford</strong> Federal Facility Agreement and Consent<br />
5 Order, Washington State Department of Ecology, U.S. Environmental<br />
6 Protection Agency, and U.S. Department of Energy, Olympia, Washington.<br />
7<br />
8 EPA, 1986, Test Methods for Evaluating Solid Wastes, SW-846, Third edition<br />
9 U.S. Environmental Protection Agency/Office of Solid Waste and Emergency<br />
10 Response, Washington, D.C.<br />
11<br />
12 EPA, 1987, Data 0uality Objectives for Remedial Response Activities:<br />
13 Volume I. Development Process, EPA/540/6-87/003, Office of Emergency and<br />
14 Remedial Response and Office of Waste Programs Enforcement,<br />
15 U.S. Environmental Protection Agency, Washington, D.C.<br />
16<br />
c11 EPA, 1988a, Laboratory Data Validation Functional Guidelines for Evaluating<br />
18 Inorganics Analyses Hazardous <strong>Site</strong> Evaluation Division,<br />
19 U.S. Environmental Protection Agency, Washington, D.C.<br />
20<br />
` 21 EPA, 1988b, Laboratory Data Validation Functional Guidelines for Evaluating<br />
C 24 Organics Analyses, Hazardous <strong>Site</strong> Evaluation Division, U.S. Environmental<br />
23 Protection Agency, Washington, D.C.<br />
°24<br />
25 EPA, 1989, "Hazardous Waste Management System; Testing and Monitoring<br />
26 Activities" (Proposed Rule), Federal Register, Vol. 54, No. 13,<br />
27 pp. 3212-3228.<br />
-28<br />
.29 WHC, 1989a, Environmental Investigations and <strong>Site</strong> Characterization Manual,<br />
30 WHC-CM-7-7, Westinghouse <strong>Hanford</strong> Company, Richland, Washington.<br />
.11<br />
32 WHC, 1989b, Westinghouse <strong>Hanford</strong> Company Ouality Assurance Manual, WHC-CM-4-2,<br />
33 Westinghouse <strong>Hanford</strong> Company, Richland, Washington.<br />
34<br />
q 5 WHC, 1990, Environmental Engineering. Technology and Permitting Function<br />
36 Ouality Assurance Program Plan, WHC-EP-0383, Westinghouse <strong>Hanford</strong><br />
37 Company, Richland, Washington.<br />
APP E2-17
ON<br />
rn<br />
DOE/RL 88-41<br />
Revision 1<br />
1<br />
2<br />
3<br />
4<br />
5 This page intentionally left blank.<br />
APP E2-18
n<br />
DOE/RL 88-41<br />
Revision 1<br />
1 APPENDIX F<br />
2<br />
3<br />
4 EVALUATION OF COVER DESIGN<br />
910313.1137<br />
APP F—i
p..<br />
910313.1137<br />
DOE/RL 88-41<br />
Revision 1<br />
This page intentionally left blank.<br />
APP f-ii
DOE/RL 88-41<br />
Revision 1<br />
1 CONTENTS<br />
2<br />
3<br />
4 1.0 INTRODUCTION . . . . . . . . . . . . . . . . . . . . . . . . . . . F-1<br />
5<br />
6 2.0 SURFACE WATER EROSION . . . . . . . . . . . . . . . . . . . . . . F-1<br />
7<br />
8 3.0 WIND EROSION EVALUATION . . . . . . . . . . . . . . . . . . . . . F-7<br />
9<br />
10 4:0 HYDROLOGIC EVALUATION OF LANDFILL PERFORMANCE . . . . . . . . . . F-15<br />
11<br />
12 5.0 COVER MATERIAL VOLUME ESTIMATES . . . . . . . . . . . . . . . . . F-32<br />
13<br />
14 6.0 REFERENCES . . . . . . . . . . . . . . . . . . . . . . . . . . . . F-32<br />
15<br />
16<br />
17<br />
18 LIST OF FIGURES<br />
19<br />
20<br />
21 F-1 Average Annual Values of Rainfall-Erosivity Factor R . . . . . . . F-3<br />
22<br />
s°s 23 F-2 Nomograph for Determining Soil-Erodibility Factor K for<br />
24 U.S. Mainland . . . . . . . . . . . . . . . . . . . . . . . . . . F-4<br />
25<br />
26 F-3 Soil Ridge Roughness Factor K From Actual Soil<br />
27 Ridge Roughness . . . . . . . . . . . . . . . . . . . . . . . . . F-11<br />
28<br />
29 F-4 Annual Wind Erosion Climatic 'C' Factor Map . . . . . . . . . . . F-12<br />
30<br />
31<br />
32<br />
33 LIST OF TABLES<br />
—' 34<br />
35<br />
36 F-1 Values of the Factor LS for Specific Combinations of<br />
37 Slope Length and Steepness . . . . . . . . . . . . . . . . . . . . F-5<br />
38<br />
39 F-2 Average Return Period and Existing Record for Various<br />
40 Precipitation Amounts and Intensity During Specified<br />
41 Time Periods at the <strong>Hanford</strong> <strong>Site</strong> . . . . . . . . . . . . . . . . . F-6<br />
42<br />
43 F-3 Soil Erodibility Index (I) . . . . . . . . . . . . . . . . . . . . F-9<br />
44<br />
45 F-4 Knoll Erodibility I Correction Factor . . . . . . . . . . . . . . F-10<br />
46<br />
47 F-5 Guide for Converting Range Vegetation to Equivalent<br />
48 Quantity of Flat Small Grain Residue . . . . . . . . . . . . . . . F-13<br />
49<br />
50 F-6 Cover Material Volume/Area Estimates . . . . . . . . . . . . . . . F-32<br />
910313.1445<br />
APP F-iii
910313.1218<br />
DOE/RL 88-41<br />
Revision 1<br />
This page intentionally left blank.<br />
APP F-iv
DOE/RL 88-41<br />
Revision 1<br />
1 1.0 INTRODUCTION<br />
2<br />
3<br />
4 The following sections evaluate the performance of the preliminary cover<br />
5 design as required by WAC-173-303. The areas in which the cover is evaluated<br />
6 are (1) surface water erosion, (2) wind erosion, (3) and landfill performance<br />
7 (HELP model evaluation). These evaluations support the effectiveness of the<br />
8 preliminary cover design.<br />
9<br />
10<br />
11<br />
12 2.0 SURFACE WATER EROSION<br />
13<br />
14<br />
15 Water Erosion Potential--The erosion potential of the cover surface soil<br />
16 because of precipitation events is evaluated using the U.S. Department of<br />
17 Agriculture (USDA) Universal Soil Loss Equation (USLE). The Universal Soil<br />
18 Loss Equation consists of six quantifiable factors, as follows (EPA 1979):<br />
r 19<br />
20<br />
21 A = RKLSCP<br />
22<br />
's 23<br />
24 .where:<br />
25<br />
26 A = average soil loss (tons/acre/yr)<br />
27 R = rainfall and run-off erosivity index<br />
G, 28 K = soil erodibility factor<br />
29 L = slope length factor<br />
30 S = slope steepness factor<br />
31 C = cover/management factor<br />
- 32 P = practice factor.<br />
33<br />
34 For this preliminary design, McGee Ranch will be the assumed borrow site<br />
35 for the topsoil layer. The following topsoil properties and cover design<br />
36 details are used to evaluate A:<br />
37<br />
38 • Topsoil type: silt to silt loam<br />
39<br />
40 • Average percent organic matter: 0.23% (Routson 1973)<br />
41<br />
42 • Estimated percent clay: 6% (Routson 1973)<br />
43<br />
44 • Estimated percent silt: 85% (Last et al. 1987)<br />
45<br />
46 • Estimated percent sand: 9% (Last et al. 1987)<br />
47<br />
48 • Uniform percent cover slope: 3%<br />
49<br />
50 • Cover length (Maximum drainage length): 50 ft<br />
51<br />
52 • Cover vegetation: Thickspike and Siberian wheatgrasses.<br />
910313.1137<br />
APP F-1
LO<br />
e,<br />
cy<br />
ig<br />
1<br />
2<br />
3<br />
4<br />
5<br />
6<br />
7<br />
8<br />
9<br />
10<br />
11<br />
12<br />
13<br />
14<br />
15<br />
16<br />
17<br />
18<br />
19<br />
20<br />
21<br />
22<br />
23<br />
24<br />
25<br />
26<br />
27<br />
28<br />
29<br />
30<br />
31<br />
32<br />
33<br />
34<br />
35<br />
36<br />
37<br />
38<br />
39<br />
40<br />
41<br />
42<br />
43<br />
44<br />
45<br />
46<br />
47<br />
48<br />
49<br />
50<br />
51<br />
Therefore:<br />
DOE/RL 88-41<br />
Revision 1<br />
R = 20, from Figure F-1 (EPA 1979)<br />
K = 0.64, from Figure F-2 (EPA 1979)<br />
LS - 0.24, from Table F-1 (EPA 1979)<br />
C = 0.20 (Nyhan 1986)<br />
P = 1.0 (Nyhan 1986)<br />
A = (20)(0.64)(0.24)(0.20)(1.0) - 0.62 tons/acre per yr.<br />
This is an acceptable erosion rate as the overall site erosion is recommended<br />
to be limited to 2 tons/acre, which is a rate that does not significantly<br />
increase cover maintenance (EPA 1982).<br />
Sheet Erosion Potential of Cover --The cover design is evaluated also to<br />
determine if the 3% topsoil slope can withstand overland or sheet flow with a<br />
minimum of erosion. The 50-yr, 20-minute storm rainfall intensity of<br />
1.6 in./hour (Table F-2) is assumed for the design storm (Stone et al. 1983).<br />
The 50-yr storm was selected because it exceeds the minimum design life of the<br />
cover. The 20-minute rainfall intensity of 1.6 in./hour was assumed because<br />
that intensity did occur once in a 20-minute thunderstorm over the 37 yr that<br />
data was recorded at the <strong>Hanford</strong> Meteorology Station (Stone et al. 1983). The<br />
Ration 1 Method is used for determining design discharge for tributary areas<br />
of 1 m or less (about 1.196 yd 2) (Nelson and Abt 1986). Unit width analysis<br />
is used where area is expressed as slope length by unit width and where unit<br />
width = 1 foot.<br />
where:<br />
Q = CiA<br />
Q = Maximum design discharge (ft3/s)<br />
C = Run-off coefficient (assuming C = 1.00 indicates<br />
no infiltration or worst-case scenario)<br />
i = Intensity of rainfall (in./h)<br />
A = Area of tributary (acres).<br />
A portion of the design is all that need to be evaluated. The portion<br />
will be assumed to be a homogeneous watershed area. It will have a 3% slope<br />
with a length and a width of roughly 55 ft. Because the entire cover section<br />
cannot contribute to a single tributary, it is assumed that any tributary area<br />
is square. This yields an area of 0.07 acres.<br />
Therefore:<br />
910313.1137<br />
Q = (1 ft)(1.6 in/hr)(0.07 acres) = 0.11 ft3/s<br />
APP F-2
t0<br />
1-+<br />
O<br />
W<br />
i-r<br />
W<br />
i-+<br />
H<br />
W<br />
V<br />
D<br />
v<br />
v<br />
-n i<br />
w<br />
EPA, 1979<br />
Sn<br />
it<br />
1 Figure F-1. Average Annual Values of Rainfall -Erosivity Factor R. (EPA 1979).<br />
PS-90.138<br />
D<br />
A O<br />
m m<br />
rn r<br />
0 ou<br />
= CO<br />
i-..p
0<br />
C3<br />
m<br />
to D° 0<br />
0<br />
a•v<br />
T<br />
a<br />
^ 40<br />
c<br />
LL<br />
50<br />
± 60<br />
C<br />
m<br />
o.<br />
10<br />
20<br />
30<br />
7U<br />
80<br />
90<br />
\ i /<br />
90<br />
\ 80<br />
Jet<br />
`°<br />
/ 2 ^)%^..<br />
70—^^^ / —<br />
^. \ /<br />
-<br />
\. . ......... ........<br />
40<br />
30<br />
Percent Sand<br />
(0.10 - 2.0 mir \ * 15<br />
100 I<br />
PROCEDURE: With appropriate data, enter scale at left and<br />
proceed to points representing the soil's /, sand (0.10-2:0 mm),<br />
% organic matter, structure and permeabi li<br />
ty, la that ence ,<br />
Interpolate between plotted cu rves. The dolled line illustrates s211,<br />
X70..<br />
procedure for a soil having: silt + very fine sand 650%, sand 5%,<br />
organic matter 2.8%, structure 2, permeability 4. Solution: K= 0.31.<br />
0<br />
.70<br />
.60<br />
50 Y 0<br />
0<br />
40 E<br />
0<br />
.30 a<br />
N<br />
.20 u' .70<br />
10 60<br />
0 .50<br />
'1 -Very Fine Granular<br />
2 Fine Granular<br />
3 - Medium or Coarse Granular<br />
4 Blocky, Platy, or Massive<br />
'Soil Structure<br />
Rating 1 2 3 4<br />
.............. /r<br />
/<br />
/<br />
/<br />
r<br />
♦ 6 5 4 3 2 1 'Permeability<br />
/ , / / Rating<br />
v /<br />
/<br />
^ 6 -Very Slow<br />
r -- 5 - Slow<br />
4 - Slow to Moderate<br />
/ 3 - Moderate<br />
/ - 2 - Moderate to Rapid<br />
/ 1 - 11apid<br />
PS-90-143<br />
Figure F-2. Nomograph for Determining Soil-Erodibility Factor K for U.S. Mainland. (EPA 1979)<br />
y ..40<br />
0<br />
LL .30<br />
T<br />
v .20<br />
0<br />
W<br />
u) .10<br />
0.<br />
0<br />
m m<br />
N_ r<br />
O 00<br />
= 00<br />
...a
CD<br />
w<br />
w<br />
w<br />
w<br />
V<br />
n<br />
v<br />
T I<br />
cn<br />
1 Table F-1. Values of the Factor LS for Specific Combinations<br />
2 of Slope Length and Steepness.<br />
Slope<br />
Slope length (feet)<br />
25 50 75 100 150 200 300 400 500 600 800 1,000<br />
5 0.5 0.07 0.08 0.09 0.10 0.11 0.12 0.14 0.15 0.16 0.17 0.19 0.20<br />
6 1 0.09 0.10 0.12 0.13 0.15 0.16 0.18 0.20 0.21 0.22 0.24 0.26<br />
7 2 0.13 0.16 0.19 0.20 0.23 0.25 0.28 0.31 0.33 0.34 0.38 0.40<br />
8 3 0.19 0.23 0.26 0.29 0.33 0.35 0.40 0.44 0.47 0.49 0.54 0.57<br />
9 4 0.23 0.30 0.36 0.40 0.47 0.53 0.62 0.70 0.76 0.82 0.92 1.0<br />
10 5 0.27 0.38 0.46 0.54 0.66 0.76 0.93 1.1 1.2 1.3 1.5 1.7<br />
11<br />
12<br />
13<br />
6<br />
8<br />
10<br />
0.34<br />
0.50<br />
0.69<br />
0.48<br />
0.70<br />
0.97<br />
0.58<br />
0.86<br />
1.2<br />
0.67<br />
0.99<br />
1.4<br />
0.82<br />
1.2<br />
1.7<br />
14 12 0.90 1.3 1.6 1.8 2.2 2.6 3.1 3.6 4.0 4.4 5.1 5.7<br />
0.95<br />
1.4<br />
1.9<br />
1.2<br />
1.7<br />
2.4<br />
1.4<br />
2.0<br />
2.7<br />
1.5<br />
2.2<br />
3.1<br />
1.7<br />
2.4<br />
3.4<br />
1.9<br />
2.8<br />
3.9<br />
2.1<br />
3.1<br />
4.3 0<br />
15 14 1.2 1.6 2.0 2.3 2.8 3.3 4.0 4:6 5.1 5.6 6.5 7.3 y<br />
16 16 1.4 2.0 2.5 2.8 3.5 4.0 4.9 5.7 6.4 7.0 8.0 9.0 0 ib<br />
17 18 1.7 2.4 3.0 3.4 4.2 4.9 6.0 6.9 7.7 8.4 9.7 11.0<br />
18 20 2.0 2.9 3.5 4.1 5.0 5.8 7.1 8.2 9.1 10.0 12.0 13.0<br />
19 25 3.0 4.2 5.1 5.9 7.2 8.3 10.0 12.0 13.0 14.0 17.0 19.0<br />
20 30 4.0 5.6 6.9 8.0 9.7 11.0 14.0 16.0 18.0 20.0 23.0 25.0<br />
21 40 6.3 9.0 11.0 13.0 16.0 18.0 22.0 25.0 28.0 31.0 -- --<br />
22 50 8.9 13.0 15.0 18.0 22.0 25.0 -- -- -- -- -- --<br />
23 60 12.0 16.0 20.0 23.0 28.0<br />
24 NOTE: Values given for slopes longer than 300 ft or steeper than 18% are extrapolations<br />
25 beyond the range of the research data and, therefore, are less certain than the others<br />
26 (EPA 1979).<br />
27<br />
zo<br />
CD M
CD<br />
CD<br />
W<br />
w<br />
w<br />
V<br />
a<br />
T<br />
I<br />
Cn<br />
1 Table f-2. Average Return Period and Existing Record for Various Precipitation<br />
2 Amounts and Intensity During Specified Time Periods at the <strong>Hanford</strong> <strong>Site</strong><br />
3 (based on extreme value analysis of 1947 through 1969 records).<br />
4 Average Time period (amount in inches) Time period (intensity in inches per hour)<br />
5<br />
6<br />
return<br />
period Minutes Hours Minutes Hours<br />
7 years 20 60 2 3 6 12 24" 20 60 2 3 6 12 24<br />
8 2 0.16 0.26 0.30 0.36 0.48 0.62 0.72 0.49 0.26 0.15 0.12 0.08 0.052 0.030<br />
9 5 0.24 0.40 0.48 0.55 0.77 0.95 1.06. 0.72 0.40 0.24 0.18 0.13 0.079 0.044<br />
10 10 0.37 0.50 0.59 0.67 0.96 1.17 1.28 1.1 0.50 0.30 0.22 0.16 0.098 0.053<br />
11 25 0.47 0.62 0.74 0.83 1.21 1.45 1.56 1.4 0.62 0.37 0.28 0.20 0.121 0.065<br />
12 50 0.53 0.72 0.85 0.96 1.40 1.66 1.77 1.6 0.72 0.42 0.32 0.23 0.138 0.074<br />
13 100 0.60 0.81 0.96 1.07 1.59 1.87 1.99 1.8 0.81 0.48 0.36 0.27 0.156 0.083<br />
14 250 0.68 0.93 1.11 1.22 1.82 2.13 2.26 2.0 0.93 0.55 0.41 0.30 0.177 0.094<br />
15 500 0.73 1.02 1.22 1.33 2.00 2.34 2.47 2.2 1.02 0.61 0.44 0.33 0.195 0.103<br />
16 1,000 0.80 1.11 1.33 1.45 2.20 2.55 2.68 2.4 1.11 0.67 0.48 0.37 0.212 0.122<br />
17 Existinq<br />
a<br />
0.59 0.88 1.08 1.68 1.88 1.91 ° 0.59 0.44 0.36 0.28 0.157 0.080<br />
18 record<br />
19 Month/day 6/12 10/1 10.5 10.5 10.5 10.5 6/12 10/1 10/1 10.5 10.5 10.5<br />
20 Year -- 1969 1957 1957 1957 1957 1957 -- 1969 1959 1959 1959 1959 1959<br />
21<br />
22 NOTE: Records for 1947 through 1969 are from Stone et al. (1983).<br />
23 'No records have been kept for time periods of less than 60 min. However, the rain gage<br />
24 chart for 6-12/69 shows the 0.55 in occurred during a 20-min period from 6:35 p.m., Pacific<br />
25 Standard Time. An additional 0.04 in occurred between 6:55 p.m. and 7:10 p.m., Pacific Standard<br />
26 Time, to account for the record 60-minute amount of 0.59 inch.<br />
27<br />
9<br />
0<br />
zo<br />
CD m<br />
fn r<br />
o eo<br />
= OD<br />
I
DOE/RL 88-41<br />
Revision 1<br />
1 In order to do unit analysis, the depth of flow for this discharge must<br />
2 be determined. Flow depth is calculated as follows:<br />
3<br />
4<br />
5<br />
6<br />
7<br />
8 where:<br />
9<br />
y - [Qn/(1.486)(S0.5)]0.6<br />
10 y = depth of flow (ft)<br />
11 Q - maximum design discharge (ft 3/second) (from previous equation)<br />
12 n - manning roughness coefficient (where n - 0.02<br />
13 for silt loam (Nelson and Abt 1986))<br />
14<br />
15<br />
S = cover slope (percent).<br />
16 Therefore:<br />
17<br />
M18<br />
19<br />
20<br />
r.. 21<br />
y = [(0.11 cfs)(0.020)/(1.486)(0.03)0.50.6 = 0.06 ft.<br />
22 The velocity can now be determined for a unit area (one flow depth deep,<br />
23 and one foot in width).<br />
24<br />
-'25<br />
26<br />
27<br />
my 28<br />
"29 where:<br />
-,130<br />
V = Q/A<br />
31 V = design flow velocity (ft/s)<br />
_.32 Q = maximum design discharge (ft3/s)<br />
33<br />
--34<br />
35<br />
A = y (area of flow).<br />
x'36<br />
37<br />
38<br />
V - (0.11 cfs)/(1 ft)(0.06 ft) 1.83 ft/s.<br />
39 Allowable V for silt loam is 3 ft/second (Nelson and Abt 1986).<br />
40 Therefore, sheet erosion potential of the cover materials is not a problem.<br />
41<br />
42<br />
43<br />
44<br />
45<br />
46<br />
3.0 WIND EROSION EVALUATION<br />
47 To evaluate the wind erosion potential of the cover surface soil, the<br />
48 Wind Erosion Equation (WEQ) was developed by the USDA Agricultural Research<br />
910313.1131<br />
APP F-7
1<br />
2<br />
3<br />
4<br />
5<br />
6<br />
7<br />
8<br />
9<br />
10<br />
11<br />
12<br />
13<br />
14<br />
15<br />
16<br />
17<br />
18<br />
19<br />
20<br />
21<br />
22<br />
23<br />
24<br />
25<br />
26<br />
27<br />
28<br />
29<br />
30<br />
31<br />
32<br />
33<br />
34<br />
35<br />
36<br />
37<br />
38<br />
39<br />
40<br />
41<br />
42<br />
43<br />
44<br />
45<br />
46<br />
47<br />
48<br />
49<br />
50<br />
51<br />
52<br />
DOE/RL 88-41<br />
Revision 1<br />
Service (ARS). It has been modified for use in the state of Washington by the<br />
Soil Conservation Service (USDA 1987). The equation is used to evaluate the<br />
potential for wind erosion of soil surfaces and is used as follows:<br />
where:<br />
E = f(IKCLV)<br />
E = the estimated average annual soil loss in tons/acre/yr due to wind<br />
erosion<br />
f - an indication that the equation includes functional relationships<br />
that are not straight-line mathematical functions<br />
I = soil erodibility factor<br />
K = ridge roughness factor<br />
C = climatic factor<br />
L = unsheltered distance<br />
V = vegetative factor.<br />
The equation can be considered to be successive modifications to I. The<br />
I factor is the potential annual wind erosion in tons/acre/yr for a given soil<br />
on an isolated, level, smooth, unsheltered, wide, and bare field with a<br />
noncrusted surface where the climatic factor is 100 percent.<br />
The I factor is dependent on the soil texture and the percentage of dry<br />
aggregates over 0.84 mm in size. From DOE 1990, this value is roughly 3% for<br />
McGee Ranch Silt. To evaluate a soil in a realistic manner entails<br />
determining the normal, natural occurring state of the soil after exposure to<br />
the elements. McGee Ranch soils normally exhibits a crusted surface<br />
condition, for which the I value in Table F-3 is 36.7. It is expected that<br />
the topsoil layer will form a crusted surface relatively soon after<br />
construction, in response to rain and snowfall events during the winter of the<br />
first year. If necessary, the formation of a crusted surface may be<br />
accelerated by direct application of water.<br />
910313.1423<br />
This I value must be adjusted for the portion of the cover that will be<br />
sloped and facing the prevailing winds. This is applied where an unsheltered<br />
distance of 500 ft or less exists as is the case with the 2101-M Pond cover.<br />
With a cover slope of 3%, the adjustment factor from Table F-4 is 1.3,<br />
therefore;<br />
I = (36.7)(1.3) = 48 tons/acre/yr<br />
The ridge roughness factor's (K) primary use is in application to<br />
agricultural related activities that take place on a recurring basis (e.g.,<br />
plowing, planting, discing, harrowing, etc.). Ridges may be created at<br />
planting time, but these will exist for only a short period of time. This<br />
assumes that the seed is planted using a drill as opposed to planting by<br />
broadcast seeding methods. Assuming a ridge height of 1 in. after seeding,<br />
APP F-8
0w<br />
w<br />
w<br />
V<br />
a<br />
v<br />
1<br />
2<br />
3<br />
4<br />
5<br />
6<br />
7<br />
8<br />
9<br />
10<br />
11<br />
12<br />
13<br />
14<br />
T i 15<br />
16<br />
17<br />
18<br />
19<br />
20<br />
21<br />
22<br />
23<br />
24<br />
25<br />
26<br />
0 0<br />
10 22.3<br />
20 16.3<br />
30 12.3<br />
40 9.3<br />
50 6.3<br />
60 3.5<br />
70 2.0<br />
80 0.3<br />
Israelsen et al. 1980.<br />
! 3 ;^z<br />
P<br />
Table F-3. Soil Erodibility Index<br />
Percent of dry soil<br />
not passing a 20 0 1 2 3 4 5 6 7 8 9<br />
mesh screen<br />
(Units) Noncrusted soil surface (tons /acre)<br />
0 0 310 250 220 195 180 170 160 150 . 140<br />
10 134 131 128 125 121 117 113 109 106 102<br />
20 98 95 92 90 88 86 83 81 79 76<br />
30 64 72 71 69 67 65 63 62 60 58<br />
40 56 54 52 51 50 48 47 45 43 41<br />
50 38 36 33 31 29 27 25 24 23 22<br />
60 21 20 19 18 17 16 16 15 14 13<br />
70 12 11 10 8 76 6 4 3 3 2<br />
80 2 0 0 0 0 0 0 0 0 0<br />
Fully crusted soil surface (tons/acre)<br />
51.7 41.7 36.7 32.5 30.0 28.7 26.7 25.0 23.3<br />
21.8 21.3 20.8 20.2 19.5 18.8 18.2 17.7 17.0<br />
15.8 15.3 15.0 14.7 14.3 13.8 13.5 13.2 12.7<br />
12.0 11.8 11.5 11.2 10.8 10.5 10.3 10.0 9.7<br />
9.0 8.7 8.5 8.3 8.0 7.8 7.5 7.2 6.8<br />
6.0 5.5 5.2 4.8 4.5 4.2 4.0 3.8 3.7<br />
3.3 3.2 3.0 2.8 2.7 2.7 2.5 2.3 2.2<br />
1.8 1.7 1.3 1.2 1.0 0.7 0.5 0.5 0.3<br />
0 0 0 0 0 0 0 0 0<br />
0<br />
m m<br />
10<br />
A<br />
10 10<br />
11<br />
12<br />
13<br />
14<br />
15<br />
16<br />
17<br />
18<br />
19<br />
20<br />
21<br />
22<br />
23<br />
24<br />
25<br />
26<br />
27<br />
28<br />
29<br />
30<br />
31<br />
32<br />
33<br />
34<br />
35<br />
36<br />
37<br />
38<br />
39<br />
40<br />
910314.0921<br />
DOE/RL 88-41<br />
Revision 1<br />
Table F-4. Knoll Erodibility I Correction Factor.<br />
Knoll facing wind<br />
rise in percent slope (along<br />
prevailing wind erosion direction)<br />
I slope<br />
correction<br />
3 1.3<br />
K factor of 0.6 is obtained from Figure F-3. This ridge height can only be<br />
assumed for the first year of the cover's life because the 2101-M Pond cover<br />
will not be subjected to annual tillage activities to develop and maintain<br />
soil ridges. The K factor will have little or no influence on the cover<br />
design after this first year. Therefore, the ridge height is assumed to be<br />
zero over long periods of time. From Figure F-3, the K value is then 1.<br />
The distribution of climatic factor (C) across Washington State is<br />
indicated in Figure F-4. Appropriate ranges for the C factor is 60 to 70 for<br />
the 2101-M Pond area.<br />
The vegetative factor (V) is difficult to characterize. During the first<br />
year after cover construction, before a mature stand of cover vegetation has<br />
been produced, the soil surface will be protected from wind erosion by<br />
spreading and crimping 4,000 lbs of straw per acre on or into the soil<br />
surface. For following years, the amount of plant production for the site<br />
must be estimated. The USDA Soil Conservation Service has performed a number<br />
of evaluations of range site conditions for varying soil and precipitation<br />
conditions. The average annual rainfall for this area is in the<br />
6- to 9-in. range. Using the data from similar climate and land use areas,<br />
the total annual production of air-dry weight per acre for the 2101-M Pond<br />
vegetative cover runs from a low of 200 lbs for unfavorable years, to 500 lbs<br />
for favorable years (USDA 1981). The design assumes the median value for V.<br />
This yields 350 lbs of air-dry material. Using Crested Wheatgrass from<br />
Table F-5 to represent the cover vegetation, the flat small grain equivalent<br />
is roughly 1,100 lbs/acre. The unsheltered field length (L) for the worst<br />
case condition on the cover is 50 ft.<br />
APP F-10<br />
1.6<br />
1.9<br />
2.3<br />
3.0<br />
3.6
1<br />
F<br />
`o<br />
1.0<br />
0.9<br />
0.8<br />
LL<br />
N<br />
C<br />
O)<br />
0<br />
0.7<br />
O<br />
Q<br />
NO)<br />
'O<br />
¢ 0.6<br />
O<br />
rn<br />
0.5<br />
DOE/RL 88-41<br />
Revision 1<br />
we 1 2 3 4 5 6 7 8 9 10<br />
Soil Ridge Roughness (inches)<br />
Figure F-3. Soil Ridge Roughness Factor K From<br />
Y^ Actual Soil Ridge Roughness (EPA 1979).<br />
APP F-11<br />
H9008006.6
CD<br />
0<br />
to<br />
N<br />
a<br />
v<br />
IV<br />
10<br />
Washington<br />
—1<br />
20<br />
30<br />
Figure F-4. Annual Wind _Erosion Climatic `C' Factor Map.<br />
79909079.1<br />
O<br />
;0O<br />
mm<br />
H r<br />
0 CO<br />
:3 00<br />
H ?
0<br />
w<br />
w<br />
w<br />
V<br />
aM<br />
v<br />
T I<br />
w<br />
1 Table F-5. Guide for Converting Range Vegetation to Equivalent Quantity<br />
2 of Flat Small Grain Residue. (sheet 1 of 2)<br />
3 Grass plants<br />
4 Buffalograss', burro- 320 720 1,630 2,630<br />
5 grass, and Inland<br />
6 saltgrass<br />
Pounds per acre of range vegetation<br />
50 100 200 300 400 500 600 700 800 900 1,000<br />
7 Big bluesteme 45 110 280 480 705 950 1,215 1,495 1,785 2,090 2,410<br />
8 Western wheatgrass', 155 245 775 1,240 1,740 2,260 2,795 3,345<br />
9 creeping wildrye,<br />
10 and side oats grama<br />
11 Little Bluestem' 45 110 285 495 735 995 1,280 1,580 1,900 2,230 2,575<br />
12 Blue grama', 110 235 490 760 1,040 1,325 1,610 1,905<br />
13 threadleaf sedge,<br />
14 and perennial<br />
15 three-awn<br />
16 Galleta and tobosa 150 300 800 1,200 1,700 2,600<br />
17 Bottlebrush 70 150 300 600 800 1,200<br />
18 squirreltail,<br />
19 needle and thread',<br />
20 and thruber<br />
21 needlegrass<br />
22 Alkali sacaton 60 150 400 800 1,400 2,200 2,800 3,600<br />
23 Bluebunch wheatgrass 50 120 300 550 850 1,150 1,500 1,900 2,300 2,600 3,000<br />
24 Idaho fescue 100 200 400 900 1,500 2,300<br />
25<br />
0<br />
zo<br />
m m<br />
N Imo"<br />
O CO ao<br />
I
0w<br />
w<br />
r+<br />
N<br />
.A<br />
1<br />
2<br />
3 Grass plants<br />
Table F-5. Guide for Converting<br />
^P Gig+ cM^ii r_.. in<br />
Vegetation to Equivalent Quantity<br />
e. (sheet 2 of 2)<br />
Pounds per acre of range vegetation<br />
50 100 200 300 400 500 600 700 800 900 1,000<br />
4 Indian ricegrass 100 175 300 600 900 1,400<br />
5 Crested wheatgrass 130 300 600 900 1,300 1,800 2,400 3,100 4,000<br />
6 Cheatgrass 100 200 300 600 800 1,000 1,200 2,000 2,500 3,000<br />
7 NOTE: Other grass species equivalents were estimated by comparing the growth characteristics<br />
8 with the tested species.<br />
9 'Lyles and Allison (1980).<br />
10<br />
a M<br />
v<br />
m<br />
T<br />
zo0<br />
Hr<br />
0 00<br />
3 co<br />
N
1<br />
2<br />
3<br />
4<br />
5<br />
6<br />
7<br />
8<br />
9<br />
10<br />
11<br />
12<br />
13<br />
14<br />
15<br />
16<br />
17<br />
X18<br />
19<br />
20<br />
,21<br />
22<br />
. 23<br />
24<br />
" 25<br />
26<br />
27<br />
28<br />
29<br />
n p 30<br />
31<br />
w 32<br />
33<br />
°- 34<br />
35<br />
36<br />
37<br />
38<br />
39<br />
40<br />
41<br />
42<br />
43<br />
44<br />
45<br />
46<br />
47<br />
48<br />
49<br />
910313.1137<br />
DOE/RL 88-41<br />
Revision 1<br />
With the given information: I= 48, K=0.6 for the first year and then<br />
1.0 for the life of the cover; C= 60 to 70, L=50, and V=4,000 for the first<br />
year and then 1,100 for following years; the value of E can be determined from<br />
interpolation of SCS wind erosion charts for these values.<br />
Wind erosion for the first year is estimated to be essentially zero.<br />
This is primarily attributed to the projected effectiveness of the straw mulch<br />
treatment. In following years, wind erosion will be determined by the<br />
condition of the grass stand. In the years following the initial seeding,<br />
when an average stand is present, wind erosion is predicted to be less than<br />
0.5 tons/acre/yr. It is assumed also that the straw mulch will continue to<br />
assist in reducing wind erosion for two to three years after placement. This<br />
will be dependent upon the climatic conditions during that time span.<br />
In those years when a less-than-average stand of grass develops (200 lbs<br />
air-dry weight/acre), the estimated V will drop to roughly 600 lbs/acre. This<br />
will yield a predicted erosion rate of 0.7 ton/acre/yr (C=60) to<br />
1.0 ton/acre/yr (C=70). As is demonstrated by these results, the projected<br />
soil losses are highly dependent on the vegetative factor. In those years<br />
when the vegetation yield is above the predicted average, the erosion rate<br />
will be insignificant. Until the vegetative cover becomes fully established,<br />
the erosion rates may exceed the estimated average range. After establishment<br />
of the vegetative cover, the erosion rates should more closely coincide with<br />
the predicted rates. An increase in the vegetative growth to around optimal<br />
production (500 lbs air-dry weight per acre) would decrease soil losses to<br />
zero.<br />
4.0 HYDROLOGIC EVALUATION OF LANDFILL PERFORMANCE<br />
The Hydrologic Evaluation of Landfill Performance (HELP) computer<br />
modelling results are included in this appendix. The HELP model was developed<br />
by the U.S. Environmental Protection Agency (EPA) to aid hazardous waste<br />
landfill designers in estimating water budget and quantity of leachate from a<br />
landfill. Therefore, the model is used as a tool to estimate water drainage<br />
and percolation through covers and/or liner and leachate collection systems<br />
for landfills. The model uses a deterministic, sequential daily analysis to<br />
calculate run-off, evapotranspiration, percolation, and lateral drainage. The<br />
following discussion is based on the documentation of the HELP Model,<br />
Version 2.0 (EPA 1984). The newest existing released version of the HELP<br />
model will be used during definitive design.<br />
The HELP model requires the use of specific cover-soil physical<br />
properties and local climatological data. The HELP model is provided with<br />
climatological data for many locations across the United States. Local<br />
climatological data available from the <strong>Hanford</strong> Meteorological Station were<br />
input to the HELP model where available (Skelly 1990).<br />
APP F-15
NZ<br />
e ,.<br />
A.a<br />
a<br />
1<br />
2<br />
3<br />
4<br />
5<br />
6<br />
7<br />
8<br />
9<br />
10<br />
11<br />
12<br />
13<br />
14<br />
15<br />
16<br />
17<br />
18<br />
19<br />
20<br />
21<br />
22<br />
23<br />
24<br />
25<br />
26<br />
27<br />
28<br />
29<br />
30<br />
31<br />
32<br />
33<br />
34<br />
35<br />
36<br />
37<br />
38<br />
39<br />
40<br />
910313.1137<br />
DOE/RL 88-41<br />
Revision 1<br />
The model is set up to run four different kinds of layers, only one of<br />
which is used for this design. The four types of layers are: (1) vertical<br />
percolation, (2) lateral drainage, (3) barrier or low-permeability components,<br />
and (4) waste layer. For the model, only the vertical drainage layer was used<br />
as a cover component as opposed to the low-permeability component to build<br />
some conservatism into the evaluation. The vertical layers work on the<br />
principle that there is no significant resistance to vertical flow. Water can<br />
move up or down to account for evapotranspiration as well as percolation. No<br />
lateral drainage is assumed for vertical drainage components.<br />
The model calculates water movement off of the cover surface and through<br />
the cover on a daily basis. The model handles precipitation as subdivided<br />
into components including runoff, evapotranspiration, percolation, and<br />
subsurface lateral drainage.<br />
Surface run-off is that component of precipitation that does not<br />
infiltrate the soil. Once the infiltration requirements are fulfilled, water<br />
begins to be stored in natural surface depressions and flows through small<br />
channels in the cover surface. A Soil Conservation Service curve number is<br />
assigned to the soil and is coupled with a Darcian flow equation modified for<br />
unsaturated flow conditions.<br />
Infiltration has been calculated based on the differences between daily<br />
precipitation and the sum of the change in surface storage of precipitation,<br />
the daily run-off, and surface evaporation. If the mean daily temperature is<br />
below 32 °F, the precipitation would be stored as snow.<br />
Evapotranspiration has been modelled as a function of available energy,,<br />
vegetation, soil, water transmissivity, and water content. For the<br />
evapotranspiration function, available surface water is first addressed and<br />
then subsurface water is used to separately calculate plant transpiration and<br />
evaporation on a daily basis.<br />
The model assumes that each layer is homogeneous with respect to<br />
hydraulic conductivity, porosity, and field capacity.<br />
The products of the model runs are summaries of annual totals, average<br />
annual total for 5 yr, and peak daily totals for precipitation, run-off,<br />
evapotranspiration, and percolation from base of cover. The following summary<br />
data is provided.<br />
APP F-16
t<br />
rs<br />
1<br />
2<br />
3<br />
4<br />
2101-M Pond<br />
Steady State Output<br />
7/16/90<br />
DOE/RL 88-41<br />
Revision 1<br />
5 Layer1<br />
6 Vertical Percolation Layer<br />
7 Thickness = 30.00 In.<br />
8 Porosity = 0.5140 Vol/Vol<br />
9 Field Capacity a 0.2585 Vol/Vol<br />
10 Wilting Point s 0.0681 Vol/Vol<br />
11 Initial Soil Water Content . 0.0899 Vol/Vol<br />
12 Saturated Hydraulic Conductivity = 0.001000000047 Cm/Sec<br />
13 Laver 2<br />
14 Vertical Percolation Layer<br />
15 Thickness = 12.00 In.<br />
16 Porosity = 0.3470 Vol/Vol<br />
17 Field Capacity = 0.2585 Vol/Vol<br />
18 Wilting Point a 0.0681 Vol/Vol<br />
19 Initial Soil Water Content = 0.0925 Vol/Vol<br />
20 Saturated Hydraulic Conductivity = 0.000000300000 Cm/Sec<br />
- 21 Layer<br />
22 Vertical Percolation Layer<br />
23 Thickness = 12.00 In.<br />
24 Porosity = 0.4370 Vol/Vol<br />
25 Field Capacity = 0.1050 Vol/Vol<br />
26 Wilting Point = 0.0470 Vol/Vol<br />
27 Initial Soil Water Content = 0.1114 Vol/Vol<br />
28 Saturated Hydraulic Conductivity = 0.002700000070 Cm/Sec<br />
29<br />
910313.1137<br />
APP F-17
1<br />
2<br />
3<br />
4<br />
5<br />
6<br />
7<br />
8<br />
9<br />
10<br />
11<br />
12<br />
13<br />
14<br />
15<br />
16<br />
17<br />
18<br />
19<br />
20<br />
21<br />
22<br />
23<br />
24<br />
25<br />
26<br />
27<br />
28<br />
29<br />
30<br />
31<br />
32<br />
33<br />
34<br />
35<br />
36<br />
910313.1137<br />
DOE/RL 88-41<br />
Revision 1<br />
General Simulation Data<br />
SCS Runoff Curve Number 3 80.00<br />
Total Area of Cover = 27600. Sq. Ft<br />
Evaporative Zone Depth 36.00 In.<br />
Upper Limit Veg. Storage 17.5020 In.<br />
Initial Veg. Storage = 3.2520 In.<br />
Initial Snow Water Content = 0.0000 In.<br />
Initial Total Water Storage in<br />
Soil and Waste Layers s 5.1438 In.<br />
Soil Water Content Initialized by User.<br />
Climatological Data<br />
User Specified Rainfall with Synthetic Daily Temperatures and<br />
Solar Radiation for <strong>Hanford</strong> Wash<br />
Maximum Leaf Area Index s 1.60<br />
Start of Growing Season (Julian Date) = 113<br />
End of Growing Season (Julian Date) 288<br />
Normal Mean Monthly Temperatures, Degrees Fahrenheit<br />
Jan/Jul Feb/Aug Mar/Sep Apr/Oct May/Nov Jun/Dec<br />
29.30 36.30 45.10 53.10 61.50 69.30<br />
76.40 74.30 65.20 53.00 39.80 32.70<br />
APP F-18
1<br />
2<br />
3<br />
4<br />
5<br />
6<br />
7<br />
8<br />
CV 9<br />
10<br />
11<br />
12<br />
13<br />
14<br />
15<br />
°16<br />
^17<br />
18<br />
19<br />
20<br />
21<br />
22<br />
23<br />
910313.1137<br />
DOE/RL 88-41<br />
Revision"1<br />
Monthly Totals for Year 1979<br />
Jan/Jul Feb/Aug Mar/Sep Apr/Oct<br />
Precipitation (in.) 0.54 0.17 0.54 0.52<br />
0.09 0.38 0.20 0.67<br />
Run-off (in.) 0.000 0.000 0.000 0.000<br />
0.000 0.000 0.000 0.000<br />
Evapotranspiration 0.778 0.324 0.206 0.447<br />
(in.) 0.090 0.280 0.300 0.137<br />
Percolation From 0.0030 0.0026 0.0028 0.0027<br />
Layer 3 (in.) 0.0026 0.0025 0.0024 0.0024<br />
Annual Totals for Year 1979<br />
May/Nov Jun/Dec<br />
0.10 0.00<br />
1.43 0.99<br />
0.000 0.000<br />
0.000 0.000<br />
0.606 0.309<br />
0.349 0.531<br />
0.0027 0.0026<br />
0.0023 0.0023<br />
(Inches) (Cubic Feet) Percent<br />
Precipitation 5.63 12949. 100.00<br />
Run-off 0.000 0. 0.00<br />
Evapotranspiration 4.357 10021. 77.39<br />
Percolation from Layer 3 0.0309 71. 0.55<br />
Change in Water Storage 1.242 2856. 22.06<br />
Soil Water at Start of Year 5.14 11831.<br />
Soil Water at End of Year 6.39 14687.<br />
Snow Water at Start of Year 0.00 0.<br />
Snow Water at End of Year 0.00 0.<br />
Annual Water Budget Balance 0.00 0. 0.00<br />
APP F-19
1<br />
2<br />
3<br />
2<br />
5<br />
6<br />
7<br />
8<br />
9<br />
10<br />
11<br />
12<br />
13<br />
14<br />
15<br />
16<br />
17<br />
18<br />
19<br />
20<br />
21<br />
22<br />
23<br />
910313.1137<br />
DOE/RL 88-41<br />
Revision 1<br />
Monthly Totals for Year 1980<br />
Jan/Jul Feb/Aug Mar/Sep Apr/Oct May/Nov Jun/Dec<br />
Precipitation (in.) 1.32 1.30 0.30 0.86 1.43 0.96<br />
0.00 0.02 0.85 0.33 0.44 1.89<br />
Run-off (in.) 0.000 0.000 0.000 0.000 0.000 0.000<br />
0.000 0.000 0.000 0.000 0.000 0.000<br />
Evapotranspiration 0.487 1.187 1.937 0.663 1.678 2.076<br />
(in.) 0.215 0.020 0.379 0.362 0.291 0.324<br />
Percolation from 0.0023 0.0021 0.0022 0.0021 0.0021 0.0020<br />
Layer 3 (in.) 0.0020 0.0020 0.0019 0.0019 0.0018 0.0019<br />
Annual Totals for Year 1980<br />
(Inches) (Cubic Feet) Percent<br />
Precipitation 9.70 22310. 100.00<br />
Run-off 0.000 0. 0.00<br />
Evapotranspiration 9.619 22124. 99.17<br />
Percolation from Layer 3 0.0244 56. 0.25<br />
Change in Water Storage 0.057 130. 0.58<br />
Soil Water at Start of Year 6.39 14687.<br />
Soil Water at End of Year 6.44 14817.<br />
Snow Water at Start of Year 0.00 0.<br />
Snow Water at End of Year 0.00 0.<br />
Annual Water Budget Balance 0.00 0. 0.00<br />
APP F-20
^r<br />
DOE/RL 88-41<br />
Revision 1<br />
1 Monthly Totals for Year 1981<br />
2 Jan/Jul Feb/Aug Mar/Sep Apr/Oct May/Nov Jun/Dec<br />
3 Precipitation 0.56 0.60 0.70 0.02 0.99 0.43<br />
4 (in.) 0.19 0.03 0.60 0.39 1.08 1.45<br />
5 Run-off (in.) 0.000 0.000 0.000 0.000 0.000 0.000<br />
0.000 0.000 0.000 0.000 0.000 0.000<br />
6 Evapotranspiration 0.696 1.502 1.071 0.431 0.367 1.395<br />
7 (in.) 0.181 0.030 0.098 0.334 0.537 0.558<br />
8 Percolation from 0.0018 0.0016 0.0018 0.0017 0.0017 0.0016<br />
9 Layer 3 (in.) 0.0017 0.0017 0.0016 0.0016 0.0015 0.0016<br />
10<br />
11<br />
12 Annual Totals for Year 1981<br />
13 (Inches) (Cubic Feet) Percent<br />
r, 14 Precipitation 7.04 16192. 100.00<br />
.15 Run-off 0.000 0. 0.00<br />
" 1 16 Evapotranspiration 7.202 16565. 102.30<br />
17 Percolation from Layer 3 0.0199 46. 0.28<br />
18 Change in Water Storage -0.182 -419. -2.59<br />
19 Soil Water at Start of Year 6.44 14817.<br />
20 Soil Water at End of Year 6.26 14399.<br />
21 Snow Water at Start of Year 0.00 0.<br />
22 Snow Water at End of Year 0.00 0.<br />
23 Annual Water Budget Balance 0.00 0. 0.00<br />
24<br />
910313.1137<br />
APP F-21
LO<br />
DOE/RL 88-41<br />
Revision 1<br />
1 Monthly Totals for Year 1982<br />
2 Jan/Jul Feb/Aug Mar/Sep Apr/Oct May/Nov Jun/Dec<br />
3 Precipitation 0.38 0.57 0.30 0.75 0.28 0.75<br />
4 (in.) 0.22 0.20 0.55 1.37 0.91 1.79<br />
5 Run-off (in.) 0.000 0.000 0.000 0.000 0.000 0.000<br />
0.000 0.000 0.000 0.000 0.000 0.000<br />
6 Evapotranspiration 0.692 1.161 1.038 0.583 0.709 0.342<br />
7 (in.) 0.717 0.195 0.291 0.399 1.038 0.569<br />
8 Percolation from 0.0015 0.0014 0.0015 0.0014 0.0015 0.0014<br />
9 Layer 3 (in.) 0.0014 0.0014 0.0013 0.0014 0.0013 0.0013<br />
10<br />
11<br />
12 Annual Totals for Year 1982<br />
13 (Inches) (Cubic Feet) Percent<br />
,. 14 Precipitation 8.07 18561. 100.00<br />
15 Run-off 0.000 0. 0.00<br />
-` 16 Evapotranspiration 7.735 17791. 95.85<br />
17 Percolation from Layer 3 0.0168 39. 0.21<br />
18 Change in Water Storage 0.318 731. 3.94<br />
19 Soil Water at Start of Year 6.26 14399.<br />
20 Soil Water at End of Year 6.58 15130.<br />
21 Snow Water.at Start of Year 0.00 0.<br />
22 Snow Water at End of Year 0.00 0.<br />
23 Annual Water Budget Balance 0.00 0. 0.00<br />
24<br />
910313.1331<br />
APP F-22
DOE/RL 88-41<br />
Revision 1<br />
1 Monthly Totals for Year 1983<br />
2 Jan/Jul Feb/Aug Mar/Sep Apr/Oct May/Nov Jun/Dec<br />
3 Precipitation 1.44<br />
4 (in.) 0.31<br />
5 Run-off (in.) 0.000<br />
0.000<br />
6 Evapotranspiration 0.597<br />
7 (in.) 0.680<br />
8 Percolation from 0.0013<br />
9 Layer 3 (in.) 0.0012<br />
10<br />
11<br />
1.36 1.00 0.42 0.52 0.68<br />
0.12 0.46 0.52 2.12 2.12<br />
f" 12 Annual Totals for Year 1983<br />
rr 13<br />
14 Precipitation<br />
_ 15 Run-off<br />
r?^<br />
°16 Evapotranspiration<br />
17 Percolation from Layer 3<br />
18 Change in Water Storage<br />
19 Soil Water at Start of Year<br />
20 Soil Water at End of Year<br />
21 Snow Water at Start of Year<br />
22 Snow Water at End of Year<br />
23 Annual Water Buget Balance<br />
24<br />
910313.1137<br />
0.000 0.000 0.000 0.000 0.000<br />
0.000 0.000 0.000 0.000 0.000<br />
1.000 2.188 0.863 0.706 2.009<br />
0.132 0.452 0.165 0.700 0.459<br />
0.0012 0.0013 0.0012 0.0013 0.0012<br />
0.0012 0.0012 0.0012 0.0011 0.0012<br />
(Inches) (Cubic Feet) Percent<br />
APP F-23<br />
11.07 25461. 100.00<br />
0.000 0. 0.00<br />
9.951 22887. 89.89<br />
0.0145 33. 0.13<br />
1.105 2541. 9.98<br />
6.58 15130.<br />
7.68 17671.<br />
0.00 0.<br />
0.00 0.<br />
0.00 0. 0.00
-,s<br />
1<br />
2<br />
3<br />
4<br />
5<br />
6<br />
7<br />
8<br />
9<br />
10<br />
11<br />
12<br />
13<br />
14<br />
15<br />
16<br />
17<br />
18<br />
19<br />
20<br />
21<br />
22<br />
23<br />
24<br />
910313.1206<br />
DOE/RL 88-41<br />
Revision 1<br />
Monthly Totals for Year 1984<br />
Jan/Jul Feb/Aug Mar/Sep Apr/Oct May/Nov Jun/Dec<br />
Precipitation 0.23 0.94 1.01 0.60 0.55 0.99<br />
(in.) 0.06 0.00 0.42 0.07 1.83 0.57<br />
Run-off (in.) 0.000 0.000 0.000 0.000 0.000 0.000<br />
0.000 0.000 0.000 0.000 0.000 0.000<br />
Evapotranspiration 0.463 1.325 2.024 0.624 0.748 2.403<br />
(in.) 0.235 0.000 0.217 0.268 0.468 0.595<br />
Percolation from 0.0011 0.0011 0.0011 0.0011 0.0011 0.0011<br />
Layer 3 (in.) 0.0011 0.0011 0.0010 0.0010 0.0010 0.0010<br />
Precipitation<br />
Run-off<br />
Evapotranspiration<br />
Percolation from Layer 3<br />
Change in Water Storage<br />
Soil Water at Start of Year<br />
Soil Water at End of Year<br />
Snow Water at Start of Year<br />
Snow Water at End of Year<br />
Annual Water Budget Balance<br />
Annual Totals for Year 1984<br />
APP F-24<br />
(Inches) (Cubic Feet) Percent<br />
7.27 16721. 100.00<br />
0.000 0. 0.00<br />
9.369 21548. 128.87<br />
0.0128 29. 0.18<br />
-2.112 -4857. -29.05<br />
7.68 17671.<br />
5.57 12814.<br />
0.00 0.<br />
0.00 0.<br />
0.00 0. 0.00
DOE/RL 88-41<br />
Revision 1<br />
1 Monthly Totals for Year 1985<br />
2 Jan/Jul Feb/Aug Mar/Sep Apr/Oct May/Nov Jun/Dec<br />
3 Precipitation 0.34 0.82 0.36 0.01 0.12 0.15<br />
4 (in.) 0.12 0.01 0.63 0.46 1.24 0.86<br />
5 Run-off (in.) 0.000 0.000 0.000 0.000 0.000 0.000<br />
0.000 0.000 0.000 0.000 0.000 0.000<br />
6 Evapotranspiration 0.673 1.205 0.933 0.050 0.130 0.150<br />
7 (in.) 0.027 0.103 0.339 0.263 0.279 0.632<br />
8 Percolation from 0.0010 0.0009 0.0010 0.0010 0.0010 0.0009<br />
9 Layer 3 (in.) 0.0010 0.0010 0.0009 0.0009 0.0009 0.0009<br />
10<br />
11<br />
12 Annual Totals for Year 1985<br />
13 (Inches) (Cubic Feet) Percent<br />
14 Precipitation 5.12 11776. 100.00<br />
15 Run-off 0.000 0. 0.00<br />
"4 16 Evapotranspiration 4.785 11006. 93.46<br />
17 Percolation from Layer 3 0.0114 26. 0.22<br />
18 Change in Water Storage 0.323 744. 6.32<br />
19 Soil Water at Start of Year 5.57 12814.<br />
20 Soil Water at End of Year 5.89 13558.<br />
21 Snow Water at Start of Year 0.00 0.<br />
22 Snow Water at End of Year 0.00 0.<br />
23 Annual Water Budget Balance 0.00 0. 0.00<br />
24<br />
910313.1137<br />
APP F-25
DOE/RL 88-41<br />
Revision 1<br />
1 Monthly Totals for Year 1986<br />
2 Jan/Jul Feb/Aug Mar/Sep Apr/Oct May/Nov Jun/Dec<br />
3 Precipitation 1.76 1.21 0.76 0.00 0.30 0.00<br />
4 (in.) 0.21 0.02 0.96 0.29 0.65 0.77<br />
5 Run-off (in.) 0.000 0.000 0.000 0.000 0.000 0.000<br />
0.000 0.000 0.000 0.000 0.000 0.000<br />
6 Evapotranspiration 0.542 1.381 1.746 0.443 0.367 0.457<br />
7 (in.) 0.981 0.020 0.320 0.265 0.234 0.272<br />
8 Percolation from 0.0009 0.0008 0.0009 0.0009 0.0009 0.0008<br />
CV% 9 Layer 3 (in.) 0.0009 0.0009 0.0008 0.0008 0.0008 0.0008<br />
10<br />
11<br />
12 Annual Totals for Year 1986<br />
13 (Inches) (Cubic Feet) Percent<br />
14 Precipitation 6.93 15939. 100.00<br />
-- 15 Run-off 0.000 0. 0.00<br />
16 Evapotranspiration 7.028 16164. 101.41<br />
17 Percolation from Layer 3 0.0102 24. 0.15<br />
18 Change in Water Storage -0.108 -249. -1.56<br />
19 Soil-Water at Start of Year 5.89 13558.<br />
20 Soil Water at End of Year 5.79 13309.<br />
21 Snow Water at Start of Year 0.00 0.<br />
22 Snow Water at End of Year 0.00 0.<br />
23 Annual Water Budget Balance 0.00 0. 0.00<br />
24<br />
910313.1332<br />
APP F-26
c.^<br />
r^<br />
DOE/RL 88-41<br />
Revision 1<br />
1 Monthly Totals for Year 1987<br />
2 Jan/Jul Feb/Aug Mar/Sep Apr/Oct May/Nov Jun/Dec<br />
3 Precipitation 0.80 0.55 1.05 0.14 0.39 0.08<br />
4 (in.) 0.50 0.07 0.01 0.00 0.40 1.63<br />
5 Run-off (in.) 0.000 0.000 0.000 0.000 0.000 0.000<br />
0.000 0.000 0.000 0.000 0.000 0.000<br />
6 Evapotranspiration 0.274 1.025 1.593 0.643 0.671 0.383<br />
7 (in.) 0.500 0.070 0.010 0.000 0.234 0.231<br />
8 Percolation from 0.0008 0.0007 0.0008 0.0008 0.0008 0.0008<br />
9 Layer 3 (in.) 0.0008 0.0008 0.0007 0.0008 0.0007 0.0008<br />
10<br />
11<br />
12 Annual Totals for Year 1987<br />
13 (Inches) (Cubic Feet) Percent<br />
14 Precipitation 5.62 12926. 100.00<br />
. 15 Run-off 0.000 0. 0.00<br />
16 Evapotranspiration 5.634 12958. 100.25<br />
17 Percolation from Layer 3 0.0093 21. 0.17<br />
18 Change in Water Storage -0.023 -53. -0.41<br />
19 Soil Water at Start of Year 5.79 13309.<br />
20 Soil Water at End of Year 5.76 13256.<br />
21 Snow Water at Start of Year 0.00 0.<br />
22 Snow Water at End of Year 0.00 0.<br />
23 Annual Water Budget Balance 0.00 0. 0.00<br />
24<br />
910313.1207<br />
APP F-27
DOE/RL 88-41<br />
Revision 1<br />
1 Monthly Totals For Year 1988<br />
2 Jan/Jul Feb/Aug Mar/Sep Apr/Oct May/Nov Jun/Dec<br />
3 Precipitation 0.48 0.00 0.60 1.12 0.33 0.11<br />
4 (in.) 0.13 0.00 0.39 0.01 0.82 0.40<br />
5 Run-off (in.) .0.000 0.000 0.000 0.000 0.000 0.000<br />
0.000 0.000 0.000 0.000 0.000 0.000<br />
6 Evapotranspiration 0.254 0.165 0.279 1.040 1.410 1.057<br />
7 (in.) 0.130 0.000 0.190 0.210 0.303 0.297<br />
8 Percolation from 0.0008 0.0007 0.0007 0.0007 0.0007 0.0007<br />
9 Layer 3 (in.) 0.0007 0.0007 0.0007 0.0007 0.0007 0.0007<br />
10<br />
11<br />
12 Annual Totals for Year 1988<br />
13 (Inches) (Cubic Feet) Percent<br />
14 Precipitation 4.39 10097. 100.00<br />
15 Run-off 0.000 0. 0.00<br />
16 Evapotranspiration 5.335 12270. 121.52<br />
17 Percolation from Layer 3 0.0085 20. 0.19<br />
18 Change in Water Storage -0.953 -2193. -21.72<br />
19 Soil Water at Start of Year 5.76 13256.<br />
20 Soil Water at End of Year 4.81 11064.<br />
21 Snow Water at Start of Year 0.00 0.<br />
22 Snow Water at End of Year 0.00 0.<br />
23 Annual Water Budget Balance 0.00 0. 0.00<br />
24<br />
910313.1208<br />
APP F-28
f'T<br />
1<br />
2<br />
3<br />
4<br />
5<br />
Precipitation<br />
Totals<br />
6 Run-off<br />
7 Totals<br />
Std. Deviations<br />
8 Std. Deviations<br />
' 9 Evapotranspiration<br />
DOE/RL 88-41<br />
Revision 1<br />
Average Monthly Values In Inches for Years 1979 Through 1988<br />
Jan/Jul Feb/Aug Mar/Sep Apr/Oct May/Nov Jun/Dec<br />
0.78 0.75 0.66 0.44 0.50 0.42<br />
0.18 0.09 0.51 0.41 1.09 1.25<br />
0.53 0.46 0.29 0.40 0.41 0.40<br />
0.14 0.12 0.28 0.40 0.57 0.60<br />
0.000 0.000 0.000 0.000 0.000 0.000<br />
0.000 0.000 0.000 0.000 0.000 0.000<br />
0.000 0.000 0.000 0.000 0.000 0.000<br />
0.000 0.000 0.000 0.000 0.000 0.000<br />
10 Totals 0.546 1.028 1.302 0.579 0.739 1.058<br />
0.376 0.085 0.260 0.240 0.443 0.447<br />
11 Std. Deviations 0.178 0.441 0.707 0.268 0.472 0.855<br />
=.r 0.323 0.094 0.133 0.118 0.257 0.151<br />
-° 12 Percolation from Laver 3<br />
13 Totals 0.0015 0.0013 0.0014 0.0013 0.0014 0.0013<br />
0.0013 0.0013 0.0013 0.0013 0.0012 0.0012<br />
14 Std. Deviations 0.0007 0.0006 0.0007 0.0006 0.0006 0.0006<br />
0.0006 0.0006 0.0006 0.0006 0.0005 0.0005<br />
15<br />
910313.1137<br />
APP F-29
P^<br />
r<br />
r.l.<br />
r°N<br />
1<br />
2<br />
3<br />
4<br />
5<br />
6<br />
7<br />
8<br />
9<br />
10<br />
11<br />
12<br />
13<br />
14<br />
15<br />
16<br />
17<br />
18<br />
19<br />
910313.1339<br />
DOE/RL 88-41<br />
Revision 1<br />
Average Annual Totals and (Standard Deviations) for Years<br />
1979 Through 1988<br />
(Inches) (Cubic Feet) Percent<br />
Precipitation 7.08 ( 2.085) 16293. 100.00<br />
Run-off 0.000 ( 0.000) 0. 0.00<br />
Evapotranspiration 7.101 ( 2.060) 16333. 100.25<br />
Percolation from Layer 0.0159 ( 0.0073) 37. 0.22<br />
Change in Water Storage -0.033 ( 0.965) -77. -0.47<br />
Peak Daily Values for Years 1979 Through 1988<br />
(Inches) (Cubic Feet)<br />
Precipitation 0.93 2139.0<br />
Run-off 0.000 0.0<br />
Percolation from Layer 3 0.0001 0.2<br />
Snow Water 0.76 1738.3<br />
Maximum Veg. soil water (vol/vol) 0.1694<br />
Minimum Veg. soil water (vol/vol) 0.0679<br />
APP F-30
^. z<br />
DOE/RL 88-41<br />
Revision 1<br />
1 Final Water Storage at End of Year 1988<br />
2 Layer (Inches) (Vol/Vol)<br />
3 1 2.66 0.0888<br />
4 2 0.97 0.0807<br />
5 3 1.18 0.0982<br />
6 Snow Water 0.00<br />
FA<br />
910313.1334<br />
APP F-31
-9<br />
cs+<br />
1<br />
2<br />
3<br />
4<br />
5<br />
6<br />
7<br />
8<br />
9<br />
10<br />
11<br />
12<br />
13<br />
14<br />
15<br />
16<br />
17<br />
18<br />
19<br />
20<br />
21<br />
22<br />
23<br />
24<br />
25<br />
26<br />
27<br />
28<br />
29<br />
30<br />
31<br />
32<br />
33<br />
34<br />
35<br />
36<br />
37<br />
38<br />
39<br />
40<br />
41<br />
42<br />
910313.1424<br />
DOE/RL 88-41<br />
Revision 1<br />
5.0 COVER MATERIAL VOLUME ESTIMATES<br />
The required volume of each of the cover components is estimated in<br />
Table F-6. The exact surface area requirements for the cover have yet to be<br />
determined. However, a preliminary amount of materials required for each cover<br />
component is estimated based on the following assumptions:<br />
• Cover area is 100 ft x 230 ft<br />
• Cover is 3 ft high (above grade)<br />
• The individual component thicknesses are as depicted in Figures II-5<br />
and II-6.<br />
Table F-6. Cover Material Volume/Area Estimates.<br />
Cover Component Cubic Yards<br />
Foundation Soil 1,600<br />
Low-Permeability Soil 850<br />
Topsoil 1,700<br />
NOTE: Ecology must approve the final cover<br />
design before construction.<br />
6.0 REFERENCES<br />
DOE/RL, 1990, Nonradioactive Dangerous Waste Landfill Closure Postclosure Plan,<br />
DOE/RL 90-17, Department of Energy, Richland Operations, Richland,<br />
Washington.<br />
Israelsen, C. G. , G. G. Clyde, J. E. Fletcher, E. K. Israelsen, F. W. Haws,<br />
P. E. Packer, and E. E. Fairer, Erosion Control During Highway<br />
Construction, National Cooperative Highway Research Program Report No. 221,<br />
Transportation Research Board, Washington, D.C.<br />
EPA, 1979<br />
PA-600/Z-79-165, Municipal Environmental Research Laboratory,<br />
U.S. Environmental Protection Agency, Cincinnati, Ohio.<br />
APP F-32
1<br />
2<br />
3<br />
4<br />
5<br />
6<br />
7<br />
8<br />
9<br />
10<br />
11<br />
12<br />
13<br />
14<br />
15<br />
16<br />
17<br />
-`-' 18<br />
19<br />
x 20<br />
t 21<br />
22<br />
910313.1137<br />
DOE/RL 88-41<br />
Revision 1<br />
EPA, 1984, The Hydraulic Evaluation of Landfill Performance (HELP) Model,<br />
EPA/530-SA-84-009, Two Volumes, U.S. Environmental Protection Agency,<br />
Washington, D.C.<br />
Lyles, L., and B. E. Allison, 1980, "Range Grasses and Their Small Grain<br />
Equivalents for Wind Erosion Control," Journal of Range Management,<br />
Vol. 33, No. 2, March 1980, pp. 143-146.<br />
Nelson, J. D. and S. R. Abt, 1986, Mini-Course #3: Application of Longand<br />
Design of Waste Disposal Systems, Presented a<br />
ium on Geotechnical and Geohydrological Aspects of<br />
Waste Management, orado State University, Fort Collins, Colorado,<br />
February 1986.<br />
Skelly, W. A., DailyT<br />
Wash<br />
f<br />
, Westinghouse <strong>Hanford</strong> Company, Richland,<br />
Stone, W. A, J. M. Thorp, 0. P. Gifford, and D. J. Hoitink, 1983, Climatological<br />
Summary for the <strong>Hanford</strong> Area, PNL-4622, Pacific Northwest Laboratories,<br />
Richland, Washington, June 1983.<br />
APP F-33
4 `•<br />
1<br />
910313.1137<br />
DOE/RL 88-41<br />
Revision 1<br />
This page intentionally left blank.<br />
APP F-34
m<br />
e<br />
CN<br />
910329.1003<br />
DOE/RL 88-41<br />
Revision 1<br />
APPENDIX G<br />
2101-M BUILDING EFFLUENT DATA<br />
APP G-i
r.,<br />
r^"t<br />
DOE/RL 88-41<br />
Revision 1<br />
1<br />
2<br />
3<br />
4<br />
5 This page intentionally left blank.<br />
910329.1005<br />
APP G-ii
.a t<br />
DOE/RL 88-41<br />
Revision 1<br />
2101-M Laboratory Wastewater<br />
Sample ID ML00= 5 UST Samples<br />
Detected Analytes<br />
Notes Units are PPS unless otherwise indicated.<br />
Analyte N Average Minimum Maximum 908 CI<br />
............................ .. ....... ....... ..a.... a*.....<br />
Alpha Activity (LDL,pCi/L) 4 6.SE-01 1.2E-01 1.3E+00 1.0E+00<br />
Beta Activity (pCi/L) 5 5.1E+00 2.6E+00 1.1E+01 7.5E+00<br />
Acetone (VOA) 1 4.0E+01<br />
Aluminum 3 2.5E+02 2.0E+02 3.3E+02 3.3E+02<br />
Ammonium 2 1.5E+02 1.2E+02 1.8E+02 2.3E+02<br />
Barium 5 2.2E+01 1.0E+01 3.0E+01.2.8E+01<br />
Bis(ethylhexyl) phthalate 1 7.1E+02<br />
Calcium 5 1.3E+04 5.8E+03 1.8E+04 1.6E+04<br />
Chloride 5 2.4E+03 7.0E+02 3.5E+03 3.2E+03<br />
Chloroform 3 2.3E+O1 1.1E+01 3.2E+01 3.4E+01<br />
Chromium 1 1.0E+01<br />
Conductivity-Field (uS) 5 8.5E+01 1.4E+01 1.3E+02 1.2E+02<br />
Copper 5 2.6E+02 4.2E+01 5.3E+02 4.1E+02<br />
Iron 5 4.8E+02 9.4E+01 1.3E+03 7.9E+02<br />
Lead (GFAA) 1 3.6E+01<br />
Magnesium 5 3.0E+03 1.3E+03 4.2E+03 3.8E+03<br />
Manganese 5 9.2E+00 6.0E+00 1.9E+01 1.3E+01<br />
Mercury 2 9.0E-01 3.0E-01 1.5E+00 2.7E+00<br />
Nitrate 1 5.0E+02<br />
Phosphate 1 1.5E+03<br />
pH-Field 5 6.2E+00 5.1E+00 7.5E+00 6.9E+00<br />
Potassium 5 6.8E+02 3.2E+02 8.8E+02 8.4E+02<br />
Sodium 5 1.7E+03 2.7E+02 2.8E+03 2.5E+03<br />
Sulfate 5 1.1E+04 5.0E+03 1.4E+04 1.3E+04<br />
Temperature-Field (celsius) 4 2.5E+01 2.2E+01 3.2E+01 2.8E+01<br />
TOC 7 3.4E+03 1.0E+03 1.3E+04 5.7E+03<br />
TOX 2 1.7E+02 1.6E+02 1.9E+02 2.3E+02<br />
TOX (LDL) 1 4.0E+01<br />
Uranium 5 4.6E-01 3.1E-01 6.8E-01 5.7E-01<br />
Zinc 5 8.1E+01 4.6E+01 1.4E+02 1.1E+02<br />
APP G-1
'v<br />
N<br />
2101-4 Laborato ry Wastewater<br />
ID: hL00, 5=50019, 09/17/35 10:50<br />
Detected Analytes<br />
Note: Units an FPO unless otherwise indicated.<br />
Key Analyte<br />
s<br />
Result<br />
S Alpha Activity (LPL,^ppCi/ L) 1.30E+00<br />
S Beta Activity (pCi/U<br />
4.33E+00<br />
S Barium 2.10E+0 1<br />
S Sis(ethylhexy k) phthalate 7.10EM2<br />
S Calcium 1.42E+04<br />
S Chloride 2.34E+03<br />
S Chloroform 1.10E+0 1<br />
S Chromium 1.00E+01<br />
S Conductivity-Field WS) 1.27E+02<br />
S copper 4.20E+01<br />
S Mx si um<br />
3.220E<br />
S Phosphate 1.46E+03<br />
S pN-Field 7.51E+00<br />
S Potassium 3.82E+02<br />
S Sulfate t.34E++ 04<br />
S Teaoerature-Field (Celsius) 2.24E+0 1<br />
S TOC 1.02E+03<br />
S T0c 1.43E+03<br />
Uranium 3."E-01<br />
S Zinc<br />
Key: S - Sampte, E - Extract, B - BLN*, T - Trip Stank<br />
2101-4 Laboratory Wastewater<br />
ID: hL00, 5=50019, 09/17/35 10:50<br />
Undetected Anatytes<br />
Note: MoAs art detined by contract with US Testing.<br />
They do not reflect Procedural limitations.<br />
Units an PPS unless otherwise indicated.<br />
Key .WLyte<br />
e<br />
Result<br />
S ACetMitrite<br />
2101-4 Laboratory Wastewater<br />
ID* NL00, 5=50019, 09/17/8S 1000<br />
Undetected Ahalytes<br />
a 6 6m<br />
Note: NDAs are defined by contract with US Testing.<br />
They do not ffftfct procedural li mitations.<br />
Units are PPS wLfsf otherwise indieatfd.<br />
Key Analyte Resu lt Key Ahalyt e<br />
a<br />
2101-h Laboratory Wastewater<br />
ID: NL00, S=50019, 09117/85 10:50<br />
Undatacted AMLytes<br />
Note: NOAs are defined by contract with US Testing,<br />
They do not refLfct procedural Liaitati ons.<br />
Units am PPS unless otherwise indicated.<br />
S BerYlliu<br />
S ais(2-Cnlorwtlary) other<br />
S Sla
n<br />
2101-" Laboratory Waste wa ter<br />
2101-" Laborato ry wastewater<br />
ID: ML00, 5-50019, 09/17/65 10:50 ID: WOO, Sw50019, 09/17/85 10:50<br />
Undetected Analytes<br />
Lntect<br />
Note: Was are defined by contract with US Testing. Note: MDAS are defined by contract with US Testing.<br />
They do not reflect procedural tisitations.<br />
They do not reflect p rocedural tiaitations,<br />
Units are PM unless otherwise indicated. Units are PPS unless otherwise indicated.<br />
Xey Analyte Resutt Key Analyt e R esu lt<br />
S OiethyUhthalate 0 .00E+01 S Ftuoroacetic acid
a<br />
'v<br />
L7<br />
I<br />
2101-4 Laboratory wastewater<br />
ID: NLOO, S=50019, 09/17/85 10:50<br />
U ndetected Anelytes<br />
9 1 0<br />
Note: NDA$ are defined by contract with US Testing.<br />
They ao not reflect p rocedu ral limitations.<br />
Units are PPS unless otherwise i nd icated.<br />
Key AMlyte<br />
a<br />
S 2-wthyttactonitrito<br />
S ?ethyl meroaptan<br />
S 4ethyt methacrytate<br />
S 4ethyt N
a<br />
.D<br />
p^<br />
1<br />
rn<br />
2101-M Laboratory Wastewater<br />
ID: ML00, S=50019, 09/17/85 10:50<br />
Undetected Analytes<br />
Mote: MDAs are defined by contract with US Testing.<br />
They do not reflect p rocedural limitations.<br />
Units are PPB uiless otherwise indicated.<br />
Key Analyte Result<br />
S o-Toluidine hydrochloride<br />
S TOx<br />
S 1,2,3-Trichlo robenzene<br />
S 1,2,4-Trichlorobenzene<br />
S 1,3,5-Trichlorobenzene<br />
S 1,1,1-Trichlo roethane<br />
S 1,1,2-Trichloroethane<br />
S Trichloroethene<br />
S Trichloromethanethiol<br />
S Trichloromonofluoromethane<br />
S Z,4,5-Trichlorochenol<br />
S 2,4,6-Trichlorophenol<br />
S Trichlorapropane<br />
S 1,2,3-Trichlorooro cane<br />
S Triethylphosphorothicate<br />
a'O<br />
c)<br />
I<br />
V<br />
2101-9 laboratory Wastewater<br />
ID: ",(B•500525 05/23!36 13:50<br />
Undetected Arglytes<br />
mote: nDAS are defin ed by c on tract with US Testing.<br />
They no not nfleCt o rocedural !imitations.<br />
Units an PM unless otherwise indicat ed.<br />
Key Analyte Result<br />
S Acetonitrile<br />
S Acttonyl bromide<br />
B Ac etuuryryl bromide<br />
S Acetaoherone<br />
S 2-Aeetylamimfluorene<br />
S ACrolein<br />
B ACrolein<br />
S Acryla,de .<br />
S Ac rylonitle n<br />
B Acrylon,trile<br />
S A(dicarb<br />
S Allyl alcohol<br />
S A-Aminobiphe"t<br />
S AainOtthylena<br />
S 5-AmiroetMl-3-iwsazo(ol<br />
S 2-AminomPthalene<br />
S Amitrole<br />
S A^IM<br />
S AM lira<br />
S Antimor rf<br />
S Araite<br />
S BenzCC3 4cridine<br />
hracene<br />
S Benzene<br />
B Benzene<br />
S Benzidine<br />
S Benzowftuoranthene<br />
S BemoC ]tluormhene<br />
S BeM&$0PentaPhene<br />
a v<br />
G'r<br />
t<br />
W<br />
2101-71 laborato ry Waste wa ter<br />
ID: HLM, tS- SS l OS/Z3/36 13:50<br />
Undetected Analytes<br />
Rote: +DAs are defined by contract with US Testing.<br />
They do not reflect procedural•limitations.<br />
Units an PPS unless otherwise indicated.<br />
Key Anatyte Result<br />
8 2-Chloroethyl viMt ether
av<br />
v<br />
G7<br />
i<br />
CO<br />
2101-4 Laboratory Wastewater<br />
ID: MLOO, (^^11 OS/23/86 13:50<br />
Undetected Analytes<br />
Note: MDAS are defined by c on tract with US Testing.<br />
They do not reflect procedural limitation.<br />
Units are PPB unless otherwise indicated.<br />
Key Anatytt Resu lt<br />
S OimethylbemCa3 anihracene
D v<br />
"O<br />
G•1<br />
I<br />
O<br />
2101~1 Laboratory Mastevater<br />
ID: 1L00, S-50051 05/23/66<br />
4.50052E<br />
13:50<br />
d<br />
1<br />
m F,<br />
3<br />
1<br />
2101-4 laborato ry Yastewttr<br />
I0: +LOO, tS- SS hi s 05/23/66 13:50<br />
Undetected Analytts<br />
Undetected ANlytes<br />
• Note: MDAS are defined by Contra ct with US Testing.<br />
They dp not reflect p rocedural Limitations.<br />
Note: MDAs are defined by contract with US Testing. Units are PPB unless othetwise indicated.<br />
They do not reflect procedural limitations.<br />
Units art PPB unless otheroise indicat ed . Key ^Y<br />
Analyt e Result<br />
K e y Arelyte<br />
B „ethyl ethyL ketone<br />
S 4ethylh yyddrazing<br />
S 2-MthYllactonitrilt<br />
S Methyl aereaptan<br />
B MethyL mercaptan<br />
S Methyl methac rylatt<br />
B Methyl aethacrylate<br />
S Methyl Mthantsulfonate<br />
S Methylnitroso rathane<br />
S MethylwtrosovinylYiM<br />
S 2-4 1 hy LPyridine<br />
S Aethylthiouracil<br />
S 1-Naphthalamine<br />
S Naphthalene<br />
S 1,1-Wphthaltnediorn<br />
S Mickel<br />
S Nicotinic acid<br />
S Nitrate<br />
S a-oitroaniline<br />
S Nitrobenzene<br />
S Otrophomt<br />
S lrMit rosodiethanolaaine<br />
S N-NitrosomethyYlethylamine<br />
S witit rosamorp!oline<br />
S *Idtrosond rnicotine<br />
S Mitrosaoiperidine<br />
S Mitrosopyrrolidine<br />
S 5-Mitrc-o-toluidine<br />
Result<br />
a 'vv<br />
c'a<br />
I<br />
2101-4 Laborato ry wastewater<br />
I0: KOO, (S5 i 05/23/66 13:50<br />
me<br />
Undetetted AMLytes<br />
Note: NDAS are defined by contract with US Testing.<br />
They do not reflect procedural Limitations.<br />
Units are PPS unless otherwise indicated.<br />
Key Analyte Result<br />
S 1,1,Z,2-Tetr4chloroet hsne<br />
8 1,1,Z,2-Tetrachloroete han<br />
S Tetrachloroethylene<br />
S Tetrachtoroeth yy lene<br />
S 2,3,a,6"Tetracl^ Loroohenol<br />
S Thiofanox<br />
S Thioghenol<br />
S Thiurr<br />
S Toluene<br />
8 Toluene<br />
S Toluenedirine<br />
S o4otuidine hydrochloride<br />
S 1,2,3-Trichlorobenzene<br />
1,2,4 "<br />
S -T^ichLo<br />
ob*rzene<br />
11.80E+01<br />
a .D<br />
cs<br />
r<br />
N<br />
2101-H Laboratory Wastewater<br />
ID: )100, (S•SOM9 07/17/86 13:20<br />
Detected AnatYtes<br />
Note: Units an PPB unless otherwise indicated.<br />
Key AnaLYte ResuLt<br />
S ALDha Activity (LOL 3p011)<br />
S Beta Activity (PCi/^<br />
S Alumina<br />
S Barium<br />
S Calcium<br />
S Chloride<br />
S Chloro form<br />
S Conduetivity- Fi eld (uS)<br />
S Iron r<br />
S Magnesium<br />
S xwgxnese<br />
S Mercury<br />
B MethYYlax Chloride<br />
S pH-Field<br />
S Potassium<br />
S Sodi um<br />
S Sulfate<br />
roraturt- F i eld (celsius)<br />
S TO<br />
S TOK<br />
S Uranium<br />
S zinc<br />
^ I I<br />
1.20E-01<br />
3.02E+00<br />
1.95E+02<br />
3.00E+01<br />
1.77E+06<br />
3.5aE+03<br />
3.20E+01<br />
1.30E+02<br />
8.90E+01<br />
2.80E+02<br />
6.16E+0S<br />
6.00E+00<br />
3.00E-0 1<br />
Mc<br />
I 1E+00<br />
7.97E+02<br />
+<br />
1.12E+06<br />
011<br />
1.96 E<br />
1.91E+02<br />
5.66E-0 1<br />
7.00E+01<br />
Key: S = Sample, E • Extract, B • Blank, T • Trip Blank<br />
a<br />
2101-M Laboratory Wastewater<br />
ID: +100, (^0f 07/17/86 13:20<br />
Undetected AMalytes<br />
Note'. +DAs an defined by contract with US Testing.<br />
They donot reflect procedural limitations.<br />
units a re PPS inkese otherwise indi cated.<br />
Key Anatyte<br />
a<br />
Result<br />
S Atetonitrite
Y<br />
v<br />
v<br />
G7<br />
i<br />
w<br />
2101-0 laboratory Wastewater<br />
Io: 1e.00, (8.300V 07/17/86 13:20<br />
Undetected Malytes<br />
Note: MDAS are defi ne d by Contract with US Testing.<br />
They donot reflect procedural limitations.<br />
Units are PPS un Less otherwise indicated.<br />
Key MaLyte<br />
a<br />
Result<br />
S Banzaca)pyrene<br />
a •vv<br />
GL)<br />
A<br />
2101 •+a laborato ry Wastewater<br />
ID: MA,S= ( 0M 07/17/86<br />
Undetected Analytes<br />
13:20<br />
2101-+1 laboratory Wastewater<br />
ID: x100,(8= 07/17/86 13:20<br />
500905<br />
Undetected Analytes<br />
Mote: rOAS are defined by contract with US Testing.<br />
Note: LDA$ arc defined by contract with US Testing.<br />
They do not reflect orotetlural limitations,<br />
Units are PPS unless otherwise indicated.<br />
Key Ana lyte Result<br />
a<br />
They do not reflect ofocedurat limitations.<br />
(knits are PPS unless otherwise indicated.<br />
Key Anal)rte Result<br />
s<br />
S Di<br />
S m- Oichlorobenterwr<br />
a<br />
v<br />
I<br />
N<br />
2101-R laboratory Wastewater<br />
I3 ._<br />
2101-M laboratory waste ter<br />
Io: (S=50089s 07/17/86 13:20 Io: e.OD,IS=500 089 07/17/86 13:20<br />
Undetected AmLytes<br />
tote: nDAs an defined by contract with US Testing.<br />
up not mtt*ct Limitations.<br />
Unitsyan PP8 unless other wiea indicated<br />
Key Analyte Result<br />
S Elyci dy laldehyydGe
a v<br />
1<br />
Ol<br />
2101-M laboratory Waste water<br />
ID: ICAO, S=50089 07/17/36 13:20<br />
6 5<br />
Undetected Analyzes<br />
Mote: MDAS an defined by contract with US Testing.<br />
They do not reflect procedural limitations.<br />
Units art PPB unless otherwise indicated.<br />
Key Analyte Result<br />
s<br />
S Pentachlorobentene
D<br />
v<br />
i<br />
V<br />
2101-0 Laboratory wast ewater<br />
ID-. )ILM, ( S f 071 17/36 13-.20<br />
Undetected Anatytes<br />
Note: RDA$ are defined by contract with US Testing.<br />
They donot reflect ProctduraL limitations.<br />
Units are PPS unless otherwise indicated.<br />
Key AMLyte Result<br />
8 1,2,3-Trichlorcororoppaannee
D 'o<br />
L1<br />
N<br />
00<br />
N'i1<br />
„„1<br />
21(n-* Laborato ry gastewater 2101-A Laboratory wastewter<br />
Io: Nt00, (^167 10/30/$6 13:22 101 ?too, (^S6 10/30136 13.22<br />
lbdeteettd Analytes tkdeteeted Analytes<br />
Note. RDAs are defined by =tract with US Testing.<br />
indicated.O°s<br />
Un syamt P LB uht gss otMrwise<br />
Key<br />
a<br />
Analyte<br />
Result<br />
S Acetonitrilt<br />
nv.<br />
v<br />
ca<br />
1<br />
2101-R Laborato ry Wutewter<br />
ID: MOD.0167 10 130/86 13:22<br />
Undetected Analytes<br />
rote: RDAs are defined by contract with US Testing.<br />
They do not reflect procedural Limitations.<br />
Units are PPS WLtss otherwise indicated.<br />
Key AlNtyte<br />
a<br />
Rtsult<br />
S Chtoroferm<br />
a v<br />
Di<br />
I<br />
N O<br />
2101-4 Laboratory Waste wa ter<br />
ID: MOD,L^0167 10/30/86 13:22<br />
Undetected Arw Lytes<br />
Hotel MDAs are defined by contract with US Testing,<br />
They do not reflect procedural limitations,<br />
Units are "a unless otherwise indicated.<br />
Key<br />
s<br />
Analyte<br />
Result<br />
S Dimsth lbenzCa3anthracane
a v<br />
1<br />
N<br />
2101-M Laboratory Wastewater<br />
ID:<br />
10/30/86 13:22<br />
M.00,(^501685<br />
Undetected Analytes<br />
9 ! 1<br />
Note: MDAs are defined by contract with US Testing.<br />
They do not reflect ProceduraL Limitations.<br />
Units are PPS unless otherwise indicated.<br />
Key Anatyte Result<br />
S Methyl ethyl ketone<br />
8 Methyl eth y L ketone<br />
S Methythyi^drazine<br />
S 2-MethyLLactonitriLs<br />
S Methyl mercaptan<br />
n<br />
v<br />
G'a<br />
N<br />
2101-M Laborato ry Wastewater<br />
ID: MOO,
D<br />
c v<br />
rs<br />
1<br />
N<br />
W<br />
2101- 4 L.acnratory wastewater<br />
ID: hAO,<br />
(8 02335<br />
Detected Analytes<br />
01/26/87 10:25<br />
Note: Units are PPS unless otherwise indicated.<br />
Key AnaLyte ReauLt<br />
S Sets Activity (pCi/ L) 2.57 E-00<br />
S Aanmiu<br />
1.76E+02<br />
S atri um<br />
1,00E+01<br />
S Catet um<br />
5.80E+03<br />
S Chloride<br />
7.00E+02<br />
S Conductivity-Fie Ld WS)<br />
S Copper<br />
S Iron<br />
S Magnesium<br />
5 Manganese<br />
a Methylene chloride<br />
S mt-Field<br />
S Potassi um<br />
S SuLfum<br />
S Sut tate<br />
4,56E+02<br />
2.41E+02<br />
1.30E+03<br />
7.00E+0G<br />
5.50E+01<br />
5.24E+00<br />
3.16E+02<br />
1.97E+03<br />
S Teneraturrfie Ld (cetsius) 3.17E+01<br />
S TOC<br />
1.28E+04<br />
S TOX (LDL)<br />
4.02E+0t<br />
S Uranium<br />
S Zinc<br />
0. 60E+01<br />
Undetected Ana Lytes<br />
Note: MDAs are defined by contract with US Testing.<br />
They do not reflect procedural Limitations.<br />
Units are PPS un Less otherwise indicated.<br />
Key AnaLyte Result<br />
S Acetmitrile<br />
S ADetcnyL bromide<br />
B Aeetmmyyl bromide<br />
S ACMPnenOne<br />
S 2-Acetytaminofluorene<br />
210" Laboratory Wastewater<br />
ID: AM, (S-500232 01/26/87 10:25<br />
233),<br />
Undetected Analytes<br />
9 i 1 _„t8<br />
Note•. NDAS are defined by cont ra ct with US Testing.<br />
They do not reflect procedural Limitations.<br />
Units are PPS unl es s otherwise i nd icated.<br />
Key Anslyte R esuLt<br />
S Bis(2-chloroethoxy)methane
nv<br />
Gib<br />
N<br />
2101-M laboratory wastewater<br />
ID: N.00, (8-5002 23 32 01/26/87 10:25<br />
Undetected Ani Lytes<br />
Note: MDAS are defined by contract with US Testin g . .<br />
They do not reflect procedural limitations.<br />
Units are PM unto S otherwise indicated.<br />
Key Analyte Res ult<br />
S t,s-Dichtoro-2-butem<br />
n v<br />
i<br />
N<br />
m<br />
2101" Laboratory Wastewater<br />
ID: ML00,(^0 32, 01/26/87 10:25<br />
Undetected AneLYtes<br />
Note'. MDAS are defi ned by contract with US listing.<br />
They do not reflect procedural Limitations.<br />
Unite are PPO unless otherwise indicated.<br />
Key Ana Lyte Result<br />
S Hexachtoropropem<br />
n<br />
'v<br />
v<br />
G's<br />
I<br />
N<br />
V<br />
2101-N Laboratory Wastewater<br />
ID: mLOO,CSS•50232 01/26/87 10:25<br />
Undetected Anatytes<br />
Note: MOAs are defined by contract with US Testing.<br />
They do not reflect orocedurst Limitations.<br />
Units are PPS unless otherwise indicated.<br />
Key AOalyt tResul t<br />
s<br />
8 Pentathtoroethane
n v<br />
c1<br />
N CO<br />
2101-n Labo ratory Wastewater<br />
ID: N.00, S •50232 01/26/87 10:25<br />
(0.50233)<br />
Undetected Anetytes<br />
Note: nDAS are defined by contract with US Testing.<br />
They do not reflect procedural limitations.<br />
unit are PPE unless otherwise indicated.<br />
Key Anatyte Aesult<br />
S Wrinitrobenzene
Number of Copies<br />
O NSITE<br />
DOE/RL 88-41<br />
DISTRIBUTION<br />
11 U.S. Department of Energy-<br />
Richland Operations Office<br />
R. D. Izatt (9) A5-19<br />
DOE-RL Reading Room (2) Al-65<br />
Pacific Northwest Laboratory<br />
M. A. Chamness K6-96<br />
<strong>Hanford</strong> Technical Library P8-55<br />
32 Westinghouse <strong>Hanford</strong> Company<br />
H. N. Bowers R3-60<br />
R. A. Carlson H4-55<br />
C. J. Chou H4-56<br />
J. J. Consort H4-56<br />
W. G. Cox (3) H4=57<br />
L. P. Diediker TI-32<br />
C. K. Disibio B3-03<br />
C. J. Geier H4-57<br />
D. J. Hoff H4-57<br />
L. A. Kemp H4-17<br />
M. J. La Barge B2-19<br />
R. J. Landon 62-19<br />
S. M. McKinney T1-30<br />
M. A. Mihalic L4-86<br />
L. L. Powers B2-35<br />
W. A. Retterer S2-93<br />
F. A. Ruck III H4-57<br />
L. W. Vance H4-16<br />
M. A. Wasemiller H4-55<br />
B. D. Williamson B3-15<br />
Central Files L8-15<br />
EDMC/AR (6) H4-22<br />
Document Clearance and<br />
Administration (3) H4-17<br />
Distr-1
G^+<br />
THIS ^.4F+'. ^.-pom-tm •R.^r^mt n.^n :(('GL di ¢a€'<br />
5ii .`t 'Sn yr 5a^il 6rcTS a9n:^F Li<br />
LEY^ BLANK