<strong>The</strong> tables show that departments with fewer resources, such as Beni and Pando, register <str<strong>on</strong>g>the</str<strong>on</strong>g> highest effective implementati<strong>on</strong> rates in <strong>Bolivia</strong>. Thus, <str<strong>on</strong>g>the</str<strong>on</strong>g> way in which resources are efficiently implemented is an additi<strong>on</strong>al variable worth taking into account when analyzing <str<strong>on</strong>g>the</str<strong>on</strong>g> <str<strong>on</strong>g>impact</str<strong>on</strong>g> <str<strong>on</strong>g>of</str<strong>on</strong>g> <str<strong>on</strong>g>the</str<strong>on</strong>g> HIPC II funds in <str<strong>on</strong>g>the</str<strong>on</strong>g> health and educati<strong>on</strong> sector. Table 8. HIPC II Resources Disbursed to Dept. (Nati<strong>on</strong>al Dialogue 2000), 2003, in <strong>Bolivia</strong>nos (BS.) DEPARTMENT INITIAL DISBOURSEMENTS BALANCE JANUARY- JANUARY 2003 DECEMBER 2003 NON EXECUTED BUDGET UNTIL DECEMBER 2003 (C) = (A) + (B) EXPENDITURE JANUARY-DECEMBER 2003 EXECUTION PERCENTAGE JANUARY-DECEMBER 2003 (A) (B) Salud Educación IPS Total Salud Educación IPS Total Salud Educación IPS Total TOTAL BOLIVIA 327,983,994 356,507,764 77,430,555 135,234,390 471,826,813 684,491,758 37,901,218 100,793,631 346,039,913 484,734,762 48.9 74.5 73.3 70.8 CHUQUISACA 29,091,770 31,318,454 5,276,759 8,482,433 46,651,032 60,410,224 2,274,509 6,110,626 36,753,584 45,138,719 43.1 72.0 78.8 74.7 LA PAZ 96,173,529 96,017,974 27,344,460 43,279,480 121,567,563 192,191,503 10,332,109 22,254,627 87,809,144 120,395,880 37.8 51.4 72.2 62.6 COCHABAMBA 48,541,917 53,554,202 11,850,866 20,538,407 69,706,846 102,096,119 7,728,998 18,509,688 50,133,376 76,372,062 65.2 90.1 71.9 74.8 POTOSI 56,737,719 46,173,658 7,180,303 15,350,240 80,380,834 102,911,377 3,552,585 11,211,704 47,797,294 62,561,583 49.5 73.0 59.5 60.8 ORURO 25,067,351 23,646,339 4,000,435 7,480,914 37,232,341 48,713,690 2,001,182 7,689,809 27,563,412 37,254,403 50.0 102.8 74.0 76.5 SANTA CRUZ 34,169,668 52,390,924 13,865,762 26,886,343 45,808,487 86,560,592 7,443,486 24,380,276 37,121,178 68,944,940 53.7 90.7 81.0 79.6 TARIJA 19,497,112 18,851,578 4,501,574 6,250,533 27,596,583 38,348,690 1,776,025 5,140,930 22,132,963 29,049,918 39.5 82.2 80.2 75.8 BENI 13,140,406 24,062,581 2,984,372 6,288,000 27,930,615 37,202,987 2,465,923 4,931,024 23,314,646 30,711,593 82.6 78.4 83.5 82.6 PANDO 5,564,522 10,492,054 426,024 678,040 14,952,512 16,056,576 326,401 564,947 13,414,316 14,305,664 76.6 83.3 89.7 89.1 Source: UDAPE and Unidad de Programación Fiscal Ministerio de Hacienda <strong>The</strong> tables analyzed show that municipalities are not using effectively <str<strong>on</strong>g>the</str<strong>on</strong>g> resources provided by <str<strong>on</strong>g>the</str<strong>on</strong>g> HIPC II initiative. Fur<str<strong>on</strong>g>the</str<strong>on</strong>g>rmore, it implies that balances in <str<strong>on</strong>g>the</str<strong>on</strong>g> Nati<strong>on</strong>al Dialogue Special accounts <str<strong>on</strong>g>of</str<strong>on</strong>g> most municipalities are increasing at a high rate. Moreover, up to date most <str<strong>on</strong>g>of</str<strong>on</strong>g> <str<strong>on</strong>g>the</str<strong>on</strong>g> financial resources available for health and educati<strong>on</strong> purposes are used to pay for <str<strong>on</strong>g>the</str<strong>on</strong>g> main inputs (infrastructure, equipment, supplies, etc.) and service delivery (AIS, 2003). Some <str<strong>on</strong>g>of</str<strong>on</strong>g> <str<strong>on</strong>g>the</str<strong>on</strong>g> causes <str<strong>on</strong>g>of</str<strong>on</strong>g> low executi<strong>on</strong> ratios at <str<strong>on</strong>g>the</str<strong>on</strong>g> municipal level are: a) Lack <str<strong>on</strong>g>of</str<strong>on</strong>g> capacity: <strong>The</strong> municipalities in <strong>Bolivia</strong> do not have enough financial and human resources, and in most <str<strong>on</strong>g>of</str<strong>on</strong>g> <str<strong>on</strong>g>the</str<strong>on</strong>g> cases <str<strong>on</strong>g>the</str<strong>on</strong>g>y lack appropriate instruments and knowledge to c<strong>on</strong>duct effective administrati<strong>on</strong> (UDAPE, 2003 p.57). b) High rotati<strong>on</strong> within <str<strong>on</strong>g>the</str<strong>on</strong>g> municipal administrati<strong>on</strong>s that hinders <str<strong>on</strong>g>the</str<strong>on</strong>g> c<strong>on</strong>tinuity <str<strong>on</strong>g>of</str<strong>on</strong>g> project cycles and undermines municipal capacity (UDAPE, 2003 p.57). c) In some cases, <str<strong>on</strong>g>the</str<strong>on</strong>g> Ministry <str<strong>on</strong>g>of</str<strong>on</strong>g> Finance assigns <str<strong>on</strong>g>the</str<strong>on</strong>g> funds but does not disburse <str<strong>on</strong>g>the</str<strong>on</strong>g>m until <str<strong>on</strong>g>the</str<strong>on</strong>g> end <str<strong>on</strong>g>of</str<strong>on</strong>g> <str<strong>on</strong>g>the</str<strong>on</strong>g> fiscal year (it depends <strong>on</strong> <str<strong>on</strong>g>the</str<strong>on</strong>g> <strong>Bolivia</strong>n external debt repayment dates). Mayors are not always aware <str<strong>on</strong>g>of</str<strong>on</strong>g> <str<strong>on</strong>g>the</str<strong>on</strong>g> exact date when <str<strong>on</strong>g>the</str<strong>on</strong>g> HIPC II funds will be disbursed. Thus, <str<strong>on</strong>g>the</str<strong>on</strong>g>y are not able to engage in projects that require immediate initial disbursement or plan in advance which projects <str<strong>on</strong>g>the</str<strong>on</strong>g>y will be able to undertake (Pers<strong>on</strong>al Interview UNICEF <strong>Bolivia</strong>). d) Reducti<strong>on</strong> in funds to municipalities: In 2002 <str<strong>on</strong>g>the</str<strong>on</strong>g> government <str<strong>on</strong>g>of</str<strong>on</strong>g> Sanchez de Lozada declared that part <str<strong>on</strong>g>of</str<strong>on</strong>g> <str<strong>on</strong>g>the</str<strong>on</strong>g> HIPC resources were going to be assigned to <str<strong>on</strong>g>the</str<strong>on</strong>g> Nati<strong>on</strong>al General Budget. This amount accounted for <strong>on</strong>e third <str<strong>on</strong>g>of</str<strong>on</strong>g> <str<strong>on</strong>g>the</str<strong>on</strong>g> municipalities projected allocati<strong>on</strong> (Cabero, 2005). Implementati<strong>on</strong> <str<strong>on</strong>g>of</str<strong>on</strong>g> <str<strong>on</strong>g>the</str<strong>on</strong>g> Nati<strong>on</strong>al Compensati<strong>on</strong> Policy (PNC) As described in secti<strong>on</strong> 3, <str<strong>on</strong>g>the</str<strong>on</strong>g> Nati<strong>on</strong>al Dialogue Law created <strong>The</strong> Nati<strong>on</strong>al Compensati<strong>on</strong> Policy. Its main task was to transfer internati<strong>on</strong>al d<strong>on</strong>ati<strong>on</strong>s and resources to in a more transparent and equitable manner. <strong>The</strong> implementati<strong>on</strong> <str<strong>on</strong>g>of</str<strong>on</strong>g> <str<strong>on</strong>g>the</str<strong>on</strong>g> PNC through <str<strong>on</strong>g>the</str<strong>on</strong>g> Nati<strong>on</strong>al Productive Investment Fund (FPS) has not been entirely executed (as showed in table 9) due to 22
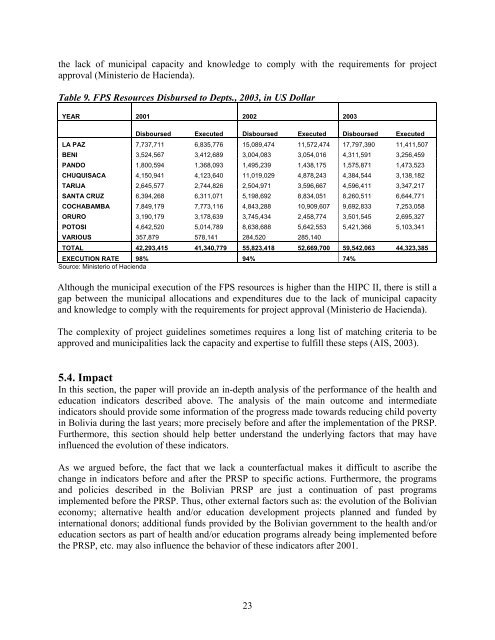
<str<strong>on</strong>g>the</str<strong>on</strong>g> lack <str<strong>on</strong>g>of</str<strong>on</strong>g> municipal capacity and knowledge to comply with <str<strong>on</strong>g>the</str<strong>on</strong>g> requirements for project approval (Ministerio de Hacienda). Table 9. FPS Resources Disbursed to Depts., 2003, in US Dollar YEAR 2001 2002 2003 Disboursed Executed Disboursed Executed Disboursed Executed LA PAZ 7,737,711 6,835,776 15,089,474 11,572,474 17,797,390 11,411,507 BENI 3,524,567 3,412,689 3,004,083 3,054,016 4,311,591 3,256,459 PANDO 1,800,594 1,368,093 1,495,239 1,438,175 1,575,871 1,473,523 CHUQUISACA 4,150,941 4,123,640 11,019,029 4,878,243 4,384,544 3,138,182 TARIJA 2,645,577 2,744,826 2,504,971 3,596,667 4,596,411 3,347,217 SANTA CRUZ 6,394,268 6,311,071 5,198,692 8,834,051 8,260,511 6,644,771 COCHABAMBA 7,849,179 7,773,116 4,843,288 10,909,607 9,692,833 7,253,058 ORURO 3,190,179 3,178,639 3,745,434 2,458,774 3,501,545 2,695,327 POTOSI 4,642,520 5,014,789 8,638,688 5,642,553 5,421,366 5,103,341 VARIOUS 357,879 578,141 284,520 285,140 TOTAL 42,293,415 41,340,779 55,823,418 52,669,700 59,542,063 44,323,385 EXECUTION RATE 98% 94% 74% Source: Ministerio <str<strong>on</strong>g>of</str<strong>on</strong>g> Hacienda Although <str<strong>on</strong>g>the</str<strong>on</strong>g> municipal executi<strong>on</strong> <str<strong>on</strong>g>of</str<strong>on</strong>g> <str<strong>on</strong>g>the</str<strong>on</strong>g> FPS resources is higher than <str<strong>on</strong>g>the</str<strong>on</strong>g> HIPC II, <str<strong>on</strong>g>the</str<strong>on</strong>g>re is still a gap between <str<strong>on</strong>g>the</str<strong>on</strong>g> municipal allocati<strong>on</strong>s and expenditures due to <str<strong>on</strong>g>the</str<strong>on</strong>g> lack <str<strong>on</strong>g>of</str<strong>on</strong>g> municipal capacity and knowledge to comply with <str<strong>on</strong>g>the</str<strong>on</strong>g> requirements for project approval (Ministerio de Hacienda). <strong>The</strong> complexity <str<strong>on</strong>g>of</str<strong>on</strong>g> project guidelines sometimes requires a l<strong>on</strong>g list <str<strong>on</strong>g>of</str<strong>on</strong>g> matching criteria to be approved and municipalities lack <str<strong>on</strong>g>the</str<strong>on</strong>g> capacity and expertise to fulfill <str<strong>on</strong>g>the</str<strong>on</strong>g>se steps (AIS, 2003). 5.4. Impact In this secti<strong>on</strong>, <str<strong>on</strong>g>the</str<strong>on</strong>g> paper will provide an in-depth analysis <str<strong>on</strong>g>of</str<strong>on</strong>g> <str<strong>on</strong>g>the</str<strong>on</strong>g> performance <str<strong>on</strong>g>of</str<strong>on</strong>g> <str<strong>on</strong>g>the</str<strong>on</strong>g> health and educati<strong>on</strong> indicators described above. <strong>The</strong> analysis <str<strong>on</strong>g>of</str<strong>on</strong>g> <str<strong>on</strong>g>the</str<strong>on</strong>g> main outcome and intermediate indicators should provide some informati<strong>on</strong> <str<strong>on</strong>g>of</str<strong>on</strong>g> <str<strong>on</strong>g>the</str<strong>on</strong>g> progress made towards reducing child poverty in <strong>Bolivia</strong> during <str<strong>on</strong>g>the</str<strong>on</strong>g> last years; more precisely before and after <str<strong>on</strong>g>the</str<strong>on</strong>g> implementati<strong>on</strong> <str<strong>on</strong>g>of</str<strong>on</strong>g> <str<strong>on</strong>g>the</str<strong>on</strong>g> PRSP. Fur<str<strong>on</strong>g>the</str<strong>on</strong>g>rmore, this secti<strong>on</strong> should help better understand <str<strong>on</strong>g>the</str<strong>on</strong>g> underlying factors that may have influenced <str<strong>on</strong>g>the</str<strong>on</strong>g> evoluti<strong>on</strong> <str<strong>on</strong>g>of</str<strong>on</strong>g> <str<strong>on</strong>g>the</str<strong>on</strong>g>se indicators. As we argued before, <str<strong>on</strong>g>the</str<strong>on</strong>g> fact that we lack a counterfactual makes it difficult to ascribe <str<strong>on</strong>g>the</str<strong>on</strong>g> change in indicators before and after <str<strong>on</strong>g>the</str<strong>on</strong>g> PRSP to specific acti<strong>on</strong>s. Fur<str<strong>on</strong>g>the</str<strong>on</strong>g>rmore, <str<strong>on</strong>g>the</str<strong>on</strong>g> programs and policies described in <str<strong>on</strong>g>the</str<strong>on</strong>g> <strong>Bolivia</strong>n PRSP are just a c<strong>on</strong>tinuati<strong>on</strong> <str<strong>on</strong>g>of</str<strong>on</strong>g> past programs implemented before <str<strong>on</strong>g>the</str<strong>on</strong>g> PRSP. Thus, o<str<strong>on</strong>g>the</str<strong>on</strong>g>r external factors such as: <str<strong>on</strong>g>the</str<strong>on</strong>g> evoluti<strong>on</strong> <str<strong>on</strong>g>of</str<strong>on</strong>g> <str<strong>on</strong>g>the</str<strong>on</strong>g> <strong>Bolivia</strong>n ec<strong>on</strong>omy; alternative health and/or educati<strong>on</strong> development projects planned and funded by internati<strong>on</strong>al d<strong>on</strong>ors; additi<strong>on</strong>al funds provided by <str<strong>on</strong>g>the</str<strong>on</strong>g> <strong>Bolivia</strong>n government to <str<strong>on</strong>g>the</str<strong>on</strong>g> health and/or educati<strong>on</strong> sectors as part <str<strong>on</strong>g>of</str<strong>on</strong>g> health and/or educati<strong>on</strong> programs already being implemented before <str<strong>on</strong>g>the</str<strong>on</strong>g> PRSP, etc. may also influence <str<strong>on</strong>g>the</str<strong>on</strong>g> behavior <str<strong>on</strong>g>of</str<strong>on</strong>g> <str<strong>on</strong>g>the</str<strong>on</strong>g>se indicators after 2001. 23