Assessing the impact of PRSPs on Child Poverty: The Case of Bolivia
Assessing the impact of PRSPs on Child Poverty: The Case of Bolivia
Assessing the impact of PRSPs on Child Poverty: The Case of Bolivia

Create successful ePaper yourself
Turn your PDF publications into a flip-book with our unique Google optimized e-Paper software.
Never<str<strong>on</strong>g>the</str<strong>on</strong>g>less, <str<strong>on</strong>g>the</str<strong>on</strong>g> <strong>Bolivia</strong>n PRSP did involve a reallocati<strong>on</strong> <str<strong>on</strong>g>of</str<strong>on</strong>g> funding under <str<strong>on</strong>g>the</str<strong>on</strong>g> HIPC II<br />
initiative. <strong>The</strong> additi<strong>on</strong>al funds available to municipalities to invest in social spending (health,<br />
educati<strong>on</strong> and productive and social infrastructure) could have had a significant <str<strong>on</strong>g>impact</str<strong>on</strong>g> <strong>on</strong> <str<strong>on</strong>g>the</str<strong>on</strong>g><br />
performance <str<strong>on</strong>g>of</str<strong>on</strong>g> health and educati<strong>on</strong> indicators.<br />
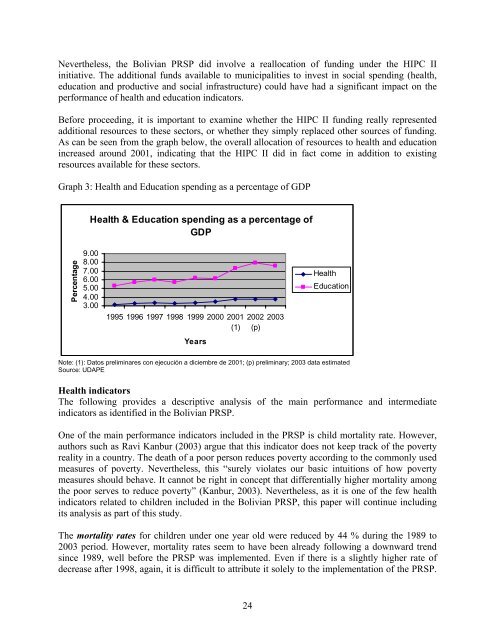
Before proceeding, it is important to examine whe<str<strong>on</strong>g>the</str<strong>on</strong>g>r <str<strong>on</strong>g>the</str<strong>on</strong>g> HIPC II funding really represented<br />
additi<strong>on</strong>al resources to <str<strong>on</strong>g>the</str<strong>on</strong>g>se sectors, or whe<str<strong>on</strong>g>the</str<strong>on</strong>g>r <str<strong>on</strong>g>the</str<strong>on</strong>g>y simply replaced o<str<strong>on</strong>g>the</str<strong>on</strong>g>r sources <str<strong>on</strong>g>of</str<strong>on</strong>g> funding.<br />
As can be seen from <str<strong>on</strong>g>the</str<strong>on</strong>g> graph below, <str<strong>on</strong>g>the</str<strong>on</strong>g> overall allocati<strong>on</strong> <str<strong>on</strong>g>of</str<strong>on</strong>g> resources to health and educati<strong>on</strong><br />
increased around 2001, indicating that <str<strong>on</strong>g>the</str<strong>on</strong>g> HIPC II did in fact come in additi<strong>on</strong> to existing<br />
resources available for <str<strong>on</strong>g>the</str<strong>on</strong>g>se sectors.<br />
Graph 3: Health and Educati<strong>on</strong> spending as a percentage <str<strong>on</strong>g>of</str<strong>on</strong>g> GDP<br />
Percentage<br />
Health & Educati<strong>on</strong> spending as a percentage <str<strong>on</strong>g>of</str<strong>on</strong>g><br />
GDP<br />
9.00<br />
8.00<br />
7.00<br />
6.00<br />
5.00<br />
4.00<br />
3.00<br />
1995 1996 1997 1998 1999 2000 2001<br />
(1)<br />
Years<br />
2002<br />
(p)<br />
24<br />
2003<br />
Health<br />
Educati<strong>on</strong><br />
Note: (1): Datos preliminares c<strong>on</strong> ejecución a diciembre de 2001; (p) preliminary; 2003 data estimated<br />
Source: UDAPE<br />
Health indicators<br />
<strong>The</strong> following provides a descriptive analysis <str<strong>on</strong>g>of</str<strong>on</strong>g> <str<strong>on</strong>g>the</str<strong>on</strong>g> main performance and intermediate<br />
indicators as identified in <str<strong>on</strong>g>the</str<strong>on</strong>g> <strong>Bolivia</strong>n PRSP.<br />
One <str<strong>on</strong>g>of</str<strong>on</strong>g> <str<strong>on</strong>g>the</str<strong>on</strong>g> main performance indicators included in <str<strong>on</strong>g>the</str<strong>on</strong>g> PRSP is child mortality rate. However,<br />
authors such as Ravi Kanbur (2003) argue that this indicator does not keep track <str<strong>on</strong>g>of</str<strong>on</strong>g> <str<strong>on</strong>g>the</str<strong>on</strong>g> poverty<br />
reality in a country. <strong>The</strong> death <str<strong>on</strong>g>of</str<strong>on</strong>g> a poor pers<strong>on</strong> reduces poverty according to <str<strong>on</strong>g>the</str<strong>on</strong>g> comm<strong>on</strong>ly used<br />
measures <str<strong>on</strong>g>of</str<strong>on</strong>g> poverty. Never<str<strong>on</strong>g>the</str<strong>on</strong>g>less, this “surely violates our basic intuiti<strong>on</strong>s <str<strong>on</strong>g>of</str<strong>on</strong>g> how poverty<br />
measures should behave. It cannot be right in c<strong>on</strong>cept that differentially higher mortality am<strong>on</strong>g<br />
<str<strong>on</strong>g>the</str<strong>on</strong>g> poor serves to reduce poverty” (Kanbur, 2003). Never<str<strong>on</strong>g>the</str<strong>on</strong>g>less, as it is <strong>on</strong>e <str<strong>on</strong>g>of</str<strong>on</strong>g> <str<strong>on</strong>g>the</str<strong>on</strong>g> few health<br />
indicators related to children included in <str<strong>on</strong>g>the</str<strong>on</strong>g> <strong>Bolivia</strong>n PRSP, this paper will c<strong>on</strong>tinue including<br />
its analysis as part <str<strong>on</strong>g>of</str<strong>on</strong>g> this study.<br />
<strong>The</strong> mortality rates for children under <strong>on</strong>e year old were reduced by 44 % during <str<strong>on</strong>g>the</str<strong>on</strong>g> 1989 to<br />
2003 period. However, mortality rates seem to have been already following a downward trend<br />
since 1989, well before <str<strong>on</strong>g>the</str<strong>on</strong>g> PRSP was implemented. Even if <str<strong>on</strong>g>the</str<strong>on</strong>g>re is a slightly higher rate <str<strong>on</strong>g>of</str<strong>on</strong>g><br />
decrease after 1998, again, it is difficult to attribute it solely to <str<strong>on</strong>g>the</str<strong>on</strong>g> implementati<strong>on</strong> <str<strong>on</strong>g>of</str<strong>on</strong>g> <str<strong>on</strong>g>the</str<strong>on</strong>g> PRSP.