Enhancing Learning With a Graphics Calculator - CasioEd
Enhancing Learning With a Graphics Calculator - CasioEd
Enhancing Learning With a Graphics Calculator - CasioEd

You also want an ePaper? Increase the reach of your titles
YUMPU automatically turns print PDFs into web optimized ePapers that Google loves.
Creating histograms<br />
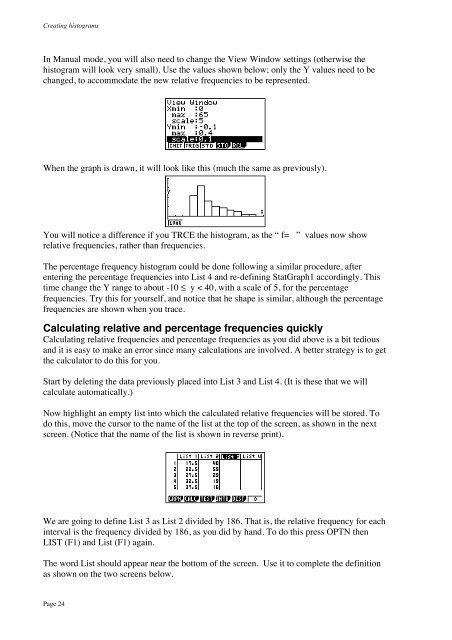
In Manual mode, you will also need to change the View Window settings (otherwise the<br />
histogram will look very small). Use the values shown below; only the Y values need to be<br />
changed, to accommodate the new relative frequencies to be represented.<br />
When the graph is drawn, it will look like this (much the same as previously).<br />
You will notice a difference if you TRCE the histogram, as the “ f= ” values now show<br />
relative frequencies, rather than frequencies.<br />
The percentage frequency histogram could be done following a similar procedure, after<br />
entering the percentage frequencies into List 4 and re-defining StatGraph1 accordingly. This<br />
time change the Y range to about -10 ≤ y < 40, with a scale of 5, for the percentage<br />
frequencies. Try this for yourself, and notice that he shape is similar, although the percentage<br />
frequencies are shown when you trace.<br />
Calculating relative and percentage frequencies quickly<br />
Calculating relative frequencies and percentage frequencies as you did above is a bit tedious<br />
and it is easy to make an error since many calculations are involved. A better strategy is to get<br />
the calculator to do this for you.<br />
Start by deleting the data previously placed into List 3 and List 4. (It is these that we will<br />
calculate automatically.)<br />
Now highlight an empty list into which the calculated relative frequencies will be stored. To<br />
do this, move the cursor to the name of the list at the top of the screen, as shown in the next<br />
screen. (Notice that the name of the list is shown in reverse print).<br />
We are going to define List 3 as List 2 divided by 186. That is, the relative frequency for each<br />
interval is the frequency divided by 186, as you did by hand. To do this press OPTN then<br />
LIST (F1) and List (F1) again.<br />
The word List should appear near the bottom of the screen. Use it to complete the definition<br />
as shown on the two screens below.<br />
Page 24