Enhancing Learning With a Graphics Calculator - CasioEd
Enhancing Learning With a Graphics Calculator - CasioEd
Enhancing Learning With a Graphics Calculator - CasioEd

Create successful ePaper yourself
Turn your PDF publications into a flip-book with our unique Google optimized e-Paper software.
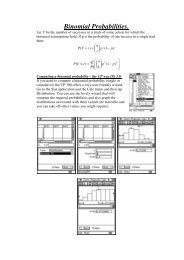
<strong>Enhancing</strong> learning with a graphics calculator<br />
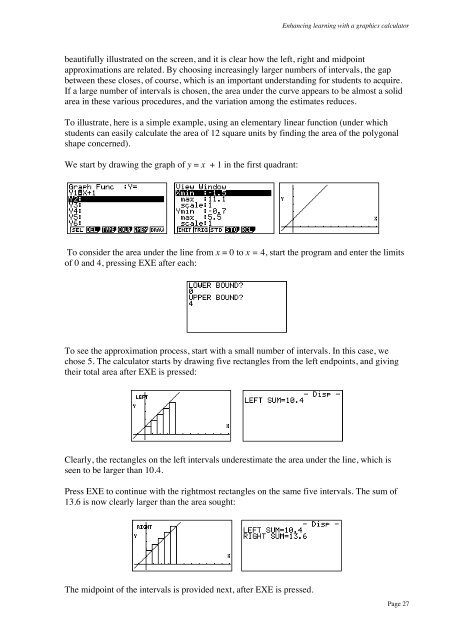
beautifully illustrated on the screen, and it is clear how the left, right and midpoint<br />
approximations are related. By choosing increasingly larger numbers of intervals, the gap<br />
between these closes, of course, which is an important understanding for students to acquire.<br />
If a large number of intervals is chosen, the area under the curve appears to be almost a solid<br />
area in these various procedures, and the variation among the estimates reduces.<br />
To illustrate, here is a simple example, using an elementary linear function (under which<br />
students can easily calculate the area of 12 square units by finding the area of the polygonal<br />
shape concerned).<br />
We start by drawing the graph of y = x + 1 in the first quadrant:<br />
To consider the area under the line from x = 0 to x = 4, start the program and enter the limits<br />
of 0 and 4, pressing EXE after each:<br />
To see the approximation process, start with a small number of intervals. In this case, we<br />
chose 5. The calculator starts by drawing five rectangles from the left endpoints, and giving<br />
their total area after EXE is pressed:<br />
Clearly, the rectangles on the left intervals underestimate the area under the line, which is<br />
seen to be larger than 10.4.<br />
Press EXE to continue with the rightmost rectangles on the same five intervals. The sum of<br />
13.6 is now clearly larger than the area sought:<br />
The midpoint of the intervals is provided next, after EXE is pressed.<br />
Page 27