CHAPTER 3 Consumer Preferences and Choice
CHAPTER 3 Consumer Preferences and Choice
CHAPTER 3 Consumer Preferences and Choice

Create successful ePaper yourself
Turn your PDF publications into a flip-book with our unique Google optimized e-Paper software.
03-Salvatore-Chap03.qxd 08-08-2008 12:41 PM Page 59<br />
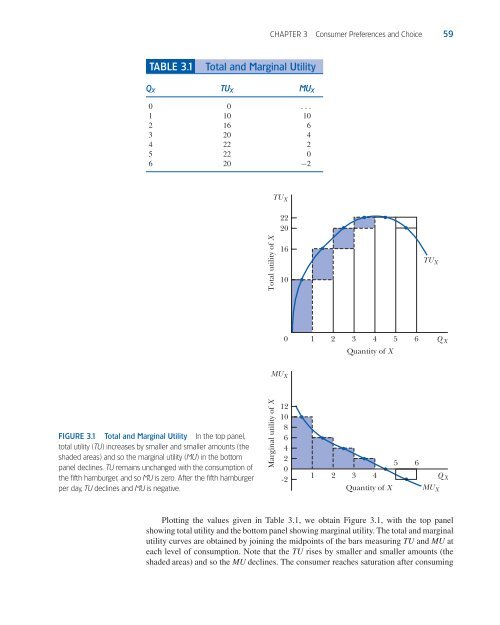
TABLE 3.1<br />
Total <strong>and</strong> Marginal Utility<br />
QX TUX MUX<br />
0 0 ...<br />
1 10 10<br />
2 16 6<br />
3 20 4<br />
4 22 2<br />
5 22 0<br />
6 20 −2<br />
FIGURE 3.1 Total <strong>and</strong> Marginal Utility In the top panel,<br />
total utility (TU) increases by smaller <strong>and</strong> smaller amounts (the<br />
shaded areas) <strong>and</strong> so the marginal utility (MU) in the bottom<br />
panel declines. TU remains unchanged with the consumption of<br />
the fifth hamburger, <strong>and</strong> so MU is zero. After the fifth hamburger<br />
per day, TU declines <strong>and</strong> MU is negative.<br />
<strong>CHAPTER</strong> 3 <strong>Consumer</strong> <strong>Preferences</strong> <strong>and</strong> <strong>Choice</strong> 59<br />
22<br />
20<br />
16<br />
10<br />
Total utility of X TUX<br />
0<br />
12<br />
10<br />
8<br />
6<br />
4<br />
2<br />
0<br />
-2<br />
Marginal utility of X MUX<br />
1 2 3 4 5 6 Q X<br />
Quantity of X<br />
Plotting the values given in Table 3.1, we obtain Figure 3.1, with the top panel<br />
showing total utility <strong>and</strong> the bottom panel showing marginal utility. The total <strong>and</strong> marginal<br />
utility curves are obtained by joining the midpoints of the bars measuring TU <strong>and</strong> MU at<br />
each level of consumption. Note that the TU rises by smaller <strong>and</strong> smaller amounts (the<br />
shaded areas) <strong>and</strong> so the MU declines. The consumer reaches saturation after consuming<br />
TU X<br />
5 6<br />
1 2 3 4<br />
Q X<br />
Quantity of X MUX