Landslides and Avalanches
Landslides and Avalanches
Landslides and Avalanches

You also want an ePaper? Increase the reach of your titles
YUMPU automatically turns print PDFs into web optimized ePapers that Google loves.
118 II. Introduction to Cculogic Hazards<br />
Gardiner, Montana<br />
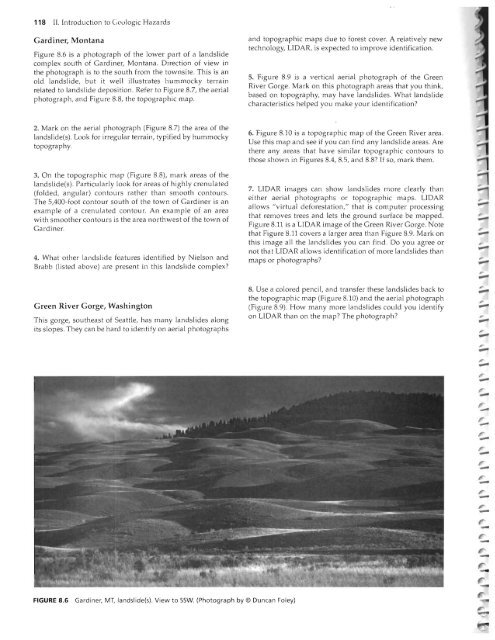
Figu re 8.6 is a photograph of the lower part of a l<strong>and</strong>slide<br />
complex south of Gardiner, Montana. Direction of view in<br />
the photograph is to the south from the townsite. This is an<br />
old l<strong>and</strong>slide, but it well illustrates hummocky terrain<br />
related to l<strong>and</strong>slide deposition. Refer to Figure 8.7, the aerial<br />
photograph, <strong>and</strong> Fig ure 8.8, the topographic map.<br />
2. Mark on the aerial photograph (Figure 8.7) the area of the<br />
l<strong>and</strong>slide(s). Look for irregular terrain, typified by hummocky<br />
topography.<br />
3. On the topographic map (Figure 8.8), mark areas of the<br />
l<strong>and</strong>slide(s). Particularly look for areas of highly crenulated<br />
(folded, angular) contours rather than smooth contours.<br />
The S,400-foot contour south of the town of Gardiner is an<br />
example of a crenulated contour. An example of an area<br />
with smoother contours is the area northwest of the town of<br />
Gardiner.<br />
4. What other l<strong>and</strong>slide features identified by Nielson <strong>and</strong><br />
Brabb (listed above) are present in this l<strong>and</strong>slide complex?<br />
Green River Gorge, Washington<br />
This gorge, southeast of Seattle, has many l<strong>and</strong>slides along<br />
its slopes. They can be hard to identify on aerial photographs<br />
FIGURE 8 .6 Gardiner, MT. l<strong>and</strong>slide(s). View to ssw. (Photograph by © Duncan Foley)<br />
<strong>and</strong> topographic maps due to forest cover. A relatively new<br />
technology, UDAR, is expected to improve identification.<br />
5. Figure 8.9 is a vertical aerial photograph of the Green<br />
River Gorge. Mark on this photograph areas that you think,<br />
based on topography, may have l<strong>and</strong>slides. What l<strong>and</strong>slide<br />
characteristics helped you make your identification?<br />
6. Figure 8.10 is a topographic map of the Green River area.<br />
Use this map <strong>and</strong> see if you can find any l<strong>and</strong>slide areas. Are<br />
there any areas that have similar topographic contours to<br />
those shown in Figures 8.4, 8.5, <strong>and</strong> 8.8? If so, mark them.<br />
7. UDAR images can show l<strong>and</strong>slides more clearly than<br />
either aerial photographs or topographic maps. UDAR<br />
allows "virtual deforestation," that is computer processing<br />
that removes trees <strong>and</strong> lets the ground surface be mapped.<br />
Figure 8.11 is a UDAR image of the Green River Gorge. Note<br />
that Figure 8.11 covers a larger area than Figure 8.9. Mark on<br />
this image all the l<strong>and</strong>slides you can find. Do you agree or<br />
not that UDAR allows identification of more l<strong>and</strong>slides than<br />
maps or photographs?<br />
8. Use a colored pencil, <strong>and</strong> transfer these l<strong>and</strong>slides back to<br />
the topographic map (Figure 8.10) <strong>and</strong> the aeria l photograph<br />
(Figure 8.9). How many more l<strong>and</strong>slides could you identify<br />
on UDAR than on the map? The photograph?<br />
,.-<br />
".. ..<br />
r-<br />
,. -r- r<br />
,..<br />
-r -r