Landslides and Avalanches
Landslides and Avalanches
Landslides and Avalanches

You also want an ePaper? Increase the reach of your titles
YUMPU automatically turns print PDFs into web optimized ePapers that Google loves.
INTRODUCTION<br />
EXERCISE 8<br />
<strong>L<strong>and</strong>slides</strong> <strong>and</strong> <strong>Avalanches</strong><br />
Downslope movement, or mass movement, of earth<br />
materials is taking place continuously at rates that vary<br />
from the very slow creep of soil <strong>and</strong> rock to extremely<br />
rapid rockfalls <strong>and</strong> avalanches. The movement may<br />
involve only a few cubic yards or as much as 5 cubic<br />
miles of widely differing consolidated <strong>and</strong> unconsolidated<br />
materials. The primary purpose of this exercise<br />
is to underst<strong>and</strong> the nature of mass wasting <strong>and</strong> some<br />
of the ways in which it impacts the human colony. We<br />
will investigate the types <strong>and</strong> causes (including human<br />
activity) of mass wasting <strong>and</strong> options for damage<br />
reduction with examples of l<strong>and</strong>slides from California,<br />
Montana, Ohio, <strong>and</strong> Washington <strong>and</strong> snow avalanches<br />
from Colorado <strong>and</strong> Utah. Snow avalanches are a major<br />
winter hazard in mountainous terrain throughout the<br />
world. More people than just skiers, snowmobilers,<br />
<strong>and</strong> owners of mountain cabins or homes are at risk .<br />
Because many avalanche paths cross highways or<br />
railroads, snowslides may impact travelers as well.<br />
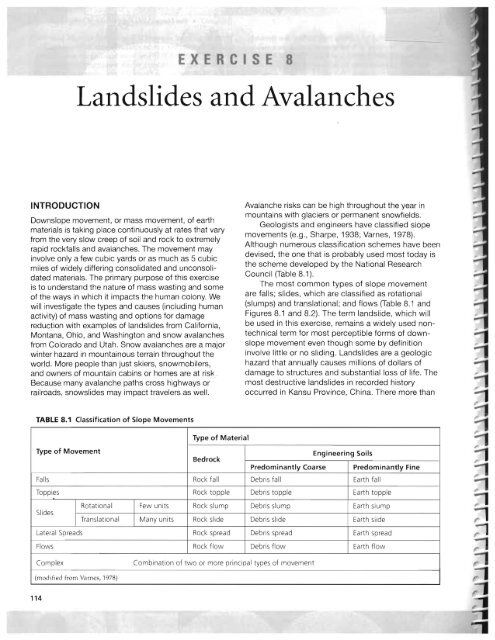
TABLE 8.1 Classification of Slope Movements<br />
Type of Movement<br />
Type of Material<br />
Bedrock<br />
Avalanche risks can be high throughout the year in<br />
mountains with glaciers or permanent snowfields.<br />
Geologists <strong>and</strong> engineers have classified slope<br />
movements (e.g., Sharpe, 1938; Varnes, 1978).<br />
Although numerous classification schemes have been<br />
devised, the one that is probably used most today is<br />
the scheme developed by the National Research<br />
Council (Table 8.1).<br />
The most common types of slope movement<br />
are falls; slides, which are classified as rotational<br />
(slumps) <strong>and</strong> translational; <strong>and</strong> flows (Table 8.1 <strong>and</strong><br />
Figures 8.1 <strong>and</strong> 8.2). The term l<strong>and</strong>slide, which will<br />
be used in this exercise, remains a widely used nontechnical<br />
term for most perceptible forms of downslope<br />
movement even though some by definition<br />
involve little or no sliding. <strong>L<strong>and</strong>slides</strong> are a geologic<br />
hazard that annually causes millions of dollars of<br />
damage to structures <strong>and</strong> substantial loss of life. The<br />
most destructive l<strong>and</strong>slides in recorded history<br />
occurred in Kansu Province, China. There more than<br />
Engineering Soils<br />
Predominantly Coarse Predominantly Fine<br />
Falls Rock fall Deb ris fall Earth fall<br />
Topples Rock topple Debris topple Earth topple<br />
Slides<br />
Rotational Few units Rock slump Debris slump Earth slump<br />
Translational Many units Rock slide Debris slide Earth sl ide<br />
Lateral Sp reads Rock spread Debris spread Earth sp read<br />
Flows Rock flow Debris fl ow Earth flow<br />
Complex Combination of two or more principal types of movement<br />
(mod i fied from Va rnes, 1978)<br />
114
116 II. Introduction to Geologic Hazards<br />
2. Structural properties of earth materials. The orientation<br />
of layering of some rocks <strong>and</strong> sediments<br />
relative to slope directions, as well as the extent of<br />
fracturing of the materials, will affect l<strong>and</strong>slide<br />
potential.<br />
3. Steepness of slopes. <strong>L<strong>and</strong>slides</strong> are more common<br />
on steeper slopes.<br />
4. Water. <strong>L<strong>and</strong>slides</strong> are generally more frequent in<br />
areas of seasonally high rainfall because the addition<br />
of water to earth materials commonly decreases their<br />
resistance to sliding by decreasing internal friction<br />
between particles (such as soil or s<strong>and</strong> grains) <strong>and</strong> by<br />
decreasing the cohesive forces that bind clay minerals<br />
together. Water also lubricates surfaces along<br />
which failure may occur; adds weight to the material;<br />
reacts with some clay minerals, causing volume<br />
changes in the material; <strong>and</strong> mixes with fine-grained<br />
unconsolidated materials to produce wet, unstable<br />
slurries.<br />
5. Ground shaking. Strong shaking, for example during<br />
earthquakes, can jar <strong>and</strong> loosen earth materials<br />
making them less stable.<br />
6. Type of vegetation present. Trees with deep, penetrating<br />
roots tend to hold bedrock <strong>and</strong> surficial deposits<br />
together, thereby increasing ground stability. Removing<br />
such trees can increase the likelihood of l<strong>and</strong>slides.<br />
Trees add weight, however, <strong>and</strong> roots can break up rock.<br />
7. Proximity to areas undergoing active erosion. Rapid<br />
undercutting <strong>and</strong> downcutting along stream courses<br />
<strong>and</strong> shorelines makes the resu lting slopes particularly<br />
susceptible to l<strong>and</strong>sliding . (Nilsen & Brabb, 1972)<br />
The parts of a l<strong>and</strong>slide are shown in Figure 8.3.<br />
The key nomenclature follows (from Nilsen <strong>and</strong> Brabb,<br />
1972):<br />
PART A. RECOGNIZING LANDSLIDES<br />
ON TOPOGRAPHIC MAPS, AERIAL<br />
PHOTOGRAPHS, AND lIDAR IMAGES<br />
According to Nilson <strong>and</strong> Brabb (1972), l<strong>and</strong>slide<br />
deposits are commonly characterized by one or more<br />
of the following features:<br />
1. Smail, isola ted ponds, lakes, or other closed depressions<br />
2. Abundant na tural springs<br />
Main scarp The steep surface between the slide <strong>and</strong> the undisturbed ground . Th e projection of the scarp<br />
surface under the slide material is the ru pture surface .<br />
Minor scarp A steep surface on the displaced material produced by differential movements within the slide mass.<br />
Head The upper pa rt of the slide ma terial along the contact between the displaced material <strong>and</strong> the main<br />
sca rp.<br />
Crown The materia l that is still in place, undisturbed, adjacent to the highest pa rts of the main sca rp.<br />
Toe The margin of displaced material most distant from the main scarp.<br />
FIGURE 8.3 Parts of a complex (slump-earth flow) l<strong>and</strong>slide (Nilsen <strong>and</strong> Brabb, 1972).
-<br />
-- --.,.<br />
-- ...<br />
--<br />
-- --<br />
--- La<br />
--<br />
--<br />
--<br />
--<br />
--<br />
Exercise 8 • <strong>L<strong>and</strong>slides</strong> <strong>and</strong> <strong>Avalanches</strong> 117<br />
FIGURE 8.4 On an oblique photograph, contours on the upper, scarp, area of a l<strong>and</strong>slide bend into the hill, <strong>and</strong> contours on the lower,<br />
hummocky, area of the l<strong>and</strong>slide bend out from the hill. See Figure 8.3 for the parts of this l<strong>and</strong>slide. Photograph courtesy of http://www<br />
.geog. ucsb.edu/ - jeff/projects/la_conch ita/1995/95_sl ideshots.html<br />
3. Abrupt <strong>and</strong> irregular changes in slope <strong>and</strong> drainage<br />
... pattern<br />
--... 4. Hummocky irregular surfaces<br />
5. Smaller l<strong>and</strong>slide deposits that are commonly younger<br />
<strong>and</strong> form within older <strong>and</strong> larger l<strong>and</strong>slide deposits (ill<br />
... other words, if an area has slid ill the past, it is subject to<br />
both small <strong>and</strong> large renewed slides)<br />
6. Steep, arcuate scarps at the upper edge<br />
7. Irregular soil <strong>and</strong> vegetation patterns<br />
-<br />
8. Disturbed vegetation<br />
9. Abundant flat areas<br />
QUESTIONS (8, PART A)<br />
Conchita, California<br />
Figure 8.4'shows a l<strong>and</strong>slide that occurred in 1995 above<br />
the small town of La Conchita, California. This l<strong>and</strong>slide<br />
reactivated in the wet winter of 2005, with disastrous consequences.<br />
Note the shape of contours as they cross the l<strong>and</strong>slide.<br />
Figure 8.5 shows a vertical aerial photograph of the<br />
same site, <strong>and</strong> note how contours appear on this photograph.<br />
1. a. Can you recognize the shape of contours that may indicate<br />
a l<strong>and</strong>slide? Check with your Teaching instructor before going<br />
on to the next question.<br />
b.ln Figure 8.4 <strong>and</strong> 8.5, were any homes damaged? Explain.<br />
FIGURE 8.5 Contours that cross l<strong>and</strong>slides, as shown on vertical<br />
photos, bend to follow concave part of slope in the upper scarp area<br />
of the slide. Contours in the lower part of a l<strong>and</strong>slide will be convex<br />
<strong>and</strong> irregular over hummocky terrain. La Conchita, California,<br />
1995; Same site as in Figure 8.4. Photograph courtesy of Pacific<br />
Aerial Surveys, http://www.geog.ucsb.edu/- jeff/projects/<br />
la_conch ita/1995/95_sl ideshots.html
118 II. Introduction to Cculogic Hazards<br />
Gardiner, Montana<br />
Figu re 8.6 is a photograph of the lower part of a l<strong>and</strong>slide<br />
complex south of Gardiner, Montana. Direction of view in<br />
the photograph is to the south from the townsite. This is an<br />
old l<strong>and</strong>slide, but it well illustrates hummocky terrain<br />
related to l<strong>and</strong>slide deposition. Refer to Figure 8.7, the aerial<br />
photograph, <strong>and</strong> Fig ure 8.8, the topographic map.<br />
2. Mark on the aerial photograph (Figure 8.7) the area of the<br />
l<strong>and</strong>slide(s). Look for irregular terrain, typified by hummocky<br />
topography.<br />
3. On the topographic map (Figure 8.8), mark areas of the<br />
l<strong>and</strong>slide(s). Particularly look for areas of highly crenulated<br />
(folded, angular) contours rather than smooth contours.<br />
The S,400-foot contour south of the town of Gardiner is an<br />
example of a crenulated contour. An example of an area<br />
with smoother contours is the area northwest of the town of<br />
Gardiner.<br />
4. What other l<strong>and</strong>slide features identified by Nielson <strong>and</strong><br />
Brabb (listed above) are present in this l<strong>and</strong>slide complex?<br />
Green River Gorge, Washington<br />
This gorge, southeast of Seattle, has many l<strong>and</strong>slides along<br />
its slopes. They can be hard to identify on aerial photographs<br />
FIGURE 8 .6 Gardiner, MT. l<strong>and</strong>slide(s). View to ssw. (Photograph by © Duncan Foley)<br />
<strong>and</strong> topographic maps due to forest cover. A relatively new<br />
technology, UDAR, is expected to improve identification.<br />
5. Figure 8.9 is a vertical aerial photograph of the Green<br />
River Gorge. Mark on this photograph areas that you think,<br />
based on topography, may have l<strong>and</strong>slides. What l<strong>and</strong>slide<br />
characteristics helped you make your identification?<br />
6. Figure 8.10 is a topographic map of the Green River area.<br />
Use this map <strong>and</strong> see if you can find any l<strong>and</strong>slide areas. Are<br />
there any areas that have similar topographic contours to<br />
those shown in Figures 8.4, 8.5, <strong>and</strong> 8.8? If so, mark them.<br />
7. UDAR images can show l<strong>and</strong>slides more clearly than<br />
either aerial photographs or topographic maps. UDAR<br />
allows "virtual deforestation," that is computer processing<br />
that removes trees <strong>and</strong> lets the ground surface be mapped.<br />
Figure 8.11 is a UDAR image of the Green River Gorge. Note<br />
that Figure 8.11 covers a larger area than Figure 8.9. Mark on<br />
this image all the l<strong>and</strong>slides you can find. Do you agree or<br />
not that UDAR allows identification of more l<strong>and</strong>slides than<br />
maps or photographs?<br />
8. Use a colored pencil, <strong>and</strong> transfer these l<strong>and</strong>slides back to<br />
the topographic map (Figure 8.10) <strong>and</strong> the aeria l photograph<br />
(Figure 8.9). How many more l<strong>and</strong>slides could you identify<br />
on UDAR than on the map? The photograph?<br />
,.-<br />
".. ..<br />
r-<br />
,. -r- r<br />
,..<br />
-r -r
120 n. Introduction to Geologic Hazards<br />
FIGURE 8.8 Gardiner, MT. Topographic map. Contour Interval = 40 ft. See Figure 8.7.
122 II. Introduction to Geologic Hazards<br />
FIGURE 8.11 Green River Gorge Lidar Image. (Courtesy of King County, Washington, GIS Center)<br />
PART B. LANDSLIDES IN SAN JOSE.<br />
CALIFORNIA<br />
L<strong>and</strong>slide deposits in the northeastern part of the city of<br />
San Jose were first shown on a geologic map done by<br />
Crittenden (1951). A subsequent map, based on interpretation<br />
of aerial photographs <strong>and</strong> field investigations,<br />
included many additional l<strong>and</strong>slide deposits that are<br />
shown as lighter areas with arrows (Figure 8.12, Nilsen<br />
<strong>and</strong> Brabb, 1972). Damage to urban structures vvithin<br />
part of the l<strong>and</strong>slide-prone area is shown in Figure 8.14.<br />
The l<strong>and</strong>slides, which may be continuously or intermittently<br />
moving, or not moving at all, are primarily the<br />
result of natural processes. Human activities may alter<br />
these processes <strong>and</strong> even render some areas unstable. In<br />
order to determine the stability of a particular site, a<br />
l<strong>and</strong>slide deposit map, such as Figure 8.12, would be<br />
used in conjunction with other information concerning<br />
soils, vegetation, hydrology, <strong>and</strong> other geologic factors.<br />
In general, fewer of these characteristics will be<br />
noted in smaller deposits. Detailed site studies, of<br />
course, are required for predicting the behavior of<br />
l<strong>and</strong>slide deposits under changing conditions.<br />
QUESTIONS (8, PART B)<br />
1. Review Part A, carefully examine Figure 8.12, the explanation<br />
for this figure, <strong>and</strong> the topographic map for this area<br />
(Figure 8.13 in the map section at the back of the book). Note<br />
that two different contour intervals are used on each map.<br />
a. What are these contour intervals?<br />
b. Explain why two different contour intervals were necessary<br />
for each map.<br />
2. Place an X in the area of the largest l<strong>and</strong>slide deposit<br />
within the enclosed area in the center of Figure 8.12. What is<br />
the approximate area of this slide, in square miles?<br />
3. What materials make up the l<strong>and</strong>slide deposit?<br />
4. The density of contour lines changes from the northeast<br />
part of the map to the southwest part, indicating a change<br />
from steep to gentle slopes <strong>and</strong> suggesting an increase in<br />
potential for l<strong>and</strong>slides. What is the difference in elevation<br />
between A <strong>and</strong> B?<br />
5. What is the distance from A to B in miles?<br />
6. What is the average gradient (slope), in feet per mile, from<br />
A to B?<br />
7. The gradient from X to Y is __, <strong>and</strong> from K to L it is
FIGURE 8.15 Stereopairs for northeastern San Jose, California, in 1963.<br />
Exercise 8 • <strong>L<strong>and</strong>slides</strong> <strong>and</strong> <strong>Avalanches</strong> 127
128 II. Introduction to Geologic Hazards<br />
FIGURE 8.16 Stereopairs for northeastern San Jose, CA in 1993.<br />
-<br />
- --
--..... --<br />
7. a. Where would the l<strong>and</strong>slides observed in the 1968 photo<br />
- - .....<br />
-"'\.<br />
--<br />
--<br />
--<br />
-<br />
-<br />
-<br />
Exercise 8 • <strong>L<strong>and</strong>slides</strong> <strong>and</strong> <strong>Avalanches</strong> 131<br />
6. The rock <strong>and</strong> regolith graded from the high areas of the d. What is the type of mass wasting that destroyed the road?<br />
hillside were used as fill to provide additional building sites<br />
on the slope of the hill adjacent to the cut surface. Complete<br />
the sketch (Figure 8.19) to illustrate the site. Consult the maps (Figure 8.23 in back of book) to answer questions<br />
11-13.<br />
11. a. Circle the location of the apartment complex on each<br />
map.<br />
(Figure 8.18) be in your sketch (Figure 8.19)?<br />
b. What is the material of this l<strong>and</strong>slide: bedrock, fill or<br />
regolith?<br />
8. On the 1971 stereo triplet (Figure 8.20),<br />
a. Mark the area of rockfall hazard for the apartments<br />
wi th (R).<br />
b. Compared to the 1968 (Figure 8.18) photo, where is the<br />
increased area of mass movement?<br />
c. How many apartment buildings are there in the completed<br />
complex in 1971 (Figure 8.20)?<br />
9. On the 1975 stereopair (Figure 8.21)<br />
a. Outline the areas of l<strong>and</strong>slides (L)<br />
b. From the maps, how many buildings were on the site<br />
in 1961? In 1995?<br />
c. On the 1995 map, add the apartment buildings that once<br />
existed (see 1975 photo). The maximum number was_?<br />
d. The thin dashed line represents the city boundary. How<br />
does the river influence this boundary or does it?<br />
e. The Hocking River unden-vent a major change in form<br />
<strong>and</strong> position between 1961 <strong>and</strong> 1995. Describe these<br />
changes near Ohio University.<br />
f. On the 1995 map, mark one location where natural<br />
change in the river has occurred following channelization<br />
by humans in the early 1970s. What is the change <strong>and</strong><br />
what is your evidence that it has occurred?<br />
b. How many different l<strong>and</strong>slides can you identify?<br />
12. From what you know of the l<strong>and</strong>scape in the vicinity of<br />
the apartment site between 1968 (photo) <strong>and</strong> 1995(map),<br />
mark the location where highway 33/50 passes over the toe<br />
c. Identify any site(s) where a building has been removed. of a l<strong>and</strong>slide.<br />
d. Mark buildings with an "X" th at you think will be lost<br />
or removed because of mass wasting.<br />
10. From the 1976 image (Figure 8.22),<br />
a. Is the road at the base of the hill suitable for automobiles?<br />
b. How many apartments are le ft?<br />
c. Why did they not build these structures where it is flat,<br />
such as at B?<br />
13. Briefly describe what happened to the river near the row<br />
of trees on the river bank between 1968 (Figure 8.18) <strong>and</strong> 1975<br />
(Figure 8.21).<br />
e. What is the purpose of the chain-link fence (F) behind<br />
the apartment? 14. Now that you have nearly completed the exercise you<br />
should be able to see the development of the major l<strong>and</strong>slide,<br />
active before all the apartments were built. Describe changes<br />
f. What type of mass wasting deposit would you find in the road <strong>and</strong> flood plain from the photos:<br />
adjacent to the fence? Explain.<br />
a. 1968-1971<br />
b.1971-1975<br />
c. 1975-1976<br />
15. What recommendation would you give to anyone preparing<br />
a building site in the vicinity of <strong>and</strong> at the same level (<strong>and</strong><br />
presumably with the same strata) as the apartment site?
132 11. Introduction to Geologic Hazards<br />
FIGURE 8.20 Stereo triplet (1971) of the apartment site.
134 II. Introduction to Geologic Hazards<br />
FIGURE 8.22 Aerial photo (1976) of apartment site.<br />
PART D. THE NATURE AND OCCURRENCE<br />
OF SNOW AVALANCHES<br />
The goals of part of the exercise are to familiarize you<br />
with some of the basic causes of avalanches <strong>and</strong> introduce<br />
you to various types of avalanche terrain.<br />
The following text is slightly edited from the U.s.<br />
Forest Service brochure "Snow avalanche: General rules<br />
for avoiding <strong>and</strong> surviving snow avalanches."<br />
Loose snow avalance Slab avalance<br />
There are two principal types of snow avalanches:<br />
loose snmv avalanches <strong>and</strong> slab avalanches. These types<br />
are illustrated in Figure 8.24. Loose snow avalanches<br />
start at a point or over a small area. They grow in size<br />
<strong>and</strong> the quantity of snow involved increases as they<br />
descend. Loose snow moves as a formless mass with little<br />
internal cohesion. Slab avalanches, on the other h<strong>and</strong>,<br />
start when a large area of snow begins to slide as a mass.<br />
FIGURE 8.24 Two modes of snow slope failure: (left), loose-snow avalanche <strong>and</strong> (right), slat: avalanche (Perla <strong>and</strong> Martinelli, 1978).<br />
- ..<br />
"<br />
•<br />
,<br />
•<br />
•<br />
,<br />
"<br />
,<br />
"<br />
;'<br />
·<br />
I..<br />
,<br />
,<br />
I
- According<br />
- dangerous<br />
- cise<br />
.....<br />
-- U.s.<br />
--<br />
--<br />
-- --.,...<br />
snow.<br />
-- deposits<br />
-<br />
- gullies<br />
- Watch<br />
- layers<br />
A well-defined fracture line occurs where the moving<br />
snow breaks away from the stable snow. In slab<br />
avalanches snow crystals tend to stick together. Angular<br />
blocks or chunks of snow may be part of the slide.<br />
to Perla <strong>and</strong> Martinelli (1978), the slab may<br />
range from 100 to 10,000 square meters in area <strong>and</strong> from<br />
0.1 to about 10 m thick. Slab avalanches are the more<br />
of the two types.<br />
<strong>Avalanches</strong> are the result of both the underlying<br />
terrain <strong>and</strong> the conditions of the snowpack. This exerconcentrates<br />
on terrain factors, including slope<br />
steepness, slope profile, slope aspect, <strong>and</strong> ground cover.<br />
The relevant terrain factors, as described by the<br />
Forest Service, are:<br />
Slope steepness. <strong>Avalanches</strong> most commonly release from<br />
slopes of 30 to 45 degrees (60 to 100 percent), but may<br />
begin on slopes ranging from 25 to 65 degrees (45 to 215<br />
percent). LaChapelle (1985) notes that many avalanches<br />
begin on slopes of 35 to 40 degrees (70 to 85 percent).<br />
Slope profile. Dangerous slab avalanches are more likely<br />
to begin on convex slopes but may also begin on concave<br />
slopes. Short slopes may be as dangerous as long slopes;<br />
42 percent of all avalanche fatalities result from slides<br />
with a slope distance of less than 300 ft (100 m).<br />
Slope aspect. Snow on north-facing slopes may be<br />
slower to stabilize than snow on slopes that face other<br />
directions. South-facing slopes are especially dangerous<br />
in the spring due to solar heating. Leeward (dowmvind,<br />
or the direction the wind is blowing toward) slopes are<br />
dangerous because they accumulate wind-deposited<br />
snows that add depth <strong>and</strong> may create unstable slabs of<br />
Windward (upwind, or the direction the wind is<br />
coming from) slopes generally have less snow; the snow<br />
is more compacted <strong>and</strong> usually more stable than snow<br />
on leeward slopes.<br />
Ground cover. Large rocks, trees, <strong>and</strong> heavy brush help<br />
anchor the snow. Smooth, open slopes are more<br />
dangerous, but avalanches can start even among trees.<br />
Old slide paths <strong>and</strong> recent avalanche activity. Generally,<br />
avalanches may repeatedly occur in the same areas.<br />
for avalanche paths. Look for pushed-over small<br />
trees, trees with limbs broken off. Avoid steep, open<br />
<strong>and</strong> slopes. If you see new avalanches, suspect<br />
dangerous conditions. Beware when snowballs or<br />
"cartwheels" roll down the slope.<br />
If you are planning to travel in avalanche country,<br />
you should also be aware of the impact of different<br />
weather conditions on the occurrence of avalanches.<br />
Some of these factors, as described by the U.s. Forest<br />
Service, are:<br />
Old snow. When the old snow depth is sufficient to cover<br />
natural anchors, such as rocks <strong>and</strong> brush, additional snow<br />
will slide more readily. The nature of the old snow<br />
surface is important. For example, cold snow falling on<br />
hard, refrozen snow surfaces, such as Slill or rain crusts,<br />
may form a weak bond. Also a loose under-lying snow<br />
layer is more dangerous than a compacted one. Check<br />
the underlying snow layer with a ski pole, ski, or rod.<br />
Exercise 8 • <strong>L<strong>and</strong>slides</strong> <strong>and</strong> <strong>Avalanches</strong> 135<br />
Wind. Sustained winds of 15 mi/hr <strong>and</strong> over may<br />
cause avalanche danger to increase rapidly even<br />
during clear weather, if loose surface snow is available<br />
for the wind to transport. Snow plumes from ridges<br />
<strong>and</strong> peaks indicate that snow is being moved onto<br />
leeward slopes. This can create dangerous conditions.<br />
Storms. A high percentage of all avalanches occur<br />
shortly before, during, <strong>and</strong> shortly after storms. Be<br />
extra cautious during these periods.<br />
Rate of snowfall. Snow falling at the rate of 1 in/hr or<br />
more increases avalanche danger rapidly.<br />
Crystal types. Observe general snow-crystal types by<br />
letting them fall on a dark ski mitt or parka sleeve.<br />
Small crystals-needles <strong>and</strong> pellets-often result in<br />
more dangerous conditions than the classic, starshaped<br />
crystals.<br />
New snow. Be alert to dangerous conditions with a foot<br />
or more of new snow. Remember tha t new snow depth<br />
may vary considerably with slope elevation, steepness,<br />
<strong>and</strong> direction.<br />
Temperature. Cold temperatures will maintain an<br />
unstable snowpack while warm temperatures (near<br />
freezing) allow for snow settlement <strong>and</strong> increasing<br />
stability. Storms starting with low temperatures <strong>and</strong><br />
dry snow, followed by rising temperatures <strong>and</strong><br />
wetter snow, are more likely to cause avalanches. The<br />
dry snow at the start forms a poor bond to the old<br />
snow surface <strong>and</strong> has insufficient strength to support<br />
the heavier snow deposited late in the storm. Rapid<br />
changes in weather conditions (wind, temperature,<br />
snowfall) cause snowpack changes. Therefore, be<br />
alert to weather changes. Snowpack changes may<br />
affect snow stability <strong>and</strong> cause an avalanche.<br />
Temperature inversion. Higher temperatures with higher<br />
elevations can occur when warm air moves over cold<br />
air, which is trapped near the ground <strong>and</strong> in valleys.<br />
This weather situation may produce dramatic variations<br />
in local snow stability.<br />
Wet snow. Rainstorms or spring weather with sunny<br />
days, warm winds, <strong>and</strong> cloudy nights can warm the<br />
snow cover. The resulting free <strong>and</strong> percolating water<br />
may cause wet snow avalanches. Wet snow avalanches<br />
are more likely on south slopes <strong>and</strong> slopes under<br />
exposed rock.<br />
The U.s. Forest Service suggests that "the safest<br />
routes for travel in avalanche terrain are on ridgetops<br />
<strong>and</strong> slightly on the windward side of ridgetops, away<br />
from cornices (accumulations of drift snow on the leeward<br />
side of the crest of a ridge). Windward slopes are<br />
usually safer than leeward slopes. If you cannot travel<br />
on ridges, the next safest route is out in the valley, far<br />
from the bottom of slopes. Avoid disturbing cornices<br />
from below or above. Gain access to ridgetops by<br />
detouring around cornice areas ....<br />
If you must cross dangerous slopes, stay high<br />
<strong>and</strong> near the top. If you see avalanche fracture lines in<br />
the snow, avoid them <strong>and</strong> similar snow areas. If the<br />
snow sounds hollow, particularly on a leeward slope,
138 II. Introduction to Geologic Hazards<br />
FIGURE 8.28 Topographic map of part of the Aspen, Colorado, quadrangle.<br />
map of the area. Figure 8.29, in the maps section at the<br />
back of the book, shows avalanche paths near Aspen. You<br />
must first measure the area of the starting zone in square<br />
feet or meters <strong>and</strong> convert this measurement to hectares.<br />
Outline your starting zone on the map of Aspen. Also outline<br />
the beginning <strong>and</strong> end of the runout zone. Show your<br />
calculations.<br />
Runout zone length __<br />
5. a. How does the runout distance you calculated for the<br />
McFarlane Creek runout zone compare with the length of<br />
the runout zone shown on the map?<br />
b. Do the results suggest any changes for the map 7<br />
6. Notice that the contours at the mouth of McFarlane Creek<br />
bend away from the range front out into the valley. They represent<br />
a debris fan or alluvial fan. Are there other debris fans<br />
along the valley of Roaring Fork that could be related to<br />
avalanche activity? If so, where are they)<br />
7. What evidence would you look for in the field to determine<br />
whether debris fans, such as at the mouth of McFarlane<br />
Creek, is related to stream deposition or avalanches)<br />
8. The colored map of the Aspen area was published in 1972.<br />
Did McFarlane Creek avalanches present a hazard to people<br />
at that time? Explain your answer.<br />
9. Compare Figures 8.28 <strong>and</strong> 8.29 (the colored map). Identify<br />
changes in human use of the l<strong>and</strong> at the base of McFarlane<br />
Creek that occurred between 1972 (the date of the original<br />
base map used in compiling Figure 8.29) <strong>and</strong> 1987, the date<br />
of the revised map in Figure 8.28.<br />
10. How have changes in human use of the l<strong>and</strong> at the base<br />
of McFarlane Creek increased or decreased hazards from<br />
avalanches since 1972?<br />
Alta, Utah<br />
11. First, let's look at a typical small-avalanche site on the<br />
Alta map (Figure 8.30). Carefully identify, in the general area