Landslides and Avalanches
Landslides and Avalanches
Landslides and Avalanches

Create successful ePaper yourself
Turn your PDF publications into a flip-book with our unique Google optimized e-Paper software.
122 II. Introduction to Geologic Hazards<br />
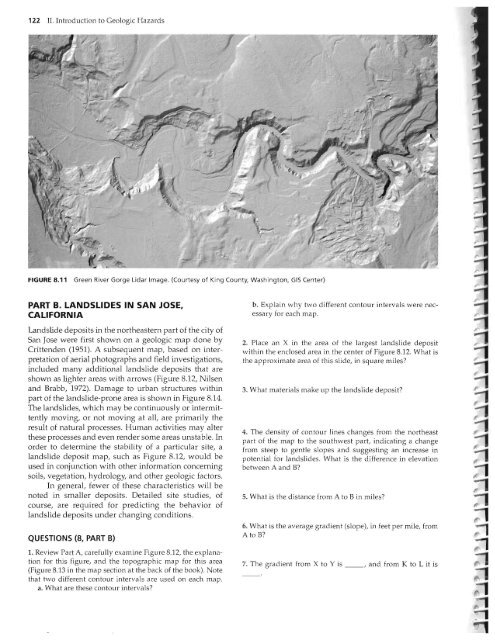
FIGURE 8.11 Green River Gorge Lidar Image. (Courtesy of King County, Washington, GIS Center)<br />
PART B. LANDSLIDES IN SAN JOSE.<br />
CALIFORNIA<br />
L<strong>and</strong>slide deposits in the northeastern part of the city of<br />
San Jose were first shown on a geologic map done by<br />
Crittenden (1951). A subsequent map, based on interpretation<br />
of aerial photographs <strong>and</strong> field investigations,<br />
included many additional l<strong>and</strong>slide deposits that are<br />
shown as lighter areas with arrows (Figure 8.12, Nilsen<br />
<strong>and</strong> Brabb, 1972). Damage to urban structures vvithin<br />
part of the l<strong>and</strong>slide-prone area is shown in Figure 8.14.<br />
The l<strong>and</strong>slides, which may be continuously or intermittently<br />
moving, or not moving at all, are primarily the<br />
result of natural processes. Human activities may alter<br />
these processes <strong>and</strong> even render some areas unstable. In<br />
order to determine the stability of a particular site, a<br />
l<strong>and</strong>slide deposit map, such as Figure 8.12, would be<br />
used in conjunction with other information concerning<br />
soils, vegetation, hydrology, <strong>and</strong> other geologic factors.<br />
In general, fewer of these characteristics will be<br />
noted in smaller deposits. Detailed site studies, of<br />
course, are required for predicting the behavior of<br />
l<strong>and</strong>slide deposits under changing conditions.<br />
QUESTIONS (8, PART B)<br />
1. Review Part A, carefully examine Figure 8.12, the explanation<br />
for this figure, <strong>and</strong> the topographic map for this area<br />
(Figure 8.13 in the map section at the back of the book). Note<br />
that two different contour intervals are used on each map.<br />
a. What are these contour intervals?<br />
b. Explain why two different contour intervals were necessary<br />
for each map.<br />
2. Place an X in the area of the largest l<strong>and</strong>slide deposit<br />
within the enclosed area in the center of Figure 8.12. What is<br />
the approximate area of this slide, in square miles?<br />
3. What materials make up the l<strong>and</strong>slide deposit?<br />
4. The density of contour lines changes from the northeast<br />
part of the map to the southwest part, indicating a change<br />
from steep to gentle slopes <strong>and</strong> suggesting an increase in<br />
potential for l<strong>and</strong>slides. What is the difference in elevation<br />
between A <strong>and</strong> B?<br />
5. What is the distance from A to B in miles?<br />
6. What is the average gradient (slope), in feet per mile, from<br />
A to B?<br />
7. The gradient from X to Y is __, <strong>and</strong> from K to L it is