Pdf-File - The Mesoscale Alpine Programme - MeteoSwiss
Pdf-File - The Mesoscale Alpine Programme - MeteoSwiss
Pdf-File - The Mesoscale Alpine Programme - MeteoSwiss

Create successful ePaper yourself
Turn your PDF publications into a flip-book with our unique Google optimized e-Paper software.
Recent developments of VERA<br />
Matthias Ratheiser<br />
Reinhold Steinacker<br />
Manfred Dorninger<br />
Dept. of Meteorology and Geophysics, University of Vienna, Austria<br />
Inga Groehn<br />
Wolfgang Poettschacher<br />
Andreas Schmölz<br />
Christian Häberli <strong>MeteoSwiss</strong>, Zurich, Switzerland<br />
Introduction<br />
<strong>The</strong> aim of VERA was to develop an objective, automatic analysis procedure for meteorological<br />
parameters over complex terrain. To resolve mesoscale structures caused by topography as well,<br />
meteorological a priori knowledge (for hand analysis it is the experience of the synoptician) should be<br />
included in the analysis. <strong>The</strong> available analysis scheme VERA fulfills these demands.<br />
VERA has been developed at the Department of Meteorology at the University of Vienna since 1995.<br />
<strong>The</strong> scheme may be used for both, error detection and correction, and interpolation of irregulary<br />
distributed data to a regular grid. <strong>The</strong> emphasis is put on the transfer of information from data sparse<br />
to data rich areas. For this purpose the so called “fingerprint technique” is used. It adjoins additional<br />
orographic information to the measurements. <strong>The</strong> error detection mode checks the single<br />
measurements concerning their spatial physical plausibility and calculates correction suggestions<br />
where necessary. <strong>The</strong> method runs independently from any first guess or model field.<br />
<strong>The</strong> analysis scheme<br />
<strong>The</strong> basic approach of VERA is a variational algorithm that minimizes the squares of spatial<br />
derivatives of the measured field. It is similar to the spline algorithm, but there are some major<br />
differences. Let us assume a grid field whose points are partly filled with known values. <strong>The</strong> empty<br />
ones should be filled up by interpolated values. For our purpose there are two postulations for the<br />
interpolation function: First the function must exactly hit all given points. Second we are interested in<br />
the function’s values on the grid points only, but not in the continuos function itself.<br />
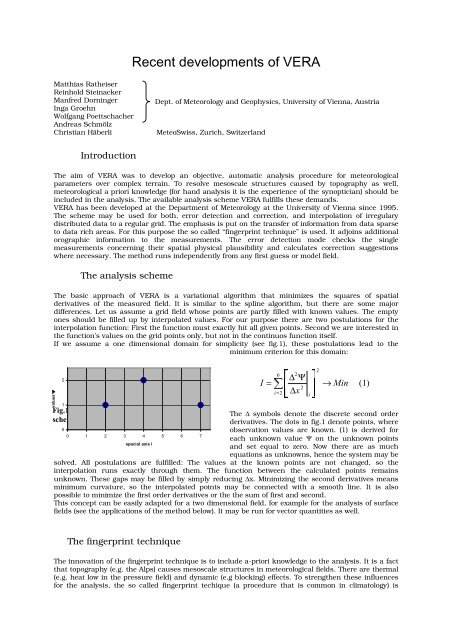
If we assume a one dimensional domain for simplicity (see fig.1), these postulations lead to the<br />
minimum criterion for this domain:<br />
values Ψ<br />
2<br />
1<br />
Fig.1: 1D-domain to demonstrate the VERAscheme<br />
0<br />
0 1 2 3 4 5 6 7<br />
spacial axis i<br />
I<br />
6<br />
<br />
2<br />
∆ Ψ<br />
2<br />
∆x<br />
<br />
<br />
=<br />
<br />
<br />
i= <br />
2 i<br />
2<br />
→ Min<br />
(1)<br />
<strong>The</strong> ∆ symbols denote the discrete second order<br />
derivatives. <strong>The</strong> dots in fig.1 denote points, where<br />
observation values are known. (1) is derived for<br />
each unknown value Ψ on the unknown points<br />
and set equal to zero. Now there are as much<br />
equationsasunknowns,hencethesystemmaybe<br />
solved. All postulations are fulfilled: <strong>The</strong> values at the known points are not changed, so the<br />
interpolation runs exactly through them. <strong>The</strong> function between the calculated points remains<br />
unknown. <strong>The</strong>se gaps may be filled by simply reducing ∆x. Minimizing the second derivatives means<br />
minimum curvature, so the interpolated points may be connected with a smooth line. It is also<br />
possible to minimize the first order derivatives or the the sum of first and second.<br />
This concept can be easily adapted for a two dimensional field, for example for the analysis of surface<br />
fields (see the applications of the method below). It may be run for vector quantities as well.<br />
<strong>The</strong> fingerprint technique<br />
<strong>The</strong> innovation of the fingerprint technique is to include a-priori knowledge to the analysis. It is a fact<br />
that topography (e.g. the Alps) causes mesoscale structures in meteorological fields. <strong>The</strong>re are thermal<br />
(e.g. heat low in the pressure field) and dynamic (e.g blocking) effects. To strengthen these influences<br />
for the analysis, the so called fingerprint techique (a procedure that is common in climatology) is
adapted. Let us assume that a scalar value on a grid point is expressed by the sum Ψo = Ψs +ctΨt +<br />
cdΨd. Ψo is the observed value, Ψs the synoptic value (without topographic influences), Ψt the thermal<br />
influenced part and Ψd the dynamic influenced part of Ψo. <strong>The</strong> two latter parts are superposed over the<br />
synoptic signal. Synthetic pressure pattern for both the thermal and dynamic effects, so called<br />
idealized fingerprints, are calculated from high resolution digital topography data (see fig.2).<br />
Fig.2: Idealized thermal fingerprint for the <strong>Alpine</strong> region. Isolines denote relative change of 1<br />
<strong>The</strong>n, together with the interpolation of the observational data, at every grid point the factors ct and cd<br />
are calculated. <strong>The</strong>y determine how strong the different fingerprints contribute to Ψo. <strong>The</strong>refore(1)is<br />
changed to<br />
2 <br />
<br />
∆ Ψ<br />
2<br />
∆ <br />
x<br />
2<br />
→ Min<br />
Ψ = Ψ − c Ψ − c Ψ<br />
(2)<br />
S<br />
<br />
with S<br />
T T D D<br />
<br />
<br />
i i<br />
Refering to the one dimensional example above we now have two additional unknowns, hence two<br />
more variables for the derivations.<br />
Using the fingerprint technique for real 2D-fields the dynamic influence is divided into four idealized<br />
fingerprints and therefore four factors, one for every mean flow direction.<br />
Application examples<br />
<strong>The</strong> whole analysis scheme consists of an error correction module, an interpolation module and a<br />
fingerprint module. All three parts were extensivly tested and utilized operationally by Austrian<br />
weather services. VERA is also used by the Universities of Vienna and Innsbruck within an exercise<br />
course for weather prediction. <strong>The</strong> application of VERA for a 3D or 4D domain is still in the<br />
development stage. <strong>The</strong> scheme is currently running operationally for hourly analyis of surface<br />
pressure, 10m wind vectors, pressure tendency, potential and equvivalent potential temperature, 12hprecipitation<br />
sums and cloud cover. Fig 3 to 4 show selected cases where the abilities of VERA are<br />
demonstrated.
Fig.3: 12h-precipitation sum (coloured areas) an potential level of snowfall (isolines)<br />
Fig.3 shows an example for a heavy precipitation event in the southern Alps on November 6 th, 2000,<br />
18 UTC. It was followed by severe flooding in northern Italy and southern Switzerland. Note the large<br />
area where the values of 12 hour precipitation exeeds 50 mm (red colour). <strong>The</strong> blocking effect of the<br />
Alp’s main ridge can be seen best in Tyrol and in Salzburg. <strong>The</strong> sharp gradient is due to the fingerprint<br />
technique. <strong>The</strong> potential level of snowfall is the height where snow turns into rain depending on the<br />
values of wet bulb temperature. <strong>The</strong> distribution of potential level of snowfall shows the warm and<br />
moist southwesterly flow that advects the rainfall against the Alps. Note the low levels (down to 600m)<br />
in southern Switzerland. This effect may be due to cooling of the trapped air volume in the valleys by<br />
melting of the heavy precipitation.<br />
Other parameters that are analyzed with the VERA algorithm are cloud cover and lifting condensation<br />
level. See Fig.4 on the next page for an example. This “pseudo-satellite image seen from below the<br />
clouds” shows low ceiling and a window possibly due to föhn over the border area Bavaria/Salzburg.<br />
<strong>The</strong> lifting condensation level is calculatd from the spread between temperature and dewpoint<br />
temperature at the stations. <strong>The</strong> values may be interpreted as the lowest condensation level possible<br />
for the measured surface values of dewpoint and temperature. <strong>The</strong>y will be quite accurate if the<br />
surface air is lifted dynamically or on days with good vertical mixing of the atmosphere.<br />
Literature about VERA<br />
Articles in journals<br />
Steinacker, R., W. Pöttschacher, M. Dorninger, 1997: Enhanced Resolution Analysis of the<br />
Atmosphere over the Alps Using the Fingerprint Technique. Annalen der Meteorologie, 35, 235- 237<br />
Steinacker, R., W. Pöttschacher, M. Dorninger, 1997: An Enhanced Resolution Analysis Scheme for<br />
theAtmosphereoverComplexTerrain.Annales Geophysicae, 15,Suppl.II,Europ.Geoph.Soc.,C426<br />
Steinacker et al., 2000: A Transparent Method for the Analysis and Quality Evaluation of Irregularly<br />
Distributed and Noisy Observational Data.Monthly Weather Review Vol.128, No.7, pp 2303-2316
Contributions to the MAP Newsletter<br />
Steinacker, R., M. Dorninger, W. Pöttschacher, 1995: Meteorological applications of high resolution<br />
topographic data. MAP Newsletter, 3, 73-74<br />
Pöttschacher, W, R Steinacker and M Dorninger, 1996: VERA - A high resolution analysis scheme for<br />
the atmosphere over complex terrain. MAP Newsletter, 5, 64-65<br />
Pöttschacher, W, R Steinacker, M Dorninger, 1997: Heavy Snow Fall in the Viennese Region Analysed<br />
with VERA. MAP Newsletter, 7, 32-33<br />
Pöttschacher, W, Ch. Häberli, R Steinacker, 1997: <strong>The</strong> Error Detection and Correction Module of<br />
CALRAS and VERA. MAP Newsletter, 7, 88-89<br />
Groehn, I., R. Steinacker, Ch. Häberli, W.Pöttschacher, M. Dorninger, 1998: Results of DAQUAMAP:<br />
Characteristics of Humidity Observations of <strong>Alpine</strong> Synoptic Network, MAP Newsletter NR. 9, p. 54-55<br />
Häberli, Christian and Reinhold Steinacker, 1998: Quality Assessment of Upper Air Soundings in<br />
MAP, MAP Newsletter NR. 9, p. 68-69<br />
Groehn, I., R. Steinacker, Ch. Häberli, W.Pöttschacher, M. Dorninger, 1999: DAQUAMAP- results and<br />
response of providers, MAP Newsletter Nr. 11, p. 76<br />
Groehn, I., R. Steinacker, Ch. Häberli, W.Pöttschacher, M. Dorninger, 2000: DAQUAMAP after SOP,<br />
MAP Newsletter Nr. 12, p. 22<br />
Groehn, I., R. Steinacker, Ch. Häberli, W.Pöttschacher, M. Dorninger, 2000: DAQUAMAP- results and<br />
response of providers, MAP Newsletter Nr. 13, pp. 6-8<br />
Groehn, I., et al, 2000 : Data Quality Control of MAP (DAQUAMAP), MAP Newsletter 13<br />
Contributions to meeting proceedings<br />
Steinacker, R., M. Dorninger, W. Pöttschacher, 1996: A high resolution analysis scheme for the<br />
atmosphere over complex terrain: a contribution to MAP. Proceedings of the 24th International<br />
Conference on <strong>Alpine</strong> Meteorology 1996, Bled, Slovenia, 9. - 13.9.1996, 106-111<br />
Pöttschacher, W, R Steinacker and M Dorninger, 1996: VERA A high resolution analysis scheme for<br />
the atmosphere over complex terrain. Preprints of the 7th Conference on <strong>Mesoscale</strong> Processes,<br />
Reading, UK, 9. - 13.9.1996, 245-247<br />
Steinacker, R., Ch. Häberli, I. Groehn, W. Pöttschacher, M. Dorninger, 1998: DAQUAMAP - An<br />
Initiative to Assess the Performance of Surface Observations in MAP Using a Model Independent<br />
Method. 8th Int. Conf. on Mountain Meteorology, Flagstaff, Amer. Meteor. Soc., pp 113-118.<br />
Fig.4:Cloud cover (white shaded areas) and lifting condensation level (isolines)