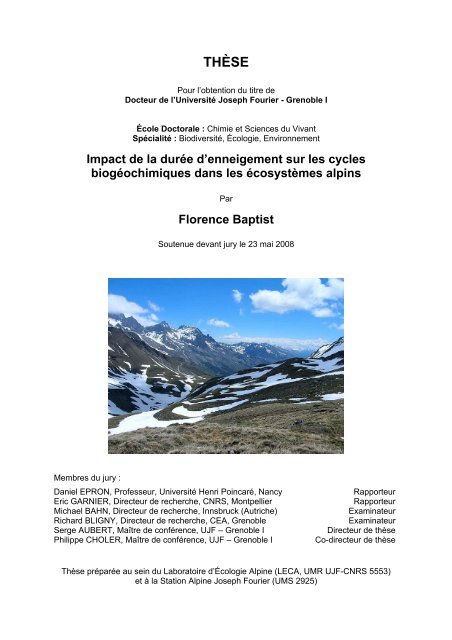
THÈSE - Station Alpine Joseph Fourier - Université Joseph Fourier
THÈSE - Station Alpine Joseph Fourier - Université Joseph Fourier
THÈSE - Station Alpine Joseph Fourier - Université Joseph Fourier

Create successful ePaper yourself
Turn your PDF publications into a flip-book with our unique Google optimized e-Paper software.
<strong>THÈSE</strong><br />
Pour l’obtention du titre de<br />
Docteur de l’<strong>Université</strong> <strong>Joseph</strong> <strong>Fourier</strong> - Grenoble I<br />
École Doctorale : Chimie et Sciences du Vivant<br />
Spécialité : Biodiversité, Écologie, Environnement<br />
Impact de la durée d’enneigement sur les cycles<br />
biogéochimiques dans les écosystèmes alpins<br />
Membres du jury :<br />
Par<br />
Florence Baptist<br />
Soutenue devant jury le 23 mai 2008<br />
Daniel EPRON, Professeur, <strong>Université</strong> Henri Poincaré, Nancy Rapporteur<br />
Eric GARNIER, Directeur de recherche, CNRS, Montpellier Rapporteur<br />
Michael BAHN, Directeur de recherche, Innsbruck (Autriche) Examinateur<br />
Richard BLIGNY, Directeur de recherche, CEA, Grenoble Examinateur<br />
Serge AUBERT, Maître de conférence, UJF – Grenoble I Directeur de thèse<br />
Philippe CHOLER, Maître de conférence, UJF – Grenoble I Co-directeur de thèse<br />
Thèse préparée au sein du Laboratoire d’Écologie <strong>Alpine</strong> (LECA, UMR UJF-CNRS 5553)<br />
et à la <strong>Station</strong> <strong>Alpine</strong> <strong>Joseph</strong> <strong>Fourier</strong> (UMS 2925)
« Quel prix, dit encore Pierre Termier, peut se comparer à la joie de la découverte, et<br />
quelle récompense ne paraît misérable à coté de celle que la vérité elle-même décerne au<br />
chercheur qui l’a dévoilée ». Lorsqu’une parcelle de cette vérité est cachée dans le calice fermé<br />
d’une gentiane ou d’un céraiste des glaciers, n’est-elle pas plus attirante encore ? Et ainsi les<br />
plantes de Alpes remplissent doublement leur mission, qui est de nous élever au-dessus de<br />
nous-mêmes, vers les sommets : ceux que foulent nos pieds et ceux de la réflexion et de la<br />
recherche.<br />
Favarger CL et Robert PA, Paris 1956 : Flore et végétation des alpes (Tome I)<br />
Page 12 de l’édition 1995 « Delachaux et Niestlé »<br />
3
Avant-propos<br />
Ce manuscrit déposé à l’école doctorale Chimie et Science du vivant de l’<strong>Université</strong><br />
de Grenoble (<strong>Université</strong> <strong>Joseph</strong> <strong>Fourier</strong>) a été rédigé sous la forme d’une thèse sur articles. Il<br />
contient une introduction en français suivi de six articles répartis dans deux chapitres. Une<br />
synthèse de l’ensemble des travaux réalisés est proposée dans la dernière partie du manuscrit.<br />
Les différentes techniques appliquées au cours de ces trois années de travail ne sont décrites<br />
que dans les articles par souci de clarté et de concision. Deux des articles ont été acceptés et<br />
publiés dans des revues internationales, un est en cours de révision et trois autres sont encore<br />
en préparation.<br />
Mon allocation de recherche a été financée par le ministère de la recherche et de<br />
l’éducation pour une période de trois ans. L’encadrement scientifique et le support logistique<br />
ont été assurés par le Laboratoire d’Ecologie <strong>Alpine</strong> (UMR CNRS-UJF 5553), la <strong>Station</strong><br />
<strong>Alpine</strong> <strong>Joseph</strong> <strong>Fourier</strong> (UMS 2925 CNRS-UJF), l’<strong>Université</strong> de Barcelone (S. Noguès), le<br />
Laboratoire Ecologie, Systématique et évolution de l’<strong>Université</strong> Paris XI (UMR 8079) et le<br />
projet MICROALP (ANR 2006-2009) porté par R. Geremia. Ce travail a été réalisé en grande<br />
partie au Laboratoire d’Ecologie <strong>Alpine</strong> de l’<strong>Université</strong> de Grenoble et à la <strong>Station</strong> <strong>Alpine</strong><br />
<strong>Joseph</strong> <strong>Fourier</strong>, station d’altitude située au col du Lautaret dans les Hautes-Alpes (05).<br />
5
Remerciements<br />
En premier lieu, je tiens à remercier chaleureusement mes deux directeurs de thèse,<br />
Pr. Philippe Choler et Pr. Serge Aubert.<br />
Merci, Philippe, de m’avoir encadrée et conseillée durant toute la durée de cette thèse. Merci<br />
également pour la grande disponibilité dont tu as su faire preuve et pour la confiance que tu<br />
m’as témoignée dans la conduite de ce projet. Enfin, merci de m’avoir transmis ta passion<br />
pour la recherche, elle ne me quitte plus aujourd’hui. C’était un projet un peu fou au départ,<br />
mais nous y sommes arrivés !<br />
Merci, Serge, d’avoir toujours été là pour orienter et aider quand c’était nécessaire. Pour ta<br />
capacité à résoudre tout problème, quel qu’il soit !<br />
Je tiens également à remercier Sandra Lavorel dont les encouragements ont été pour moi<br />
essentiels.<br />
Mes remerciements vont également aux membres du jury, Michael Bahn, Richard Bligny,<br />
Daniel Epron et Eric Garnier qui ont accepté de passer du temps à lire et à juger ce manuscrit.<br />
Je tiens à exprimer toute ma reconnaissance à Salvador Noguès, Jean-Yves Pontailler, Peter<br />
Streb et Guillaume Tcherkez qui m’ont transmis tant de connaissances et de compétences en<br />
écophysiologie végétale.<br />
Un grand merci également à toutes les personnes qui ont pu intervenir de prêt ou de loin sur<br />
le terrain, au laboratoire ou au bureau, et tout particulièrement Gwenaelle Clément, Marie-<br />
Pascale Colace, Geneviève Girard, Richard Hurstel, Olivier Lontin et Florence Sagnimorte.<br />
Cette aide fut indispensable !<br />
Merci à toute l’équipe Microalp : les manips, le terrain, les nombreuses discussions<br />
scientifiques ont été pour moi l’occasion de découvrir les meilleurs aspects de la recherche.<br />
Merci à toute l’équipe TDE et de façon plus générale au LECA. Cette thèse fut à la fois une<br />
expérience professionnelle extrêmement enrichissante mais également une grande aventure<br />
humaine ! Le LECA me manquera, c’est sûr !<br />
Merci à Hélène Barrière, Katline Charra-Vaskou, Céline Flahaut qui m’ont accompagné ces<br />
années durant pour le meilleur et parfois pour le pire … du genre « Neige et rafales de vent à<br />
90 km/h, dépression de 1000 hpa évoluant plein ouest en provenance directe des terres<br />
arctiques »..<br />
Merci à toute la team 111, sans vous, rien n’aurait été pareil ! Abdé, Cécile, Fabrice, Flore,<br />
Nico, Pierrot, et puis à tous les autres du labo parti, en partance ou encore là pour quelques<br />
temps. Alice, Aurélie B., Aurélie T., Bahar, Bénédicte, Cyrille, David, Dudu, Eva, Fabien,<br />
7
Florence, Francesco, Fred, Jean-Marie, Jerôme, Hamid, Julien, Lucie, Marco, Margot,<br />
Mathieu, Olivier, Osgur, Patrick, Pierre, Pierre-François, Said, Seb B., Seb I., Sophie, Tarafa<br />
et tout ceux que j’oublie !<br />
Bonne chance pour la suite ! Qué le vaya bien !<br />
Merci Rolland de m’avoir fait découvrir d’autres horizons, en plus de la botanique : ceux de<br />
la littérature, de la cinématographie ou du théâtre. Tant de belles choses à découvrir et si peu<br />
de temps !<br />
Merci les amis ! Proches ou plus lointains, aujourd’hui dispersés aux quatre coins de la<br />
planète :<br />
Aurélie T., Flore, Florence V., Marie, Michael et Ségo. Merci pour les fous rire et tous les<br />
moments passés entre deux articles, deux manips ou juste avant des révisions à n’en plus<br />
dormir. Merci pour tout ce que vous êtes capables de donner et pour tout ce que vous êtes<br />
capables de dire !<br />
Audrey, Delphine A., Nicolas V., Rodolphe, Stéphane, Val et tous les autres. Amis de<br />
toujours ! Vous avez été là au tout début, là ou l’esprit se forge, s’affine et se construit…<br />
Armel, Bertrand, Delphine B., Guillaume, Guillaume F., Laurence, Sylvain, et tout ceux que<br />
j’ai pu oubliés. Les longues journées de révision à la BU n’auront pas eu raison de nous, ni les<br />
eaux tumultueuses des canyons Chartreusoix !<br />
Merci pour tous ces merveilleux moments passés avec mes différents colocataires, Florence<br />
V., Eva, Julien, Aurélie B., Rebecca, Marianne, Matt, Alejandro, Blanca, Martha, Francesco<br />
et puis Marco… ! Les séries de « femmes désespérées » après des séances d’accouchement<br />
rédactionnel souvent rudes, les Criss de pouding chomeurs dont on s’est délectés certaines<br />
soirées d’hiver, les cafés croissants du matin place aux herbes, ou encore les meilleures pasta<br />
du monde ! J’en passe… j’en passe et des meilleures.<br />
Merci, Fabien, d’avoir été là, chaque minute, chaque seconde ...<br />
Et puis bien sur, un grand merci à mon père, ma mère et mon frère. Sans vous, rien de tout<br />
cela n’aurait été possible.<br />
Grenoble, le 08/08/08<br />
8
Liste des abréviations<br />
Abbreviation Description Unité<br />
Anet Net photosynthetic fixation rate Various unit<br />
AG Alopecurus gerardi<br />
ANPP Aboveground Net Primary Production g m -2 d -1<br />
BNPP Belowground Net Primary Production g m -2 d -1<br />
C Carbon -<br />
CF Carex foetida -<br />
CFP Community Functional Parameter -<br />
CWM Community Weigthed Mean -<br />
δ Isotopic signature -<br />
DO Dryas octopetala<br />
ENSO El Niño Southern Oscillation -<br />
γ 13 C / γ 15 Ν Labelling-derived 13 C or 15 N content µg 13 C/ 15 N g -1 DW<br />
γ 13 CR Labelling-derived 13 C or 15 N content in CO2 respired µg 13 C g -1 h -1<br />
γ 13 CM / γ 15 ΝM Labelling-derived 13 C or 15 N mass µg or mg 13 C/ 15 N<br />
GPP Gross Primary Production g m -2 d -1<br />
k Decay constant yr -1<br />
KM Kobresia myosuroides -<br />
LAI Leaf Area Index m 2 m -2<br />
LDMC Lead Dry Matter Content %<br />
LNC Leaf Nitrogen Content %<br />
N Nitrogen -<br />
NAO North Atlantic Oscillation -<br />
NBP Net Biome Production g m -2 d -1<br />
NEP Net Ecosystem Production g m -2 d -1<br />
NPP Net Primary Production g m -2 d -1<br />
OM Organic Matter -<br />
p<br />
Proportion of new carbon inherited from 13 C labelling in<br />
CO2 respired<br />
%<br />
PA Poa alpina<br />
Q10 Factor by which respiration rate increases in response to<br />
a 10°C increase<br />
-<br />
R ou ER Darkness respiration Various unit<br />
R:S Root :Shoot ratio -<br />
RNC Root Nitrogen Content %<br />
RTD Root Tissue Density g cm -3<br />
SH Salix herbacea<br />
9
sANPP Specific Aboveground Net Primary Production g g -1 d -1<br />
SLA Specific Leaf Area cm 2 g -1<br />
SOM Soil Organic Matter %<br />
SRL Specific Root Length m g -1<br />
Nota : Les abréviations utilisées dans l’article 1A ne sont pas intégrées dans ce tableau.<br />
10
Sommaire<br />
INTRODUCTION ___________________________________________________ 15<br />
A. Contexte et problématique de l’étude ____________________________________ 17<br />
1) Flux et stocks de carbone __________________________________________________________ 18<br />
2) Enneigement et changement climatique _______________________________________________ 19<br />
3) Enneigement et cycle du carbone dans les systèmes alpins ________________________________ 23<br />
4) Les traits fonctionnels comme outils de changement d’échelle _____________________________ 28<br />
5) Interaction entre les cycles de l’azote et du carbone : Influence sur les processus écosystémiques ?_ 31<br />
B. Objectifs et hypothèses de travail _______________________________________ 34<br />
C. Organisation du document _____________________________________________ 37<br />
D. Présentation du site d’étude ____________________________________________ 40<br />
1) Les conditions climatiques _________________________________________________________ 41<br />
2) La nature du substrat ______________________________________________________________ 44<br />
3) Les conditions édaphiques _________________________________________________________ 45<br />
4) Les groupements végétaux du site d’étude _____________________________________________ 47<br />
CHAPITRE I_______________________________________________________ 49<br />
A simulation on the importance of growing season length and canopy functional<br />
properties on the seasonal Gross Primary Production of temperate alpine meadows. _ 51<br />
Decreased aboveground primary productivity of alpine tundra in response to earlier<br />
snowmelt. ________________________________________________________________ 77<br />
Abstract______________________________________________________________________________ 79<br />
Introduction___________________________________________________________________________ 80<br />
Materials and methods __________________________________________________________________ 82<br />
Results_______________________________________________________________________________ 87<br />
Discussion____________________________________________________________________________ 94<br />
Acknowledgments______________________________________________________________________ 97<br />
References____________________________________________________________________________ 97<br />
13 C and 15 N allocations of two alpine species from contrasting habitats reflect their<br />
different growth strategies _________________________________________________ 103<br />
Abstract_____________________________________________________________________________ 105<br />
Introduction__________________________________________________________________________ 106<br />
11
Material and methods __________________________________________________________________ 108<br />
Results______________________________________________________________________________ 114<br />
Discussion___________________________________________________________________________ 121<br />
Acknowledgements____________________________________________________________________ 124<br />
References___________________________________________________________________________ 125<br />
CHAPITRE II _____________________________________________________ 131<br />
Snow cover exerts control over decomposition in alpine tundra along a snowmelt<br />
gradient. ________________________________________________________________ 133<br />
Abstract_____________________________________________________________________________ 135<br />
Introduction__________________________________________________________________________ 136<br />
Material and methods __________________________________________________________________ 138<br />
Results______________________________________________________________________________ 143<br />
Discussion___________________________________________________________________________ 149<br />
Acknowledgements____________________________________________________________________ 155<br />
References___________________________________________________________________________ 155<br />
Soil respiration in alpine tundra: impacts of seasonal snow cover and soil carbon content<br />
161<br />
Abstract_____________________________________________________________________________ 163<br />
Introduction__________________________________________________________________________ 164<br />
Materials and methods _________________________________________________________________ 166<br />
Results______________________________________________________________________________ 172<br />
Discussion___________________________________________________________________________ 178<br />
Acknowledgements____________________________________________________________________ 181<br />
References___________________________________________________________________________ 181<br />
Tannin impacts on microbial diversity and the functioning of alpine soils: a<br />
multidisciplinary approach. ________________________________________________ 189<br />
SYNTHESE ET PERSPECTIVES _____________________________________ 203<br />
A. Introduction ________________________________________________________ 205<br />
B. The interplay of direct and indirect effects on ecosystem processes __________ 207<br />
1) Features of ecosystem models and methodological considerations _________________________ 207<br />
2) Plant functional diversity and ecosystem processes _____________________________________ 209<br />
3) The need to integrate a new set of plant traits to predict ecosystem functioning? ______________ 214<br />
12
C. Linkages between carbon and nutrient cycling. The role of soil microbial<br />
communities _____________________________________________________________ 217<br />
1) Links between plants, microbial populations and N availability in alpine tundra_______________ 217<br />
2) The need for the integration of microbial community dynamics in biogeochemical models ______ 221<br />
D. Conclusions ________________________________________________________ 223<br />
1) Control of carbon cycling in alpine tundra ____________________________________________ 223<br />
2) Impact of global changes in alpine ecosystems : a case study of the Lautaret region____________ 226<br />
E. Perspectives ________________________________________________________ 228<br />
BIBLIOGRAPHIE__________________________________________________ 233<br />
ANNEXES _______________________________________________________ 247<br />
Annexe 1________________________________________________________________ 249<br />
Annexe 2________________________________________________________________ 251<br />
13
Contexte, problématique et méthodologie<br />
Description du cadre de l’étude<br />
Introduction<br />
15
INTRODUCTION<br />
A. Contexte et problématique de l’étude ____________________________________ 17<br />
1) Flux et stocks de carbone __________________________________________________________ 18<br />
2) Enneigement et changement climatique _______________________________________________ 19<br />
3) Enneigement et cycle du carbone dans les systèmes alpins ________________________________ 23<br />
4) Les traits fonctionnels comme outils de changement d’échelle _____________________________ 28<br />
5) Interaction entre les cycles de l’azote et du carbone : Influence sur les processus écosystémiques ?_ 31<br />
B. Objectifs et hypothèses de travail _______________________________________ 34<br />
C. Organisation du document _____________________________________________ 37<br />
D. Présentation du site d’étude ____________________________________________ 40<br />
1) Les conditions climatiques _________________________________________________________ 41<br />
2) La nature du substrat ______________________________________________________________ 44<br />
3) Les conditions édaphiques _________________________________________________________ 45<br />
4) Les groupements végétaux du site d’étude _____________________________________________ 47<br />
16
Introduction Contexte et problématique de l’étude<br />
A. Contexte et problématique de l’étude<br />
Introduction<br />
Au sein des écosystèmes froids, la sévérité du climat limite la dégradation de la matière<br />
organique entraînant l’accumulation dans le compartiment souterrain de quantités<br />
considérables de carbone (Post et al. 1982, Boskheim et al. 1999, Körner 1999). En dépit<br />
d’une faible densité de population dans ces régions froides (montagnes, régions arctiques), la<br />
menace d’un réchauffement climatique a récemment suscité un regain d’intérêt pour ces<br />
systèmes. En effet, l’augmentation de la température, en activant les processus de dégradation<br />
de la matière organique, conduit actuellement à la libération de ce carbone dans l’atmosphère<br />
sous forme de dioxyde de carbone et ce gaz à effet de serre pourrait fortement accentuer le<br />
réchauffement climatique (Oechel et al. 1993). Face à ce constat, les scientifiques tentent<br />
depuis une dizaine d’année de préciser les conséquences de cette boucle de rétroaction<br />
positive sur la dynamique globale du climat. Différents types de modèle, tels que les modèles<br />
de circulation générale ou les modèles atmosphériques inverses ont été appliqués dans ce but,<br />
mais les prédictions demeurent largement incertaines (IPCC 2007). En effet, l’enneigement, la<br />
présence du permafrost dans les systèmes arctiques (sol gelé en permanence) et la<br />
méconnaissance des processus microbiens compliquent fortement l’analyse des flux entre la<br />
biosphère des milieux froids et l’atmosphère. De fait, le comportement puits vs. sources de ces<br />
écosystèmes 1 est difficile à évaluer (McGuire et al. 2006).<br />
Chaque année la neige recouvre plus de la moitié de l’hémisphère nord. Dans les<br />
systèmes alpins (voir définition plus loin) ou arctiques où la durée de la saison hivernale<br />
atteint 200 à 300 jours par an, cette saisonnalité régule les flux de carbone. Par exemple, la<br />
présence de la neige affecte la fixation du carbone en modulant la longueur de la saison de<br />
végétation ou la respiration hétérotrophique (respiration des microorganismes du sol) via son<br />
action sur les conditions édapho-climatiques (climat du sol). Ainsi, au même titre que la<br />
température, l’enneigement conditionne les échanges du carbone entre le sol et<br />
l’atmosphère dans les écosystèmes froids. En particulier, un changement du régime des<br />
précipitations neigeuses pourrait modifier l’équilibre source-puits de ces systèmes.<br />
C’est dans ce contexte que les scientifiques se sont récemment intéressés à l’impact de<br />
1 Bilan annuel positif - accumulation de carbone - vs. négatif - libération de carbone<br />
17
Introduction Contexte et problématique de l’étude<br />
l’enneigement sur les flux biogéochimiques (i.e. flux de matière au sein d’un écosystème,<br />
d’un biome ou à l’échelle du globe). Les écosystèmes arctiques ont notamment fait l’objet de<br />
nombreuses expérimentations, à des échelles diverses, mettant en évidence le rôle<br />
fondamental de la neige ainsi que les forçages exercés par celle-ci sur certains processus, tel<br />
que la minéralisation du carbone ou de l’azote (Walker et al. 1999, Welker et al. 2000,<br />
Schimel et al. 2004). Etonnamment, très peu d’études ont été menées au sein des systèmes<br />
alpins. Or en dépit d’une forte convergence floristique et écologique, les conditions hydriques<br />
ainsi que le bilan radiatif diffèrent fortement et limitent l’extrapolation des résultats obtenus<br />
en arctique (Körner 1999, Walker et al. 1999). Par ailleurs, les scénarios climatiques prévoient<br />
une diminution de l’enneigement hivernal aux latitudes moyennes contrairement aux systèmes<br />
arctiques où un renforcement des précipitations est attendu (Serreze et al. 2000, Dye and<br />
Tucker 2003, Beniston 2005). Ainsi, au regard des modifications des régimes d’enneigement<br />
prédits par les différents modèles climatiques, une étude visant à expliciter les interactions<br />
entre neige et processus dans les systèmes alpins s’avère nécessaire afin d’évaluer le devenir<br />
des flux et des stocks de carbone contenus dans ces sols.<br />
1) Flux et stocks de carbone<br />
Au sein des systèmes continentaux, les stocks de carbone organique sont<br />
principalement localisés dans les sols (1500 Pg 2 ), la végétation ne séquestrant que 500 Pg de<br />
carbone. Cette accumulation de carbone est régie par les flux entrants via la photosynthèse et<br />
les flux sortants via la respiration autotrophique et hétérotrophique (Fig. 1). Les<br />
microorganismes du sol, en dégradant la litière, libèrent rapidement une partie du carbone<br />
dans l’atmosphère sous forme de CO2, mais, selon les écosystèmes, une proportion plus ou<br />
moins importante de ce carbone demeure sous forme de matière organique récalcitrante.<br />
D’autres flux de carbone liés à l’herbivorie ou au lessivage contribuent à modifier l’équilibre<br />
source-puits des écosystèmes, mais leur importance est moindre (Fig. 1). Dans cette étude<br />
nous nous sommes donc principalement focalisé sur la production primaire nette et brute du<br />
compartiment aérien (GPP et ANPP, respectivement Gross Primary Production et<br />
Aboveground Net Primary Productivity) et la minéralisation du carbone par les<br />
microorganismes (Fig. 1, R).<br />
Ces flux sont régulés par des facteurs abiotiques et biotiques. La fixation du carbone<br />
2 1500Pg = 1500×10 15 gC<br />
18
Introduction Contexte et problématique de l’étude<br />
est dépendante des conditions climatiques, telles que la température de l’air, la lumière, l’eau<br />
ou encore la durée de la saison de végétation. Elle dépend également des propriétés des<br />
canopées (Leaf Area Index ou LAI, distribution des angles des feuilles dans la canopée),<br />
puisque celles-ci déterminent l’efficacité d’interception de la lumière (Anten 2005). De façon<br />
similaire, la décomposition des litières et la respiration des sols sont régulées par la<br />
température et l’humidité mais aussi par la quantité et la qualité des litières (Joffre and Agren<br />
2001).<br />
Ainsi, les forçages climatiques agissent à court terme en modifiant la réponse physiologique<br />
des organismes vivants via la modification des conditions édaphoclimatiques (i.e. action sur la<br />
cinétique enzymatique, effets directs) et à long terme à travers un changement de composition<br />
et de structure des communautés végétales (effets indirects).<br />
1.5 gT C/yr<br />
CO 2<br />
Carbon losses off site<br />
R (grazing animals)<br />
Animals<br />
grazing<br />
NPP<br />
NPP<br />
103 gT C/yr<br />
CO 2<br />
GPP<br />
growth<br />
New<br />
phytomass<br />
Old<br />
Mortality<br />
Mannure<br />
NBP<br />
NEP (=NEE)<br />
CO 2<br />
R (leaves) R (roots)<br />
Litter<br />
Soil Soil respiration<br />
respiration<br />
50 gT C/yr 10 gT C/yr<br />
CO 2<br />
CO 2<br />
R (litter)<br />
SOM<br />
Active<br />
Passive<br />
R (SOM)<br />
Introduction Contexte et problématique de l’étude<br />
du rayonnement solaire et donc le réchauffement du sol (Groisman and Davies 2000). Ce<br />
pouvoir isolant est à l’origine d’un gradient thermique entre le sol relativement chaud et la<br />
surface réfléchissante froide, et permet de maintenir la température des sols aux alentours de<br />
0°C quel que soit le régime thermique atmosphérique (Fig. 2). Il semblerait qu’une épaisseur<br />
de 15 à 30 cm suffise à l’établissement de ce gradient et, de ce fait, de nombreux organismes<br />
sont protégés des températures extrêmes durant l’hiver. De même, une activité respiratoire<br />
peut se maintenir sous le couvert neigeux, sous réserve de l’effet d’autres facteurs limitants<br />
(substrat par exemple) (Groisman and Davies 2000).<br />
D’autre part, la productivité des écosystèmes montagnards est fortement reliée à<br />
l’enneigement via la longueur de la saison de végétation, mais également via l’apport en<br />
minéraux (azote en particulier) et en eau (Tranter and Jones 2000). Walker et al. (1995)<br />
suggèrent que cet apport nutritionnel est critique pour la croissance de la végétation,<br />
notamment lorsque la saison de végétation est fortement réduite. D’un point de vue physique,<br />
l’eau de fonte permet pour un niveau de nutriments similaire, d’augmenter la diffusion des<br />
minéraux dans le sol et de stimuler l’absorption racinaire (Chapin et al. 1988). En modifiant la<br />
fertilité et la longueur de la saison de végétation, les durées d’enneigement affectent<br />
profondément la distribution des communautés végétales et sélectionnent des espèces à<br />
croissance lente dans les zones déneigées et infertiles et des espèces à croissance rapide dans<br />
les zones plus enneigées et plus fertiles (Choler 2005).<br />
Ainsi, en modifiant le régime thermique et hydrique des sols, ainsi que la durée de la<br />
saison de végétation et la fertilité des sols, la neige affecte les flux biogéochimiques au sein<br />
des écosystèmes montagnards (Tranter and Jones 2000).<br />
Incoming<br />
solar<br />
radiation<br />
and<br />
reflected<br />
Incoming<br />
I.R.<br />
radiation<br />
rain snow<br />
Outgoing<br />
I.R.<br />
Sensible &<br />
Latent<br />
Heat fluxes<br />
Wind<br />
radiation<br />
- Conduction<br />
- Melting/refreeezing<br />
- Percolation<br />
- Metamorphosis<br />
- Settling<br />
Snow cover<br />
melt runoff Ground heat flux<br />
Ground<br />
Fig. 2 Schéma conceptuel des flux de masse et<br />
d’énergie contrôlant le budget énergétique, la<br />
structure et les propriétés de la couverture<br />
neigeuse. I.R. : Infra-Rouge. Source : Pomeroy &<br />
Brun (2000).<br />
20
Introduction Contexte et problématique de l’étude<br />
A une échelle globale, d’autres études ont montré que la cryosphère, la biosphère et<br />
l’atmosphère sont intimement reliées et qu’une modification des précipitations neigeuses peut<br />
affecter l’ensemble des écosystèmes terrestres. Par exemple, des précipitations neigeuses<br />
accrues sur le plateau Tibétain ont pour effet de retarder et de limiter l’impact de la mousson<br />
indienne (Barnett et al. 1989). De même, une réduction des surfaces enneigées au niveau du<br />
pôle nord limiterait l’émission des rayonnements infrarouges vers l’atmosphère, entraînant<br />
une hausse des températures à la surface du globe terrestre (Chapin et al. 2005).<br />
L’enneigement joue donc un rôle crucial tant à l’échelle locale ou régionale qu’à l’échelle<br />
globale.<br />
Actuellement, de nombreuses études tentent d’évaluer quelle sera l’évolution des<br />
régimes de précipitations en lien avec le réchauffement climatique. Les scénarios avancés sont<br />
beaucoup moins clairs que ceux qui concernent la température et un rapide retour sur les<br />
outils permettant d’élaborer ces prédictions s’avère utile. Les indices d’anomalie de pression<br />
atmosphérique, tel que le NAO (North Atlantic Oscillation) dans l’hémisphère nord ou le SO<br />
(Southern Oscillation) dans l’hémisphère sud, sont de bons indicateurs des régimes de<br />
précipitations. Le NAO est une différence de pression normalisée entre les Açores et<br />
l’Islande, deux centres d’action primaire de la circulation atmosphérique de l’hémisphère<br />
nord. Le SO représente la composante atmosphérique de l’ « El Niño Southern Oscillation »<br />
(ENSO), c'est-à-dire la différence de pression normalisée entre Tahiti et Darwin (en<br />
Australie). Une valeur positive du NAO signifie que les vents de surface tendent à être<br />
orientés Nord-Est en direction du Groenland et du Canada et elle est associée à des anomalies<br />
de température négatives. Les vents orientés Sud-Ouest apportent, quant à eux, douceur et<br />
humidité dans le nord de l’Europe et en Scandinavie. Ces vents sont généralement associés à<br />
des faibles précipitations et des températures relativement douces, notamment de la fin de<br />
l’automne jusqu’au début du printemps (Serreze et al. 2000). En dépit d’une très forte<br />
variabilité interannuelle, le NAO est dans une phase positive depuis les années 1970, et de<br />
façon plus marquée depuis les années 80 (Hurrell 1995). A l’échelle régionale, Beniston<br />
(2005 pour une revue) détecte les mêmes tendances depuis les années 80, et relie de façon très<br />
satisfaisante cet indice à une diminution du régime des précipitations neigeuses dans les Alpes<br />
Suisses (Fig. 3-4).<br />
21
Introduction Contexte et problématique de l’étude<br />
Fig. 3 Série temporelle sur 50 ans de la<br />
pression atmosphérique hivernale<br />
moyenne et de la durée de la saison<br />
hivernale dans deux sites alpins (dans<br />
les Alpes suisses à Davos et dans les<br />
montagnes du Montana aux USA), pour<br />
une profondeur moyenne de neige de<br />
1m. Source : Beniston (2005).<br />
Fig. 4 Série temporelle centennale de<br />
l’évolution de l’index NAO et des<br />
températures minimales (décembre,<br />
janvier, et février) à Säntis (2500m au<br />
dessus du niveau de la mer, Suisse).<br />
Source : Beniston (2005)<br />
Par ailleurs, les images satellites disponibles depuis 1972 permettent de suivre assez<br />
précisément l’évolution des surfaces enneigées à l’échelle continentale. Depuis le début des<br />
années 80, le NOAA (National Oceanic and Atmospheric Administration) a observé une<br />
diminution de l’enneigement d’environ 10% que ce soit sur le continent Nord-Américain, ou<br />
en Eurasie : ceci étant en relation étroite avec une fonte plus précoce au printemps et une<br />
modification du ratio pluie : neige. De même, la hausse de température, particulièrement<br />
marquée dans les hautes et moyennes latitudes, a déjà été reliée à une modification de la<br />
quantité et de la saisonnalité des précipitations neigeuses (Fig. 5, Noguès-Bravo et al. 2007).<br />
Ainsi les systèmes montagnards situés à des latitudes moyennes subissent d’ores et<br />
déjà une diminution des précipitations neigeuses qui se caractérise par un retard de<br />
l’enneigement en automne et une fonte des neiges de plus en plus précoce (Messerli and Ives<br />
1999). Dans les Alpes, ces effets sont largement visibles à moyenne altitude (1300m) et des<br />
tendances sont déjà observables à plus haute altitude (Laternser and Schneebeli 2003). Dans<br />
le futur, l’augmentation de la température devrait accélérer ce phénomène.<br />
22
Introduction Contexte et problématique de l’étude<br />
Fig. 5 Réchauffement prédit pour 2055 selon le scénario économique B1 (IPCC 2007). Un gradient<br />
latitudinal du réchauffement climatique est observable des systèmes arctiques et boréaux vers les<br />
systèmes tropicaux. Source : Noguès-Bravo et al. (2007).<br />
3) Enneigement et cycle du carbone dans les systèmes alpins<br />
Spécificité des systèmes de haute montagne<br />
L’étymologie du mot alpin est « alp », terme Kimri (dialecte Gaulois) qui signifie<br />
roches escarpées. Dès l’an -100 av. JC, ce terme était utilisé couramment pour définir la<br />
chaîne montagneuse au nord de l’Italie. Par la suite, l’utilisation de ce mot s’est généralisée à<br />
l’ensemble des chaînes de montagne du monde initiant de nombreux débats sur la définition<br />
même « d’alpin » ou « chaîne alpine ». En effet, les termes tels que "Pyrénéisme",<br />
"Andinisme" ou "Himalayisme" voire, en Pologne, "Tatrisme" sont couramment utilisés dans<br />
le monde des sports de montagne. Dans le domaine des sciences, les géologues définissent le<br />
système alpin « comme toutes les chaînes de montagne formées durant le cycle orogénique<br />
alpin et s’étendant sur l’ensemble des ères secondaires et tertiaires, pendant les 225 derniers<br />
millions d’années » (Favarger and Robert 1995). En biogéographie, l’adjectif alpin s’applique<br />
couramment à l’étage asylvatique (zone située au delà de la limite potentielle des forêts, fig.<br />
6a) de toutes les hautes montagnes du globe. Le déterminisme principal de l’étagement<br />
altitudinal de la végétation est la température (Körner 1999). C'est à Alexander Von<br />
Humboldt (1769-1859) que l'on attribue la compréhension des mécanismes à l’origine de la<br />
répartition des végétaux le long de ce gradient. En observant les flancs du mont Chimborazo<br />
en Equateur, il avait remarqué l'étagement de la végétation et s'était le premier interrogé sur la<br />
cause de cette répartition (Fig 6b).<br />
23
Introduction Contexte et problématique de l’étude<br />
Fig. 6 (a) Étagement de la végétation dans les Alpes du Dauphine. Source : <strong>Station</strong><br />
<strong>Alpine</strong> <strong>Joseph</strong> <strong>Fourier</strong>. (b) Etagement de la végétation sur les flancs du Chimborazo<br />
(Humbold).<br />
À cette époque, l'explication la plus évidente reposait sur les variations climatiques en<br />
fonction de l'altitude. Humboldt avait également étudié la question des zones circumterrestres<br />
de végétation en fonction des latitudes (toundra, taïga, forêt, etc.), et abouti à la même<br />
conclusion : « l'ensemble des facteurs physiques propres aux différents climats semblait être<br />
la cause essentielle de la répartition des végétaux à la surface de la Terre » (Humboldt<br />
Bonpland 1807 3 ). Une forte convergence évolutive des communautés végétales se succédant<br />
le long du gradient altitudinal (on parlera d’étagement) et latitudinal (zonalité) est aujourd’hui<br />
largement admise. L’étage alpin n’est donc pas uniquement représenté dans les systèmes de<br />
haute altitude mais aussi de hautes latitudes (Ozenda 2002). De façon générale on parlera<br />
donc de toundras alpines et arctiques.<br />
Les montagnes sont réparties dans le monde entier et représentent plus de 20% de la<br />
surface du globe (Beniston and Fox 1996). D’après Körner (1999), les toundras alpines et<br />
arctiques couvriraient une surface de 4.5 millions de km 2 entre les parallèles 70°N et 60°S,<br />
soit 3% des terres émergées. La durée de la saison hivernale est de façon générale assez<br />
3<br />
Voyage aux régions équinoxiales du Nouveau Continent, fait en 1799, 1800, 1801, 1803 et 1804 par Alexandre de Humboldt et Aimé<br />
Bonpland (30 volumes), rédigé par A. de H., Paris, 1807 et années suivantes.<br />
Les 14 premiers volumes sont consacrés à la botanique, le XV et XVI forment: Vues de cordillères et monuments des peuples anciens de<br />
l'Amérique (réédité dans la Collection "Memoria Americana", dirigée par Charles Minguet et Jean-Paul Duviols), le XVIIe, l'Atlas<br />
géographique et physique, le XVIIIe, L'Examen critique de l'histoire et de la géographie du Nouveau Monde, le XIXe, L'Atlas géographique<br />
et Physique, le XXe Géographie des plantes équinoxiales, le XXI et XXIIeme, Recueil d'observations astronomiques, le XXIII et XXIV,<br />
Recueil d'observations de zoologie et d'anatomie comparée, les XXV et XXVI, L'essai politique sur le royaume de la Nouvelle Espagne, le<br />
XXVII, Essai sur la géographie des plantes ( réédité dans "Memoria Americana"), les volumes XXVIII à XXX, La relation historique du<br />
voyage aux régions équinoxiales du Nouveau Continent, dont la dernière partie a été édité à part sous le titre de Essai politique sur l'île de<br />
Cuba.<br />
24
Introduction Contexte et problématique de l’étude<br />
longue (>200 jours) mais varie fortement le long du gradient latitudinal et altitudinal<br />
(Beniston and Fox 1996). Malgré leur superficie relativement faible, les montagnes affectent<br />
le système climatique dans sa globalité. En tant qu’obstacle physique à la circulation<br />
atmosphérique, elles perturbent l’écoulement de l’air et sont considérée comme l’un des<br />
facteurs de la cyclogénèse dans les latitudes moyennes (Beniston and Fox 1996). Les<br />
montagnes, sources d’un grand nombre de réseaux hydrographiques de la planète et berceaux<br />
de nombreux glaciers, constituent également un élément essentiel du cycle de l’eau. Par<br />
ailleurs, la sévérité du climat a fortement contraint la productivité de ces systèmes ainsi que la<br />
décomposition de la matière organique et le déséquilibre entre ces flux a conduit à<br />
l’accumulation de carbone dans les sols. Les quelques études tentant d’évaluer les stocks de<br />
carbone séquestrés dans les sols de montagne rapportent des valeurs aussi élevées que dans<br />
les systèmes arctiques (Tableau 1) (Becker and Bugmann 2001).<br />
Formation végétale Localisation<br />
Pelouse alpine<br />
Prairie de fauche<br />
Prairie pâturée<br />
Forêt résineuse<br />
Landes<br />
Prairies de montagne<br />
Toundra alpine<br />
Toundra mésophile<br />
Toundra hygrophile<br />
Plan de Tueda (Alpes,<br />
France)<br />
Chine centrale<br />
Plateau Haibei (Chine)<br />
Moyenne dans le monde<br />
Sols de montagne<br />
France<br />
Tableau 1 Stocks de carbone dans les sols arctiques et de montagne<br />
Stock de carbone<br />
(kg C m -2 )<br />
9.3<br />
12.3<br />
13.6<br />
18.2<br />
18.2<br />
32.4<br />
18.2<br />
10.9<br />
20.7<br />
>10.0<br />
Références<br />
(Dobremez and Eynard-<br />
Machet 1997)<br />
(Zhou et al. 2003)<br />
(Kato et al. 2006)<br />
(Zinke et al. 1998)<br />
(Arrouays et al. 2002)<br />
Au-delà du bilan radiatif, les toundras alpines se distinguent des toundras arctiques par<br />
leur orographie. En effet le relief accidenté en montagne est à l’origine d’une forte<br />
hétérogénéité spatiale qui gouverne à la fois le bilan radiatif et la distribution de la neige tant à<br />
l’échelle régionale que locale (Billings 1973, Körner 1999, Walker et al. 2000). La<br />
macrotopographie, c'est-à-dire la variation du relief sur une échelle d’ordre kilométrique, est à<br />
l’origine de fortes variations en termes de rayonnement solaire. L’opposition typique entre les<br />
faces sud (adret) et les faces nord (ubac) illustre très bien ce phénomène (Fig. 7).<br />
25
Introduction Contexte et problématique de l’étude<br />
Hiver Printemps Été - Automne<br />
Fig. 7 Opposition entre l’adret et l’ubac. Montagne de Chaillol, Région du Lautaret (2058 m). (Photo : S ;<br />
Aubert).<br />
La mésotopographie (variation de la topographie sur des distances inférieures à 100m,<br />
Billings 1973) est à l’origine de différences importantes d’enneigement entre des zones<br />
convexes et des zones concaves (Fig. 8 et 12). Il s’agit là de l’opposition ancienne entre un<br />
alpin dit « thermique » et un alpin dit « nival » (Aubert et al. 1965) 4 .<br />
La distribution des communautés végétales est fortement liée à la longueur de la saison<br />
de végétation (Walker et al. 1993) et de fait, « gradient de mésotopographie » et « gradient<br />
d’enneigement » sont en général utilisés en synonymie. De nombreuses études ont analysé la<br />
distribution de la diversité végétale le long de ce gradient (Billings and Bliss 1959, Friedel<br />
1961, Billings 1973, Flock 1978, Bell and Bliss 1979, Walker et al. 1993, Choler 2005). Tous<br />
ces auteurs soulignent un important « turn-over » des espèces sur des distances très faibles<br />
formant une mosaïque complexe le long du gradient d’enneigement (Fig. 9). Les limites de<br />
ces communautés végétales et les dates moyennes de fonte des neiges sont fortement corrélées<br />
(Fig. 9).<br />
Fig. 8 Les contrastes thermiques liés à la méso- et<br />
microtopographie sont aussi marqués que ceux qui<br />
sont observés le long du gradient altitudinal. Source :<br />
Körner (1999).<br />
4 Les expressions « Early snowmelt locations » et « late snowmelt locations » sont les appellations<br />
correspondantes dans les articles de cette thèse.<br />
26
Introduction Contexte et problématique de l’étude<br />
Aravo, Alpes Françaises<br />
Alpin thermique<br />
Alpin nival<br />
Fig. 9 Cartographie des dates de déneigement (jour julien) à Aravo prés du col du Galibier dans les Alpes<br />
Françaises (panel gauche) et description des espèces dominantes des groupements végétaux associés à ces<br />
dates de déneigement (panel droit). Source : Choler (2005).<br />
Cette forte hétérogénéité spatiale a limité la mise en œuvre de certaines techniques<br />
d’étude et ce n’est que dernièrement que des travaux, menés dans des systèmes moins<br />
accidentés comme le plateau Tibétain, ont tenté d’évaluer l’état source-puits des systèmes<br />
alpins (Gu et al. 2005, Kato et al. 2005, Kato et al. 2006, Zhao et al. 2006). En effet, la plupart<br />
des modèles de circulation générale possèdent à l’échelle du globe une résolution spatiale<br />
limitée et ne peuvent prendre en compte les variations topographiques de l’ordre d’une<br />
centaine de mètres ou même du km. De même, jusqu’à récemment, les techniques d’Eddy<br />
covariance 5 n’étaient pas adaptées pour mesurer les échanges de carbone dans ces systèmes<br />
car une partie trop importante des flux de CO2 s’écoule le long des pentes et n’était donc pas<br />
détectée par les tours à flux (mais voir Hammerle et al. 2007).<br />
Par ailleurs, les études réalisées dans l’arctique visant à évaluer l’impact de la neige<br />
sur la minéralisation du carbone et de l’azote se sont basées sur des expérimentations<br />
relativement courtes (Brooks and Williams 1999, Groffman et al. 2001a, 2001b, Monson et al.<br />
2006). Dans ce contexte, seuls les effets directs étaient examinés i.e. modification des<br />
conditions édaphoclimatiques. Or, même si une modification des conditions<br />
5 Eddy covariance : méthode statistique permettant d’évaluer les flux de carbone sur de larges surfaces. Le<br />
système d’Eddy Covariance comprend un anémomètre ultrasonique et un IRGA (Infra Red Gaz Analyzer) fixé<br />
en haut d’une tour à flux.<br />
27
Introduction Contexte et problématique de l’étude<br />
édaphoclimatiques agit de façon transitoire sur le fonctionnement des écosystèmes, les<br />
processus biogéochimiques sont largement régulés par les rétrocontrôles et les interactions<br />
indirectes exercées par la végétation et les populations microbiennes (Norby and Luo 2004,<br />
Rustad 2006). En effet, l’enneigement en contrôlant la longueur de la saison de végétation et<br />
la fertilité influence indirectement la composition spécifique des communautés végétales. Un<br />
changement de diversité pourrait ainsi affecter le recyclage du carbone indépendamment des<br />
conséquences liées aux variations des conditions édaphoclimatiques.<br />
Ainsi dans les systèmes enneigés, les modes de régulation des flux de carbone n’ont pas<br />
été identifiés et, de façon générale, la hiérarchisation des effets directs et indirects exercés par<br />
la neige et leur contrôle de la productivité des communautés végétales et de la décomposition<br />
des litières dans les systèmes froids est encore largement débattue (Hobbie et al. 2000,<br />
Grogan and Jonasson 2006). Quelques travaux ont abordé cette problématique dans les<br />
systèmes arctiques (i.e. travaux sur la respiration hétérotrophique, Elberling et al. 2004,<br />
Grogan and Jonasson 2006, Elberling 2007) mais, à notre connaissance, aucune étude<br />
n’a tenté d’évaluer les contrôles directs et indirects exercés par la neige sur le recyclage<br />
du carbone dans les systèmes de montagne et notamment les systèmes alpins (Edwards<br />
et al. 2007).<br />
Récemment, des études ont mis en évidence l’intérêt d’utiliser les caractéristiques<br />
fonctionnelles de la végétation afin de prédire le fonctionnement d’un écosystème (Lavorel &<br />
Garnier, 2002). La description du cadre dans lequel s’est inscrite cette étude fait l’objet de la<br />
partie suivante.<br />
4) Les traits fonctionnels comme outils de changement d’échelle<br />
Des études récentes en écologie des communautés ont mis en évidence la pertinence<br />
d’agréger les espèces végétales selon des critères fonctionnels plutôt que selon des critères<br />
phytosocioécologiques (Chapin et al. 1996, Woodward and Cramer 1996, Lavorel et al.<br />
1997). Ces groupes fonctionnels se définissent comme des ensembles d’espèces ayant une<br />
réponse similaire aux pressions environnementales et/ou ayant un effet similaire sur le<br />
fonctionnement des écosystèmes, tel que la productivité primaire ou la décomposition<br />
(Lavorel and Garnier 2002). Ils se définissent sur la base de traits d’histoire de vie partagés<br />
(i.e. traits fonctionnels). Ces derniers correspondent aux caractéristiques morphologiques,<br />
éco-physiologiques, biochimiques ou reproductives d’un organe ou de la plante entière<br />
(Chapin et al. 1996, Hodgson et al. 1999, Weiher et al. 1999). Les traits dits « hard » sont des<br />
28
Introduction Contexte et problématique de l’étude<br />
traits dont la mesure requiert une haute technicité (Tableau 2). Ce sont par exemple des traits<br />
en relation directe avec le métabolisme des plantes, comme la conductance stomatique ou le<br />
taux d’assimilation d’azote mais leur mesure à grande échelle est difficilement envisageable.<br />
Les traits « soft » sont plus faciles à acquérir et sont corrélés avec les traits « hard » (Reich et<br />
al. 1999). On définit par ailleurs les traits de réponse comme des adaptations morphologiques<br />
ou écophysiologiques des plantes en réponses aux contraintes environnementales (Fig. 10).<br />
La composition fonctionnelle (ou diversité fonctionnelle), c'est-à-dire l’identité,<br />
l’abondance et la variation des traits fonctionnels au sein d’une communauté végétale, permet<br />
de s’affranchir des distinctions taxonomiques et facilite les études comparatives entre<br />
systèmes. Récemment des études de grande ampleur ont mis en évidence un schéma universel<br />
de gestion des ressources (Wright et al. 2004). Il est ainsi possible de situer les espèces<br />
végétales le long d’un gradient d’exploitation vs. conservation des nutriments : les espèces<br />
végétales situées dans les systèmes fertiles sont caractérisées par un taux de croissance élevé<br />
et un renouvellement rapide des tissus (Specific Leaf Area ou SLA élévé, Leaf Nitrogen<br />
Content ou LNC élevé), à la différences de celles situées dans des habitats infertiles.<br />
La théorie proposée par Grime ("the biomass ratio hypothesis", 1998) stipule que le<br />
fonctionnement de l’écosystème peut être prédit à partir des valeurs de traits des espèces<br />
dominantes pondérées par leur abondance relative dans la communauté végétale. Selon la<br />
nouvelle terminologie proposée par Violle et al. (2007), cet index se traduit formellement par<br />
la relation suivante :<br />
= CFP<br />
n<br />
∑<br />
k=<br />
1<br />
k ⋅ T A<br />
k<br />
La valeur du trait T dans la communauté (CFP, Community Functional<br />
Parameter) est égale à la somme de la valeur du trait pondérée par l’abondance<br />
des k espèces de la communauté. Terminologie française : trait agrégé.<br />
Garnier et al. (2004), Garnier et al.(2007) et Quétier et al. (2007) ont montré que les<br />
traits foliaires agrégés (SLA, LDMC et LNC) permettaient de prédire de façon satisfaisante<br />
l’ANPP (et/ou ANPP spécifique), la production de litière ou encore les taux de décomposition<br />
mesurés in situ. De façon similaire, la décomposabilité des litières semble être fortement<br />
corrélée au taux de matière sèche des feuilles (LDMC agrégé), ainsi qu’au ratio N/[lignine]<br />
(Kazakou 2006). Enfin, cette méthodologie a également pu être appliquée dans l’objectif de<br />
prédire l’impact d’un changement d’utilisation des terres sur certains services rendus par les<br />
écosystèmes tels que la production de biomasse ou encore le maintien de la fertilité des sols<br />
29
Introduction Contexte et problématique de l’étude<br />
(Diaz et al. 2007).<br />
Fonction « Hard traits » « Soft Traits »<br />
Interception de la<br />
lumière<br />
Efficience de la<br />
photosynthèse<br />
Efficacité d’utilisation<br />
de l’eau<br />
Modélisation<br />
Mesure de l’assimilation (IRGA) 6<br />
Hauteur végétative<br />
LAI (Leaf Area Index)<br />
SLA (Specific Leaf Area)<br />
LDMC (Leaf Dry Matter Content)<br />
LNC (Leaf Nitrogen Content)<br />
Conductance stomatique (IRGA) Durée de vie des feuilles<br />
Taux de croissance RGR (Relative growth rate)<br />
Allocation entre<br />
compartiment aérien et<br />
souterrain<br />
Absorption des<br />
nutriments<br />
Résorption des<br />
nutriments<br />
Marquage 13/14 C pour suivre le devenir<br />
du carbone dans la plante et estimer les<br />
flux entre compartiments<br />
Marquage court 15 N<br />
Traits foliaires (SLA, LDMC, LNC)<br />
Traits racinaires :<br />
SRL : Specific Root Length<br />
RNC : Root Nitrogen Content<br />
Masse racinaire/masse aérienne<br />
(Root:Shoot ratio)<br />
Diamètre des racines, proportion de<br />
racine fines, SRL<br />
Marquage long 15 N Traits foliaires (SLA, LNC de la litière)<br />
Exudation Marquage 13/14 C SRL<br />
Respiration foliaire et<br />
racinaire<br />
Décomposabilité<br />
Mesure de la respiration (IRGA) LNC et RNC<br />
Mesure de perte de masse<br />
Respiration (IRGA)<br />
LDMC, C/N, N/lignine<br />
N/Polyphénol<br />
RNC<br />
RDT (Root Tissue Density)<br />
Tableau 2 Exemples de traits « softs » et « hards » en lien avec les processus écosystémiques (C,N). Sources :<br />
Reich et al. (1999), Weiher et al.(1999), Quested et al (2007). et Kazakou (2006). Voir Roumet et al. (2006) pour<br />
une revue sur les traits racinaires.<br />
Ainsi, à la fois révélateurs des pressions environnementales et acteurs potentiels au<br />
sein de l’écosystème, les traits fonctionnels sont actuellement considérés comme des outils<br />
pertinents pour prédire la performance des espèces dans leur environnement et leur impact sur<br />
le fonctionnement des écosystèmes (Fig. 10).<br />
C’est dans ce cadre méthodologique que nous nous proposons d’appréhender les<br />
contrôles indirects exercés par l’enneigement (i.e. impact liés à la diversité fonctionnelle<br />
végétale) sur le cycle du carbone des écosystèmes alpins.<br />
6 IRGA : Infra Red Gaz Analyser. Appareil permettant la mesure des flux d’eau et de CO2<br />
30
Introduction Contexte et problématique de l’étude<br />
Fig. 10 Diagramme conceptuel permettant l’articulation des effets des conditions<br />
environnementales sur les processus écosystémiques via l’impact sur les communautés végétales.<br />
Source : Lavorel and Garnier (2002).<br />
5) Interaction entre les cycles de l’azote et du carbone : Influence sur les<br />
processus écosystémiques ?<br />
Le recyclage du carbone dans un système ne peut être découplé des processus de<br />
minéralisation de l’azote. Les corrélations mises en évidence entre traits fonctionnels et<br />
vitesse de recyclage du carbone sont généralement sous-tendues par la disponibilité des<br />
ressources (Chapin et al. 1993a). Le compromis fonctionnel associé à la gestion des<br />
nutriments et du carbone est en effet directement associé au taux de minéralisation azotée.<br />
Une faible disponibilité en azote limite la production de biomasse et contribue à la création de<br />
tissus récalcitrants (C/N élevé, [lignine] élevée) affectant en retour le taux de minéralisation<br />
de la matière organique (C, N). Cette boucle de rétroaction positive demeure tant que les<br />
plantes dépendent des organismes saprophytes dans l’acquisition de l’azote minéral. Elle<br />
illustre dans quelle mesure les processus écosystémiques, modulés par la diversité<br />
fonctionnelle des communautés végétales, agissent en retour sur la structuration de ces mêmes<br />
communautés. Cependant de nombreuses études ont montré que la plupart des plantes alpines<br />
sont capables d’assimiler, avec ou sans l’aide des mycorhizes, de l’azote sous forme<br />
organique, court-circuitant ainsi la boucle microbienne (Chapin et al. 1993b, Raab et al. 1999,<br />
Chapman et al. 2006). Dans ce cas, la production végétale serait en partie découplée de la<br />
minéralisation de l’azote par les microorganismes. La mise en évidence de ce nouveau<br />
31
Introduction Contexte et problématique de l’étude<br />
paradigme a conduit à différentes théories illustrées sur la fig. 11 (Schimel and Bennett 2004,<br />
Chapman et al. 2006) : dans les systèmes fertiles, les plantes assimilent majoritairement<br />
l’azote sous forme minérale et de fait dépendent des organismes saprophytes pour leur<br />
croissance; dans les systèmes infertiles, les espèces végétales assimilent l’azote organique soit<br />
par prélèvement direct soit par le biais des mycorhizes et ne dépendent donc plus de l’activité<br />
minéralisatrice des microorganismes. Ces hypothèses remettent ainsi en question l’existence,<br />
dans certains systèmes, d’un goulot d’étranglement associé à l’activité des microorganismes,<br />
pour prédire les processus écosystémiques.<br />
Fig. 11 Deux<br />
représentations du cycle de<br />
l’azote. Dans chaque cas, la<br />
flèche représente l’intensité<br />
du flux. (a) Théorie<br />
classique selon Knops et al.<br />
(2002), (b) Dans le cas<br />
d’une l’assimilation directe<br />
d’azote organique. Myc,<br />
mycorhize. Source :<br />
Chapman et al. (2006)<br />
Les contrôles exercés par les plantes et les microorganismes sur la minéralisation de<br />
l’azote et de façon générale sur les cycles biogéochimiques sont encore mal connus. Ces<br />
résultats montrent la nécessité d’examiner l’intrication des cycles de l’azote et du carbone afin<br />
de prédire la réponse des écosystèmes aux changements globaux.<br />
32
Introduction Contexte et problématique de l’étude<br />
Fig. 12 Illustration de l’impact de la topographie sur les patrons d’enneigement. Le 18/05/07 à Combe<br />
Roche Noire près de col du Galibier dans les Alpes Françaises (2550 m). En premier plan, Kobresia<br />
myosuroides, plante dominante des sites thermiques. Source: F. Baptist.<br />
33
Introduction Objectifs et hypothèses de travail<br />
B. Objectifs et hypothèses de travail<br />
L’objectif de ce travail est d’évaluer les contrôles directs et indirects exercés par<br />
la neige sur la fixation et la minéralisation du carbone dans les systèmes alpins.<br />
Dans les systèmes alpins, la longueur de la saison de végétation et l’épaisseur de<br />
la couche de neige varient principalement en fonction de la topographie. La succession<br />
des communautés végétales et les variations de la diversité fonctionnelle le long du<br />
gradient de mésotopographie sont intimement liées aux patrons d’enneigement et<br />
résultent d’un long processus de sélection (Choler, 2005). De fait, nous avons considéré<br />
ce gradient 7 comme un système modèle pour examiner l’influence respective des effets<br />
directs et indirects de la neige. Nous nous sommes principalement focalisé sur les<br />
communautés situées aux deux pôles de ce gradient : les communautés nivales ou de<br />
combe à neige et les communautés thermiques ou de crête (Tableau 3). Les sites<br />
d’étude font l’objet d’une présentation détaillée dans la dernière partie de cette<br />
introduction.<br />
Les deux principales étapes du cycle du carbone ont été étudiées, c'est-à-dire :<br />
- La fixation du carbone (via la mesure du GPP et de l’ANPP) et allocation du<br />
carbone,<br />
- La minéralisation du carbone (décomposition des litières et respiration<br />
hétérotrophique).<br />
Afin de dissocier la contribution relative des facteurs directs et indirects,<br />
différentes approches et outils ont été privilégiés et appliqués à des échelles variées<br />
(Tableau 3). Ces différentes approches nous ont ensuite permis d’évaluer, selon les<br />
différents scénarios climatiques envisagés, les conséquences d’une réduction de<br />
l’enneigement sur les processus biogéochimiques. Ceci sera développé dans la dernière<br />
partie de ce manuscrit (synthèse).<br />
La figure 13 présente de façon schématique les objectifs et les hypothèses de ce travail.<br />
De façon générale nous faisons l’hypothèse que les effets indirects de l’enneigement<br />
supplantent les effets directs et à court terme sur le cycle du carbone dans les systèmes<br />
7<br />
Dans la suite du manuscrit, nous utiliserons uniquement le terme « gradient d’enneigement » ou snowmelt<br />
gradient.<br />
34
Introduction Objectifs et hypothèses de travail<br />
alpins. Plus précisément, nos hypothèses sont les suivantes :<br />
- Les conditions stationelles dans les systèmes longuement enneigés favorisent les<br />
espèces à croissance rapide - réponse adaptive à la limitation de la durée de la<br />
saison favorable à la croissance. La productivité instantanée sera donc plus élevée<br />
dans ces milieux comparativement aux systèmes thermiques.<br />
- Dans les systèmes nivaux la présence d’espèces dont les tissus sont riches en azote<br />
devrait activer la vitesse de décomposition des litières. L’hypothèse inverse est<br />
testée au sein des systèmes thermiques.<br />
- Le régime thermique hivernal plus favorable dans les systèmes nivaux devrait<br />
cependant contribuer à activer la vitesse de décomposition.<br />
Ces hypothèses, à première vue qualitatives, ont été abordées dans le but de donner des<br />
réponses quantitatives soit par le biais de mesures empiriques soit grâce à la modélisation.<br />
Objet d’étude / Echelle<br />
géographique<br />
Communautés végétales le long du<br />
gradient d’enneigement. Espèces<br />
dominantes des communautés nivales<br />
et thermiques : Carex foetida et<br />
Kobresia myosuroides<br />
Communautés nivales.<br />
Espèces dominantes : Carex foetida,<br />
Poa alpina, Alopecurus gerardi<br />
Espèces dominantes des communautés<br />
nivales et thermiques : Carex foetida<br />
et Kobresia myosuroides<br />
Espèces dominantes des communautés<br />
nivales (Carex foetida, Salix herbacea,<br />
Alopecurus gerardi) et<br />
thermiques (Kobresia myosuroides et<br />
Dryas octopetala)<br />
Sols des systèmes nivaux et<br />
thermiques<br />
Sols des systèmes thermiques<br />
Outils Type<br />
d’expérimentation<br />
Outils d’écophysiologie<br />
Modélisation<br />
Outils d’écophysiologie<br />
Analyse chimique<br />
Outils d’écophysiologie<br />
Modélisation<br />
Taux de décomposition<br />
Analyse chimique<br />
Mesures de flux (C)<br />
Respiration potentielle<br />
Mesure de flux (C, N)<br />
Diversité microbienne<br />
Activité enzymatique<br />
In situ<br />
Conditions semicontrolées<br />
Conditions semicontrôlées<br />
Conditions<br />
contrôlées<br />
Articles<br />
Production<br />
primaire<br />
Article 1A<br />
Production<br />
primaire<br />
Article 1B<br />
Allocation<br />
Article 1C<br />
In situ Décomposition<br />
Article 2A<br />
In situ<br />
Conditions<br />
contrôlées<br />
Conditions<br />
contrôlées<br />
Respiration<br />
Article 2B<br />
Respiration<br />
Article 2C<br />
Tableau 3 Description des expérimentations réalisées dans ce travail : objet et niveaux d’étude, outils et types<br />
d’expérimentation.<br />
35
Introduction Objectifs et hypothèses de travail<br />
Effets directs<br />
Systèmes thermiques Systèmes nivaux<br />
Longue saison<br />
de végétation<br />
Traits fonctionnel ~<br />
Stratégie de conservation<br />
des ressources<br />
Fixation<br />
du carbone<br />
Contraintes<br />
abiotiques<br />
Courte saison<br />
de végétation<br />
Traits fonctionnel ~<br />
Stratégie d'acquisition<br />
des ressources<br />
- Minéralisation + Minéralisation<br />
-<br />
du carbone<br />
du carbone<br />
+<br />
-<br />
Vitesse de recyclage<br />
du carbone +<br />
Effets indirects<br />
Fixation<br />
du carbone<br />
Fig. 13 Hypothèse de travail visant à explorer dans quelles mesures la diversité fonctionnelle végétale<br />
(effet indirect) et les conditions édapho-climatiques (effet direct) affectent la productivité, l’allocation<br />
du carbone, la décomposition des litières et la respiration hétérotrophique des sols dans les systèmes<br />
alpins nivaux et thermiques.<br />
Effets directs<br />
36
Introduction Organisation du document<br />
C. Organisation du document<br />
Le premier chapitre de ce manuscrit traite de l’impact de l’enneigement sur les traits<br />
fonctionnels foliaires, la production primaire brute et l’allocation du carbone au sein des<br />
systèmes nivaux et thermiques.<br />
Notre démarche a tout d’abord consisté à développer un modèle de photosynthèse a<br />
l’échelle de la canopée (« bulk canopy photosynthesis model »), à paramétrer ce modèle avec<br />
les mesures de traits agrégés puis à examiner l’importance relative des propriétés<br />
fonctionnelles des couverts végétaux vs. durée de la saison de végétation sur le gain carboné<br />
brut des pelouses alpines. Nous avons fait l’hypothèse que les propriétés fonctionnelles des<br />
canopées via la maximisation de l’interception de la lumière et de la fixation du carbone des<br />
systèmes nivaux permettent de compenser la courte durée de la saison de végétation. Une<br />
analyse de sensibilité a par ailleurs permis de déterminer l’effet relatif d’un allongement de la<br />
durée de la saison de végétation vs. modification des traits fonctionnels sur la production<br />
primaire de ces communautés végétales (Article 1A).<br />
D’autre part, afin de vérifier d’un point de vue expérimental l’impact de l’allongement<br />
de la saison de végétation dans les systèmes nivaux, nous avons mis en place à la <strong>Station</strong><br />
<strong>Alpine</strong> <strong>Joseph</strong> <strong>Fourier</strong> une expérimentation visant à étudier l’effet d’une réduction de<br />
l’enneigement sur la productivité des systèmes de combe à neige. Nous avons fait<br />
l’hypothèse qu’une saison de végétation allongée entraînerait une augmentation de la<br />
biomasse aérienne produite (Article 1B).<br />
Enfin, la dernière partie de ce chapitre vise à préciser les patrons d’allocation du<br />
carbone en relation avec les stratégies d’acquisition de l’azote des deux graminoïdes Carex<br />
foetida et Kobresia myosuroides qui dominent dans les systèmes nivaux et thermiques<br />
respectivement. Nous avons fait l’hypothèse que l’espèce caractérisée par une croissance lente<br />
(K. myosuroides) allouait une quantité importante du carbone nouvellement fixé vers le<br />
compartiment souterrain (Article 1C).<br />
Ces trois études font l’objet des articles suivants :<br />
- Article 1A : Baptist, F., and Ph. Choler. 2008. A simulation on the importance of<br />
growing season length and canopy functional properties on the seasonal Gross<br />
Primary Production of temperate alpine meadows. Annals of Botany 101:549-559.<br />
- Article 1B : Baptist, F., Flahaut C., Streb P., and Ph. Choler. Decreased aboveground<br />
primary productivity of alpine tundra in response to earlier snowmelt. En prep. pour<br />
Oecologia.<br />
37
Introduction Organisation du document<br />
- Article 1C : Baptist, F., Tcherkez, G., Aubert, S., Pontailler, J.Y., Choler, Ph. and S.<br />
Noguès. 13 C and 15 N allocations of two alpine species from contrasting habitats reflect<br />
their different growth strategies. En prep. pour New Phytologist.<br />
Dans le deuxième chapitre, nous nous sommes appliqués à préciser l’impact de<br />
l’enneigement sur la décomposition des litières (phase initiale de la dégradation de la SOM) et<br />
la respiration hétérotrophique des sols (phase finale de la dégradation de la SOM).<br />
Dans le premier cas, nous avons mis en place un dispositif croisé visant à préciser<br />
l’impact respectif des facteurs stationnels et de la qualité des litières sur la décomposition<br />
(Article 2A). Cinq espèces dont trois dominantes dans les systèmes nivaux et deux dans les<br />
systèmes thermiques ont été choisies afin de mesurer leur taux de décomposition aux deux<br />
pôles du gradient d’enneigement sur un pas de temps annuel. Nous faisons l’hypothèse que<br />
les processus de minéralisation (décomposition, respiration) sont en premier lieu déterminés<br />
par la qualité des litières. Les contrôles indirects exercés par l’enneigement seraient donc plus<br />
marqués que les contrôles directs via la modification des conditions édapho-climatiques.<br />
Nous avons par ailleurs mesuré la respiration hétérotrophique in situ et en conditions<br />
contrôlées sur des carottes de sol prélevées en été lors du pic de biomasse et en automne juste<br />
avant les premières chutes de neige. Les sols ont été prélevés aux deux pôles du gradient<br />
d’enneigement. Nous avons fait l’hypothèse que la qualité de la matière organique, évaluée à<br />
partir des valeurs de respiration basale, influence fortement la variabilité spatiale de la<br />
respiration hétérotrophique. Par ailleurs, la présence de neige en hiver dans les systèmes<br />
nivaux contribuerait à modifier de façon significative le bilan annuel des flux de CO2 en<br />
comparaison avec les systèmes thermiques (Article 2B).<br />
La dernière étude est une ouverture vers l’écologie microbienne. En conditions<br />
contrôlées (mésocosmes), nous avons examiné conjointement la dynamique de la diversité<br />
microbienne et la minéralisation du carbone et de l’azote suite à un amendement d’extrait<br />
tannique (à partir de litière de Dryas octopetala). Par ailleurs les sols ont été soumis à<br />
différentes contraintes thermiques mimant les conditions hivernales des systèmes nivaux et<br />
thermiques. Nous faisons l’hypothèse que les champignons, principaux acteurs de la<br />
dégradation l’hiver, sont spécifiquement sélectionnés par les faibles températures hivernales<br />
afin de dégrader les composés récalcitrants présents dans les systèmes thermiques (Article<br />
2C).<br />
38
Introduction Organisation du document<br />
Ces trois études font l’objet des articles suivants :<br />
- Article 2A : Baptist, F., Yoccoz, G., and Ph. Choler. Snow cover exerts control over<br />
decomposition in alpine tundra along a snowmelt gradient. En prep. pour Plant and<br />
soil..<br />
- Article 2B : Baptist, F., Flahaut, C., and Ph. Choler. Soil respiration in alpine tundra:<br />
impacts of seasonal snow cover and soil carbon content. Soumis à Global Change<br />
Biology.<br />
- Article 2C : Baptist, F., Zinger, L., Clement, J.C., Gallet, C., Guillemin, R., Martins,<br />
J.M.F., Sage L., Shahnavaz, B. and Ph. Choler. Tannins impacts on microbial diversity<br />
and functioning of alpine soils: a multidisciplinary approach. Environmental<br />
microbiology 10:799-809<br />
La dernière partie propose une synthèse de l’ensemble des résultats présentés dans les<br />
chapitres I et II. Des résultats non publiés à ce jour ont également été intégrés dans cette<br />
section.<br />
39
Introduction Présentation du site d’étude<br />
D. Présentation du site d’étude<br />
Le col du Lautaret (2058 m, 45°20’N, 6°24’E) marque la limite entre la vallée de la<br />
Romanche et la vallée de la Guisane. Plus qu’une limite géographique c’est également une<br />
limite climatique puisque au-delà de ce col (vers l’Est) les précipitations s’amoindrissent et la<br />
région devient beaucoup plus sèche (Fig. 14).<br />
Col du<br />
Lautaret<br />
Alpes externes<br />
Gradient de continentalité<br />
Vallée de la<br />
Haute-Romanche<br />
Zone Zone de de<br />
transition transition<br />
Col du<br />
Lautaret<br />
Alpes internes<br />
Alpes<br />
du nord<br />
Alpes<br />
du sud<br />
Fig 14 Localisation du<br />
site d’étude dans les<br />
Alpes<br />
occidentales.<br />
Françaises<br />
Les sites d’étude se situent au nord du col du Lautaret en direction du col du Galibier<br />
(2646 m) (Tableau 4). La limite inférieure de l’alpin se situe aux alentours de 2200-2300 m, et<br />
probablement 2400 m sur les adrets francs. Tous les sites d’études sont situés au-delà de 2500<br />
m. L’étage nival lui se situe aux alentours de 2800-3000 m (tableau 4).<br />
Article<br />
correspondant<br />
Localisation des<br />
sites<br />
Altitude Cordonnées géographiques<br />
Mesures /<br />
prélèvements<br />
Article 1A Aravo ~ 2750 m 45°04’N, 6°23’E Mesures<br />
Article 1B Col Agnel 2744 m 44°41’N, 6°58’E Prélèvements<br />
Article 1C Site B, et Col Agnel 2520 m Site B : 45.05’N, 6.37’E Prélèvements<br />
2744 m Col Agnel : 44°41’N, 6°58’E<br />
Article 2A Sites A, B et C ~2550 m Site A : 45°04N, 6°24E Mesures<br />
2520 m Site B : 45.05’N, 6.37’E<br />
~2550 m Site C : 45.05’N, 6.38’E<br />
Article 2B Sites B, C et D 2520 m Site B : 45.05’N, 6.37’E Mesures<br />
~2550 m Site C :45.05’N, 6.38’E Prélèvements dans<br />
~2556 m Site D : 45.05’N, 6.37’E le site B<br />
Article 2C Site B 2520 m Site B : 45.05’N, 6.37’E Prélèvements<br />
Tableau 4 Localisation des sites d’étude ou de prélèvement dans les différents articles présentés dans ce<br />
manuscrit de thèse.<br />
40
Introduction Présentation du site d’étude<br />
L’étude développée dans l’article 1A porte sur l’ensemble du gradient d’enneigement<br />
et a été réalisé à Aravo (cf carte topographique, Fig. 15, « Aravo »). L’étude 2B a été<br />
effectuée à partir de monolithes prélevés dans des systèmes nivaux au col Agnel à la frontière<br />
avec l’Italie (2744 m, 44°41’N, 6°58’E). L’étude de décomposition des litières a été menée<br />
dans les sites A, B et D (dalle calcaire et vallon de combe roche noire, Article 2A) alors que<br />
les mesures de respiration hétérotrophique in situ ont été réalisées dans les sites B, C et D. Les<br />
carottes de sol ont été prélevées dans le site B, de même en ce qui concerne l’étude<br />
développée dans l’article 2C. Au sein de chaque site (A-D) sont représentées les<br />
communautés nivales et thermiques (combe à neige / crête).<br />
D<br />
« Aravo »<br />
Orientation : Sud-Est<br />
C<br />
B<br />
A<br />
« Combe Roche Noire »<br />
Orientation : Est<br />
« Dalle calcaire »<br />
Orientation : Est<br />
Fig. 15 Localisation des zones et sites d’étude dans la région du col du Galibier (2646m). En blanc, les sites<br />
nivaux, en noir, les sites thermiques. Carte IGN Top 25 3435 ET au 25/1000. Photo : F. Baptist.<br />
1) Les conditions climatiques<br />
Une partie de ces sites d’étude a été équipée, dès 1999, de capteurs thermiques<br />
enterrés dans le sol (enregistrement horaire en continu). A partir de l’année 2004, des capteurs<br />
d’humidité du sol, de température et d’humidité de l’air ont également été ajoutés<br />
(enregistrement horaire). Les différentes données climatiques obtenues nous permettent ainsi<br />
41
Introduction Présentation du site d’étude<br />
d’obtenir une image assez précise des conditions édaphoclimatiques régnant aux deux pôles<br />
du gradient d’enneigement.<br />
1.2 La durée de la saison de végétation<br />
La neige, par son pouvoir isolant, limite fortement l’amplitude thermique journalière<br />
du sol. L’analyse des données thermiques du sol nous permet de préciser la durée de<br />
l’enneigement et donc la durée de la saison de végétation. En général, les systèmes nivaux se<br />
déneigent courant juin. La longueur de saison de végétation dure en moyenne 132 ± 4 jours.<br />
On observe un différentiel d’environs 40 jours entre les systèmes nivaux et thermiques, ces<br />
derniers se déneigeant plutôt fin mai (169 ± 6 jours). Cependant, il n’est pas rare que la neige<br />
soit absente une partie de l’hiver. Les températures, dans ce cas largement négatives,<br />
empêchent la reprise de la croissance.<br />
Comme le souligne Körner (1999), certaines plantes alpines conservent des tissus<br />
chlorophylliens durant toute la saison hivernale. C’est notamment le cas des genres Geum et<br />
Potentilla. Cependant, au-delà de 30 cm de neige, l’activité photosynthétique ne peut se<br />
maintenir car la transmittance est quasiment nulle. Cette propriété permet aux plantes d’initier<br />
leur croissance très tôt en début de saison de végétation lorsque la couche de neige n’a pas<br />
encore totalement disparu optimisant ainsi les chances de compléter leur cycle de vie dans le<br />
temps imparti. Néanmoins, dans le cadre de cette étude, nous avons considéré que la date de<br />
déneigement marque le début de la croissance végétale dans les systèmes nivaux. Dans le cas<br />
des systèmes thermiques, nous avons pris en compte la date à laquelle la température<br />
moyenne journalière du sol était supérieure à 0°C.<br />
1.3 Le régime thermique et hydrique<br />
En montagne, la température diminue d’environs 0.6°C lorsque l’on s’élève de 100 m.<br />
Il est ainsi possible de prédire la température de l’air moyenne à partir de stations<br />
météorologiques située plus bas dans la vallée (Fig. 16). On observe respectivement un<br />
maxima d’environs 20°C l’été et un minima proche de -8/-10°C durant l’hiver au col du<br />
Lautaret (2058 m). Chaque année, environ 1000 mm d’eau tombent dont la majeure partie<br />
sous forme de neige.<br />
42
Introduction Présentation du site d’étude<br />
Fig. 16 Diagramme ombro-thermique estimé<br />
pour Villar d’Arène (1670 m – courbe du haut)<br />
et le col du Lautaret (2058 m courbe du bas).<br />
Précipitations moyennes mensuelles (± se) des<br />
stations météo France de Besse en Oisans<br />
(1525 m), St Christophe en Oisans (1570 m),<br />
Valloire (1460 m) et Monêtier les Bains (1490<br />
m). Estimation des températures moyennes<br />
mensuelles à partir des enregistrements de la<br />
station Météo France de Besse en Oisans.<br />
Source : Météo France.<br />
Cependant, en fonction de l’orientation, du vent, des effets de masque, le microclimat<br />
diffère grandement des températures moyennées à l’échelle d’un massif. A partir des données<br />
climatiques enregistrées depuis 1999 au sein de chaque site, nous avons estimé les<br />
températures moyennes des sols dans les systèmes nivaux et thermiques (Fig. 17). Durant<br />
l’hiver, le déficit en neige dans les systèmes thermiques est à l’origine d’une forte amplitude<br />
des températures, ainsi que d’une fréquence importance de températures extrêmes inférieures.<br />
à -10°. Au contraire, le régime thermique de systèmes nivaux est stable et avoisine la valeur<br />
moyenne de 0°C.<br />
Température du sol (°C)<br />
Eau volumique<br />
dans le sol (m3 m-3 Eau volumique<br />
dans le sol (m ) 3 m-3 )<br />
Systèmes nivaux<br />
Systèmes thermiques<br />
Degré-jours cumulés<br />
Pic de végétation<br />
Nombre de jours à partir de la date de déneigement<br />
Fig. 17 Température et humidité du sol (encart) dans les systèmes nivaux (gris) et thermiques (noir) au cours de<br />
l’année. A droite : somme des degrés jours dans les systèmes nivaux (gris) et thermiques (noir) depuis le<br />
déneigement.<br />
Durant l’été, les différences de température du sol entre les systèmes nivaux et<br />
thermiques sont très faibles et dépendent du vent et de l’exposition. Cependant, la<br />
quantification des degré-jours montre un décalage important d’environs 280 °Cj lié à la fonte<br />
précoce de la neige dans les systèmes thermiques (Fig. 17).<br />
43
Introduction Présentation du site d’étude<br />
En dépit d’une couverture neigeuse très variable le long du gradient, les variations en<br />
termes de disponibilité en eau (unité massique) sont peu marquées contrairement aux études<br />
de Walker et al.(1993) et de Fisk et al. (1998) (Tableau 4, appendice article 2B). De façon<br />
générale, les systèmes thermiques sont légèrement plus secs que les systèmes nivaux, cette<br />
différence s’accentuant à la fonte des neiges due à l’engorgement dans les systèmes nivaux.<br />
Systèmes thermiques Systèmes nivaux<br />
Humidité du sol (% massique) 42.0 (3.0) 37.0 (2.0)<br />
Capacité au champ (%) 57.8 (0.2) 59.6 (3.7)<br />
Tableau 4 Régime hydrique des sols des systèmes thermiques et nivaux moyenné sur les sites A, B et D et sur<br />
deux ans. Moyenne ± se.<br />
2) La nature du substrat<br />
La nature du substrat varie entre la zone située près du col Galibier (Dalle calcaire) et<br />
les zones correspondantes de Combe Roche Noire (sites B, C et D) et Aravo.<br />
Le panorama du col du Lautaret (2058 m) et du col du Galibier (2646 m) se distingue<br />
par la présence de différentes couches sédimentaires autochtones ainsi que de deux nappes de<br />
charriages, les nappes Briançonnaise et Sub-briançonnaise. Sur la photo (Fig. 18), on<br />
distingue en premier lieu des calcaires marneux jurassiques (Trias inférieur = lias) sur<br />
lesquelles reposent directement le tertiaire avec tout d’abord des calcaires nummulitiques puis<br />
des grès stratifiés (ou flysh). La <strong>Station</strong> <strong>Alpine</strong> <strong>Joseph</strong> <strong>Fourier</strong>, que l’on peut apercevoir sur la<br />
photo repose sur ce substrat. Par ailleurs, les zones d’étude « Combe Roche Noire » et<br />
« Aravo » sont situées sur la nappe sub-briançonnaise formée au crétacé supérieur (calcaire<br />
schisteux et grès nummulitiques). Enfin, la nappe Briançonnaise d’age triasique qui se<br />
superpose à cette couche tertiaire est constituée notamment de quartzites triasiques et de<br />
calcaires dolomitiques qui font les reliefs du massif des Cerces (Grand Galibier). Les sols des<br />
sites situés à la « Dalle calcaire » reposent sur ce substrat.<br />
44
Introduction Présentation du site d’étude<br />
Pic des<br />
trois évechés<br />
Montagne<br />
de chaillol<br />
Blocs cristallins<br />
Jurassique moyen<br />
Pic blanc<br />
Vallon de Combe<br />
roche noire<br />
Présence<br />
Aravo<br />
de gypse<br />
Dalle calcaire<br />
Col du Galibier<br />
Flysh nummulitiques (grès)<br />
Lias calcaire<br />
Calcaire<br />
jurassique<br />
Fig. 18 Panorama des crêtes au nord du col du Lautaret vu du sud, depuis le lac de Laurichard (extrémité nord du<br />
massif du Combeynot). SAJF : <strong>Station</strong> <strong>Alpine</strong> <strong>Joseph</strong> <strong>Fourier</strong>. Source : J. Debelmas.<br />
3) Les conditions édaphiques<br />
Dans la région du Galibier, les sols des systèmes nivaux sont classés comme des<br />
stagnogley enrichi en argile (Tableau 5). Les sols des systèmes thermiques correspondent à<br />
des ranker alpins (Lamber 1996, Bounemoura et al. 1998). Le pH est faiblement acide et se<br />
situe aux alentours de 5. Les sols des systèmes thermiques sont caractérisés par la présence de<br />
carbonates à la différence des sols des systèmes nivaux<br />
SAJF<br />
Caractéristiques des sites d’étude Systèmes thermiques Systèmes nivaux<br />
Classification des sols Ranker alpin Stagnogley<br />
Densité du sol (g.cm -3 ) 0.31 (0.04) 0.69 (0.02)<br />
Profondeur du sol (cm) 60-80 >120<br />
pH dans l’eau 5.11 (0.0 4.96 (0.06)<br />
Matière organique (%) 14.8 (0.84) 8.70 (0.80)<br />
Carbonates (%) 3.7 (1.1)
Introduction Présentation du site d’étude<br />
D’autre part, la nature des sols prélevés au col Agnel est décrite dans le tableau ci-dessous :<br />
Caractéristiques du site d’étude Systèmes nivaux<br />
Classification des sols Stagnogley<br />
Matière organique (%) 8.10 (0.34)<br />
Carbonates (%) 1.2 (0.1)<br />
Granulometrie (%) a<br />
Argile (
Introduction Présentation du site d’étude<br />
4) Les groupements végétaux du site d’étude<br />
Les systèmes thermiques sont caractérisés par des groupements à Elyne queue de<br />
souris (Kobresia myosuroides = Elyna myosuroides) et Dryade à huit pétales (Dryas<br />
octopetala). On distingue plusieurs faciès en fonction du relief et de l’exposition. Le faciès<br />
typique, plutôt d’ubac se développe sur un sol superficiel caillouteux, très humifère mais peu<br />
fertile. En adret, les sols sont plus profonds, les couverts sont plus denses et on note<br />
l’intrusion d’espèces plus xérophiles comme la Seslérie bleue (Sesleria caerulea) et l’Avoine<br />
des montagnes (Helictotrichon sedenense) aux dépens de la Dryade. Les pelouses de milieu<br />
de gradient sont des groupements acidicline à sol profond, et caractérisés par une forte<br />
richesse spécifique comparativement aux communautés situées aux deux pôles du gradient<br />
d’enneigement. Les plantes caractéristiques sont Festuca violacea, Geum montanum,<br />
Trifolium sp., Alchemilla glaucescens, Arnica montana, Cirsium acaule. Les combes à neige<br />
se caractérisent par un nombre restreint d’espèces : Salix herbacea, Alchemilla pentaphyllea,<br />
Sibaldia procumbens, Alopecurus alpinus. On note l’apparition d’un autre groupement, la<br />
pelouse à vulpin des Alpes et Renoncule de Küpfer. Les espèces caractéristiques sont<br />
Plantago alpina, Ranunculus kupferi, Trifolium alpinum, Geum montanum, Potentilla aurea,<br />
etc. (voir annexe 1 pour la liste des espèces dans les sites B,C et D et la richesse spécifique).<br />
Comme résumé dans le tableau 3, les espèces qui ont fait l’objet d’une étude<br />
approfondie dans les différents articles de cette thèse sont : Carex foetida, Alopecurus<br />
gerardi, Salix herbacea, Poa alpina (communautés nivales) et Kobresia myosuroides, Dryas<br />
octopetala (communautés thermiques) (Fig. 20).<br />
47
Introduction Présentation du site d’étude<br />
Combes à neige<br />
Crêtes<br />
Carex foetida (gr) Alopecurus gerardi (gr) Salix herbaceae (ar)<br />
(gr) : graminoïdes<br />
(ar) : arbustes<br />
Kobresia myosuroides (gr) Dryas octopetala (ar)<br />
Fig. 20 Illustration des cinq espèces modèles sélectionnées dans cette étude.<br />
48
Chapitre I<br />
Effet de l’enneigement sur les traits fonctionnels, la fixation et<br />
l’allocation du carbone dans les écosystèmes alpins<br />
49
CHAPITRE I<br />
A simulation on the importance of growing season length and canopy functional<br />
properties on the seasonal Gross Primary Production of temperate alpine meadows. _ 51<br />
Decreased aboveground primary productivity of alpine tundra in response to earlier<br />
snowmelt. ________________________________________________________________ 77<br />
Abstract______________________________________________________________________________ 79<br />
Introduction___________________________________________________________________________ 80<br />
Materials and methods __________________________________________________________________ 82<br />
Results_______________________________________________________________________________ 87<br />
Discussion____________________________________________________________________________ 94<br />
Acknowledgments______________________________________________________________________ 97<br />
References____________________________________________________________________________ 97<br />
13 15<br />
C and N allocations of two alpine species from contrasting habitats reflect their<br />
different growth strategies _________________________________________________ 103<br />
Abstract_____________________________________________________________________________ 105<br />
Introduction__________________________________________________________________________ 106<br />
Material and methods __________________________________________________________________ 108<br />
Results______________________________________________________________________________ 114<br />
Discussion___________________________________________________________________________ 121<br />
Acknowledgements____________________________________________________________________ 124<br />
References___________________________________________________________________________ 125<br />
50
Article 1A<br />
A simulation on the importance of growing season length and<br />
canopy functional properties on the seasonal Gross Primary<br />
Production of temperate alpine meadows.<br />
Baptist, F., and Ph. Choler. 2008<br />
Annals of Botany 101:549-559<br />
Mesures des échanges gazeux dans différentes conditions environnementales afin<br />
de valider le modèle visant à estimer le gain carboné brut des communautés<br />
situées le long du gradient d’enneigement. Espèce présente : Kobresia<br />
myosuroides dominante dans les communautés thermiques (C140). Photo : Ph.<br />
Choler.<br />
51
Annals of Botany 1–11, 2007<br />
doi:10.1093/aob/mcm318, available online at www.aob.oxfordjournals.org<br />
A Simulation of the Importance of Length of Growing Season and Canopy<br />
Functional Properties on the Seasonal Gross Primary Production of Temperate<br />
<strong>Alpine</strong> Meadows<br />
FLORENCE BAPTIST 1 and PHILIPPE CHOLER 1,2, *<br />
1 Laboratoire d’Ecologie <strong>Alpine</strong>, UMR 5553 UJF-CNRS, <strong>Université</strong> de Grenoble, BP53, 38041 Grenoble, France and<br />
2 <strong>Station</strong> <strong>Alpine</strong> J. <strong>Fourier</strong>, UMS 2925 UJF-CNRS, <strong>Université</strong> de Grenoble, BP53, 38041 Grenoble, France<br />
Received: 1 October 2007 Returned for revision: 24 October 2007 Accepted: 20 November 2007<br />
† Background and Aims Along snowmelt gradients, the canopies of temperate alpine meadows differ strongly in<br />
their structural and biochemical properties. Here, a study is made of the effects of these canopy dissimilarities combined<br />
with the snow-induced changes in length of growing season on seasonal gross primary production (GPP).<br />
† Methods Leaf area index (LAI) and community-aggregated values of leaf angle and leaf nitrogen content were<br />
estimated for seven alpine plant canopies distributed along a marked snowmelt gradient, and these were used as<br />
input variables in a sun–shade canopy bulk-photosynthesis model. The model was validated for plant communities<br />
of early and late snowmelt sites by measuring the instantaneous CO 2 fluxes with a canopy closed-chamber technique.<br />
A sensitivity analysis was conducted to estimate the relative impact of canopy properties and environmental<br />
factors on the daily and seasonal GPP.<br />
† Key Results Carbon uptake was primarily related to the LAI and total canopy nitrogen content, but not to the leaf<br />
angle. For a given level of photosynthetically active radiation, CO 2 assimilation was higher under overcast conditions.<br />
Sensitivity analysis revealed that increase of the length of the growing season had a higher effect on the<br />
seasonal GPP than a similar increase of any other factor. It was also found that the observed greater nitrogen<br />
content and larger LAI of canopies in late-snowmelt sites largely compensated for the negative impact of the<br />
reduced growing season.<br />
† Conclusions The results emphasize the primary importance of snow-induced changes in length of growing season<br />
on carbon uptake in alpine temperate meadows. It was also demonstrated how using leaf-trait values of the dominants<br />
is a useful approach for modelling ecosystem carbon-cycle-related processes, particularly when continuous<br />
measurements of CO 2 fluxes are technically difficult. The study thus represents an important step in addressing<br />
the challenge of using a plant functional-trait approach for biogeochemical modelling.<br />
Key words: <strong>Alpine</strong> meadows, gross primary production, plant functional traits, snowmelt gradient, sun–shade model.<br />
INTRODUCTION<br />
The carbon budget of cold, snow-covered ecosystems is of<br />
particular interest because they are known to sequester a<br />
large amount of organic carbon in their soils and to be particularly<br />
sensitive to global warming (Hobbie et al., 2000).<br />
Much attention has been drawn to the carbon balance of<br />
arctic tundra (Vourlitis et al., 2000; Grant et al., 2003;<br />
Campbell et al., 2005; Euskirchen et al., 2006), but<br />
carbon balance estimations for temperate alpine tundra<br />
and meadows are relatively uncommon (Cernusca, 1989;<br />
Diemer, 1994). In cold ecosystems, snow determines the<br />
length of the season, which is a main driver of carbon<br />
exchange between land and atmosphere (Arora and Boer,<br />
2005; Churkina et al., 2005). Recent climatic studies have<br />
highlighted the impact of rising temperatures on snowcover<br />
depth and duration at high elevations (Keller et al.,<br />
2005), but their consequences for the carbon budget<br />
remain poorly understood (Brooks et al., 1997; Monson<br />
et al., 2006).<br />
In situ continuous recording of CO2 fluxes remains difficult<br />
in high-elevation terrains (but see Cernusca et al.,<br />
1998; Li et al., 2005; Hammerle et al., 2007). The alpine<br />
* For correspondence. E-mail philippe.choler@ujf-grenoble.fr<br />
landscape generally exhibits very fine-scale changes in vegetation<br />
cover, a feature that would preclude the designation<br />
of turbulent fluxes to a particular ecosystem. For the same<br />
reason, remote-sensing-based estimates of gross primary<br />
production (GPP) in alpine landscapes also suffer from<br />
insufficient spatial resolution (Turner et al., 2004). This<br />
makes spatial and temporal scaling-up a major challenge.<br />
A growing body of literature suggests using plant functional<br />
traits in ecosystem modelling in order to scale-up ecosystem<br />
processes on a mechanistic basis (Diaz and Cabido, 2001;<br />
Lavorel and Garnier, 2002). Although this approach has<br />
recently been used in modelling primary productivity and<br />
litter decomposition (Quetier et al., 2007), to our knowledge,<br />
this promising avenue has seldom been explored to<br />
model seasonal variations in GPP of herbaceous<br />
ecosystems.<br />
According to the ‘biomass ratio hypothesis’ (Grime,<br />
1998), ecosystem properties and function (i.e. carbon and<br />
nitrogen cycles) should be related to the trait values of<br />
the dominant contributors to the plant biomass. Several<br />
key ecosystem processes, such as decomposition rate or productivity,<br />
may be predicted from the traits of the dominant<br />
species (Chapin et al., 1996; Cornelissen et al., 1999;<br />
Epstein et al., 2001). A main challenge is to mechanistically<br />
link ecosystem processes to a set of key plant<br />
# The Author 2007. Published by Oxford University Press on behalf of the Annals of Botany Company. All rights reserved.<br />
For Permissions, please email: journals.permissions@oxfordjournals.org
Page 2 of 11<br />
Baptist and Choler — Gross Primary Production of <strong>Alpine</strong> Meadows<br />
functional traits that could easily be measured in the field<br />
(Diaz and Cabido, 2001). In this respect, it has been proposed<br />
that the use of quantitative traits would be more<br />
powerful than a broad categorization into discrete plant<br />
functional groups (Garnier et al., 2004). The mean of trait<br />
values weighted by the relative abundance of each<br />
species – i.e. a community-aggregated value (Violle<br />
et al., 2007) – provides a route to scale-up from organ to<br />
community level and offers a linkage between comparative<br />
plant ecology and ecosystem modelling. The goal of this<br />
paper is to develop such a modelling approach to estimate<br />
the seasonal GPP of temperate alpine meadows. Gross<br />
primary production is a key variable of the carbon<br />
balance as it quantifies the amount of autotrophic carbon<br />
available for growth, reserve and respiratory demands at<br />
the ecosystem level.<br />
In alpine ecosystems, the landscape-scale distribution of<br />
snow (which is tightly related to the mesotopography) is a<br />
main driver of ecosystem structure and functioning.<br />
Through its effect on the length of the growing season,<br />
snow provides a complex ecological gradient affecting the<br />
seasonal course of temperature, light, wind exposure, soil<br />
water content and nitrogen availability (Jones et al.,<br />
2000). It has long been known that arctic and temperate<br />
alpine plant communities exhibit high species turnover<br />
along snowmelt gradients (e.g. Komarkova and Webber,<br />
1978; Kudo and Ito, 1992; Onipchenko and Blinnikov,<br />
1994; Theurillat et al., 1994). More recent studies have<br />
indicated that consistent shifts in plant functional diversity<br />
occur from early to late-snowmelt sites (Kudo et al., 1999;<br />
Choler, 2005). A greater leaf nitrogen concentration<br />
(Nmass), a higher specific leaf area (SLA) and a predominance<br />
of horizontal leaves (i.e. trait values generally associated<br />
with a high capacity for resource acquisition) are<br />
common features of species from snowy sites (Choler,<br />
2005). Conversely, species from early melting sites are<br />
characterized by upright and thick leaves and low SLA,<br />
i.e. trait values generally associated with nutrientconservation<br />
strategies (Wright et al., 2004).<br />
Many studies have investigated the relationships among<br />
several canopy properties – leaf area index (LAI), nitrogen<br />
content, canopy architecture – and their effect on carbon<br />
uptake in different light conditions (Anten et al., 1995;<br />
Hikosaka and Hirose, 1997; Anten, 2005). But, to our<br />
knowledge, there has been no attempt to examine these<br />
relationships for multispecies assemblages distributed<br />
along gradients of length of growing season. In this study,<br />
we addressed the following questions. (1) What are the<br />
differences in the community-aggregated values of leaf<br />
functional traits along the snow-cover gradient? (2) What<br />
is the relative effect of these canopy functional properties<br />
and environmental factors (light and temperature regime,<br />
length of growing season) on the seasonal GPP? (3) To<br />
what extent do plant communities from late-snowmelt<br />
sites overcome the negative impact of a reduced growing<br />
season on GPP?<br />
This study was based on previous work investigating<br />
changes in plant functional traits at the species level<br />
along snowmelt gradients in the alpine zone of the southwestern<br />
Alps (Choler, 2005). For this work, a sun–shade<br />
canopy bulk-photosynthesis model was implemented to<br />
simulate the light interception and the GPP at the ecosystem<br />
level. The model was validated with instantaneous measurements<br />
of CO2 fluxes using a closed-chamber technique.<br />
Finally, a sensitivity analysis was conducted in order to<br />
determine the relative effects of climatic factors and<br />
canopy functional properties on the seasonal GPP.<br />
MATERIALS AND METHODS<br />
Study site and plant trait measurements<br />
The research site was located in the south-western Alps<br />
(France) between the Lautaret and Galibier Pass (4587 0 N,<br />
685 0 E). The 2-ha site is a slightly inclined depression<br />
located between 2700 and 2780 m a.s.l. It exhibits a<br />
typical mosaic of alpine meadow species, ranging from<br />
Kobresia myosuroides-dominated plant communities in<br />
the early snowmelt sites to Carex foetida- and Alchemilla<br />
pentaphyllea-dominated plant communities in the<br />
late-snowmelt sites. For this work, the seven plant communities<br />
that are the most abundant in the studied area were<br />
selected. The communities are designated here according<br />
to the mean date of snowmelt in Julian days (e.g. C130,<br />
C140, C150, etc). Leaf angle, specific leaf area and leaf<br />
nitrogen concentration [expressed on a mass (Nmass) or<br />
area (Narea) basis] were used in this study because of their<br />
known effect on carbon-cycle-related processes. Further<br />
details of the site and trait measurements are given in<br />
Choler (2005).<br />
For each trait, a community-aggregated value (T i)was<br />
calculated as follows:<br />
Ti ¼ Xn<br />
pi ti<br />
i¼1<br />
ð1Þ<br />
where pi is the relative cover of species i in the sampling<br />
unit (SU), n is the number of species accounting for 80 %<br />
of the cover in the SU, and ti is the trait value of species<br />
i. Although the total coverage of the n species could slightly<br />
exceed 80 %, we did not correct the community-aggregated<br />
value. In practical terms, the change in Ti value because of<br />
this discrepancy is of very limited magnitude (Cornelissen<br />
et al., 2003).<br />
For each plant community, the peak standing biomass<br />
was harvested at the end of July in square plots of 50<br />
50 cm. To calculate the leaf area index (LAI), the whole<br />
projected surface of green biomass for three harvests per<br />
community was measured using a leaf area meter<br />
(WinDIAS, Delta-T Devices Ltd). Separation between<br />
green and dead phytoelements was hard to achieve in<br />
early snowmelt sites, and hence LAI might have been<br />
slightly over-estimated for these communities. Material<br />
was then dried at 85 8C for 48 h and weighed.<br />
Climate<br />
Hourly soil temperatures were recorded using Hobo<br />
probes (Onset Computer Corporation, Bourne, MA)
Baptist and Choler — Gross Primary Production of <strong>Alpine</strong> Meadows Page 3 of 11<br />
buried at 5-cm depth over the period 1999–2005. During<br />
snow-covered periods, soil temperatures were close to<br />
0 8C (usually between –1 and 1 8C) throughout the day<br />
and did not exhibit circadian variations, a recording consistent<br />
with a continuous snow cover of at least 1 m<br />
depth. The length of the growing season was calculated<br />
as the number of snow-free days with a mean soil temperature<br />
above 0 8C.<br />
During the summer season, air temperature, relative<br />
humidity and photosynthetically active radiation (PAR)<br />
were recorded hourly by an automatic weather station<br />
[Campbell Scientific (Canada) Corp.] located in the Jardin<br />
Alpin du Lautaret (2100 m a.s.l.), 5 km from the study<br />
site. The diffuse and direct components of PAR were calculated<br />
according to Spitters (1986). Daily integrated values<br />
of incoming solar radiation were obtained from a longer<br />
time series (1999–2004) at Briançon climatic station<br />
(1300 m a.s.l.), located at 30 km from the site and maintained<br />
by Météo France.<br />
The Clear Sky Model (CSM) developed in the framework<br />
of the European Solar Radiation Atlas (Rigollier<br />
et al., 1999) was used to model the incoming global irradiance<br />
on a horizontal plane under a cloudless sky. In the<br />
CSM, the direct (or beam) radiation (I0b) and the diffuse<br />
radiation (I0d) are simulated separately. Details of the<br />
CSM can be found in Rigollier et al. (1999). Solar geometry<br />
was implemented using equations written by L. Wald<br />
and O. Bauer (École des mines de Paris, Centre<br />
d’Energétique, Groupe de Télédétection, February, 1997).<br />
The model was implemented with no mask effect due to<br />
the relief. The long-term recordings of daily irradiance in<br />
Briançon were used to parameterize the monthly mean<br />
atmospheric turbidity in the area.<br />
Canopy bulk-photosynthesis model and simulation<br />
of seasonal GPP<br />
We developed a modified version of the sun–shade<br />
model of De Pury and Farquhar (1997) to estimate the<br />
canopy-intercepted radiation and CO2 fixation. For light<br />
interception, the model splits the canopy into a sunlit and<br />
a shaded fraction, which experience distinct light regimes.<br />
Shaded leaves receive scattered light and diffuse sky irradiance<br />
while sunlit leaves receive direct-beam irradiance in<br />
addition to this. CO2 fixation is based on the von<br />
Caemmerer and Farquhar biochemical model of C3 leaf<br />
CO2 assimilation (Farquhar et al., 1980; von Caemmerer<br />
and Farquhar, 1981). Below, we only detail the main<br />
changes made to the original sun–shade model. The main<br />
constants, parameters and equations of the model are<br />
given in the Supplementary Information, available online.<br />
(1) We used the ellipsoidal distribution model (Campbell,<br />
1990) to describe the leaf-inclination distribution (or<br />
leaf eccentricity) in the canopy. For simplicity, the<br />
canopy is considered as spatially homogeneous, i.e.<br />
with no clumped leaves in either the vertical or horizontal<br />
dimensions. The model assumes that the<br />
leaf-angle distribution is similar to the distribution of<br />
area on the surface of an ellipsoid. The model requires<br />
only one parameter (1), which is the ratio of the axes of<br />
the ellipsoid. The leaf-azimuth-angle distribution is<br />
assumed to be uniform; as such, the leaf-inclination<br />
probability density function g will solely depend on<br />
zl, the zenith angle of the leaf normal (see<br />
Supplementary Information, Table S2, eqn 1, available<br />
online). We estimated the parameter 1 from<br />
community-aggregated values of leaf angle (Table S2,<br />
eqn 2). The use of the ellipsoidal distribution model<br />
modifies the calculations of the canopy extinction coefficient<br />
for direct radiation (k b) as well as the canopy<br />
reflection coefficient (Table S2, eqns 4–6).<br />
(2) The Rubisco capacity is linearly related to the leaf<br />
nitrogen content. The mean slope of the N area–V c,max<br />
relationship (the parameter s N) was derived from AC i<br />
response curves of six alpine species (see<br />
Supplementary Information online) and from published<br />
data for 13 other species (Wohlfahrt et al., 1998). The<br />
minimum leaf nitrogen content, N min, corresponds to<br />
the x-intercept of the Narea–Vc,max linear relationship.<br />
Much attention has been devoted to the vertical distribution<br />
of nitrogen in models of canopy photosynthesis<br />
(Friend, 2001). Under non-uniform distribution of<br />
nitrogen within the canopy, Vc,max is also a function<br />
of canopy depth (Table S2, eqn 12). Following<br />
Schieving et al. (1992), we used generalized circle<br />
equations to model, with a single parameter pN, different<br />
curvatures in the profile of the nitrogen distribution<br />
within the canopy while keeping the total amount of<br />
nitrogen, Ntot, constant (Table S2, eqn 13). If pN ¼ 1,<br />
Narea decreases linearly with canopy depth, while a<br />
uniform distribution is achieved when pN tends<br />
towards infinity. Our preliminary measurements did<br />
not support non-uniform nitrogen distribution in early<br />
and late-snowmelt alpine meadows. Nevertheless, we<br />
maintained this model parameterization in order to<br />
compare the potential impact of nitrogen distribution<br />
with other factors.<br />
(3) The photosynthesis model was combined with a model<br />
of stomatal conductance using the empirical approach<br />
developed by Ball et al. (1987; Table S2, eqns<br />
24–28, online). Lack of data for accurate parameterization<br />
required that several simplifications had to be<br />
made. First, we used the relative humidity of ambient<br />
air as a surrogate for the leaf surface water vapour<br />
pressure. Secondly, boundary layer conductance to<br />
H 2O was set constant. Due to the interdependence of<br />
leaf net photosynthesis and stomatal conductance, we<br />
used an iteration method to calculate C i (Harley and<br />
Tenhunen, 1991). Parameters for the stomatal conductance<br />
sub-model were taken from the work of<br />
Wohlfahrt et al. (1998).<br />
(4) Seasonal GPP was estimated by running the canopy<br />
bulk-photosynthesis model from 10 May to 20<br />
August. This 100-d period was divided into ten subperiods<br />
of 10 d. For each sub-period, we calculated<br />
on an hourly basis the daily time course of air temperature,<br />
light and relative humidity for sunny, cloudy and<br />
intermediate days. Each sub-period comprised six<br />
sunny days, two cloudy days and two intermediate
Page 4 of 11<br />
Baptist and Choler — Gross Primary Production of <strong>Alpine</strong> Meadows<br />
days. These relative contributions were derived from an<br />
analysis of the long-term recordings of daily irradiance<br />
in Briançon (see ‘Climate’, above). The seasonal evolution<br />
of LAI was described as a linear function of<br />
cumulative degree days (DD) after snowmelt, as<br />
follows:<br />
LAIðtÞ ¼LAImax DDðtÞ=DDðtoptÞ<br />
where LAI max is the measured LAI at the time of peak<br />
standing biomass (t opt). This parameterization allows<br />
the capture of the faster initial development of canopies<br />
from late-snowmelt sites.<br />
To assess the relative importance of canopy functional<br />
properties and climatic factors on carbon uptake, we conducted<br />
sensitivity analyses by systematically varying one<br />
factor, i.e. a model parameter or a variable, while keeping<br />
the other factors constant and calculating the relative<br />
effect on the seasonal GPP.<br />
Model validation by canopy gas-exchange measurements<br />
A closed system was used to measure the CO2 exchange<br />
of alpine meadow monoliths taken from an early and a<br />
late-snowmelt site (communities C140 and C180, respectively).<br />
Early snowmelt monoliths were sampled in the<br />
vicinity of the site of where plant trait measurements<br />
were taken. But for practical reasons, late-snowmelt monoliths<br />
were sampled near the Agnel Pass at 2760 m a.s.l.,<br />
located in the Queyras mountain range. For each community,<br />
five monoliths of 20-cm depth and 50 25 cm area<br />
were excavated during autumn 2005, and brought to the<br />
Lautaret <strong>Alpine</strong> field station (2100 m a.s.l.) where they<br />
remained until the following summer for measurements.<br />
Species’ identity and relative cover in the monoliths were<br />
assessed before the measurements and no changes were<br />
found in the floristic composition compared with the<br />
field. This indicated that the monoliths recovered well<br />
from excavation.<br />
For CO2 flux measurements, a 48-L Perspex chamber<br />
was placed over each monolith and sealed around the<br />
base by seating it in a trough of water. Within the<br />
chamber, a fan (Radio Spare) provided air mixing above<br />
the canopy. The chamber was connected to a portable<br />
IRGA (EGM-4, PPSystems, Hitchin, UK) measuring the<br />
CO2 concentration every minute. The rate of change of<br />
CO2 in the chamber was determined by averaging the<br />
measurements under steady-state conditions, which typically<br />
began after 1 min. The measurement periods were<br />
generally brief, not exceeding 3 min in order to minimize<br />
chamber effects. We simultaneously recorded photosynthetically<br />
active radiation (PAR), air and soil temperature, and<br />
relative humidity (RH) within the chamber. The rate of<br />
change in chamber CO2 concentration was converted into<br />
a CO2exchange rate per ground area. Net CO2 fluxes<br />
under light conditions (Fn) were collected on both cloudy<br />
and sunny days in mid-July, 2006. Dark respiration rates<br />
(Rd) were measured before and after the light treatment<br />
by placing a dark cover over the chamber. There was no<br />
indication that respiration increased after the light treatment.<br />
Instantaneous rates of gross CO2 uptake (GPP) were<br />
calculated as GPP ¼ Fn þ Rd. LAI and Ntot were measured<br />
on three 5 5 cm square plots per monolith. The mean LAI<br />
of early snowmelt monoliths was 1.3, and the mean Ntot was<br />
208 mmol N m 22 . The mean LAI of late-snowmelt monoliths<br />
was 2.2, and the mean N tot was 280 mmol N m 22 .<br />
Model performance was evaluated quantitatively by calculating<br />
the square of Pearson’s correlation coefficient (r 2 ),<br />
and qualitatively by the root-mean-square error (RMSE)<br />
and the mean absolute error (MAE), summarizing the<br />
mean differences between observed and predicted values<br />
(Willmott and Matsuura, 2005).<br />
Numerical simulations, statistical analyses and graphics<br />
were performed with the R software environment<br />
(R Development Core Team, 2006). The source code is<br />
available upon request.<br />
RESULTS<br />
Climatic conditions along the snowmelt gradient<br />
The yearly course of soil temperature for the early (C140) and<br />
the late (C180) snowmelt sites is depicted on Fig. 1. The<br />
delayed onset of growing season, by nearly 40 d, is constant<br />
throughout the 7 years of recordings (Fig. 1A). This difference<br />
accounts for a loss of around 280 8Cd at the snowy<br />
site at the time of peak standing biomass, which is 30 %<br />
fewer degree-days than at the early snowmelt site (Fig. 1B).<br />
By comparison, inter-annual variability in cumulative<br />
degree-days in the snowy sites is about an order of magnitude<br />
below that of the early snowmelt sites (Fig. 1B).<br />
The annual cycle of incident solar radiation measured<br />
during cloudless days is fitted well by the clear sky<br />
model (Fig. 2A). Around 60 % of days during the<br />
growing season received more than 70 % clear-sky radiation,<br />
hereafter referred to as ‘sunny days’. Thus, cloudless<br />
weather conditions predominate in this area of the southwestern<br />
Alps. The effect of cloudiness accounts for a<br />
10 % reduction in total radiation received by the early<br />
snowmelt sites compared to the clear sky model<br />
(Fig. 2B). Later snowmelt in C180 is responsible for a<br />
40 % reduction in the cumulative incoming solar radiation<br />
over the growing season when compared with early snowmelt<br />
sites, i.e. from 0.22 MJ cm 22 to 0.13 MJ cm 22<br />
(Fig. 2B). Inter-annual variations are small compared with<br />
those attributable to the timing of snowmelt (Fig. 2B).<br />
The daily time course of climatic data for the three types<br />
of day is given in the Supplementary Information<br />
(Fig. S1, available online).<br />
Plant functional traits along the snowmelt gradient<br />
Graminoids, erect forbs and large leafy rosettes are the<br />
main plant life forms accounting for up to 80 % of the vegetation<br />
cover in the study area (Table 1). Early snowmelt<br />
sites exhibit a discontinuous vegetation cover and a high<br />
proportion of bunch graminoids (e.g. Kobresia myosuroides),<br />
whereas tiny erect forbs and stoloniferous graminoids<br />
are predominant at the snowy sites. The snowmelt
Baptist and Choler — Gross Primary Production of <strong>Alpine</strong> Meadows Page 5 of 11<br />
F IG. 1. (A) Time course of daily mean (+ s.e.) soil temperature at 5 cm<br />
below ground and (B) cumulative degree-days in early and late-snowmelt<br />
sites in the C140 and C180 communities (see Table 1). Data are averaged<br />
over the period 1999–2005 and were recorded at two or three different<br />
sites depending on the year.<br />
gradient was also characterized by a marked shift in<br />
community-aggregated values of leaf traits, with planophilous<br />
canopies with a high Nmass and high SLA at the snowy<br />
sites, and erectophilous canopies with low SLA and high<br />
Narea at the early snowmelt sites (Fig. 3).<br />
Canopies of late-snowmelt sites exhibited larger LAI and<br />
greater Ntot (Table 1). It should be stressed that the range of<br />
variation for LAI (from less than 1.0 at the early snowmelt<br />
sites to around 2.5 at the mid-part of the gradient) largely<br />
exceeded that of Narea. Therefore, the total nitrogen pool<br />
in the canopy, Ntot ¼ LAI Narea is primarily determined<br />
by LAI, and to a lesser extent by Narea.<br />
F IG. 2. (A) Time course of daily integrated incoming radiation in 2002<br />
and comparison with a clear sky model (solid line). Broken lines indicate<br />
reductions of 20 % and 50 % of the clear sky amount of radiation, i.e. the<br />
threshold values chosen for intermediate and cloudy days. The horizontal<br />
segment indicates the growing season period. (B) Cumulative radiation<br />
during the growing season in the C140 and C180 communities. The<br />
clear sky model is shown for comparison. Means (+ s.e.) were<br />
calculated over the period 1999–2004. Data were recorded at Briançon<br />
(1300 m a.s.l.), 30 km from the study site.<br />
Daily and seasonal gross primary production<br />
Modelled values of instantaneous gross CO2 uptake corresponded<br />
well with measurements under cloudless and<br />
overcast conditions, although there was a slight overestimation<br />
for early snowmelt canopies (Fig. 4). Increased<br />
carbon fixation under conditions of high diffuse radiation<br />
was particularly noteworthy for canopies with high LAI<br />
(Fig. 4A). At a PAR of 1000 mmol m 22 s 21 , the CO2<br />
gross uptake of late snowmelt monoliths was 1.5 times
Page 6 of 11<br />
TABLE 1. Features of the seven alpine meadows distributed along the snowmelt gradient. The measurements were made at the<br />
time of peak standing biomass at the end of July 2004. The leaf eccentricity was calculated with an ellipsoidal<br />
leaf-distribution model (see Material and Methods)<br />
higher under overcast conditions compared to sunny conditions<br />
(Fig. 4A), even though ambient air temperature was<br />
around 5 8C lower (Supplementary Information, Fig. S1).<br />
For sunny and overcast conditions, the daily GPP values<br />
for the seven canopies were linearly related to the LAI<br />
(Fig. 5). This may be explained by the strong relationship<br />
between LAI and Ntot (see above and Table 1). For a<br />
given amount of Ntot, we simulated the daily carbon<br />
uptake for a range of LAI (Fig. 5). For low LAI values,<br />
the daily GPP strongly increases with LAI, indicating that<br />
light capture is the main limiting factor of carbon uptake.<br />
Then, the slight decrease of GPP with LAI may be<br />
explained by a decrease in Nmass due to a ‘dilution’<br />
effect. The modelled GPP under cloudy skies was<br />
lowered by around 10 % compared with cloudless skies,<br />
for example 6.5 against 7.3gCm 22 d 21 for C180 canopies<br />
(Fig. 4). We found a negligible effect of leaf eccentricity<br />
(see Table 1) on this trade-off between light capture –<br />
driven by LAI – and CO2 fixation – driven by Nmass<br />
(data not shown). Finally, it should be noted that for a<br />
given N tot, alpine canopies operate at a higher LAI than<br />
the optimal LAI (Fig. 4).<br />
A sensitivity analysis of the seasonal GPP model was<br />
conducted by estimating the effect of a 10 % increase in a<br />
factor while keeping all other characteristics constant<br />
(Fig. 6A). The simulations were run for a 100-d period<br />
(see Material and Methods). A 10 % increase in the<br />
length of growing season (corresponding to a shift of 10<br />
d for the snowmelt) had the greatest impact on the seasonal<br />
GPP (Fig. 6A). By comparison, a shift to clear sky conditions<br />
throughout the season had a weaker effect.<br />
Similarly, increased temperature during the whole season<br />
did not compensate for 10 d lost in the growing season.<br />
LAI and two nitrogen-related factors, Nmass and sN, had a<br />
noticeable impact on GPP, but still lower than that of the<br />
length of growing season (Fig. 6A). The shift from a<br />
uniform to a linearly decreasing nitrogen distribution<br />
( pN ¼ 1) also had a weaker effect on GPP, roughly<br />
similar to the effect of a temperature or an atmospheric<br />
CO2 increase. Finally, a 10 % change in relative humidity,<br />
Mean snowmelt (Julian day)<br />
130 140 150 160 170 180 190<br />
n 7 9 6 4 9 4 8<br />
Percentage cover of plant life form<br />
Bunch graminoids 59 + 1.6 33 +1.7 18+ 0.9 ,1 ,1 ,1 ,1<br />
Other graminoids 15 + 1.4 12+ 0.8 13+ 0.5 28+ 2.5 20+ 1.1 39+ 4.3 48+ 4.8<br />
Erect forbs 14 + 0.6 30+ 1.3 33+ 1.0 36+ 1.6 43+ 2.1 52+ 3.6 52+ 4.8<br />
Large leafy rosette 3 + 0.3 17+ 1.1 17+ 0.9 22+ 3.3 17+ 2.3 4+ 0.5 ,1<br />
Leaf eccentricity 0.5 1.5 1.6 2.7 2.3 2.5 3.1<br />
Leaf area index* 0.8 + 0.09 1.5 + 0.06 2.5 + 0.35 1.2 + 0.10 1.12 + 0.01 2.0 + 0.09 2.4 + 0.18<br />
Ntot (mmol m 22 ) 133 + 4.0 218 + 10.3 356 + 10.2 148 + 6.1 159 + 5.9 257 + 7.4 275 + 16.7<br />
Above-ground phytomass (g m 22 ) 435 + 154 486 + 65 443 + 89 352 + 77 402 + 45 398 + 67 370 + 36<br />
Means + s.e. are shown.<br />
*n ¼ 3 for LAI.<br />
Baptist and Choler — Gross Primary Production of <strong>Alpine</strong> Meadows<br />
leaf angle, or physiological parameters related to stomatal<br />
conductance changed the GPP by less than 1 %.<br />
The integrated values of GPP over the growing season<br />
were around 200 g C m 22 , except for the plant communities<br />
C140 and C150 (Fig. 6B). GPP simulations were also performed<br />
without the snow-induced shortening of the<br />
growing season. For the late-snowmelt sites, the model predicted<br />
a severe reduction in the carbon uptake because of<br />
the delayed snowmelt. However, the results indicated that<br />
the functional properties of these canopies (greater Ntot<br />
and LAI) largely compensated for this negative impact of<br />
a reduced growing season.<br />
DISCUSSION<br />
Our study emphasizes the interplay between short-term and<br />
long-term effects of snow-cover duration on the seasonal<br />
carbon uptake of alpine canopies. Short-term effects are<br />
driven by the direct influence of snow cover on the seasonal<br />
light and temperature regimes, whereas long-term effects<br />
correspond to the ecological sorting of species and plant<br />
traits along snow-cover gradients. A main result is that<br />
the snow-induced reduction in the carbon uptake period is<br />
counterbalanced by increased efficiency of carbon gain,<br />
which is made possible by the particular leaf trait combination<br />
of exploitative strategists that occur at the<br />
late-snowmelt sites. To our knowledge, this is the first<br />
attempt to determine the complex impact of snow on the<br />
seasonal GPP of temperate alpine canopies.<br />
Instantaneous CO2 flux measurements under different<br />
light conditions are predicted well by our canopy photosynthesis<br />
model. We are thus confident that the use of<br />
community-aggregated values of the chosen leaf traits is<br />
relevant to simulate the carbon uptake at the community<br />
level, as hypothesized in previous conceptual work (Diaz<br />
and Cabido, 2001). We found that the assimilation rate of<br />
the whole canopy (expressed per unit ground area) was of<br />
the same magnitude as the leaf assimilation rate (expressed<br />
per unit leaf area), which is consistent with other studies<br />
(Grabherr and Cernusca, 1977; Diemer, 1994; Tappeiner
Baptist and Choler — Gross Primary Production of <strong>Alpine</strong> Meadows Page 7 of 11<br />
F IG. 3. Relationships between community-aggregated values of (A) leaf<br />
nitrogen concentration on a mass basis (Nmass) and mean leaf angle, and<br />
(B) leaf nitrogen content on an area basis (N area) and specific leaf area<br />
(SLA). Means (+ s.e.) were calculated from 4–9 different plots (see<br />
Table 1). The numbers above the squares indicate the mean snowmelt<br />
date for each community in Julian days.<br />
and Cernusca, 1998). Compared with the most widely<br />
investigated temperate alpine community, i.e. Carex<br />
curvula-dominated alpine meadow (Diemer and Körner,<br />
1998), the measured and modelled carbon uptake are<br />
higher for canopies of late-snowmelt sites and lower for<br />
early snowmelt sites.<br />
Scaling-up from detailed plant physiological studies to<br />
ecosystem or regional scales requires taking into account<br />
variations in vegetation composition and community<br />
structure. Approaches based on a priori classification of<br />
plants into functional types have shown some limitations<br />
F IG. 4. Canopy gross CO 2 uptake for sunny and overcast conditions in<br />
mid-July 2006. Closed chamber measurements were performed (A) on<br />
monoliths dominated by Carex foetida sampled at a late-snowmelt site<br />
(C180), and (B) on monoliths dominated by Kobresia myosuroides<br />
sampled at an early snowmelt site (C140). The relationships between<br />
measured and predicted values are shown in the two insets. Evaluation<br />
of the model performance is as follows: (A) n ¼ 50, r 2 ¼ 0.89,<br />
RMSE ¼ 0.033, MAE ¼ 0.026; (B) n ¼ 46, r 2 ¼ 0.95, RMSE ¼ 0.025,<br />
MAE ¼ 0.021.<br />
(Naeem and Wright, 2003; Reich et al., 2004). Our study<br />
shows how integrating the trait-based approaches of comparative<br />
plant ecology with canopy-functioning models<br />
addresses this difficulty. However, recent findings suggest<br />
that functional diversity, i.e. the distribution and range of<br />
trait values in a given plant community, might be another<br />
key driver of ecosystem functioning (Naeem and Wright,<br />
2003; Reich et al., 2004). Clearly, a further challenge in<br />
ecosystem modeling would be to explicitly incorporate<br />
functional diversity effects into biogeochemical models.
Page 8 of 11<br />
Baptist and Choler — Gross Primary Production of <strong>Alpine</strong> Meadows<br />
F IG. 5. Daily estimates of GPP (in g C m 22 ground d 21 ) for (A) sunny<br />
and (B) overcast conditions in mid-July as a function of LAI.<br />
Simulations were run for a range of canopy nitrogen contents, N tot (in<br />
mmol N m 22 ground), represented by the lines. The black squares correspond<br />
to the GPP estimates obtained with the LAI–Ntot combinations of<br />
the seven alpine plant communities studied. Numbers above the squares<br />
as in Fig. 3.<br />
There are several possible shortcomings when simulating<br />
the GPP over the growing season. For example, we considered<br />
seasonal variations in incoming radiation and<br />
degree-days, excluding the potential impact of changes in<br />
soil water content on canopy assimilation. Our continuous<br />
measurements of gravimetric soil water content, at 5 cm<br />
below ground, did not show significant differences<br />
between early and late-snowmelt sites, and only a slight<br />
decrease through the growing season (F. Baptist, unpubl.<br />
res.). The soils of the study site are deep and the average<br />
rainfall between mid-May and mid-August for the three<br />
years, 2004–2006, was around 300 mm. These features<br />
should ensure enough water is available to plants in the<br />
F IG. 6. (A) Sensitivity analysis of the seasonal GPP model. The relative<br />
change in GPP following a 10 % increase in a given factor was calculated<br />
as (GPP new – GPP)/GPP where GPP new is the GPP obtained after changing<br />
the factor. Factors for which the relative effect on GPP did not exceed 1 %<br />
are not shown. Climatic variables and canopy features are distinguished.<br />
LGS is for a 10-day increase of the length of growing season. C a,<br />
ambient CO 2 partial pressure; p N, parameter for nitrogen distribution<br />
(see Material and Methods); sN, slope of the linear relation between<br />
Narea and Vc,max; Nmin, minimum leaf nitrogen content; ul, curvature of<br />
the leaf response of electron transport rate to irradiance. (B) Seasonal estimates<br />
of GPP (in g C m 22 ) for the seven alpine communities studied. For<br />
each bar, the grey part accounts for the carbon uptake during the observed<br />
length of the growing season, and the white part accounts for the missing<br />
carbon uptake due to the delayed snowmelt. Numbers indicate the mean<br />
snowmelt date of each community in Julian days.<br />
conditions of low evaporative demand normal for highelevation<br />
meadows (Körner, 1999). Moreover, we did not<br />
consider all the potential changes in plant functioning<br />
over the growing season. For example, the nitrogen<br />
content of late-snowmelt canopies is particularly high<br />
immediately after their release from snow cover, but then<br />
decreases slightly (F. Baptist, unpubl. res.). This may<br />
cause an over-estimation of the seasonal GPP at
Baptist and Choler — Gross Primary Production of <strong>Alpine</strong> Meadows Page 9 of 11<br />
late-snowmelt sites. These limitations call for further refinements<br />
of the model and, as such, absolute values of the seasonal<br />
GPP estimates should be considered with caution.<br />
However, these limitations should not distort the conclusions<br />
about the relative impact of growing season<br />
length vs. canopy functional properties on carbon uptake<br />
along the snowmelt gradient.<br />
In our simulations, leaf geometrical properties did not<br />
exert a strong influence on GPP. Canopy photosynthesis<br />
models, based on the Monsi–Saeki theory, also show that<br />
the assimilation rate of canopies with a LAI under 2.5 is<br />
largely independent of the extinction coefficient, K<br />
(Hirose, 2005). However, our model neglects other potential<br />
effects of leaf inclination, for example the effect on<br />
night-time frost and possible low-temperature photoinhibition<br />
(Germino and Smith, 2001). Presently, we do<br />
not have enough empirical data to assess the relative<br />
importance of such mechanisms at the canopy level and<br />
over the growing season.<br />
The results suggest that the alpine canopies do not<br />
operate at their optimal LAI (Fig. 5). It is clear that<br />
stand-level properties are not exclusively dependent upon<br />
maximizing carbon uptake and that individuals are the<br />
units under selection, not canopies (Hirose, 2005). Some<br />
theoretical approaches have also highlighted that the<br />
optimal LAI is not evolutionary stable if one takes into<br />
account competition among individuals (Anten and<br />
Hirose, 2001). Perhaps more interestingly, the comparison<br />
of canopy functioning along the snowmelt gradient might<br />
call for a more detailed investigation of the optimal LAI–<br />
N relationships for different lengths of growing season.<br />
As reported in other studies (De Pury and Farquhar,<br />
1997; Gu et al., 2002), the sun–shade model allows a<br />
more realistic treatment of the difference in the canopy<br />
photosynthetic response to direct and diffuse radiation.<br />
Increased carbon uptake under diffuse radiation<br />
has already been reported (Roderick et al., 2001). The<br />
deep-shaded leaf fraction within vegetation canopies is<br />
strongly reduced on cloudy days compared to cloudless<br />
days as a result of the increased diffuse fraction of incoming<br />
radiation. Furthermore, at noon there is a lower probability<br />
that canopy photosynthetic saturation will occur under overcast<br />
conditions compared to sunny conditions (Gu et al.,<br />
2002).<br />
The results support the view that the traits of exploitative<br />
strategists (especially the high leaf N mass, the rapid growth<br />
of photosynthetic organs) should permit the constraint of<br />
a shortened carbon-uptake period to be overcome.<br />
However, both conservative and exploitative strategies are<br />
known to be adaptive under severe limitation of the<br />
carbon uptake period (Kikuzawa and Kudo, 1995).<br />
Obviously, the exploitative strategy is strongly dependent<br />
upon sufficient soil nutrient availability. The late-snowmelt<br />
sites that were investigated benefit from a pulse of inorganic<br />
nitrogen at the time of snowmelt, as compared to<br />
early snowmelt sites (F. Baptist, unpubl. res.; see<br />
Supplementary Information online). These results are also<br />
consistent with other comparisons along snowmelt gradients<br />
(Bowman et al., 1993; Fisk et al., 1998; Jaeger<br />
et al., 1999). It is therefore likely that in the late-snowmelt<br />
sites that were studied, this nutrient pulse at the onset of<br />
growing season allowed a rapid expansion of photosynthetic<br />
tissues, which ensured efficient light capture and carbon<br />
fixation.<br />
Conclusions<br />
For cold ecosystems, the carbon-uptake period is primarily<br />
determined by the snow-cover duration. Here, we have<br />
demonstrated that the snow-induced changes in the length<br />
of growing season had the highest impact on the seasonal<br />
GPP. Our study is among the first ones to integrate the functional<br />
trait approach with instantaneous measurements and<br />
integrated estimates of ecosystem functioning. This<br />
approach is particularly promising because continuous<br />
recordings of CO2 fluxes have been shown to be technically<br />
difficult in alpine environments with strong bioclimatic<br />
gradients.<br />
Climatic change in will affect snow regimes in temperate<br />
mountains (Keller et al., 2005; Euskirchen et al., 2006).<br />
Increased temperature and reduced snow precipitation<br />
may be responsible for earlier snowmelt. But the phenological<br />
responses of alpine species to a lengthening growing<br />
season are still hard to predict (Starr et al., 2000; Wipf<br />
et al., 2006; Bjork and Molau, 2007). One might predict<br />
a small impact on carbon uptake if plant communities are<br />
dominated by periodic species, i.e. species with a fixed,<br />
genetically controlled growing period (Sorenson, 1941).<br />
Conversely, the short-term consequences for ecosystem productivity<br />
would be stronger if aperiodic species, i.e. species<br />
able to extend their vegetative growth, are dominatant.<br />
Future studies should address these issues for a better estimate<br />
of seasonal GPP in alpine meadows in response to<br />
global climate change.<br />
SUPPLEMENTARY INFORMATION<br />
Supplementary material is available online at http://aob.<br />
oxfordjournals.org/ and consists of the following figures<br />
and tables. Figure S1: the daily course of temperature, relative<br />
humidity and photosynthetically active radiation for<br />
sunny, intermediate and cloudy days in May–August.<br />
Figure S2: Relationship between the maximum rate of carboxylation<br />
(Vc,max) and the leaf nitrogen content per unit<br />
area (Narea). Figure S3: daily uptake of nitrate and<br />
ammonium by a resin bag inserted at 5 cm below ground<br />
in the C140, C160 and C180 communities. Table S1: list<br />
of constants, parameters and lumped variables used in the<br />
model. Table S2: list of the main equations of the model.<br />
ACKNOWLEDGEMENTS<br />
The authors would like to acknowledge S. Aubert,<br />
K. Charra-Vascou, C. Flahault and G. Girard, who assisted<br />
in the field and the laboratory. We are indebted to<br />
M. Robson and F. Quétier for discussions and comments<br />
on an earlier version of this manuscript. Logistical<br />
support was provided by the <strong>Station</strong> <strong>Alpine</strong> J. <strong>Fourier</strong> of<br />
Grenoble. This work was supported by the University of<br />
Grenoble and by the Centre National de la Recherche
Page 10 of 11<br />
Baptist and Choler — Gross Primary Production of <strong>Alpine</strong> Meadows<br />
Scientifique (CNRS). F. Baptist received a Ph.D. grant from<br />
the French Ministère de l’Education Nationale, de<br />
l’Enseignement Supérieur et de la Recherche.<br />
LITERATURE CITED<br />
Anten NPR. 2005. Optimal photosynthetic characteristics of individual<br />
plants in vegetation stands and implications for species coexistence.<br />
Annals of Botany 95: 495–506.<br />
Anten NPR, Hirose T. 2001. Limitations on photosynthesis of competing<br />
individuals in stands and the consequences for canopy structure.<br />
Oecologia 129: 186–196.<br />
Anten NPR, Schieving F, Werger MJA. 1995. Patterns of light and nitrogen<br />
distribution in relation to whole canopy carbon gain in C3 and C4<br />
mono- and dicotyledonous species. Oecologia 101: 504–513.<br />
Arora VK, Boer GJ. 2005. A parameterization of leaf phenology for the<br />
terrestrial ecosystem component of climate models. Global Change<br />
Biology 11: 39–59.<br />
Ball JT, Woodrow IE, Berry JA. 1987. A model predicting stomatal conductance<br />
and its contribution to the control of photosynthesis under<br />
different environmental conditions. In: Biggens J. ed. Progress in<br />
photosynthesis research. The Netherlands: Martinus Nijhoff<br />
Publishers.<br />
Bjork RG, Molau U. 2007. Ecology of alpine snowbeds and the impact of<br />
global change. Arctic Antarctic and <strong>Alpine</strong> Research 39: 34–43.<br />
Bowman WD, Theodose TA, Schardt JC, Conant RT. 1993. Constraints<br />
of nutrient avaibility on primary production in two alpine communities.<br />
Ecology 74: 2085–2097.<br />
Brooks PD, Schmidt SK, Williams MW. 1997. Winter production of CO 2<br />
and N2O from alpine tundra: environmental controls and relationship<br />
to inter-system C and N fluxes. Oecologia 110: 403–413.<br />
von Caemmerer S, Farquhar GD. 1981. Some relatoinships between the<br />
biochemistry of photosynthesis and the gas exchange of leaves. Planta<br />
153: 376–387.<br />
Campbell GS. 1990. Derivation of an angle density function for canopies<br />
with ellipsoidal leaf angle distributions. Agricultural and Forest<br />
Meteorology 49: 173–176.<br />
Campbell JL, Mitchell MJ, Groffman PM, Christenson LM, Hardy<br />
JP. 2005. Winter in northeastern North America: a critical period<br />
for ecological processes. Frontiers in Ecology and the Environment<br />
3: 314–322.<br />
Cernusca A. 1989. Struktur und Funktion von Graslandökosystemen im<br />
Nationalpark Hohe tauern. Veröffenentlichungen des Österreich<br />
MaB-Hochgebirgsprogramms Hohe Tauern. Innsbruck: Österreich<br />
Akademische Wiss and Wagner.<br />
Cernusca A, Bahn M, Chemini C, Graber W, Siegwolf R, Tappeiner U,<br />
Tenhunen J. 1998. ECOMONT: a combined approach of field<br />
measurements and process-based modelling for assessing effects of<br />
land-use changes in mountain landscapes. Ecological Modelling<br />
113: 167–178.<br />
Chapin FS III, Bret-Harte MS, Hobbie SE, Zhong H. 1996. Plant functional<br />
types as predictors of transcient responses of arctic vegetation<br />
to global change. Journal of Vegetation Science 7: 693–702.<br />
Choler P. 2005. Consistent shifts in <strong>Alpine</strong> plant traits along a mesotopographical<br />
gradient. Arctic Antarctic and <strong>Alpine</strong> Research 37:<br />
444–453.<br />
Churkina G, Schimel D, Braswell BH, Xiao XM. 2005. Spatial analysis<br />
of growing season length control over net ecosystem exchange.<br />
Global Change Biology 11: 1777–1787.<br />
Cornelissen JHC, Perez Harguindeguy N, Diaz S, Grime JP, Marzano<br />
B, Cabido M, Vendramini F, Cerabolini B. 1999. Leaf structure and<br />
defence control litter decomposition rate across species and life forms<br />
in regional floras on two continents. New Phytologist 143: 191–200.<br />
Cornelissen JHC, Lavorel S, Garnier E, Diaz S, Buchmann N, Gurvich<br />
DE, et al. 2003. A handbook of protocols for standardised and easy<br />
measurement of plant functional traits worldwide. Australian<br />
Journal of Botany 51: 335–380.<br />
De Pury DGG, Farquhar GD. 1997. Simple scaling of photosynthesis<br />
from leaves to canopies without the errors of big-leaf models.<br />
Plant, Cell and Environment 20: 537–557.<br />
Diaz S, Cabido M. 2001. Vive la difference: plant functional diversity<br />
matters to ecosystem processes. Trends in Ecology and Evolution<br />
16: 646–655.<br />
Diemer M, Körner C. 1998. Transient enhancement of carbon uptake in<br />
an alpine grassland ecosystem under elevated CO2. Arctic and <strong>Alpine</strong><br />
Research 30: 381–387.<br />
Diemer MW. 1994. Mid-season gas exchange of an alpine grassland under<br />
elevated CO2. Oecologia 98: 429–435.<br />
Epstein HE, Chapin FS, Walker MD, Starfield AM. 2001. Analyzing<br />
the functional type concept in arctic plants using a dynamic vegetation<br />
model. Oikos 95: 239–252.<br />
Euskirchen ES, McGuire AD, Kicklighter DW, Zhuang Q, Clein JS,<br />
Dargaville RJ, et al. 2006. Importance of recent shifts in soil<br />
thermal dynamics on growing season length, productivity, and<br />
carbon sequestration in terrestrial high-latitude ecosystems. Global<br />
Change Biology 12: 731–750.<br />
Farquhar GD, Von Caemmerer S, Berry JA. 1980. A biochemical<br />
model of photosynthetic CO2 assimilation in leaves of C3 species.<br />
Planta 149: 341–347.<br />
Fisk MC, Schmidt SK, Seastedt TR. 1998. Topographic patterns of<br />
above- and belowground production and nitrogen cycling in <strong>Alpine</strong><br />
tundra. Ecology 79: 2253–2266.<br />
Friend AD. 2001. Modelling canopy CO2 fluxes: are ‘big-leaf’ simplifications<br />
justified? Global Ecology and Biogeography 10: 603–619.<br />
Garnier E, Cortez J, Billes G, Navas ML, Roumet C, Debussche M,<br />
et al. 2004. Plant functional markers capture ecosystem properties<br />
during secondary succession. Ecology 85: 2630–2637.<br />
Germino MJ, Smith WK. 2001. Relative importance of microhabitat,<br />
plant form and photosynthetic physiology to carbon gain in two<br />
alpine herbs. Functional Ecology 15: 243–251.<br />
Grabherr G, Cernusca A. 1997. Influence of radiation, wind, and temperature<br />
on the CO2 gas exchange of the <strong>Alpine</strong> dwarf shrub community<br />
Loiseleurietum cetrarietosum. Photosynthetica 11: 22–28.<br />
Grant RF, Oechel WC, Ping CL. 2003. Modelling carbon balances of<br />
coastal arctic tundra under changing climate. Global Change<br />
Biology 9: 16–36.<br />
Grime JP. 1998. Benefits of plant diversity to ecosystems: immediate,<br />
filter and founder effects. Journal of Ecology 86: 902–910.<br />
Gu LH, Baldocchi D, Verma SB, Black TA, Vesala T, Falge EM, Dowty<br />
PR. 2002. Advantages of diffuse radiation for terrestrial ecosystem<br />
productivity. Journal of Geophysical Research Atmospheres 107:<br />
D6, 4050, doi:10.1029/2001JD001242.<br />
Hammerle A, Haslwanter A, Schmitt M, Bahn M, Tappeiner U,<br />
Cernusca A, Wohlfahrt G. 2007. Eddy covariance measurements<br />
of carbon dioxide, latent and sensible energy fluxes above a<br />
meadow on a mountain slope. Boundary Layer Meteorology 122:<br />
397–416.<br />
Harley PC, Tenhunen JD. 1991. Modeling the photosynthetic response of<br />
C3 leaves to envionmental factors. In: Boote KJ, Loomis RS. eds.<br />
Modelling crop photosynthesis – from biochemistry to canopy.<br />
Madison: Crop Science Society of America, 17–39.<br />
Hikosaka K, Hirose T. 1997. Leaf angle as a strategy for light competition:<br />
optimal and evolutionarily stable light-extinction coefficient<br />
within a leaf canopy. Ecoscience 4: 501–507.<br />
Hirose T. 2005. Development of the Monsi–Saeki theory on canopy structure<br />
and function. Annals of Botany 95: 483–494.<br />
Hobbie SE, Schimel JP, Trumbore SE, Randerson JR. 2000. Controls<br />
over carbon storage and turnover in high-latitude soils. Global<br />
Change Biology 6 Suppl. 1: 196–210.<br />
Jaeger CH, Monson RK, Fisk MC, Schmidt SK. 1999. Seasonal partitioning<br />
of nitrogen by plants and soil microorganisms in an alpine<br />
ecosystem. Ecology 80: 1883–1891.<br />
Jones HG, Pomeroy JW, Walker DA, Hoham RW. 2000. Snow ecology:<br />
an interdisciplinary examination of snow-covered ecosystems.<br />
Cambridge: Cambridge University Press.<br />
Keller F, Goyette S, Beniston M. 2005. Sensitivity analysis of snow cover<br />
to climate change scenarios and their impact on plant habitats in<br />
alpine terrain. Climatic Change 72: 299–319.<br />
Kikuzawa K, Kudo G. 1995. Effects on the length of the snow-free period<br />
on leaf longevity in alpine shrubs: a cost–benefit model. Oikos 73:<br />
98–104.<br />
Komarkova V, Webber PJ. 1978. An alpine vegetation map of Niwot<br />
Ridge, Colorado. Arctic and <strong>Alpine</strong> Research 1: 1–29.
Baptist and Choler — Gross Primary Production of <strong>Alpine</strong> Meadows Page 11 of 11<br />
Körner C. 1999. <strong>Alpine</strong> plant life. Berlin: Springer Verlag.<br />
Kudo G, Ito K. 1992. Plant distribution in relation to the length of the<br />
growing season in a snow-bed in the Taisetsu mountains, northern<br />
Japan. Vegetatio 98: 319–328.<br />
Kudo G, Nordenhall U, Molau U. 1999. Effects of snowmelt timing on<br />
leaf traits, leaf production, and shoot growth of alpine plants: comparisons<br />
along a snowmelt gradient in northern Sweden. Ecoscience<br />
6: 439–450.<br />
Lavorel S, Garnier E. 2002. Predicting changes in community composition<br />
and ecosystem functioning from plant traits: revisiting the<br />
Holy Grail. Functional Ecology 16: 545–556.<br />
Li SG, Asanuma J, Eugster W, Kotani A, Liu JJ, Urano T, et al. 2005.<br />
Net ecosystem carbon dioxide exchange over grazed steppe in central<br />
Mongolia. Global Change Biology 11: 1941–1955.<br />
Monson RK, Lipson DL, Burns SP, Turnipseed AA, Delany AC,<br />
Williams MW, Schmidt SK. 2006. Winter forest soil respiration controlled<br />
by climate and microbial community composition. Nature 439:<br />
711–714.<br />
Naeem S, Wright JP. 2003. Disentangling biodiversity effects on ecosystem<br />
functioning: deriving solutions to a seemingly insurmountable<br />
problem. Ecology Letters 6: 567–579.<br />
Onipchenko VG, Blinnikov MS. 1994. Experimental investigation of<br />
alpine plant communities in the Northwestern Caucasus.<br />
Veröffentlichungen des Geobotanischen Institutes der ETH, Stiftung<br />
Rübel, Zürich 115: 91–98.<br />
Quetier F, Thebault A, Lavorel S. 2007. Plant traits in a state and transition<br />
framework as markers of ecosystem response to land-use<br />
change. Ecological Monographs 77: 33–52.<br />
R Development Core Team. 2006. R: a language and environment for<br />
statistical computing. Vienna: R Foundation for Statistical<br />
Computing.<br />
Reich PB, Tilman D, Naeem S, Ellsworth DS, Knops J, Craine J,<br />
Wedin D, Trost J. 2004. Species and functional group diversity independently<br />
influence biomass accumulation and its response to CO 2<br />
and N. Proceedings of the National Academy of Sciences of the<br />
United States of America 101: 10101–10106.<br />
Rigollier C, Bauer O, Wald L. 1999. On the clear sky model of the 4th<br />
European Solar Radiation Atlas with respect to the Heliosat method.<br />
Solar Energy 68: 33–48.<br />
Roderick ML, Farquhar GD, Berry SL, Noble IR. 2001. On the direct<br />
effect of clouds and atmospheric particles on the productivity and<br />
structure of vegetation. Oecologia 129: 21–30.<br />
Schieving F, Werger MJA, Hirose T. 1992. Canopy structure, nitrogen<br />
distribution and whole canopy photosynthesic carbon gain in<br />
growing and flowering stands of tall herbs. Vegetatio 102: 173–181.<br />
Sorenson T. 1941. Temperature relations and phenology of north-east<br />
Greenland flowering plants. Meddelelser 125: 1–305.<br />
Spitters CJT. 1986. Separating the diffuse and direct component of global<br />
radiation and its implications for modelling canopy photosynthesis.<br />
Part II. Calculation of canopy photosynthesis. Agricultural and<br />
Forest Meteorology 38: 231–242.<br />
Starr G, Oberbauer SF, Pop EW. 2000. Effects of lengthened growing<br />
season and soil warming on the phenology and physiology of<br />
Polygonum bistorta. Global Change Biology 6: 357–369.<br />
Tappeiner U, Cernusca A. 1998. Model simulation of spatial distribution<br />
of photosynthesis in structurally differing plant communities in the<br />
Central Caucasus. Ecological Modelling 113: 201–223.<br />
Theurillat J-P, Aeschimann D, Küpfer P, Spichiger R. 1994. The higher<br />
vegetation units of the alps. Colloques Phytosociologiques 23:<br />
189–239.<br />
Turner DP, Ollinger SV, Kimball JS. 2004. Integrating remote sensing<br />
and ecosystem process models for landscape- to regional-scale analysis<br />
of the carbon cycle. BioScience 54: 573–584.<br />
Violle C, Navas ML, Vile D, Kazakou E, Fortunel C, Hummel I,<br />
Garnier E. 2007. Let the concept of trait be functional! Oikos 116:<br />
882–892.<br />
Vourlitis GL, Harazono Y, Oechel WC, Yoshimoto M, Mano M. 2000.<br />
Spatial and temporal variations in hectare-scale net CO 2 flux, respiration<br />
and gross primary production of Arctic tundra ecosystems.<br />
Functional Ecology 14: 203–214.<br />
Willmott CJ, Matsuura K. 2005. Advantages of the mean absolute error<br />
(MAE) over the root mean square error (RMSE) in assessing average<br />
model performance. Climate Research 30: 79–82.<br />
Wipf S, Rixen C, Mulder CPH. 2006. Advanced snowmelt causes shift<br />
towards positive neighbour interactions in a subarctic tundra community.<br />
Global Change Biology 12: 1496–1506.<br />
Wohlfahrt G, Bahn M, Horak I, Tappeiner U, Cernusca A. 1998. A<br />
nitrogen sensitive model of leaf carbon dioxide and water vapour<br />
gas exchange: application to 13 key species from differently<br />
managed mountain grassland ecosystems. Ecological Modelling<br />
113: 179–199.<br />
Wright IJ, Reich PB, Westoby M, Ackerly DD, Baruch Z, Bongers F,<br />
et al. 2004. The worldwide leaf economics spectrum. Nature 428:<br />
821–827.
Supplementary material 1.<br />
Relationship between the maximum rate of carboxylation (Vcmax ) and the leaf nitrogen<br />
content per unit area. Black : data from our study. Grey : data from Wohlfahrt et al. (1999).<br />
Vc −5.<br />
50 + 0.<br />
42⋅<br />
N<br />
max = a . R 2 =0.57, P
Supplementary material 2.<br />
Daily uptake of nitrate (A) and ammonium (B) by resin bag inserted iat 5 cm depth in soil in<br />
C180, C160 and C140 communities from snowmelt until July 2005 (period 1) and from July<br />
to September (period 2). Different letters indicate significant differences within each period<br />
(p
site effect (F2,27 = 2.67, P=0.08)<br />
Community effect × site effect (F4,27=1.21, P=0.33)<br />
Period 2 :<br />
Community effect (F2,13 = 0.26, P=0.76)<br />
site effect (F2,13 = 1.35, P=0.29)<br />
Community effect × site effect (F4,13=0.18, P=0.94)<br />
Experimental procedure :<br />
Nylon bags (10 × 5 cm) containing 5 g of mixed anion–cation exchange resin (Amberlite<br />
IRN150, VWR InternationalS.A.S., Fontenay-sous-Bois, France) were inserted into the soil at<br />
5cm depth in field site. Bags were installed at four locations in each of the three replicates of<br />
the C140 , C160 and C180 communities. Half were incubated (1) from snowmelt until July<br />
2005 (period 1) and the other half (2) for three months from July to September (period 2).<br />
Captured nitrate and ammonium were released from the resins by extraction in 100 ml of 2M<br />
KCl. The resulting concentrations of nitrate (A) and ammonium (B) were detected using a<br />
colorimetric chain (Fiastar 5012 Flow Injection Analyser, Foss Tecator AB, Sweden). Rates<br />
of nitrate and ammonium uptake were estimated as µg N uptake day -1 g resin -1 .<br />
A two-way ANOVA was used to test site and community effects on nitrate and ammonium<br />
uptake within each period. Statistical analyses were performed with the R software<br />
environment (R Development Core Team, 2006).
Supplementary Fig. S1<br />
The daily course of temperature, relative humidity (RH), and photosynthetically<br />
active radiation (PAR) for sunny, intermediate and cloudy days. Means and standard<br />
errors are given for May, June, July and August. The values are averaged over a 6year-long<br />
period and were collected at the alpine field station at Lautaret (2100 m<br />
a.s.l.) located 5 km from the study site.<br />
PAR<br />
Temperature<br />
RH<br />
0 500 1000 1500 2000<br />
0 5 10 15 20<br />
0 20 40 60 80<br />
Sunny days<br />
5 10 15 20<br />
Hour<br />
Intermediate<br />
days Cloudy days<br />
5 10 15 20<br />
Hour<br />
2<br />
-<br />
-<br />
-<br />
-<br />
5 10 15 20<br />
Hour<br />
May<br />
June<br />
July<br />
August
Supplementary Information: Tables<br />
TABLE S1. Constants, parameters and lumped variables used in the model<br />
Symbol<br />
Value Units Description Reference<br />
A. Solar geometry and irradiance models<br />
aS rad Solar azimuthal angle<br />
I0 µmol m –2 s –1 Incident PAR above the canopy<br />
I0b µmol m –2 s –1 Beam incident PAR above the canopy<br />
I0d µmol m –2 s –1 Diffuse incident PAR above the canopy<br />
ISc<br />
1367 W m –2<br />
Solar constant<br />
zs rad Solar zenithal elevation<br />
λ 0.1129 rad Longitude of the site<br />
ϕ 0.7866 rad Geographic latitude of the site<br />
B. Canopy architecture and light interception models<br />
al rad Leaf azimuthal angle of a normal to the leaf surface<br />
f 0.15 Spectral Correction Factor (2)<br />
Fh m 2 m –2 Cumulated leaf area from the top of the canopy to a given height per unit ground area<br />
kd<br />
0.78 Diffuse and scattered PAR extinction coefficients (2)<br />
LAI m 2 m –2 Leaf Area Index<br />
zl rad Zenithal angle of the normal to the leaf surface<br />
ε Ratio of the axes of the ellipsoid in the leaf distribution model<br />
σ 0.15 Leaf scattering coefficient of PAR (sum of leaf reflectance and leaf transmittivity to PAR) (2)<br />
θ rad Incidence angle of the beam light on the leaf foliage element<br />
7
C. Photosynthesis and stomatal conductance models<br />
EaΓ*<br />
EaKc<br />
EaKo<br />
gb,H2O<br />
gmin,H2O<br />
37830 kJ mol –1 Activation energy of Γ*<br />
65000 kJ mol –1 Activation energy of Kc<br />
36000 kJ mol –1 Activation energy of Ko<br />
3.4 mol m –2 s –1 Boundary layer conductance to water vapour<br />
80 mmol m –2 s –1 Minimum stomatal conductance to water vapour at the light compensation point<br />
HaVc,max 87624 J mol –1 Activation energy of Jmax<br />
HaJmax<br />
HdJmax<br />
HdVc,max<br />
ref<br />
K c<br />
T<br />
Tref<br />
o<br />
75926 J mol –1 Activation energy of Jmax<br />
194482 J mol –1 De-activation energy of Jmax<br />
201550 J mol –1 De-activation energy of Vc,max<br />
404 µbar Michaelis–Menten constant for Rubisco carboxylation at T = Tref<br />
K 248 mbar Michaelis–Menten constant for Rubisco oxygenation at T = Tref<br />
m 14.6 Empirical coefficient for the sensitivity of gs,H2O to A, Cs and RH<br />
nCO2 0.000335 Molar fraction of carbon dioxide in the atmosphere<br />
nO2 0.21 Molar fraction of oxygen in the atmosphere<br />
Narea mmol m –2 Leaf nitrogen content per unit leaf area<br />
Nmass g g –1 Leaf nitrogen concentration, per unit of dry weighted leaf mass<br />
8<br />
(4)<br />
(4)<br />
(4)<br />
(4)<br />
(5)<br />
(5)<br />
(5)<br />
(5)<br />
(2)<br />
(2)<br />
(4)
Nmin 13.1 mmol m –2 x-intercept of the linear relationship between Narea and Vc,max<br />
Ntot mmol m –2 Total canopy leaf nitrogen per unit ground area<br />
O mbar Atmospheric oxygen partial pressure<br />
Patm Pa Mean atmospheric pressure (as a function of the elevation of the site)<br />
pN Curvature coefficient for nitrogen distribution within the canopy<br />
R 8.31 J mol –1 K –1 Universal gas constant<br />
RH % Relative Humidity of the ambient air<br />
SJmax<br />
SVc,max<br />
643 J K –1 mol –1 Entropy term of the Jmax response parameter<br />
656 J K –1 mol –1 Entropy term of the Vc,max temperature response<br />
sN 0.42 mmol µmol –1 s Slope of the linear relation between Narea and Vc,max at T = Tref<br />
T K Air (ambiant) temperature<br />
Tref 293 K Reference temperature<br />
Γ ref T *<br />
44 µbar CO2 compensation point of photosynthesis in the absence of mitochondrial respiration at T = Tref<br />
θl 0.7 Curvature of the leaf response of electron transport (J) to irradiance<br />
θc 0.9 Curvature factor of response of canopy photosynthesis to irradiance<br />
9<br />
(3)<br />
(3)<br />
(1)<br />
(2)<br />
(2)
References<br />
(1) Bernacchi CJ, Singsaas EL, Pimentel C, Portis AR, Long SP. 2001. Improved temperature response functions for models of Rubisco-limited<br />
photosynthesis. Plant, Cell and Environment 24: 253–259.<br />
(2) De Pury DGG, Farquhar GD. 1997. Simple scaling of photosynthesis from leaves to canopies without the errors of big-leaf models. Plant, Cell<br />
and Environment 20: 537–557.<br />
(3) Harley PC, Tenhunen JD. 1991. Modeling the photosynthetic response of C3 leaves to envionmental factors. In: America CSSo ed. Modelling<br />
Crop Photosynthesis from Biochemistry to Canopy. Madison.<br />
(4) Wohlfahrt G, Bahn M, Horak I, Tappeiner U, Cernusca A. 1998. A nitrogen sensitive model of leaf carbon dioxide and water vapour gas<br />
exchange: application to 13 key species from differently managed mountain grassland ecosystems. Ecological Modelling 113: 179–199. (Parameters<br />
obtained for meadows.)<br />
(5) Wohlfahrt G, Bahn M, Haubner E, Horak I, Michaeler W, Rottmar K, Tappeiner U, Cernusca A. 1999. Inter-specific variation of the<br />
biochemical limitation to photosynthesis and related leaf traits of 30 species from mountain grassland ecosystems under different land use. Plant Cell<br />
and Environment 22: 1281–1296.<br />
10
TABLE S2. Main equations of the model<br />
Note: The equations of the Clear Sky Model giving I0b and I0d under cloudless conditions are not described.<br />
Equations<br />
Canopy light interception<br />
g( z<br />
l<br />
Λ = ε<br />
Λ = ε<br />
z<br />
l<br />
3<br />
) = 2ε<br />
sin(<br />
z ) / [ Λ(<br />
cos ( z ) + ε<br />
+ sin<br />
−1<br />
l<br />
( X)<br />
/<br />
2<br />
X,<br />
with X<br />
1−<br />
ε<br />
sin<br />
, if<br />
+ ln[<br />
( 1+<br />
X)<br />
/ ( 1−<br />
X)]<br />
2εX<br />
, with X = 1−<br />
ε<br />
= 2<br />
π<br />
π / 2<br />
∫<br />
0<br />
g( z ) z dα<br />
l<br />
l<br />
2ππ/<br />
2<br />
1<br />
G( zS<br />
, aS<br />
) = cos θ<br />
2π<br />
∫∫<br />
0<br />
0<br />
=<br />
g(<br />
z<br />
l<br />
l<br />
) dz<br />
l<br />
2<br />
2<br />
da<br />
l<br />
2<br />
( z )) ] where<br />
l<br />
2<br />
ε<<br />
1 and<br />
−2<br />
, if<br />
ε <<br />
1<br />
Description<br />
Probability density function describing the<br />
fraction of leaf area with an inclination<br />
between zl and zl +dzl in the ellipsoidal leaf<br />
distribution model<br />
Average leaf inclination angle<br />
Projection of the foliage area on a plane<br />
perpendicular to the incident beam<br />
direction averaged over leaf elements of all<br />
orientations<br />
k b = G(<br />
zS<br />
, aS)<br />
/ cos aS<br />
Beam radiation extinction coefficient<br />
ρ<br />
ρ<br />
cb<br />
cd<br />
=<br />
=<br />
1-<br />
π / 2<br />
∫<br />
0<br />
exp<br />
cos z<br />
0.<br />
5<br />
0.<br />
5<br />
[ 1−<br />
( 1−<br />
s)<br />
] / [ 1+<br />
( 1 s)<br />
]<br />
2 ρhcb<br />
k b / (1+<br />
k b )<br />
with ρhcb<br />
=<br />
−<br />
S<br />
ρ<br />
cb<br />
dz<br />
S<br />
11<br />
Canopy reflection coefficient for beam<br />
PAR<br />
Canopy reflection coefficient for diffuse<br />
PAR<br />
No.<br />
(1)<br />
(2)<br />
(3)<br />
(4)<br />
(5)<br />
(6)
f<br />
sun<br />
- k b Fh<br />
; fsha<br />
= 1−<br />
(Fh)<br />
= exp<br />
f<br />
Sunlit and shaded fraction at a given height<br />
Ibl (Fh<br />
) (1-<br />
ρcb)<br />
(1-<br />
σ)<br />
kb<br />
I0b<br />
I<br />
I<br />
I<br />
dl<br />
sl<br />
(F<br />
h<br />
h<br />
)<br />
(F ) = I<br />
cs un<br />
=<br />
sun<br />
=<br />
0.5<br />
Fh<br />
Incident beam light at a given height Fh per<br />
unit leaf area<br />
0.5<br />
0.5<br />
(-(1-σ)<br />
k F )<br />
= (1-<br />
ρ<br />
d h<br />
cd ) (1-<br />
σ)<br />
kd<br />
I0d<br />
exp<br />
Diffuse light at a given height Fh per unit<br />
LAI<br />
∫<br />
0<br />
0b<br />
⎡<br />
⎢⎣<br />
(1-<br />
ρ<br />
cb<br />
0.5<br />
) (1-<br />
σ)<br />
k<br />
b<br />
exp<br />
0.5<br />
(-Fh<br />
(1-σ<br />
) k b ) 0.5 (-F k )<br />
- (1-<br />
σ)<br />
k h b<br />
bexp<br />
[ I ( F ) + I ( F ) + I ( F ) ] f ( F )dF<br />
; I = [ I ( F ) + I ( F ) ]<br />
bl<br />
h<br />
dl<br />
h<br />
sl<br />
h<br />
sun<br />
h<br />
h<br />
csha<br />
LAI<br />
∫<br />
0<br />
dl<br />
h<br />
sl<br />
h<br />
⎤<br />
⎥⎦<br />
f<br />
sha<br />
( F )dF<br />
h<br />
h<br />
leaf area<br />
Scattered light at a given height Fh per unit<br />
leaf area<br />
Incident radiation on the sunlit and shaded<br />
fraction<br />
Nitrogen distribution within the canopy<br />
Nred = Ntot<br />
− LAI Nmin<br />
Nitrogen pool which can be distributed per<br />
N<br />
area<br />
( F<br />
h<br />
)<br />
= N<br />
min<br />
+ N<br />
red<br />
( 1−<br />
( F<br />
h<br />
/ LAI)<br />
p N<br />
1/<br />
p<br />
)<br />
N<br />
( LAIΩ)<br />
−1<br />
with Ω =<br />
1<br />
∫<br />
0<br />
(1-<br />
x<br />
12<br />
p N 1/<br />
p N<br />
)<br />
dx<br />
unit ground area<br />
Nitrogen leaf concentration at a given<br />
height Fh per unit leaf area<br />
(7)<br />
(8)<br />
(9)<br />
(10)<br />
(11)<br />
(12)<br />
(13)
Photosynthesis and stomatal conductance models<br />
[ N (F ) - N ]<br />
T<br />
Vcmax (Fh<br />
) sN<br />
area h min<br />
ref = (in µmol CO2 m –2 leaf s –1 ) Photosynthetic RUBISCO capacity at<br />
Tref T<br />
max = max (in µmol electron m –2 leaf s –1 ) Potential rate of electron transport rate at<br />
J (F ) 2.<br />
1Vc<br />
ref<br />
h<br />
(Fh<br />
)<br />
T max<br />
h<br />
(T S-H<br />
) / (T R)<br />
(T S - H ) / (T R)<br />
[ 1+<br />
exp ref d ref ] / [ 1<br />
d ]<br />
T (H (T-T<br />
) / (T T R))<br />
= X ref a ref ref<br />
max (Fh<br />
) exp<br />
exp<br />
T=Tref<br />
Temperature dependence of Vcmax and Jmax<br />
X (F )<br />
+<br />
V<br />
c(s un / sha)<br />
=<br />
LAI<br />
∫<br />
0<br />
V<br />
cmax<br />
( F ) f<br />
h<br />
(sun/sha)<br />
( F ) dF<br />
h<br />
h<br />
(in µmol CO2 m –2 ground s –1 )<br />
T=Tref<br />
(generic form)<br />
Photosynthetic capacity of the sunlit /<br />
shaded fractions<br />
T Tref<br />
(Ea<br />
(T-Tref<br />
)/(Tref<br />
T R))<br />
X = X exp<br />
Temperature dependence of Kc, Ko and Γ*<br />
*<br />
Ac (sun/sha) (sun/sha) i<br />
i c<br />
o<br />
(generic form)<br />
= Vc<br />
(C - Γ ) ( C + K ( 1+<br />
O / K ))<br />
RUBISCO-limited rate of photosynthesis of<br />
2<br />
l J le max le max<br />
le c(<br />
sun / sha)<br />
the sunlit / shaded fractions<br />
θ -(I<br />
+ J ) J + I J = 0 with I = I ( 1−<br />
f ) / 2<br />
Irradiance dependence of electron transport<br />
A<br />
A<br />
θ<br />
c<br />
j(sun/sha)<br />
gc<br />
A<br />
= A<br />
gc<br />
*<br />
*<br />
rate of the sunlit / shaded fractions<br />
= J (C - Γ ) 4(<br />
C + 2Γ<br />
)<br />
Electron-transport limited rate of<br />
gcsun<br />
2<br />
( sun / sha)<br />
i<br />
+ A<br />
-(A<br />
gcsha<br />
i<br />
; with A<br />
j(sun/sha)<br />
+ A<br />
gcsun<br />
and A<br />
c(<br />
sun / sha)<br />
gcsha<br />
) A<br />
the smallest<br />
gc(<br />
sun / sha)<br />
+ A<br />
roots<br />
j(sun/sha)<br />
of<br />
A<br />
c(<br />
sun / sha)<br />
13<br />
= 0<br />
photosynthesis of the sunlit / shaded<br />
fractions<br />
(14)<br />
(15)<br />
(16)<br />
(17)<br />
(18)<br />
(19)<br />
(20)<br />
(21)<br />
Gross canopy photosynthesis rate (22)
R d<br />
csha<br />
C<br />
a<br />
= 0.0089<br />
(Vcsun<br />
+ V )<br />
Dark respiration rate (23)<br />
CO2<br />
atm<br />
6<br />
= n P / 10<br />
Ambient CO2 partial pressure (24)<br />
C = C − ( A + R ) 1.<br />
37P<br />
/ g<br />
Leaf surface CO2 partial pressure (25)<br />
g<br />
g<br />
s a gc d atm sH2<br />
0<br />
sH2O<br />
totCO 2<br />
min H2O<br />
gc<br />
d<br />
−6<br />
= g + m(<br />
A + R ) 10 ( RH / 100)<br />
/ C<br />
Stomatal conductance to water vapour (26)<br />
sH<br />
2O<br />
−1<br />
bH<br />
O)<br />
2<br />
s<br />
= (1.6/g + 1.<br />
37 / g<br />
Total conductance to CO2<br />
C +<br />
i = Ca<br />
− ( Agc<br />
Rd<br />
) Patm<br />
/ gtotCO2<br />
Intercellular CO2 partial pressure obtained<br />
14<br />
by coupling net assimilation rate<br />
conductance using Fick’s law<br />
(27)<br />
(28)
Article 1B<br />
Decreased aboveground primary productivity of alpine tundra in<br />
response to earlier snowmelt.<br />
Baptist, F., Flahaut, C., Streb, P. and Ph. Choler<br />
In prep. for Oecologia<br />
Monolithes (traitement E) enterrés au sommet d’une butte afin de limiter<br />
l’enneigement durant l’hiver. Lieu : Parcelle expérimentale de la <strong>Station</strong> <strong>Alpine</strong><br />
<strong>Joseph</strong> <strong>Fourier</strong> avant les premières neiges de l’hiver (2005). Photo : F. Baptist.<br />
77
Chapitre I Article 1B<br />
78
Chapitre I Article 1B<br />
Abstract<br />
Snow deposition and thermic regime are rapidly changing in alpine tundra and may lead to<br />
longer growing season but also higher risks of frost events in early spring. <strong>Alpine</strong> tundra from<br />
late snowmelt sites may be particularly vulnerable to these climatic changes. Large samples of<br />
alpine grassland were grown in monoliths for two consecutive years. Snow cover was<br />
manipulated to test for the effects of an early snowmelt (E treatment), an inconsistent winter<br />
snow cover (I treatment) and a late snowmelt (L treatment) on plant functional traits, Leaf<br />
Area Index (LAI) and Aboveground Net Primary Productivity (ANPP). Besides, we examined<br />
the seasonal growth of the locally dominant sedge, Carex foetida. To address the potential<br />
effect of frost events, we measured freezing temperatures of the dominant graminoid species.<br />
Despite an extended growing season, aboveground biomass, productivity and LAI in the E<br />
and I treatments were either reduced or equalled to the values measured in L treatment<br />
However, we found no changes in water availability, soil nitrogen content and leaf nitrogen<br />
content that could explain these effects. The seasonal growth of Carex foetida clearly<br />
indicated that this species does not benefit from a prolonged snowfree period. Recorded<br />
temperature at the beginning of plant growth in I and E treatments were frequently close to<br />
the freezing temperature of the dominant species (≈ -10°C), suggesting that frost events may<br />
impair plant productivity. We concluded that (1) the weak plasticity in the phenological<br />
response of alpine plants and (2) the detrimental effect of frost events explain why alpine<br />
tundras from late snowmelt sites may not benefit from an increased growing season length.<br />
Keywords : ANPP (Aboveground Net Primary Productivity), snowbed species, freezing<br />
point, growing season length, Carex foetida, Poa alpina, Alopecurus gerardi, plant functional<br />
traits, frost<br />
79
1<br />
2<br />
3<br />
4<br />
5<br />
6<br />
7<br />
8<br />
9<br />
10<br />
11<br />
12<br />
13<br />
14<br />
15<br />
16<br />
17<br />
18<br />
19<br />
20<br />
21<br />
22<br />
23<br />
24<br />
25<br />
26<br />
27<br />
28<br />
29<br />
30<br />
31<br />
32<br />
33<br />
Chapitre I Article 1B<br />
Introduction<br />
Recent advances in climatic research predict that the increase in greenhouse gaz<br />
concentration will lead to an average temperature increase of between 1 and 6°C and a<br />
modification of snow precipitation patterns, soil moisture and snow cover (IPCC, 2007).<br />
These climatic changes may have a particularly large impact in alpine and arctic tundra<br />
ecosystems. In addition to higher temperatures (Noguès-Bravo et al. 2007; Serreze et al.<br />
2000), temperate mountain ranges from the Northern hemisphere may experience decreased<br />
snow deposition (Beniston 2005; Dye and Tucker 2003; Serreze et al. 2000). This will have<br />
important consequences through changes in the timing of snowmelt and in soil temperature<br />
and moisture regime. Indeed, reduced snow cover during winter associated with earlier<br />
snowmelt would result in longer growing seasons and higher cumulated Growing Degree<br />
Days (GDD) which could benefit vegetation growth (Theurillat and Guisan 2001). In contrast,<br />
under these conditions plants may be exposed to higher risks of frost damage, and earlier<br />
dehardening or late-summer water stress (Edwards et al. 2007; Inouye 2000; Wipf et al.<br />
2006). <strong>Alpine</strong> species tightly associated with late snowmelt sites might be particularly<br />
vulnerable to such changes.<br />
In snow-covered ecosystems, the growing season is compressed and curtailed at both<br />
ends by subzero temperatures. Time available for growth largely determines aboveground<br />
biomass and productivity which feedbacks nutrient availability. It also affects community<br />
composition by altering the performance of species with different strategies of growth and<br />
reproduction (Galen and Stanton 1993). Establishing causal links between growing season<br />
length and plant performance is crucial to predict consequences of global climate change on<br />
species distribution and carbon balance of snow-covered ecosystems.<br />
In alpine tundra, Choler (2005), Kudo et al. (1992; 1999) and Walker et al. (1993) reported a<br />
tight linkage between snowmelt dates and instantaneous productivity along snow cover<br />
gradients in alpine habitats. They showed a higher productivity and aboveground biomass in<br />
late snowmelt communities dominated by deciduous species. However, these results may<br />
reflect not only the effect of growing season length but also others factors such as soil depth,<br />
soil fertility or historical contingencies (Thorhallsdottir 1998). The impact of variable<br />
snowmelt dates have also been assessed experimentally. A large number of studies adressed<br />
the effects of warming (de Valpine and Harte 2001; Dunne et al. 2003; Jones et al. 1997;<br />
Molau 1997; Price and Waser 2000; Saavedra et al. 2003; Starr et al. 2000; Stenstrom and<br />
80
34<br />
35<br />
36<br />
37<br />
38<br />
39<br />
40<br />
41<br />
42<br />
43<br />
44<br />
45<br />
46<br />
47<br />
48<br />
49<br />
50<br />
51<br />
52<br />
53<br />
54<br />
55<br />
56<br />
57<br />
58<br />
59<br />
60<br />
61<br />
62<br />
Chapitre I Article 1B<br />
Jonsdottir 1997; Stenstrom et al. 1997; Welker et al. 1997) and earlier or delayed snowmelt<br />
(Dorrepaal et al. 2003; Dunne et al. 2003; Saavedra et al. 2003; Scott and Rouse 1995;<br />
Wahren et al. 2005) on plant growth, flowering or phenology of particular arctic and alpine<br />
species. In general, plants flowered earlier in response to longer growing season and higher<br />
cumulated GDD. However, they only considered snowmelt gradients in natura or performed<br />
experiments with artificial warming leading to an increase in air temperature at snowmelt. (de<br />
Valpine and Harte 2001; Starr et al. 2000; Wipf et al. 2006). Besides, only a few studies<br />
addressed the effects of decreasing snow deposition on the aboveground biomass or<br />
productivity.<br />
Early snowmelt may have different effects on plant growth. Soil nitrogen availability<br />
could be modified since snowmelt is associated with an increase in nitrogen availability due<br />
to both the penetration of melted water into the soil (Bowman 1992) and to the death of<br />
microbial populations (Brooks et al. 1998; Jaeger et al. 1999). Early snowmelt may also lead<br />
to a decrease in soil moisture during the growing season. Finally, individual frost events may<br />
damage plants and reduce growth (Inouye 2000). It remains unclear to what extent all these<br />
parallel and opposite effects will affect plant growth of the dominant species and the<br />
aboveground net primary productivity of late snowmelt ecosystems.<br />
The aims of this study were to examine the effects of (a) a late snowmelt (b) an early<br />
snowmelt and (c) an inconsistent winter snow, considered as extrems conditions for these<br />
communities, on aboveground biomass, productivity, Leaf Area Index (LAI) of late snowmelt<br />
communities as well as plant functional trait values and vegetative growth of dominant alpine<br />
plant species. The plant functional traits measured were Specific Leaf Area (SLA), Leaf Dry<br />
Matter Content (LDMC) and Leaf Nitrogen Content (LNC) as these are related to carbon<br />
fixation and productivity (Garnier et al. 2004; Quétier et al. 2007). We also measured soil<br />
moisture and air temperature as well as the freezing temperatures of the three dominant<br />
species presents in this community.<br />
81
63<br />
64<br />
65<br />
66<br />
67<br />
68<br />
69<br />
70<br />
71<br />
72<br />
73<br />
74<br />
75<br />
76<br />
77<br />
78<br />
79<br />
80<br />
81<br />
82<br />
83<br />
84<br />
85<br />
86<br />
87<br />
88<br />
89<br />
90<br />
91<br />
92<br />
93<br />
94<br />
95<br />
Chapitre I Article 1B<br />
Materials and methods<br />
Study site and species<br />
On September 27 th 2005, 15 monoliths (25 cm deep and 45×35 cm surface) were randomly<br />
selected and then excavated from a large late snowmelt site located near the Agnel pass in the<br />
South-Western French Alps (2744 m above sea level, abbreviated as m.a.s.l. henceforth). The<br />
mean snowmelt time of this site was early june (Choler, personal observations). Monoliths<br />
were transferred into plastic pots with drains and transported to the <strong>Station</strong> <strong>Alpine</strong> J. <strong>Fourier</strong>,<br />
an alpine field research station located at the Lautaret pass at 2100 m.a.s.l. (45°7’N, 6°5’E).<br />
Soils were stagnogley enriched in clay. Organic matter of the soil was 8 ± 0.3 %. Carex<br />
foetida (Cyperaceae) was the dominant species followed by Alopecurus gerardi (Poaceae)<br />
and Poa alpina (Poaceae). C. foetida and A. gerardi can be considered as specialists from late<br />
snowmelt sites whereas P. alpina is a generalist species in these temperate alpine tundras. The<br />
relative abundance of these species at harvest time was similar to relative abundance<br />
measured in L treatment in 2006. Relative abundance of C. foetida accounted for more than<br />
50%, A. gerardi, 31%, other graminoïds 3% and forbs 14% (see Table 2).<br />
Experimental design and treatments<br />
At the end of September 2005, in the alpine field station, the 15 monoliths were randomly<br />
allocated to the following three treatments: (1) a limited winter snowpack whereby 5<br />
monoliths were disposed on the summit of a hillock (Inconsistent treatment, I), (2) a winter<br />
snow-covered but early snowmelting treatment (Early treatment, E) and (3) a delayed<br />
snowmelt treatment whereby 1-2 m of snow were added on another 5 monoliths and these<br />
were placed in the shade to delay snowmelt (Late treatment, L). This latter treatment resulted<br />
in a snowmelt time as close as possible to that of the native site. All sets of monoliths were<br />
placed 5 to 10 m away from each others and were buried in the soil. First snow falls occured<br />
on the 1 st of december 2005. In order to avoid microsite effects during the growing season, all<br />
the monoliths were transfered, from snowmelt to the end of October, to a common location in<br />
the common garden of the alpine research station and again buried in the soil. The same snow<br />
treatments were repeated during the winter 2006-2007.<br />
Edapho-climatic recordings<br />
Hourly soil temperature was recorded during the 2005-2006 and 2006-2007 winters in each<br />
treatment using Hobo probes (Onset computer corporation, Bourne, MA, USA) buried at 5 cm<br />
82
96<br />
97<br />
98<br />
99<br />
100<br />
101<br />
102<br />
103<br />
104<br />
105<br />
106<br />
107<br />
108<br />
109<br />
110<br />
111<br />
112<br />
113<br />
114<br />
115<br />
116<br />
117<br />
118<br />
119<br />
120<br />
121<br />
122<br />
123<br />
124<br />
125<br />
126<br />
127<br />
128<br />
Chapitre I Article 1B<br />
belowground. Persistent day temperatures close to 0°C (usually between -1 and 1°C) were<br />
considered indicative of a persistent snow cover. Cumulated GDD were calculated as the sum<br />
of daily mean temperature above 0°C. Gravimetric soil water content (m 3 m -3 ) was measured<br />
in each monolith at peak standing biomass in July 2006 and 2007. Simultaneously, we<br />
measured volumetric soil moisture using Time Domain Reflectometry (TDR) every 3 weeks<br />
in each monolith during the 2007 growing season. Finally, we used PAR light sensors located<br />
in the common garden to estimate cumulated mean global radiation. To compare climatic<br />
conditions in the field and in the garden, we recorded soil temperature at three late snowmelt<br />
sites during five years (2000-2005) near the Galibier pass (2650 m.a.s.l.).<br />
At peak standing biomass during the 2006 and 2007 growing seasons, 3 soil cores (1 cm<br />
diameter) were extracted from each monolith and pooled for analysis of total inorganic<br />
nitrogen content. Nitrogen was extracted from fresh soil sample (~ 10 g) with 2M KCl after<br />
+ -<br />
sieving at 2 mm. Soil extracts were analyzed for ammonia (NH4 ) and nitrate/nitrite (NO3<br />
-<br />
/NO2 ) contents using an FS-IV auto-analyzer (OI-Analytical, College <strong>Station</strong>, TX, USA).<br />
Plant responses<br />
Species abundance, biomass measurements and plant functional traits were realized at<br />
peak standing biomass on the 15 th of July 2006 and on the 3 rd of July 2007. Protocol are given<br />
below.<br />
The mean cover of plants within each monolith was estimated using line transect<br />
method. Linear measurements of plant intercepts were performed along the course of two<br />
lines (record each 2 cm along the line, total of 50 points per monolith,). The mean cover of a<br />
species corresponded to the area of ground covered by the vertical projection of its green<br />
aerial parts. In each monolith, total standing biomass was collected in a randomly located<br />
square plot of 5 by 5 cm. Instantaneous productivity was determined by dividing standing<br />
biomass by the time between snowmelt and peak biomass. Under these conditions, variations<br />
in productivity result both from variations in growing season length and in biomass produced.<br />
LAI was determined by measuring total projected area of green leaves with a leaf area meter<br />
(WinDIAS, Delta-T Device Ltd, Cambridge, UK).<br />
Species selected for trait measurement were C. foetida, A. gerardi and P. alpina<br />
(measurements in 2007 only for the latter species). They accounted for more than 70% of the<br />
maximum standing live biomass of the community. SLA, LDMC and LNC were measured<br />
following standard protocols (Cornelissen et al. 2003) on the cohort 2 in the case of C. foetida<br />
83
129<br />
130<br />
131<br />
132<br />
133<br />
134<br />
135<br />
136<br />
137<br />
138<br />
139<br />
140<br />
141<br />
142<br />
143<br />
144<br />
145<br />
146<br />
147<br />
148<br />
149<br />
150<br />
151<br />
152<br />
153<br />
154<br />
155<br />
156<br />
157<br />
158<br />
159<br />
160<br />
161<br />
Chapitre I Article 1B<br />
(see below) and on the younger leaf in the case of A. gerardi and P. alpina. Briefly, 3 sets of<br />
leaves were collected in each monolith and maintained in moist paper. After rehydratation for<br />
6 hours, they were weighed and total surface was measured using a leaf area meter<br />
(Gatehouse scientific instruments LTD, Norfolk, UK) before being dried for 48h at 60°C and<br />
weighed for dry mass. Leaves were further grinded and analyzed for carbon and nitrogen<br />
using a CHN analyzer (Thermo Electron Corporation, Madison, USA).<br />
Diachronic study of C. foetida growth<br />
We monitored leaf elongation of the dominant sedge C. foetida, during the 2006 and 2007<br />
growing seasons, from snowmelt until senescence, on 3 randomly marked tillers per monolith.<br />
We considered this measurement as an adequate surrogate of leaf growth as leaf width was<br />
strongly correlated to leaf length (F. Baptist, personal observation). Tillers are monocarpic<br />
and leaves senesce rapidly if an inflorescence is produced. However, it was impossible to<br />
separate vegetative and flowering tillers at snowmelt and reproducing tillers were excluded a<br />
posteriori. We measured green and total leaf length from the oldest to the youngest leaf every<br />
2 to 4 weeks. The difference due to senescing tips increased over the growing season.<br />
Percentage of senescence was estimated from the following formula:<br />
Senescent fraction (%)<br />
length<br />
=<br />
total leaves<br />
length<br />
− length<br />
total leaves<br />
green leaves<br />
The species produced in average 9 to 11 leaves per year, from their basal meristems. We<br />
pooled them into three cohorts (three leaves per cohort). Cohort 1 corresponded to leaves<br />
which were initiated the previous summer and which displayed weak growth at the beginning<br />
of the growing season (senescent fraction > 50%). Cohorts 2 were leaves initiated at<br />
snowmelt. Cohorts 3 were initiated later in the growing season. To adequately compare<br />
treatments, we expressed growth as a function of cumulated GDD in addition to Julian day<br />
following snowmelt.<br />
Freezing point and frost tolerance<br />
In June 2007 just after snowmelt, 3 vegetation cores were collected in late snowmelt sites near<br />
the Galibier pass (2650 m.a.s.l.). During the following 2 days, freezing temperatures of C.<br />
foetida, A. gerardi and P. alpina leaves were measured (n=3 for A. gerardi and 4 for C.<br />
foetida and P. alpina) . We used a metal chamber cooled by an antifreeze liquid. Two<br />
thermocouples (0.5mm and 1mm diameter for leaf and air temperature respectively) were<br />
connected to a CR800X Campbell data logger (Campbell Scientific Inc. Logan, UT, USA)<br />
⋅100<br />
84
162<br />
163<br />
164<br />
165<br />
166<br />
167<br />
168<br />
169<br />
170<br />
171<br />
172<br />
173<br />
174<br />
175<br />
176<br />
177<br />
178<br />
179<br />
180<br />
181<br />
182<br />
183<br />
184<br />
185<br />
186<br />
187<br />
188<br />
189<br />
190<br />
191<br />
192<br />
193<br />
194<br />
195<br />
Chapitre I Article 1B<br />
and measured every 5 sec. Maximum, minimum and mean temperatures were recorded every<br />
2 min. Freshly cut leaves were placed in contact to the leaf thermocouple and the chamber<br />
was closed. The temperature inside the chamber was decreased progressively by a<br />
programmed water bath at a rate of 1°C every 5 min to a final leaf temperature of -15°C and<br />
then increased up to 25°C. Late treatments were carried out with temperatures declining at<br />
2°C per hour. At their freezing temperature, leaf temperature increased due to heat emission<br />
which was detected by the first thermocouple (Ball et al. 2002). Parallel measurements of<br />
fluorescence also indicated freezing temperatures through a strong increase in minimal<br />
fluorescence F0 (Neuner and Pramsohler 2006). To confirm freezing-induced damage,<br />
intactness of leaf cells was assayed directly before and after determining the freezing<br />
temperature as the percentage change in conductivity following incubation of leaves in de-<br />
ionized water at room temperature for 24 h, before and after breakage of cells by boiling (10<br />
min) (Webb et al. 1996).<br />
Statistical analysis<br />
Repeated-measures analysis of variance (RMANOVA) was carried out to compare overall<br />
differences caused by snow treatment effects (between subject effects) and the interaction<br />
between treatments and time (within-subject effects) on aboveground biomass, productivity,<br />
LAI and leaf traits. A one-way ANOVA was used to test for the effects of snow treatments on<br />
Poa alpina leaf functional traits (measured only in 2007). In all cases, individual monoliths<br />
were treated as replicates and tiller based-variables were analyzed after averaging per<br />
monolith. Similarly, differences in seasonal growth of C. foetida leaves between snow<br />
treatments were compared only at maximal growth using a RMANOVA. The variable<br />
analyzed was the mean green length of each cohort averaged on the 3 tillers selected in each<br />
monolith. Freezing temperatures and intactness of cells were analyzed using the non-<br />
parametric Kruskall-Wallis test. All analyses were performed with the Jump software (SAS<br />
Institute Inc., Cary, North Carolina, USA).<br />
85
196<br />
197<br />
198<br />
199<br />
200<br />
201<br />
202<br />
203<br />
204<br />
205<br />
206<br />
207<br />
208<br />
209<br />
210<br />
211<br />
212<br />
213<br />
214<br />
Chapitre I Article 1B<br />
(a) Time Year Late Early Inconsistent<br />
Snowmelt (date)<br />
(b) Thermic regime<br />
Cumulated GDD at :<br />
Biomass peak / End of season<br />
Mean wintertime soil temp. (°C)<br />
Number of frost events<br />
(
215<br />
216<br />
217<br />
218<br />
219<br />
220<br />
221<br />
222<br />
223<br />
224<br />
225<br />
226<br />
227<br />
228<br />
229<br />
230<br />
231<br />
232<br />
233<br />
234<br />
235<br />
236<br />
237<br />
238<br />
239<br />
240<br />
241<br />
242<br />
243<br />
244<br />
245<br />
246<br />
247<br />
248<br />
249<br />
250<br />
Chapitre I Article 1B<br />
Results<br />
Effects of snow treatment on edapho-climatic conditions<br />
In the common garden, L monoliths experienced a sligthy shorter winter than in the field. In<br />
late snowmelt sites (at 2650 m.a.s.l.), snowmelt occurred in early June compare to 08/06/06<br />
and 15/05/07 in the common garden (Table 1). Cumulated GDD reached on average 1200 in<br />
the field (average for 5 years) compared to more than 2000 in the common garden. However,<br />
at peak standing biomass, cumulated GDD between the L treatment and field did not differ<br />
and equalled approximately 600 cumulated GDD (see Baptist and Choler 2008).<br />
Snow treatments were effective in decreasing snow deposition in the I treatment and in<br />
delaying snowmelt in L treatment. Cumulated GDD (2006/2007) was offset by 214/147 and<br />
by 422/286 in E and L treatments respectively. Winter soil temperature differed strongly<br />
between treatments. I monoliths experienced inconsistent snow cover during winter, and<br />
minimal air temperatures of -13.1°C in 2006 and -8.1°C in 2007, despite relatively higher<br />
mean winter soil temperature (Table 1, Fig. 1 and APPENDIX 1). In the E treatment, winter<br />
soil temperatures were not as harsh as in the I treatement. Finally, no frost events occurred in<br />
2006 in the L treatment, whereas, in 2007, six frost events were observed (Table 1, Fig. 1 and<br />
APPENDIX 1). In the E and L treatments, mean winter temperature was close to 0°C. During<br />
the growing season, all treatments experienced similar temperature and water regimes<br />
(F2,12=1.0, P=0.39) (Table 1, Fig. 1 and APPENDIX 1). Seasonal records of soil moisture<br />
during 2007 did not reveal any differences between snow treatments (data not shown). No<br />
effect of snow treatment on [NH4 + ] at peak standing biomass was observed (F2,10=1.2,<br />
P=0.34) but we did detect a significant year effect (F1,22=13.2, P=0.001), indicating higher<br />
concentration in 2007 compared to 2006. In contrast, [NO3 - ] was significantly affected by<br />
snow treatments (F2,10=6.3, P=0.02). A significant year effect was detected with higher<br />
concentrations in 2007 than in 2006 (F1,10=21.6, P
251<br />
252<br />
253<br />
254<br />
255<br />
256<br />
257<br />
258<br />
259<br />
260<br />
261<br />
262<br />
263<br />
264<br />
265<br />
Chapitre I Article 1B<br />
Species / Groups Late Early Inconsistent<br />
C. foetida<br />
2006<br />
2007<br />
53 (5)<br />
39 (7)<br />
57 (4)<br />
50 (4)<br />
55 (3)<br />
46 (5)<br />
A. gerardi<br />
2006<br />
2007<br />
31 (7)<br />
33 (7)<br />
29 (4)<br />
28 (2)<br />
27 (4)<br />
19 (5)<br />
Others graminoids<br />
2006<br />
2007<br />
3 (1)<br />
14 (1)<br />
7 (2)<br />
20 (5)<br />
4 (3)<br />
24 (5)<br />
Forbs<br />
2006<br />
2007<br />
14 (5)<br />
14 (4)<br />
6 (5)<br />
3 (2)<br />
11 (4)<br />
10 (5)<br />
Table 2 Relative abundance (%) of Carex foetida, Alopecurus gerardi and two functional<br />
groups reported as “Others graminoids” and “Forbs” in 2006 and 2007 in each snow treatments.<br />
In 2007, the group “Others graminoids” was mainly represented by P. alpina. Values are the<br />
mean ± standard error (SE) See text for statistical details.<br />
Community composition<br />
Relative abundance of C. foetida and A. gerardi did not respond to snow treatments<br />
(respectively F2,12=0.6, P=0.54; F2,12=0.6, P=0.55) (Table 2) and was similar to that in the<br />
native site (personal observation). Similarly, relative abundance of others graminoïds (mainly<br />
Poa alpina) and forbs did not respond to snow treatments (F2,12=0.98, P=0.40; F2,12=1.6,<br />
P=0.24). Poa alpina showed year effect with a marked increased in 2007 (F1,12=23.9,<br />
P
266<br />
267<br />
268<br />
269<br />
270<br />
271<br />
272<br />
273<br />
274<br />
275<br />
276<br />
277<br />
278<br />
279<br />
280<br />
281<br />
282<br />
283<br />
284<br />
285<br />
286<br />
287<br />
288<br />
289<br />
290<br />
291<br />
292<br />
293<br />
294<br />
295<br />
296<br />
297<br />
298<br />
Chapitre I Article 1B<br />
Plant responses to snow treatments<br />
Aboveground biomass and productivity were significantly affected in the I treatment<br />
(respectively F2,12=4.2, P=0.04 and F2,12=23.9, P
299<br />
300<br />
301<br />
302<br />
Chapitre I Article 1B<br />
9.3°C respectively and did not differ significantly (Kruskal-Wallis χ 2 (2) = 5.59, P = 0.06)<br />
(Fig. 5). Intactness of cells as indicated by electrolyte leakage varied greatly between the three<br />
species with less that 40% of cells destroyed in P. alpina tissue compared to more than 70%<br />
in C. foetida and A. gerardi (Kruskal-Wallis χ 2 (2) = 7.84, P = 0.02).<br />
90
Chapitre I Article 1B<br />
Fig. 2 Aboveground biomass (A),<br />
aboveground productivity<br />
expressed per cumulated GDD (B)<br />
and LAI (D) in response to snow<br />
treatments. Mean ± SE for each<br />
treatment for both year (n=15).<br />
Different letters indicate significant<br />
differences between treatments<br />
(P
Chapitre I Article 1B<br />
Fig. 3 Seasonal leaf growth for 3 cohorts of C. foetida leaves (cohorts 1/2/3, see text for further details) related<br />
to Julian days (upper) and to cumulated GDD (lower) in 2006 (A/B/C) and 2007 (D/E/F). Arrows indicate the<br />
day when aboveground biomass, LAI and leaf functional trait values were measured. See main text for more<br />
details on statistical analysis.<br />
92
Chapitre I Article 1B<br />
Fig. 4 Specific Leaf Area (A), Leaf Dry Matter<br />
Content (B) and Leaf Nitrogen Content (C) of the<br />
leaves of the three dominant species of late snowmelt<br />
sites (C. foetida, A. gerardi and P. alpina) in response<br />
to snow treatments. Leaf functional trait values were<br />
measured only in 2007 for P. alpina. See main text for<br />
more details on statistical analysis.<br />
93
Chapitre I Article 1B<br />
Discussion<br />
Our result indicate that changes in growing season length and especially snowmelt<br />
timing can affect, in the short term, the aboveground biomass of dominant plant species from<br />
alpine late snowmelt sites. Indeed, despite an extended growing season, aboveground biomass<br />
and LAI in the E and I treatments were either reduced or equalled to the values measured in L<br />
treatment. As a result, instantaneous productivity (calculated from snowmelt date until peak<br />
standing biomass) was much lower in the I and E treatments compared to the L one.<br />
Similarly, the synchronic records of C. foetida growth demonstrated clearly that the length of<br />
the cohorts were not enhanced by the extending growing season.<br />
Fig. 5 Freezing temperature of new leaves (A) and<br />
electrolyte leakage in % (B) for C. foetida, A. gerardi and<br />
P. alpina. Higher and lower values correspond to samples<br />
measured after and before freezing treatment. Different<br />
letters indicate significant differences between species<br />
(P
Chapitre I Article 1B<br />
performed experiments with artificial warming leading to an increase in air temperature at<br />
snowmelt.<br />
Various explanations can be proposed to explain the similar aboveground productivity<br />
in E treatment compare to L one and can be related to direct environmental constraints or<br />
indirect ones through effect on plant functional traits. E Monoliths could be limited by water<br />
availability leading to a reduced plant growth. However, the soil moisture measured at peak<br />
standing biomass did not differ between treatments. Similarly, measurements through the<br />
season did not indicate differences between treatments in 2007 (data not shown). Finally,<br />
SLA and LDMC, which are good indicators of water stress (Cunningham et al. 1999, Wright<br />
et al. 2001, Gianoli 2004), did not differ between treatments suggesting that the soil moisture<br />
did not affect biomass production in this study.<br />
Soil fertility could also lead to lower aboveground productivity. Indeed, during winter, deeper<br />
and longer-lasting insulating snowpack lead to higher microbial biomass and litter<br />
decomposition (Hobbie and Chapin 1996, Lipson et al. 1999). Furthermore growth is often<br />
thought to start at snowmelt as the penetration of melting water into the soil (Bowman 1992)<br />
and the death of microbial populations lead to an increase of nitrogen availability (Brooks et<br />
al. 1998). We thus expected that a shorter growing season would lead to higher aboveground<br />
productivity in the L treatment through increased soil fertility. However, despite a noticeable<br />
year effect, soil nitrogen concentrations measured at peak standing biomass could not<br />
consistently explain variations in aboveground biomass. Similar results were obtained at<br />
snowmelt in 2006 (data not shown). Total soil mineral N content were only instantaneous<br />
measurements and might not be representaive of N available to plants during the growing<br />
season. However, the values of LNC tend to support these conclusions, as they were not<br />
affected by the snow treatments. This corroborates the findings of Jaeger & Monson (1992)<br />
and Starr et al. (2000) who showed no variation of LNC in responses to warming or<br />
lengthened growing season. Spring growth of alpine plants is mainly sustained by the<br />
remobilization of N out of storage structures (Lipson et al. 1996, Monson et al. 2006). These<br />
internal constraints buffer the interanual variability of nitrogen availability in the soil and may<br />
enable plants to sustain higher tissue production with similar N concentration. Thus, neither<br />
fertility and water availability, nor intraspecific changes in leaf trait values explained the<br />
observed changes in aboveground biomass in response to earlier snowmelt.<br />
Hence, it appears that only regenerative constraints can explain the lack of response of<br />
snowbed community to extend growing season. Sørenson (1941) distinguished two<br />
phenological patterns in tundra plants : periodic species, characterized by a fixed growing<br />
95
Chapitre I Article 1B<br />
period, controlled by genetic constraints and aperiodic species, for which growth and the<br />
production of new leaves are prolonged until conditions became unfavorable. Accordingly,<br />
the snowbed species studied here and in particularly C. foetida are periodic species and do not<br />
benefit form lengthened growing season. Hence, these results indicate that the capacity of the<br />
plants to increase their productivity will strongly depend on the intrinsic regenerative<br />
capacities<br />
The reduced biomass observed in the I treatment compare to L was not expected and<br />
the underlying mechanisms are not clear. As stated above, direct environmental constraints,<br />
such as water availability or soil fertility and indirect ones through effect on plant functional<br />
traits can not explain these patterns. Regenerative constraints may limit enhanced growth in<br />
response to extended growing season but can not be responsible for a lower aboveground<br />
biomass. An alternative explanation lies in the impact of frost events on early season growth.<br />
Indeed, potentially damaging frosts to alpine plants during the growing season were<br />
repeatedly described (Körner 1999, Taschler and Neuner 2004). In early spring 2006 and<br />
2007, the higher occurrence of severe frosts (≈ air temperature < -5°C) in the I treatment<br />
(Table 1) associated to radiative cooling (exposure to the cold nigth sky, leaf temperature <<br />
air temperature) may expose plants to temperature close to their freezing points (about -10°C,<br />
Fig. 5, Körner 1999). This hypothesis is comforted by the results of Wipf et al. (2006) who<br />
found a strong correlation between the number of frost events (temperature < 0°C) and the<br />
aboveground biomass of Empetrum nigrum and Vaccinium vitis-idae, two subalpine species.<br />
During winter, leaf primordial tissues are buried several centimeters belowground and thus<br />
are not exposed to damaging frost events (Körner 1999). However, during spring, relatively<br />
high diurnal temperatures have the potential to activate growth despite very cold nights (see<br />
Fig. 1). The rise of primordia at the soil surface exposes them to overnight freezing<br />
temperature and may lead to cell-death, particularly since plants deharden rapidly when<br />
temperature and photoperiod increase (Bannister et al. 2005). Despite a capacity to recover<br />
very fast, costs for the repair process might be too high. These conclusions are supported by<br />
the weak growth of leaves from cohort 2 of C. foetida in the I treatments which are initiated at<br />
the beginning of the growing season in contrast to cohort 3. Differences between these late<br />
and early emerging cohorts may reflect the immediate impact of freezing temperature on<br />
growth. However, why leaves from cohort 1 did not show lower growth in the I treatments<br />
compared to the E and L treatment remain unclear. Bannister et al. (2005) measured no<br />
differences in freezing temperatures between young and old leaves. Leaves from cohort 1<br />
96
Chapitre I Article 1B<br />
were overwintering leaves and they may display a higher degree of hardening than younger<br />
ones, recently grown from primordia. Frost resistance (i.e. the dead cell fraction after a frost<br />
event) at the beginning of the season could differ because of higher concentration of<br />
carbohydrates in cells (Bell and Bliss 1979).<br />
Conclusion<br />
Our results tend to point out the importance of (1) the alpine plant’ capacity to<br />
lengthen their growth cycle in response to longer growing season and (2) to support frost<br />
events in order to predict the effects of global change on the diversity and the productivity of<br />
alpine meadows. During the next decades, the frequency of frosts events may increase in<br />
alpine environments due to a reduction of snow cover and earlier snowmelt (Inouye 2000,<br />
Inouye 2008). The strong variability in frost resistance observed between the three main<br />
species studied here, in addition to the results reported by Bannister et al. (2005) and Taschler<br />
& Neuner (2004), suggest that responses to frost events will be species-specific. Aperiodic<br />
species might be favored compared to periodic species as the production of new leaves later<br />
in season may compensate for losses due to frost events in spring. Larger comparative<br />
analysis of frost resistance and leaf phenology along snowmelt gradient in alpine tundras is<br />
necessary to assess in greater details how these ecosystems will respond to climatic changes.<br />
Acknowledgments<br />
We are grateful to Serge Aubert, Cécile Bayle, J.C. Clément, Rolland Douzet,<br />
Geneviève Girard, Richard Hurstel for their help in the field and in the laboratory. Logistical<br />
supports were provided by the <strong>Station</strong> <strong>Alpine</strong> <strong>Joseph</strong> <strong>Fourier</strong>, the alpine field station of the<br />
University <strong>Joseph</strong> <strong>Fourier</strong>. We thank Marie Corbel for her friendly logistical assistance and<br />
Fabien Quétier for his helpful comments on an earlier version of this manuscript. The project<br />
was financially supported by a grant from the French research and education ministry and<br />
from the University <strong>Joseph</strong> <strong>Fourier</strong> of Grenoble.<br />
References<br />
Ball, M. C., J. Wolfe, M. Canny, M. Hofmann, A. B. Nicotra, et al. 2002. Space and time<br />
dependence of temperature and freezing in evergreen leaves. Functional Plant Biology<br />
29:1259-1272.<br />
97
Chapitre I Article 1B<br />
Bannister, P., T. Maegli, K. J. M. Dickinson, S. R. P. Halloy, A. Knight, et al. 2005. Will loss<br />
of snow cover during climatic warming expose New Zealand alpine plants to<br />
increased frost damage? Oecologia 144:245-256.<br />
Bell, K. L., and L. C. Bliss. 1979. Autoecology of Kobresia bellardii: why winter snow<br />
accumulation limits local distribution. Ecological Monographs 49:377-402.<br />
Beniston, M. 2005. Mountain climates and climatic change: An overview of processes<br />
focusing on the European Alps. Pure and Applied Geophysics 162:1587-1606.<br />
Bowman, W. D. 1992. Inputs and storage of nitrogen in winter snowpack in an alpine<br />
ecosystem. Arctic and <strong>Alpine</strong> Research 24:211-215.<br />
Brooks, P. D., M. W. Williams, and S. K. Schmidt. 1998. Inorganic nitrogen and microbial<br />
biomass dynamics before and during spring snowmelt. Biogeochemistry 43:1-15.<br />
Choler, P. 2005. Consistent shifts in <strong>Alpine</strong> plant traits along a mesotopographical gradient.<br />
Arctic Antarctic and <strong>Alpine</strong> Research 37:444-453.<br />
Cornelissen, J. H. C., S. Lavorel, E. Garnier, S. Diaz, N. Buchmann, et al. 2003. A handbook<br />
of protocols for standardised and easy measurement of plant functional traits<br />
worldwide. Australian Journal of Botany 51:335-380.<br />
Cunningham, S. A., B. Summerhayes, and M. Westoby. 1999. Evolutionary divergences in<br />
leaf structure and chemistry, comparing rainfall and soil nutrient gradients. Ecology<br />
69:569-588.<br />
de Valpine, P., and J. Harte. 2001. Plant responses to experimental warming in a montane<br />
meadow. Ecology 82:637-648.<br />
Dorrepaal, E., R. Aerts, J. H. C. Cornelissen, T. V. Callaghan, and R. S. P. Van Logtestijn.<br />
2003. Summer warming and increased winter snow cover affect Sphagnum fuscum<br />
growth, structure and production in a sub-arctic bog. Global Change Biology 10:93-<br />
104.<br />
Dunne, J. A., J. Harte, and K. J. Taylor. 2003. Subalpine meadow flowering phenology<br />
responses to climate change: integrating experimental and gradient methods.<br />
Ecological monograph 73:69-86.<br />
Dye, D. G., and C. J. Tucker. 2003. Seasonality and trends of snow-cover, vegetation index,<br />
and temperature in northern Eurasia. Geophysical Research Letters 30:9-12.<br />
Edwards, A. C., R. Scalenghe, and M. Freppaz. 2007. Changes in the seasonal snow cover of<br />
alpine regions and its effect on soil processes: A review. Quaternary International<br />
172:162-163.<br />
Galen, C., and M. L. Stanton. 1993. Short-term responses of alpine buttercups to experimental<br />
98
Chapitre I Article 1B<br />
manipulations of growing season length. Ecology 75:1546-1557.<br />
Galen, C., and M. L. Stanton. 1995. Responses of snowbed plant species to changes in<br />
growing-season length. Ecology 76:415-436.<br />
Garnier, E., J. Cortez, G. Billes, M. L. Navas, C. Roumet, et al. 2004. Plant functional<br />
markers capture ecosystem properties during secondary succession. Ecology 85:2630-<br />
2637.<br />
Gianoli, E. 2004. Plasticity of traits and correlations in two populations of Convolvulus<br />
arvensis (Convolvulaceae) differing in environmental heterogeneity. International<br />
Journal Of Plant Sciences 165:825-832.<br />
Hobbie, S. E., and F. S. Chapin. 1996. Winter regulation of tundra litter carbon and nitrogen<br />
dynamics. Biogeochemistry 35:327-338.<br />
Inouye, D. W. 2000. The ecological and evolutionary significance of frost in the context of<br />
climate change. Ecology Letters 3:457-463.<br />
Jaeger, C. H., and R. K. Monson. 1992. Adaptative significance of nitrogen storage in<br />
Bistorta bistortoides, an alpine herb. Oecologia 92:121-131.<br />
Jaeger, C. H., R. K. Monson, M. C. Fisk, and S. K. Schmidt. 1999. Seasonal partitioning of<br />
nitrogen by plants and soil microorganisms in an alpine ecosystem. Ecology 80:1883-<br />
1891.<br />
Jones, M. H., C. Bay, and U. Nordenhall. 1997. Effects of experimental warming on arctic<br />
willows (Salix spp.): a comparison of responses from the Canadian High Arctic,<br />
Alaskan Arctic, and Swedish Subarctic. Global Change Biology 3:55-60.<br />
Körner, C. 1999. <strong>Alpine</strong> Plant Life. Berlin: Springer Verlag.<br />
Kudo, G. 1992. Performance and phenology of alpine herbs along a snow-melting gradient.<br />
Ecological Research 7:299-316.<br />
Kudo, G., U. Nordenhall, and U. Molau. 1999. Effects of snowmelt timing on leaf traits, leaf<br />
production, and shoot growth of alpine plants: Comparisons along a snowmelt<br />
gradient in northern Sweden. Ecoscience 6:439-450.<br />
Lipson, D. A., R. K. Monson, and W. D. Bowman. 1996. Luxury uptake and storage of<br />
nitrogen in the rhizomatous alpine herb, Bistorta bistortoides. Ecology 77:569-576.<br />
Lipson, D. A., S. K. Schmidt, and R. K. Monson. 1999. Links between microbial population<br />
dynamics and nitrogen availability in an alpine ecosystem. Ecology 80:1623-1631.<br />
Molau, U. 1997. Responses to natural climatic variation and experimental warming in two<br />
tundra plant species with contrasting life forms: Cassiope tetragona and Ranunculus<br />
nivalis. Global Change Biology 3:97-107.<br />
99
Chapitre I Article 1B<br />
Monson, R. K., T. N. Rosenstiel, T. A. Forbis, D. A. Lipson, and C. H. Jaeger. 2006. Nitrogen<br />
and carbon storage in alpine plants. Integrative and Comparative Biology 46:35-48.<br />
Neuner, G., and M. Pramsohler. 2006. Freezing and high temperature thresholds of<br />
photosystem 2 compared to ice nucleation, frost and heat damage in evergreen<br />
subalpine plants. Physiologia Plantarum 126:196-204.<br />
Noguès-Bravo, D., M. B. Araujo, M. P. Errea, and J. P. Martinez-Rica. 2007. Exposure of<br />
global mountain systems to climate warming during the 21st Century. Global<br />
Environmental Change 17:420-428.<br />
Price, M. V., and N. M. Waser. 2000. Responses of subalpine meadow vegetation to four<br />
years of experimental warming. Ecological Applications 10:811-823.<br />
Quétier, F., A. Thebault, and S. Lavorel. 2007. Plant traits in a state and transition framework<br />
as markers of ecosystem response to land-use change. Ecological monograph 77:33-<br />
52.<br />
R Development Core Team. 2006. R: A Language and Environment for Statistical<br />
Computing. in R Foundation for Statistical Computing. Vienna, Austria.<br />
Saavedra, F., D. W. Inouye, M. V. Price, and J. Harte. 2003. Changes in flowering and<br />
abundance of Delphinium nuttallianum (Ranunculaceae) in response to a subalpine<br />
climate warming experiment. Global Change Biology 9:885-894.<br />
Scott, P. A., and W. R. Rouse. 1995. Impacts of increased winter snow cover on upland<br />
tundra vegetation: a case example. Climate research 5:25-30.<br />
Serreze, M. C., J. E. Walsh, F. S. Chapin, T. Osterkamp, M. Dyurgerov, et al. 2000.<br />
Observational evidence of recent change in the northern high-latitude environment.<br />
Climatic Change 46:159-207.<br />
Sørenson, T. 1941. Temperature relations and phenology of north-east Greenland flowering<br />
plants. Meddelelser 125:1-305.<br />
Starr, G., S. F. Oberbauer, and E. W. Pop. 2000. Effects of lengthened growing season and<br />
soil warming on the phenology and physiology of Polygonum bistorta. Global Change<br />
Biology 6:357-369.<br />
Stenstrom, A., and I. S. Jonsdottir. 1997. Responses of the clonal sedge, Carex bigelowii, to<br />
two seasons of simulated climate change. Global Change Biology 3:89-96.<br />
Stenstrom, M., F. Gugerli, and G. H. R. Henry. 1997. Response of Saxifraga oppositifolia L.<br />
to simulated climate change at three contrasting latitudes. Global Change Biology<br />
3:44-54.<br />
Taschler, D., and G. Neuner. 2004. Summer frost resistance and freezing patterns measured in<br />
100
Chapitre I Article 1B<br />
situ in leaves of major alpine plant growth forms in relation to their upper distribution<br />
boundary. Plant Cell And Environment 27:737-746.<br />
Theurillat, J. P., and A. Guisan. 2001. Potential impact of climate change on vegetation in the<br />
European Alps: A review. Climatic Change 50:77-109.<br />
Thorhallsdottir, T. E. 1998. Flowering phenology in the central highland of Iceland and<br />
implications for climatic warming in the Arctic. Oecologia 114:43-49.<br />
Wahren, C. H. A., M. D. Walker, and M. S. Bret-Harte. 2005. Vegetation responses in<br />
Alaskan arctic tundra after 8 years of a summer warming and winter snow<br />
manipulation experiment. Global Change Biology 11:537-552.<br />
Walker, D. A., J. C. Halfpenny, M. D. Walker, and C. A. Wessman. 1993. Long-term studies<br />
of snow-vegetation interactions. Bioscience 43:471-480.<br />
Walker, M. D., D. A. Walker, J. M. Welker, A. M. Arft, T. Bardsley, et al. 1999. Long-term<br />
experimental manipulation of winter snow regime and summer temperature in arctic<br />
and alpine tundra. Hydrological Processes 13:2315-2330.<br />
Webb, M. S., S. J. Gilmour, M. F. Thomashow, and P. L. Steponkus. 1996. Effects of<br />
COR6.6 and COR15am polypeptides encoded by COR (cold-regulated) genes of<br />
Arabidopsis thaliana on dehydratation-induced phase transitions of phospholipid<br />
membranes. Plant Physiology 111:301-312.<br />
Welker, J. M., U. Molau, A. N. Parsons, C. H. Robinson, and P. A. Wookey. 1997. Responses<br />
of Dryas octopetala to ITEX environmental manipulations: a synthesis with<br />
circumpolar comparisons. Global Change Biology 3:61-73.<br />
Wipf, S., C. Rixen, and C. P. H. Mulder. 2006. Advanced snowmelt causes shift towards<br />
positive neighbour interactions in a subarctic tundra community. Global Change<br />
Biology 12:1496-1506.<br />
Wright, I. J., P. B. Reich, and M. Westoby. 2001. Strategy shifts in leaf physiology, structure<br />
and nutrient content between species of high- and low-rainfall and high- and lownutrient<br />
habitats. Functional Ecology 15:423-434.<br />
101
Chapitre I Article 1B<br />
Appendix 1<br />
Appendix 1. Daily mean soil temperature (5cm deep) in the Late (a), Early (b) and Inconsistent (c)<br />
treatments (black) and air temperature (grey) in 2006-2007.<br />
102
103<br />
Article 1C<br />
13 C and 15 N allocations of two alpine species from contrasting<br />
habitats reflect their different growth strategies<br />
Baptist, F., Choler, Ph., Tcherkez, G., Pontailler, J.Y.,<br />
Aubert, S. and Noguès S.<br />
In prep. for New Phytologist<br />
Système de marquage ( 13 C) mis en place à la <strong>Station</strong> <strong>Alpine</strong> <strong>Joseph</strong> <strong>Fourier</strong><br />
durant l’été 2005 et 2006. Photo : S. Aubert.
104
Chapitre I Article 1C<br />
Abstract<br />
• Intense efforts are currently devoted to disentangling the relationships between plant<br />
carbon allocation patterns and nitrogen availability.<br />
• Here, we applied 12 C/ 13 C and 14 N/ 15 N isotope techniques to elucidate C and N<br />
partitioning in two alpine species characterized by constrasting nutrient economies : a<br />
slow-growing species, Kobresia myosuroides (KM) and a fast-growing species, Carex<br />
foetida (CF) located at the ends of a snowmelt gradient in the alpine tundra (French<br />
Alps).<br />
• CF allocated higher labelling-related 13 C content belowground, produced more root<br />
biomass. Accordingly, assimilates transfered to roots were preferentially used for<br />
growth than respiration and tend to favor N reduction in this compartment. In addition,<br />
this species had a higher 15 N uptake efficiency than KM and a higher N translocation<br />
aboveground.<br />
• The results obtained with this couple of species thus suggest that at the whole-plant<br />
level, there is a compromise between N acquisition and C allocation for an optimized<br />
growth.<br />
Keywords : carbon and nitrogen isotope labelling, alpine plant, respiration, photosynthesis,<br />
root:shoot ratio, Kobresia myosuroides, Carex foetida, snowmelt gradient.<br />
105
Chapitre I Article 1C<br />
Introduction<br />
Distribution, productivity and carbon assimilation of plants are strongly affected by<br />
variations in soil fertility. Intense efforts are currently devoted to elucidating the relationships<br />
between plant carbon allocation patterns and nitrogen availability in order to improve our<br />
understanding of carbon cycles and sequestration pathways in terrestrial ecosystems<br />
(Trumbore 2006). This is particularly important in the context of global change, in which<br />
growth and carbon fixation tend to be promoted by atmospheric CO2 increase but depend on<br />
N (or other nutrients) availability (e.g. Long et al. 2006). In addition, vegetation shifts to plant<br />
species characterized by different nutrient economies may occur in response to natural,<br />
climate or human-induced ecosystem perturbations.<br />
<strong>Alpine</strong> ecosystems are particularly sensitive to such ecological effects because (i)<br />
alpine habitats are strongly N-limited in many instances (Bowman et al. 1993), (ii) snowcover<br />
gradients influence the nature of plant communities (Körner 1999, Choler 2005) and (iii) the<br />
composition of alpine vegetation varies in response to deposition of anthropogenic nitrogen<br />
(Bowman et al. 2006).<br />
However, the physiology of carbon allocation patterns of alpine plants in relation to N<br />
uptake is poorly understood. It is well known that increased N assimilation promotes carbon<br />
fixation and growth at the leaf or biomass level (Wright et al. 2004) and is accompanied by<br />
higher leaf and root respiration rates (Reich et al. 1997, Craine et al. 2002, Tjoelker et al.<br />
2005). However, the extent to which carbon allocation patterns are related to N uptake<br />
efficiency and allocation remains uncertain (Garnier 1991, Osone et al. 2008). For example,<br />
fast-growing species (e.g. Carex foetida) have higher leaf N contents and maximum<br />
carboxylation rates Vcmax than slow-growing species (e.g. Kobresia myosuroïdes) found at<br />
similar altitude (Baptist and Choler 2008). Therefore, it is currently assumed that fast-growing<br />
species allocate less carbon belowground, as suggested by biomass ratio measurements (i.e.<br />
the root:shoot ratio, Chapin 1980). Nevertheless, there is no direct evidence of such a<br />
relationship (Craine et al. 2002).<br />
As an aid to clarifying these points, we used 12 C/ 13 C and 14 N/ 15 N isotope techniques to<br />
investigate C and N fixation and allocation patterns of two alpine species along the snowmelt<br />
gradient: Carex foetida and Kobresia myosuroides. C. foetida is a fast-growing species found<br />
106
Chapitre I Article 1C<br />
in late snowmelt habitats, that are characterised by high N availability and a very short<br />
growing season (Choler 2005). K. myosuroides is a slow-growing species of early snowmelt<br />
habitats, that have opposite conditions, that is, low N availability and a longer growing<br />
season.<br />
While the respiratory properties are similar in both species, the present labelling<br />
experiments show that, in contrast to K. myosuroides, C. foetida has clear opposite leaf-toroot<br />
allocation ratios for C and N. In other words, C. foetida allocate more C to roots while N<br />
allocation favours the aboveground compartment. We therefore conclude that, in the present<br />
couple of species, the adaptation of fast-growing species for an optimal growth involves an<br />
increased C and N assimilation efficiencies to feed the belowground biomass production.<br />
107
Chapitre I Article 1C<br />
Material and methods<br />
Plant material<br />
We collected 37 monoliths of Kobresia myosuroides (Cyperaceae, KM) and Carex foetida<br />
(Cyperaceae, CF) respectively in the region of the Galibier pass (2646 meters above sea level)<br />
and the Agnel pass (2744 m a.s.l.) in the French Alps in October 2005. They were transferred<br />
into plastic pots (20×20×30 cm) in a common garden located in the Grand Galibier mountain<br />
range in the South-Western Alps (45°7’N, 6°5’E, 2100 m a.s.l.). Snowmelt occurred on the 15<br />
May 2006. The pulse-chase labelling experiments ( 13 C and 15 N labelling were independent)<br />
started on the 5 July 2006 and finished on the 26 July 2006. All the experiments were<br />
conducted in the <strong>Station</strong> <strong>Alpine</strong> <strong>Joseph</strong> <strong>Fourier</strong>, except the isotope measurements which<br />
where carried out at the University of Barcelona. The δ 13 C of CO2 of the air at the Galibier<br />
Pass was ca. -11.5 ± 0.1 ‰ (Noguès et al. 2006).<br />
13<br />
C labelling procedure<br />
In July 2006, at the peak of standing biomass, 12 out of 15 monoliths (here after refered as<br />
replicates) were labelled in 13 CO2 enriched atmosphere. The other three were used as control<br />
(for the initial carbon isotope composition before labelling, the corresponding sampling time<br />
is denoted as Tinit). After labelling, a first set of three was immediately harvested (T0). For the<br />
others, the chase time lasted 24 h (1 day, T1), 82 h (3.5 days, T3) and 274 h (11.5 days, T11)<br />
respectively. The day before the pulse-labelling, the plants were arranged in controlled<br />
conditions: 12 h photoperiod, mean air temperature of 18°C and 500 µmol m -2 sec -1 of light.<br />
Labelling was applied following a dark period of 12 h for all plants. After labelling and until<br />
the end of the chase period, plants were kept in the same controlled conditions. Every two<br />
days, the monoliths were watered with 500 ml of distilled water.<br />
The isotope label was applied during 5 h by enclosing the monoliths, two by two, in a 36 l-<br />
Perspex ® labelling chamber. Atmospheric air was first CO2-depleted (decarboxylated) by<br />
passing through a soda-lime column and then mixed to 13 CO2 fluxes from a gas cylinder<br />
(enriched at 5 %, Euriso-top, Saint-Aubin, France) in a mixing chamber. The mixing chamber<br />
was then connected to the sample air hose of the HCM 1000 Infra Red Gaz Analyser (Heinz<br />
Walz GmbH, Effeltrich, Germany) and the CO2 concentration was estimated. The CO2<br />
concentration within the chamber was kept between 380 and 420 ppm during all the labelling<br />
procedure thanks to mass flow controllers located before the mixing chamber (ROD-4, Aera,<br />
108
Chapitre I Article 1C<br />
Fort Collins, USA). The air flux passing through the labelling chamber was controlled by the<br />
HCM 1000 at a rate of 1.0 l min -1 . A second pump was added after the labelling chamber to<br />
avoid overpressure. One fan (Radio Spare, Beauvais, France) was fixed into the chamber to<br />
ensure air mixing. Aluminium tubes, arranged at the bottom of the chamber and connected to<br />
a water bath, maintained the chamber temperature at 22.5 ± 0.4°C during the pulses. Light<br />
intensity above the vegetation was kept at 550 µmol m -2 s -1 .<br />
At the end of each chase time (T0, T1, T3, T11) and also for Tinit, the three replicates were<br />
destructively harvested. We harvested the living aboveground vegetation first (by clipping the<br />
leaves at the soil surface). Half of the biomass was immediately lyophilised, while the rest<br />
was enclosed in the 1l-Perspex ® chamber to measure respiration (5 min) (see below for<br />
procedure) and the isotopic signature of dark-respired 13 CO2. To measure the latter, the 1lchamber<br />
connected to the LICOR 6200 was flushed with CO2-free air to ensure that only the<br />
CO2 respired in the chamber was measured. We let CO2 accumulate until it reached<br />
approximatively 1000 ppm and air samples were then collected using a special 50 ml syringe<br />
(SGE, Ringwood, Australia) and a needle (model microlance 3, BD, Plymouth, UK). The gas<br />
samples were passed through a magnesium perchlorate column (water-vapor trap) then<br />
immediately injected into a 10 ml vacutainer (BD vacutainer, Plymouth, UK). To avoid<br />
contaminations with the air present in the syringe and needle, both were purged with N2,<br />
before taking each sample. The vacutainers were also over-pressurized with N2 so the<br />
pressure inside the vacutainer was above the ambient pressure.<br />
Non woody (new) and woody (old) roots were subjected to a similar procedure after being<br />
harvested and washed. Accumulation time was a bit longer for old roots as respiration was<br />
much lower than for new roots and leaves. Leaves and roots were subsequently lyophilised for<br />
isotopic analysis of Organic Matter (OM). OM analyses were done using an elemental<br />
analyzer with a zero-blank autosampler (EA1108, Series 1, Carbo Erba Strumentazione,<br />
Milan, Italy) coupled to an isotope ratio mass spectrometer (Delta C, Finnigan Mat, Bremen,<br />
Germany) operating in continuous flow.<br />
The δ 13 C of respired CO2 was measured using a Gas Chromatography-Combustion-Isotope<br />
Ratio Mass Spectrometry (GC-C-IRMS). Water vapour and oxygen were removed from the<br />
gas samples and carbon dioxide, argon and nitrogen separated by gas chromatography<br />
(6890N, Agilent Technologies, Palo Alto, CA, USA) coupled to an isotope ratio mass<br />
spectrometer Delta plus through a GC-C Combustion III interphase (ThermoFinnigan, Bremen,<br />
Germany). The column used was a 30 m x 0.32 mm i.d. GS-GASPRO (J&W Scientific Inc.,<br />
109
Chapitre I Article 1C<br />
Folsom, CA, USA). The carrier gas was Helium at a flow rate of 1.2 ml min -1 . Injection port<br />
temperature was 220 o C. The oven temperature was kept at 60 o C during the whole run. The<br />
injection was done in split mode (injected volume 0.3 ml, split flow 20 ml min -1 ).<br />
CO2 gas exchange measurements<br />
In order to evaluate 13 C fixation during the pulse-labelling, CO2 fluxes were measured on<br />
each replicate with a LICOR 6200 (LI-COR, Lincoln, Nebraska USA) before and just after<br />
labelling. Light intensity, air temperature and relative air humidity were recorded for all the<br />
duration of the measurements. The net photosynthetic fixation rate (Anet) was calculated as the<br />
sum of net CO2 fluxes in light (NEP) and in darkness (ER, which takes into account the CO2<br />
evolution rate by both the belowground and aboveground compartments) as follows :<br />
A net<br />
= NEP + ER<br />
Eq. 1<br />
In darkness, respiration by the aboveground compartment was small compared to that of the<br />
belowground compartment. In other words, the contribution of photosynthetic organs to ER<br />
was small (typically less than 8 %), so the overestimation of the net photosynthetic rate Anet<br />
was negligible. At the end of the chase period (see section below), leaf, new and old root<br />
respiration was estimated every minute during 5 to 10 min by enclosing them in a dark 1l-<br />
Perspex ® chamber connected to the LICOR 6200.<br />
15<br />
N labelling procedure<br />
The 15 NO3, 15 NH4 and 15 N-glycine uptake by KM and CF was assessed independently from<br />
the 13 C-labelling, that is to say, on others 18 monoliths (n=3 replicates for each compound and<br />
each species). Glycine was chosen among others amino acids, as Lipson et al. (1999)<br />
indicated that it was the soil amino acid most available to plants. One hundred ml of a 1mM<br />
solution of 15 NO3, 15 NH4 or 15 N-glycine were added with a 5 ml syringe. The syringe was<br />
inserted at 5 cm depth in the soil following a 2x2 cm grid layout. We then watered plants with<br />
500 ml of demineralized water to ensure homogeneous labelling in the soil.<br />
15<br />
N isotope sampling and processing<br />
After a 24 h chase, leaves, new and old roots were harvested, sorted, washed with<br />
demineralized water and lyophilised for isotopic analysis. The same procedure was applied to<br />
three others unlabeled monoliths of each species, as a control.<br />
110
Chapitre I Article 1C<br />
Isotope labelling calculations<br />
To estimate 13 C and 15 N enrichment in each organ of the plants, %Atom ( 13 C or 15 N<br />
proportion) for 13 C and 15 N were calculated using the following the equation:<br />
% Atom<br />
δ + 1000<br />
=<br />
1000<br />
Eq. 2<br />
δ + 1000 +<br />
R s tan dard<br />
where δ is the isotopic signature of CO2 respired or of OM. Rstandard is the international<br />
standard references (i.e. 13 C/ 12 C, PeeDee Belemnite, and 15 N/ 14 N, atmospheric air).<br />
%Atom excess was then calculated as the %Atom 15 N or 13 C differences between labelled and<br />
unlabelled organs (control, at Tinit) :<br />
% Atom excess = Atom%<br />
− Atom%<br />
labelled<br />
unlabelled<br />
The labelling-derived 13 C content per DW (γ 13 C, in µg 13 C g -1 DW) in each organ of the plant<br />
was calculated as follows:<br />
γ<br />
13<br />
C =<br />
% Atom<br />
excess ⋅ % C<br />
where %C is the percentage of carbon in the organ. The labelling-derived 13 C flux associated<br />
with root and leaf respiration (γ 13 CR, in µg 13 C g -1 h -1 ) was calculated as follows :<br />
13 % Atom excess ⋅ R organ<br />
γ CR<br />
=<br />
Eq. 3<br />
mass<br />
organ<br />
where massorgan is the mass of the organ (g) considered, Rorgan is the respiration rate (µg C h -1 )<br />
and %Atom excess is here the 13 C atom excess in CO2.<br />
As the plants experienced similar conditions during the chase period and the respiration<br />
measurements, the cumulated labelling-derived 13 C content over time (in mg 13 C g -1 ) was<br />
estimated by (1) fitting an exponential decay constant to the labelling derived 13 C flux over<br />
chase time (γ 13 CR):<br />
13<br />
R<br />
( −b⋅t<br />
)<br />
γ C = a ⋅ exp where t is the time in hours, a and b are constants Eq. 4<br />
and (2) integrating this exponential over time. For CO2 respired by new and old roots, the<br />
maximum concentration sampling point was used as the “time zero” for the exponential curve<br />
fit.<br />
Total labelling-derived 13 C mass (γ 13 CM, µg or mg 13 C) at chase time T was calculated by<br />
averaging the organ mass over the fifteen replicates (see table 1). For this purpose, we added<br />
the labelling-derived 13 C mass for each organ and the loss through leaf and new/old root<br />
respiration from T0 to T as follows :<br />
111
Chapitre I Article 1C<br />
γ C ( T) = γ C ( T) ⋅ m + γ C ( T) ⋅ m + γ C ( T) ⋅ m +<br />
13 13 13 13<br />
M leaf leaf new new old old<br />
T<br />
13 13 13<br />
∫ ( γ C Rleaf () ⋅ leaf + γ C Rnew() ⋅ new + γ C Rold () ⋅ old )<br />
T0<br />
t m t m t m dt<br />
112<br />
Eq. 5<br />
By doing so, we could see whether the labelling-derived 13 C mass was balanced over time for<br />
each species, that is, whether the total 13 C-amount (remaining + respiratory losses) remained<br />
constant (Appendix 2). We also compared γ 13 CM to the amount of 13 C fixed by each replicate<br />
during the 5h-labelling based on Anet values integrated on the labelling period.<br />
The labelling-derived 15 N content per whole plant dry matter (γ 15 N, µg 15 N g -1 ) was calculated<br />
as following:<br />
15 % Atom excess⋅<br />
% N ⋅ massorgan<br />
γ N =<br />
Eq. 7<br />
mass<br />
plant<br />
Where %N is the percentage of nitrogen in the organ, massorgan, the mass of the organ (g) and<br />
massplant, the mass of whole plant (g).<br />
Similarly to 13 C data analysis, the labelling-derived 15 N mass (µg 15 N) was calculated for each<br />
organ based on the average mass over the nine replicates of each species (see table 1).<br />
Belowground productivity<br />
Below ground productivity was estimated using a root ingrowth core method. The ingrowth<br />
cores (5 × 15 cm) were established on the 30/05/06 by removing one soil core in another set<br />
of four replicate monoliths for each species and by filling the holes with the same but 2 mmsieved<br />
soil. Roots present within the cores were sampled on the 15/07/06, washed free of soil,<br />
dried at 60°C during 48h and weighed. Root production was then calculated as the root<br />
biomass divided by time between the 30/05/06 and the 15/07/06 and expressed per unit core<br />
surface for each replicate.<br />
Statistical procedure<br />
The statistical analyses referring to isotopic data were performed using the non-parametric<br />
Kruskall-Wallis test except for 15 N natural abundance which was performed using a one-way<br />
ANOVA. The same procedure was used to compare belowground productivity (n=4). The<br />
species-induced differences in flux measurements and R:S ratios were analysed using a oneway<br />
ANOVA. Finally, an ANCOVA was applied to test the regression between (1) the<br />
labelling derived 13 C amount (γ 13 C) of new roots OM against that of leaf OM and (2) the γ 13 C<br />
of root-respired CO2 against that of leaf-respired CO2. Species were considered as the
Chapitre I Article 1C<br />
qualitative factor. All analyses were performed with the Jump software (SAS Institute Inc.,<br />
Cary, North Carolina, USA).<br />
113
Chapitre I Article 1C<br />
Results<br />
Biomass production<br />
Mean biomass and belowground productivity data are indicated in Table 1 (upper part). Under<br />
our experimental conditions, KM has a larger aboveground biomass than CF, that is, has a<br />
higher shoot-to-root ratio. In addition, the belowground productivity is larger in CF: the root<br />
productivity per unit ground area was higher in CF (χ 2 =5.01, P=0.02) compare to KM (Table<br />
1).<br />
Morphological Characteristics K. myosuroides C. foetida<br />
Mean biomass (g)<br />
- Aboveground<br />
- New roots<br />
- Old roots<br />
Belowground productivity (g m -2 d -1 )<br />
Physiological characteristics<br />
Assimilation rate during labelling<br />
(ngC g -1 leaf DW sec -1 )<br />
Leaf respiration in darkness<br />
(ngC g -1 leaf DW sec -1 )<br />
New root respiration<br />
(ngC g -1 new root DW sec -1 )<br />
114<br />
2.6 (0.1)<br />
0.51 (0.07)<br />
21.6 (1.8)<br />
6.9 (1.8) a<br />
1.9 (0.1)<br />
0.80 (0.09)<br />
28.00 (2.0)<br />
12.5 (0.6) b<br />
791.5 (20.3) a 622.4 (13.3) b<br />
63.5 (6.7) a 100.3 (7.4) b<br />
233.6 (21.0) a<br />
206.3 (15.0) a<br />
Old root respiration<br />
(ng C g -1 old root DW sec -1 )<br />
56.4 (4.3) a 68.6 (13.0) a<br />
Table 1 Morphological and physiological characteristics of C. foetida and K.<br />
Myosuroides. See text for further statistical details. Different letters indicate<br />
significant differences between the two species (P
Chapitre I Article 1C<br />
Fig. 1 δ 13 C (‰) of leaf, new and old roots of K. Myosuroides (a) and C. Foetida (b). δ 13 C<br />
(‰) of CO2 respired by the leaves, new and old root of K. Myosuroides (c) and C. foetida<br />
(d) following the pulse-labelling. On the left of the dashed vertical line are shown 13 C<br />
natural abundance of leaves, new and old roots OM and of CO2 respired by the leaves, the<br />
new and the old roots. Leaves: white circle, new roots: white square, old roots: black<br />
square. All X –axes are time elapsed since the pulse-labelling (in days). Values are the<br />
mean ± se (n=3).<br />
Respiratory properties<br />
Leaf respiration in darkness was largely and significantly higher in CF (F1,28=13.2, P=0.001)<br />
(Table 1, bottom part). Thus, in our experimental conditions, the leaf respiration-to-net<br />
assimilation ratio was 8.0% in KM and 16.1% in CF. New and old root respiration did not<br />
differ significantly between both species.<br />
Leaf<br />
New roots<br />
Old roots<br />
Soil<br />
K. myosuroides C. foetida<br />
-3.40 (0.37) a<br />
0.61 (0.62) b<br />
-0.76 (0.14) b<br />
3.78 (0.12) c<br />
115<br />
0.19 (0.23) a<br />
-0.02 (0.37) a<br />
2.73 (1.12) ab<br />
4.49 (0.95) b<br />
Table 2 15 N natural abundance (δ 15 N, ‰) of unlabelled leaf,<br />
new roots, old roots, and soil in K. Myosuroides and C.<br />
Foetida monoliths. Values are the mean ± se. Different letters<br />
indicate significant differences between the organs and the soil<br />
(P
Chapitre I Article 1C<br />
13 C fixation and partitioning<br />
The 12 C/ 13 C isotope composition (δ 13 C) of organic matter (OM) and of respired CO2 after<br />
labelling is shown in Fig. 1. Clearly, at T0, leaves were the most labelled organs, followed by<br />
new roots (Fig. 1). Old roots were hardly labelled and always remained nearly not labelled<br />
throughout the experiment (corresponding to total chase time). The kinetics were very<br />
different for leaves and roots: the δ 13 C value of leaves continuously declined during chase<br />
time while that of roots increased within 1.5 days and reached a plateau.<br />
The decline of the 13 C-amount in leaves may be caused by: (i) isotopic dilution (natural 12 CO2<br />
fixed during day-time of the chase period), (ii) respiration (dark-respired CO2 was strongly<br />
13 13<br />
C-enriched, Fig. 1c and d) and (iii) export ( C-increase in roots within a couple of days).<br />
Noteworthy, CF showed a more rapid decline of the 13 C-abundance in leaf organic matter (the<br />
calculated half-time of the exponential decay (t1/2) is near 21 h for KM and 13 h only for CF).<br />
The isotopic dilution is probably not responsible for such a pattern: plants of both species<br />
experienced similar conditions and KM had a slightly higher photosynthetic rate than CF<br />
under the conditions of the experiment (see paragraph above, Table 1). By contrast,<br />
respiration contributed to such leaf 13 C-kinetics, simply because respiration was much larger<br />
in the case of CF (Table 1) while having a similar 13 C-enrichment (Fig. 1c and d).<br />
The faster decline of leaf 13 C in CF also came from the larger export of assimilates to roots:<br />
the δ 13 C value of new roots organic matter was higher in CF than in KM: in the steady-state,<br />
the δ 13 C value of new root organic matter is 0 and 40‰ for KM and CF respectively (Fig. 1a<br />
and b). That is, the labelling-derived carbon in new roots account for ~0.6 and 1.8% of the<br />
total C in KM and CF, respectively.<br />
116
Chapitre I Article 1C<br />
Fig. 2 (a) Labelling-derived 13 C content of new roots in<br />
relation to labelling-derived 13 C content of leaves and (b)<br />
labelling-derived 13 C content of CO2 respired by the new<br />
roots in relation to the labelling-derived 13 C content of CO2<br />
respired by the leaves for K. myosuroides (grey symbol)<br />
and C. foetida (white symbol) at each chase time. Values<br />
are the mean ± se (n=3). See text for further statistical<br />
details.<br />
The labelling derived 13 C amount (γ 13 C) of new roots is plotted against that of leaves in Fig. 2.<br />
There was a significant correlation between the γ 13 C value of new roots and that of leaves<br />
when species were considered together (F1,22=46.1, R 2 =0.71, P
Chapitre I Article 1C<br />
3). In KM, 45% of the labelling-derived 13 C remained in leaves, and nearly 5% of the<br />
labelling-derived 13 C was allocated to new roots. By contrast, 29% of the labelling-derived<br />
13<br />
C remained in leaves while new roots accounted for ~20%. Respiratory losses associated<br />
with leaves were more pronounced in KM than in CF while that associated with new roots<br />
respiration were larger in CF. However, we note that, in the case of new roots CF, the<br />
respiration-to-organic matter ratio of 13 C allocation was much smaller (Fig. 3, light grey),<br />
clearly suggesting that 13 C was directed to new root growth to a larger extent than to<br />
respiration.<br />
Fig. 3 Percentage allocation of the total labelling-derived 13 C mass (γ 13 CM)<br />
recovered in the leaves, the new and old roots and lost through leaf, new<br />
and old root respiration 11d after the pulse-labelling. Leaves : white, new<br />
roots: grey, old roots: dark grey. Hatching patterns correspond to C lost<br />
through respiration.<br />
Nitrogen allocation and partitioning<br />
The natural 14 N/ 15 N isotope composition (δ 15 N) of organs and soil is indicated in Table 2. Soil<br />
N was always 15 N-enriched (P
Chapitre I Article 1C<br />
The nitrogen allocation after 24 h 15 N-labelling with either 15 N-nitrate, 15 N-ammonium or 15 Nglycine<br />
is indicated in Fig. 4. Very clearly, CF was more 15 N-labelled than KM at the wholeplant<br />
level, whatever the labelling molecule was. In other words, CF had a higher N uptake<br />
efficiency (NupE) than KM: the recovery of 15 N from the labelling solution was 13.7 ± 2.5%<br />
Gly, 19.8 ± 3.1% NO3 - , 2.9 ± 1.2% NH4 + and 4.6 ± 0.5% Gly, 10.4 ± 3.8% NO3 - , 1.8 ± 0.4%<br />
NH4 + in CF and KM, respectively. For nitrate, the CF-to-KM ratio of NupE was then as high<br />
as 1.9.<br />
In addition, a larger proportion of N (nearly the double) was allocated to leaves in CF than in<br />
KM (circle graphs, Fig. 4a) when 15 N was supplied as nitrate; such a difference was less<br />
pronounced with 15 N-ammonium (Fig. 4b) and also less visible with 15 N-Gly (Fig. 4c).<br />
However, old roots represented a large 15 N-sink in Fig. 4, simply because of their high<br />
biomass. In other words, the specific 15 N-abundance (µg 15 N/g DW) was always low in old<br />
roots (data not shown). In the case of nitrate, the specific 15 N-abundance of leaves is 72.6 ±<br />
26.8 and 20.3 ± 9.7 µg 15 N/g DW in CF and KM, respectively, so that the CF-to-KM ratio<br />
was 3.5. Such a ratio is larger than the NupE ratio (1.9, see above), clearly demonstrating that<br />
preferential N allocation to leaves, rather than whole-plant uptake efficiency, was responsible<br />
for the larger 15 N mass in CF leaves (Fig. 4a).<br />
119
Chapitre I Article 1C<br />
Fig. 4 Labelling-derived 15 N content in whole<br />
plant dry matter (µg 15N g -1 DW) after 15 NO3 -<br />
(a), 15 NH4 + (b), 15 N-glycine (c) amendment in K.<br />
myosuroides (grey bar) and C. foetida (white<br />
bar). Circle graphs: Percentage allocation of the<br />
total labelling-derived 15 N mass recovered in the<br />
leaves (white), the new (grey) and old roots<br />
(black). Values are the mean ± se (n=3). ns : no<br />
significant, * P
Chapitre I Article 1C<br />
Discussion<br />
<strong>Alpine</strong> plants are frequently exposed to contrasted micro-environmental conditions<br />
(nutrients and water availability, light, etc). Within alpine meadows, a well-documented<br />
environmental gradient lies between early and late snowmelt locations. In the latter, the<br />
growing season is shorter and accompanied by relatively good nutrient availability<br />
(particularly at the beginning of the growing season) (Bowman 1992, Baptist and Choler<br />
2008). Plant growing under such conditions are thus energy-limited rather than nutrientlimited.<br />
By contrast, plants growing in early snowmelt habitats are much less energy-limited<br />
and soil nutrient is less abundant. Although the adaptation of these plants has been shown to<br />
involve growth rapidity (fast and slow-growing species are observed in late and early<br />
snowmelt conditions, respectively) and photosynthetic capacity (which is higher in fastgrowing<br />
species, Wright et al. 2004), the primary carbon metabolism and allocation patterns<br />
are poorly known. The aim of this study was thus to clarify C and N partitioning patterns in<br />
Carex foetida (CF) and Kobresia myosuroides (KM), two species found in opposite habitats,<br />
that is, growing under late and early snowmelt conditions.<br />
Carbon fixation and partitioning<br />
Adaptation of CF to short growing-season duration involves high relative growth rates<br />
(e.g. belowground productivity, Table 1) and photosynthetic capacity (see APPENDIX 1).<br />
This agrees with the larger maximal carboxylation rate Vcmax and higher leaf N elemental<br />
content in CF (Choler 2005, Baptist and Choler 2008), which is an indicator of the specific<br />
Rubisco content. Whole-plant carbon allocation favored the root compartment in CF as<br />
indicated by the larger 13 C-transfer to new roots (Fig. 1, 2 and 3) as compared to KM. Such a<br />
transfer to roots plausibly involved a larger flux of assimilates rather than a limited flux of<br />
assimilates with high 13 C-specific abundance, because the kinetics of the 13 C-decline in leaf<br />
organic matter are quicker in CF (Fig. 1; t1/2 values of 13 h versus 21 h in KM; Fig. 2a) while<br />
the initial leaf 13 C-abundance is very similar in both species.<br />
The mass-balance after a 11 d chase period indicate that the larger carbon flow from<br />
leaves to roots is directed to feeding new root growth rather than respiration in CF plants (Fig.<br />
3). Indeed, the dissimilar 13 C-abundance in root-respired CO2: while the 13 C allocation<br />
(labelling-derived 13 C content) to new root total organic matter is nearly 3 times higher in CF<br />
(Fig. 1 and ANNEXE 3), the maximum 13 C content in root-respired CO2 was the double only.<br />
In other words, the turn-over (consumption) of the root respiratory pool was lower in CF.<br />
We nevertheless recognize that there were large discrepancies between the two types<br />
121
Chapitre I Article 1C<br />
of roots, that is, woody (old) and non-woody (new) roots. Old roots were weak 13 C-sinks<br />
(very low 13 C-abundance after labelling, Fig. 1) with small respiratory activity as compared to<br />
new roots (nearly 70% less, Table 1). This reflects differences in metabolic activities: new<br />
roots are responsible for root growth and nutrients absorption while old roots have a<br />
conduction and storage role (Comas et al. 2000, Lipp and Andersen 2003, Volder et al. 2005).<br />
However, at the whole plant level, old roots accounted for a substantial 13 C content because of<br />
their very large biomass (Table 1), while the C allocation pattern to old roots was somewhat<br />
similar in both species (Fig.s 1 and 3).<br />
In the present case, carbon allocation closely correlated to belowground productivity<br />
rather than to belowground biomass. It should be emphasised that the root-to-shoot biomass<br />
ratio is the result of two opposing forces: root turnover (degradation/production balance) and<br />
carbon translocation from leaves. That is, as already proposed by Carbone & Trumbore<br />
(2007) and Craine et al. (2002), the root-to-shoot ratio may be an unreliable trait to predict<br />
instantaneous carbon partitioning, so that physiological 13 C- or 14 C - studies using tracing are<br />
necessary to unravel carbon allocation patterns.<br />
Nitrogen uptake and assimilation<br />
Variations in 15 N uptake between both species are consistent with previous studies<br />
which suggest that fast-growing species display higher specific nitrogen absorption rate than<br />
slow-growing species (Garnier 1991, Poorter et al. 1991). Besides, CF and KM exhibited<br />
different N allocation patterns : CF experiences higher N allocation to leaves after a 24 h<br />
chase compared to KM (Fig. 3). Consequently, one may assume that N translocation toward<br />
aboveground compartment was more efficient in CF than in KM plants.<br />
KM exhibited a prevalence of leaf N reduction/assimilation over root reduction in contrast to<br />
CF (Table 2). In ordinary conditions where nitrate is reduced by both leaves and roots, the<br />
natural 14 N/ 15 N isotope composition (δ 15 N) of leaves is higher ( 15 N-enriched) because nitrate<br />
reduction fractionates against 15 N thereby enriching the remaining nitrate molecules exported<br />
to leaves (for a recent review, see Tcherkez and Hodges 2007). This was typically the case in<br />
CF (Table 2). By contrast, KM leaves were not 15 N-enriched as compared to new roots,<br />
demonstrating that N reduction occured mainly in leaves (Table 2). Under non-limiting<br />
nutrients availability, shoots generally appear to be the predominant site of NO3 - reduction<br />
because of the higher content of excess reductants produced by photosynthesis (Scheurwater<br />
et al. 2002). As a result, it has been logically stated that fast-growing species may experience<br />
higher NO3 - reduction in the leaves compare to the roots because of larger photosynthetic rate<br />
122
Chapitre I Article 1C<br />
- which produce important amount of reductants (Gojon et al. 1994). However, the site of<br />
NO3 - reduction is dependant over others factors such as the specific rate of nitrate reductase<br />
activity, the biomass allocation (Gojon et al. 1994, Scheurwater et al. 2002) or environmental<br />
conditions (Radin 1978, Andrews 1986, Miller and Cramer 2004). In the case of CF, the high<br />
C flux allocated to the belowground compartment may furnish enough reductants, through<br />
glycolysis and oxidative pentose phosphate pathway, to maintain a significant level of NO3 -<br />
reduction into the roots (Pate 1980). Besides, the ability to reduce efficiently NO3 - in roots<br />
may limit N efflux and contribute to the N uptake efficiency (Mata et al. 2000, Miller and<br />
Cramer 2004). In contrast, arctic and alpine slow-growing species, such as KM, exhibit<br />
generally lower nitrate reductase activity (Atkin 1996) and as a consequence the important<br />
presence of reductants and C skeleton provided by photosynthesis may favor the<br />
assimilation/reduction of NO3 - in the aboveground compartment. Finally, it is also a way for<br />
slow-growing species to limit specific respiratory cost associated to N uptake by reducing N<br />
losses through efflux (Scheurwater et al. 1999, Mata et al. 2000).<br />
Biomass and energetic root/shoot balance<br />
A larger rate of root respiration was expected in CF compare to KM plants as more<br />
respiratory energy was necessary to support higher root productivity and nitrogen uptake<br />
(almost two-fold larger). Nevertheless, root respiration did not differ between the two species<br />
suggesting that the fast-growing species respired at lower rate than expected from its C and N<br />
metabolism. Previous studies already reported similar results and noticed the absence of clear<br />
relationships between RGR and root respiration rate (e.g. van der Werf et al. 1988, e.g.<br />
Poorter et al. 1991).<br />
Root respiration can be separated into three components, i.e. respiration for root growth, for<br />
maintenance and for ion uptake. We thus assume a classical relationship between total root<br />
respiration (denoted as R) and these components as follows (modified version from Van der<br />
Werf et al. 1994) :<br />
R = R + C ⋅ NupE<br />
+ C ⋅ P<br />
m<br />
u<br />
where R is root respiration, Rm is maintenance respiration, NupE is the nitrogen uptake<br />
efficiency, Pr is the root productivity and Cu and Cg, the specific respiratory growth for ion<br />
uptake and growth respectively.<br />
Based on this equation, the reduced respiratory requirements of CF could be explained by a<br />
lower energy requirements for nutrients uptake (Cu), a much lower maintenance respiration<br />
123<br />
g<br />
r
Chapitre I Article 1C<br />
(RR) and/or a reduced growth cost could explained (Cg).<br />
Scheurwater et al. (1998) and van der Werf et al. (1988) demonstrate that, within a functional<br />
group (e.g. Gramineae), maintenance respiration differ only slightly between fast- and slowgrowing<br />
species. Similarly, numerous studies have proved that construction cost of roots and<br />
leaves did not differ between fast and slow-growing species (van der Werf et al. 1988, Navas<br />
et al. 2003, Roumet et al. 2006) and it was the case for CF and KM (data not shown). Thus,<br />
lower specific respiratory cost associated to growth or maintenance respiration are unlikely.<br />
As a result, this suggests that CF has lower costs associated to ion uptake as this has already<br />
been demonstrated for various fast-growing graminoids (Scheurwater et al. 1998, Scheurwater<br />
et al. 1999). Thus, the low respiratory requirements for N reduction and assimilation in CF<br />
might be responsible for the reduced root respiration rate.<br />
Conclusion<br />
Taken as a whole, it is apparent that CF and KM nearly represent two extreme cases of<br />
the compromise between shoot and roots involvement in C and N assimilations. In contrast to<br />
KM, CF exhibits (1) an improved photosynthetic capacity and N uptake efficiciency (2) a<br />
preferential carbon allocation to roots favoring root growth and NO3 - reduction in this<br />
compartment and (3) a higher N aboveground translocation. CF root respiration was much<br />
lower than expected, and this was likely caused by a lower cost for ion uptake (lower N<br />
efflux, Scheurwater et al. 1999). The results obtained with this couple of species therefore<br />
suggest that at the whole-plant level, there is a compromise between N acquisition and C<br />
allocation for an optimized growth : the fast growing species, which is energy-limited,<br />
exhibits a tighter coupling between C and N metabolisms than the slow-growing’s one more<br />
nutrient-limited.<br />
Acknowledgements<br />
We gratefully acknowledge Laurent Vanbostal, Céline Flahaut, Peter Streb, Richard<br />
Bligny, Marie-Pascale Colace for their help in the laboratory. We also thank Fabien Quétier<br />
and Jaleh Ghashghaie for their helpful discussions and Sophie Rickebusch for english<br />
improvement. Logistical supports were provided by the “Laboratoire d’Ecologie <strong>Alpine</strong>”<br />
(UMR 5553 CNRS/UJF, University <strong>Joseph</strong> <strong>Fourier</strong>) and the “<strong>Station</strong> <strong>Alpine</strong> <strong>Joseph</strong> <strong>Fourier</strong>”,<br />
the alpine field station of the University <strong>Joseph</strong> <strong>Fourier</strong>. The financial support of CNRS and<br />
Ministerio de Educación y Ciencia (PR2007-0335) is gratefully acknowledged.<br />
124
Chapitre I Article 1C<br />
References<br />
Andrews, M. 1986. The partioning of nitrate assimilation between root and shoot of higher<br />
plants. Plant Cell And Environment 9:511-519.<br />
Atkin, O. K. 1996. Reassessing the nitrogen relations of Arctic plants: a mini-review. Plant,<br />
Cell and Environment 19:695-704.<br />
Baptist, F., and P. Choler. 2008. A simulation on the importance of growing season length<br />
and canopy functional properties on the seasonal Gross Primary Production of<br />
temperate alpine meadows. Annals Of Botany 101:549-559.<br />
Bowman, W. D. 1992. Inputs and storage of nitrogen in winter snowpack in an alpine<br />
ecosystem. Arctic And <strong>Alpine</strong> Research 24:211-215.<br />
Bowman, W. D., J. R. Gartner, K. Holland, and M. Wiedermann. 2006. Nitrogen critical loads<br />
for alpine vegetation and terrestrial ecosystem response: Are we there yet? Ecological<br />
Applications 16:1183-1193.<br />
Bowman, W. D., T. A. Theodose, J. C. Schardt, and R. T. Conant. 1993. Constraints of<br />
nutrient availability on primary production in two alpine communities. Ecology<br />
74:2085-2097.<br />
Carbone, M. S., and S. E. Trumbore. 2007. Contribution of new photosynthetic assimilates to<br />
respiration by perennial grasses and shrubs: residence times and allocation patterns.<br />
New Phytologist 176:124-135.<br />
Chapin, F. S., III. 1980. The mineral nutrition of wild plants. Annual Review of Ecology and<br />
Systematics 11:37-52.<br />
Choler, P. 2005. Consistent shifts in <strong>Alpine</strong> plant traits along a mesotopographical gradient.<br />
Arctic Antarctic And <strong>Alpine</strong> Research 37:444-453.<br />
Comas, L. H., D. M. Eissenstat, and A. N. Lakso. 2000. Assessing root death and root system<br />
dynamics in a study of grape canopy pruning. New Phytologist 147:171-178.<br />
Craine, J. M., D. Tilman, D. Wedin, P. Reich, M. Tjoelker, et al. 2002. Functional traits,<br />
productivity and effects on nitrogen cycling of 33 grassland species. Functional<br />
Ecology 16:563-574.<br />
Garnier, E. 1991. Resource capture, biomass allocation and growth in herbaceous plants.<br />
Trends In Ecology And Evolution 6:126-131.<br />
Gojon, A., C. Passard, and C. Bussi. 1994. Root/shoot distribution of NO3 - assimilation in<br />
herbaceous and woody species. Pages p131-147 in R. Roy and E. Garnier, editors. A<br />
whole plant perspective on carbon-nitrogen interactions. SPB Academic Publishing,<br />
The Hague.<br />
125
Chapitre I Article 1C<br />
Körner, C. 1999. <strong>Alpine</strong> Plant Life. Springer Verlag, Berlin Heidelberg New York.<br />
Lipp, C. C., and C. P. Andersen. 2003. Role of carbohydrate supply in white and brown root<br />
respiration of Ponderosa pine. New Phytologist 160:523-531.<br />
Lipson, D. A., T. K. Raab, S. K. Schmidt, and R. K. Monson. 1999. Variation in competitive<br />
abilities of plants and microbes for specific amino acids. Biology And Fertility Of<br />
Soils 29:257-261.<br />
Long, S. P., E. A. Ainsworth, A. D. B. Leakey, J. Nosberger, and D. R. Ort. 2006. Food for<br />
thought: Lower-than-expected crop yield stimulation with rising CO2 concentrations.<br />
Science 312:1918-1921.<br />
Mata, C., N. van Vemde, D. T. Clarkson, M. A. Martins-Louçao, and H. Lambers. 2000.<br />
Influx, efflux and net uptake of nitrate in Quercus suber seedlings. Plant And Soil<br />
221:25-32.<br />
Miller, A. J., and M. D. Cramer. 2004. Root nitrogen acquisition and assimilation. Plant And<br />
Soil 274:1-36.<br />
Navas, M. L., B. Ducout, C. Roumet, J. Richarte, J. Garnier, et al. 2003. Leaf life span,<br />
dynamics and construction cost of species from Mediterranean old-fields differing in<br />
successional status. New Phytologist 159:213-228.<br />
Noguès, S., G. Tcherkez, P. Streb, A. Pardo, F. Baptist, et al. 2006. Respiratory carbon<br />
metabolism in the high mountain plant species Ranunculus glacialis. Journal of<br />
Experimental Botany 57:3837-3845.<br />
Osone, Y., A. Ishida, and M. Tateno. 2008. Correlation between relative growth rate and<br />
specific leaf area requires associations of specific leaf area with nitrogen absorption<br />
rate of roots. New Phytologist 179:417-427.<br />
Pate, J. S. 1980. Transport and partitioning of nitrogenous solutes. Annual Review of Plant<br />
Physiology 31:313-340.<br />
Poorter, H., A. Van Der Werf, O. K. Atkin, and H. Lambers. 1991. Respiratory energy<br />
requirements of roots vary with the potential growth rate of a plant species.<br />
Physiologia Plantarum 83:469-475.<br />
Radin, J. W. 1978. A physiological basis for the division of nitrate assimilation between roots<br />
and leaves. Plant Science Letters 13:21-25.<br />
Reich, P. B., M. B. Walters, and D. S. Ellsworth. 1997. From tropics to tundra: global<br />
convergence in plant functioning. Proceedings Of The National Academy Of Sciences<br />
Of The United States Of America 94:13730-13734.<br />
Roumet, C., C. Urcelay, and S. Diaz. 2006. Suites of root traits differ between annual and<br />
126
Chapitre I Article 1C<br />
perennial species growing in the field. New Phytologist 170:357-368.<br />
Scheurwater, I., D. T. Clarkson, J. V. Purves, G. Van Rijt, L. R. Saker, et al. 1999. Relatively<br />
large nitrate efflux can account for the high specific respiratory costs for nitrate<br />
transport in slow-growing grass species. Plant And Soil 215:123-134.<br />
Scheurwater, I., J. H. C. Cornelissen, F. Dictus, R. Welschen, and H. Lambers. 1998. Why do<br />
fast- and slow-growing grass species differ so little in their rate of root respiration,<br />
considering the large differences in rate of growth and ion uptake? Plant, Cell and<br />
Environment 21:995-1005.<br />
Scheurwater, I., M. Koren, H. Lambers, and O. K. Atkin. 2002. The contribution of roots and<br />
shoots to whole plant nitrate reduction in fast- and slow-growing grass species. J. Exp.<br />
Bot. 53:1635-1642.<br />
Tcherkez, G., and M. Hodges. 2007. How stable isotopes may help to elucidate primary<br />
nitrogen metabolism and its interaction with (photo)respiration in C3 leaves. Journal of<br />
Experimental Botany 59:1685-1693.<br />
Tjoelker, M. G., J. M. Craine, D. Wedin, P. B. Reich, and D. Tilman. 2005. Linking leaf and<br />
root trait syndromes among 39 grassland and savannah species. New Phytologist<br />
167:493-508.<br />
Trumbore, S. 2006. Carbon respired by terrestrial ecosystems - recent progress and<br />
challenges. Global Change Biology 12:141-153.<br />
van der Werf, A., A. Kooijman, R. Welschen, and H. Lambers. 1988. Respiratory energy<br />
costs for the maintenance of biomass, for growth and for ion uptake in roots of Carex<br />
diandra and Carex acutiformis. Physiologia Plantarum 72:483-491.<br />
Van der Werf, A., H. Poorter, and H. Lambers. 1994. Respiration as dependent on a species'<br />
inherent growth rate and on the nitrogen supply to the plants. Pages 91-110 in J. Roy<br />
and E. Garnier, editors. A whole plant perspective on Carbon-Nitrogen interactions.<br />
SPB Academic Publishing, The Hague.<br />
Volder, A., D. R. Smart, A. J. Bloom, and D. M. Eissenstat. 2005. Rapid decline in nitrate<br />
uptake and respiration with age in fine lateral roots of grape: implications for root<br />
efficiency and competitive effectiveness. New Phytologist 165:493-502.<br />
Wright, I. J., P. B. Reich, M. Westoby, D. D. Ackerly, Z. Baruch, et al. 2004. The worldwide<br />
leaf economics spectrum. Nature 428:821-827.<br />
127
Chapitre I Article 1C<br />
Appendix 1<br />
128<br />
Appendix 1. Net leaf CO2 assimilation<br />
per g DW of Kobresia myosuroides<br />
(black circle) and Carex foetida (white<br />
circle) in relation to PAR<br />
(Photosynthetic Active Radiation). Net<br />
leaf CO2 assimilation at saturating light<br />
reached 1755.5±1097.7 ng C g -1 leaf DW<br />
s -1 and 2660.2±93.3 ngC g -1 leaf DW s -<br />
1 for Kobresia myosuroides and Carex<br />
foetida respectively. Values are the mean<br />
± se (n = 3).<br />
Material and methods :<br />
An open-flow photosynthesis system (model 6400, LiCOR, NE, USA) equipped with a CO2<br />
controller (CO2 concentration equalled 400 pap) was used to measure light–response curves<br />
of Carex foetida and Kobresia myosuroides under constant temperature and humidity in July<br />
2004. The system was maintained in a closed thermostated chamber and leaf temperature<br />
averaged ± 20°C.<br />
Appendix 2<br />
Chase time K. myosuroides C. foetida<br />
T0<br />
T1<br />
T3<br />
T11<br />
1.28 (0.12) a<br />
0.95 (0.02) b<br />
0.80 (0.09) b<br />
0.63 (0.05) b<br />
1.36 (0.22) a<br />
0.97 (0.09) a<br />
1.13 (0.14) a<br />
0.94 (0.13) a<br />
Appendix 2. Labelling-derived 13 C mass (γ 13 CM) at each chase time<br />
(mg 13 C) for K. Myosuroides and C. Foetida. See equation 5 for<br />
calculations and text for statistical details. Values are the mean ± se.<br />
Different letters indicate significant differences between different<br />
chase times (P
Chapitre I Article 1C<br />
Appendix 3<br />
Appendix 3. Labelling-derived 13 C content (γ 13 C, µg 13 C g -1 DW) (a-b), labelling-derived 13 C flux (γ 13 CR, µg<br />
13 C g -1 DW h -1 ) (c-d) and labelling-derived 13 C mass (γ 13 CM, µg 13 C) (e-f) in leaves, new and old roots of K.<br />
Myosuroides and C. foetida following the pulse-labelling. Inlet graphs : cumulated labelling-derived 13 C mass<br />
(µg 13 C) respired by the leaves, new and old root of K. Myosuroides (e) and C. foetida (f) following the pulselabelling.<br />
Leaves: white circle, new roots: white square, old roots: black square. All X –axes are time elapsed<br />
since the pulse-labelling (in days). Values are the mean ± se (n=3).<br />
129
Chapitre I Article 1C<br />
130
131<br />
Chapitre II<br />
Impact de l’enneigement sur la décomposition des litières et sur la<br />
respiration hétérotrophique
CHAPITRE II<br />
Snow cover exerts control over decomposition in alpine tundra along a snowmelt<br />
gradient. ________________________________________________________________ 133<br />
Abstract_____________________________________________________________________________ 135<br />
Introduction__________________________________________________________________________ 136<br />
Material and methods __________________________________________________________________ 138<br />
Results______________________________________________________________________________ 143<br />
Discussion___________________________________________________________________________ 149<br />
Acknowledgements____________________________________________________________________ 155<br />
References___________________________________________________________________________ 155<br />
Soil respiration in alpine tundra : impacts of seasonal snow cover and soil carbon<br />
content. _________________________________________________________________ 161<br />
Abstract_____________________________________________________________________________ 163<br />
Introduction__________________________________________________________________________ 164<br />
Materials and methods _________________________________________________________________ 166<br />
Results______________________________________________________________________________ 172<br />
Discussion___________________________________________________________________________ 178<br />
Acknowledgements____________________________________________________________________ 181<br />
References___________________________________________________________________________ 181<br />
Tannin impacts on microbial diversity and the functioning of alpine soils: a<br />
multidisciplinary approach. ________________________________________________ 189<br />
132
Article 2A<br />
Snow cover exerts control over decomposition in<br />
alpine tundra along a snowmelt gradient.<br />
Baptist, F., G. Yoccoz, and Ph. Choler<br />
In prep. for Plant and soil<br />
Combe Roche Noire, le 17/10/2006 (~ 2700m). Période durant laquelle une partie des sacs<br />
de litière a été prélevée (expérimentation II). En arrière plan, la Meije (massif des Ecrins,<br />
Fr). Photo : Ph. Choler.<br />
133
134
Chapitre II Article 2A<br />
Abstract<br />
We assessed the interplay between short-term and long-term effects of snowpack on litter<br />
decomposition in alpine tundra at early and late snowmelt locations. Short-term effects are<br />
driven by the direct influence of snow cover on edaphoclimatic conditions (topographical<br />
effect), whereas long-term effects derive from the ecological sorting of species and plant traits<br />
(species effect). We examined the relationship of snow cover dynamics to seasonal and<br />
annual patterns of litter mass loss and litter nitrogen release. For these purposes, we compared<br />
the in situ decomposition of four native plant litters (two graminoids and two shrubs) using a<br />
two-year reciprocal-transplant litter-bag experiment. Additionally, a seasonal experiment was<br />
performed to estimate the relative importance of winter and summer periods for litter<br />
decomposition. Our results suggest that decomposition was enhanced in late snowmelt<br />
compared to early snowmelt locations irrespective of species identity. Winter decomposition<br />
rate was significantly correlated to mean winter soil temperature. Frozen soils at early<br />
snowmelt locations reduced winter decomposition. However, species and growth form<br />
appeared to determine primarily decomposition rate, with topography exerting only a<br />
secondary influence. Mass loss was slower from shrub litter than from graminoid litter<br />
regardless of topographical location. No significant effect of topography on N immobilization<br />
was detected. The inconsistent snowpack in early snowmelt locations delayed the final stage<br />
of N mineralization and may contribute to reduce N availability in the ecosystem. We<br />
concluded that reduced snow cover would slow litter decomposition at late snowmelt<br />
locations in alpine tundra and hence may favour greater carbon sequestration in these<br />
ecosystems. However, changes in litter quality as a result of shifts in growth form would<br />
probably be more important in determining litter decomposition rates than the short-term<br />
effect of variations in snow cover.<br />
Keywords : snowmelt gradient, alpine tundra, growth form, litter decomposition, litter<br />
quality, Kobresia myosuroides, Dryas octopetala, Salix herbacea, Carex foetida, Alopecurus<br />
gerardi.<br />
135
Chapitre II Article 2A<br />
Introduction<br />
Seasonally snow-covered ecosystems sequester a large pool of organic carbon in the<br />
soil, which appears particularly vulnerable in the context of global warming (Hobbie et al.<br />
2000, Monson et al. 2006). Recent climate analyses postulate that, associated with higher<br />
temperature, snowfall may decline during the upcoming decades, in the northern hemisphere,<br />
especially in American, European and Russian mountain ecosystems (Serreze et al. 2000,<br />
Beniston 2005). In these systems, the landscape scale distribution of snow is one of the most<br />
important variables controlling mountain ecosystem properties. Variation in the depth and<br />
duration of snowpack result in large differences in edaphoclimatic conditions, and plant<br />
community composition (Walker et al. 1993). Consequently, changes in snow regime may be<br />
of dramatic consequence for nutrient cycling processes and soil carbon sequestration<br />
(Robinson 2002). As such, assessing the affect of snow distribution on the rate of<br />
decomposition and associated nitrogen release is a crucial element in predicting the impact of<br />
global change on carbon stocks in these regions.<br />
Snow can affect decomposition on various levels. It can influence decomposition, in<br />
the short term, affecting wintertime soil temperature by insulating soil and/or summertime soil<br />
moisture. In the longer term, snow induces consistent and repeated changes in growing-season<br />
length, soil fertility, and water availability, thereby driving the ecological sorting of species<br />
and plant functional traits (Kudo 1996, Choler 2005). Thus, snow directly and indirectly<br />
controls litter decomposition and nitrogen release (Walker et al. 1999, Groffman et al. 2001).<br />
Several recent studies have addressed the impact of variation in snow depth on carbon<br />
(C) and nitrogen (N) mineralization (Campbell et al. 2005). They have done this by<br />
manipulating snow cover (Walker et al. 1999, Chimner and Welker 2005), or by correlating<br />
Net Ecosystem CO2 Exchange (NEE) to inter-annual variations in snow depth (Monson et al.<br />
2006). These studies focussed on the short-term effect of snow-depth variations on C<br />
mineralization, but did not address the effect of long-term snow-induced changes in litter<br />
quality or in plant community structure on this process. The latter two factors are<br />
interdependent and strongly driven by environmental conditions (Hobbie 1996, Robinson<br />
2002). In order to determine the main controls over litter decomposition and associated N<br />
released in snow-covered ecosystems, we need to examine the interplay between (1) snowinduced<br />
changes in edaphoclimatic conditions and (2) snow-induced changes in litter quality.<br />
136
Chapitre II Article 2A<br />
Several approaches have been proposed to undertake the difficult challenge of<br />
studying the long-term effects of climate change (Rustad 2006): (1) long-term monitoring (2)<br />
modelling or (3) observations of existing environmental gradients treated as space-for-time<br />
proxies. In alpine ecosystems, the distribution of snow (and therefore the snowmelt<br />
behaviour) is closely related to mesotopographical gradients (i.e. an ecocline along a small to<br />
medium-sized hill slope). Vascular plants in early snowmelt locations exhibit a combination<br />
of leaf trait attributes, including low LDMC and SLA (Leaf Dry Matter Content, Specific<br />
Leaf Area) and high C/N ratio (Kudo 1996, Choler 2005, Baptist and Choler 2008) which are<br />
generally associated to low decomposability (e.g. Cornelissen et al. 1999, e.g. Kazakou et al.<br />
2006). Conversely, the leaf traits of species from late snowmelt locations, exhibit high SLA or<br />
Nmax, which give rise to better quality litter.<br />
In this study, we compared litter decomposition in early snowmelt and late snowmelt<br />
locations. We addressed the following questions: (1) how important is the influence of species<br />
identity compared to that of edaphoclimatic conditions on decomposition in alpine tundra, (2)<br />
how do seasonal patterns of decomposition relate to snow cover dynamics in early and late<br />
snowmelt locations, and (3) what is the impact of seasonal and annual litter decomposition on<br />
N release. To address these questions, we established two litter decomposition experiments:<br />
(1) a two-year reciprocal transplant litter experiment to disentangle species effect from<br />
topographical effect on decomposition (experiment I), and (2) a seasonal experiment to<br />
identify relative influence of summer and winter periods on litter decomposition (experiment<br />
II).<br />
137
Chapitre II Article 2A<br />
Material and methods<br />
Study site<br />
Our research area was located in the mountain ranges of Grand Galibier and Grandes Rousses,<br />
South-Western French Alps (45°7’N, 6°5’E) above the potential tree line (2300-2400 m<br />
a.s.l.). This study was conducted in three sites. Each site was characterized by both the late<br />
and early snowmelt conditions (hereafter resumed as the topographical location) located at a<br />
distance of about 30 to 50 m apart (in total three replicates of each topographical location).<br />
Sites A and B were orientated East and were situated respectively at 2520m and 2550m (slope<br />
: 0° and ∼ 30° respectively). The distance between two any sites always exceeded 500m. Site<br />
C was orientated North-East at an altitude of 2550m (slope : 0° and 20° in late and early<br />
snowmelt locations). In early snowmelt locations, communities were dominated by Kobresia<br />
myosuroides (Cyperaceae, KM) and Dryas octopetala (Rosaceae, DO). In late snowmelt<br />
locations, Carex foetida (Cyperaceae, CF), Salix herbacea (Salicaceae, SH), Alopecurus<br />
gerardi (Poaceae, AG) and Alchemilla pentaphyllea (Rosaceae) were the most abundant<br />
species. To estimate standing biomass and aboveground net primary productivity, we<br />
randomly harvested aboveground biomass in a 40 × 40 cm quadrat (n=3) on 23/07/03 at peak<br />
standing biomass in both topograpical locations of the A, B and C sites (Table 1). In the case<br />
of shrubs, only leaves were harvested (see below). Aboveground net primary productivity was<br />
determined by dividing standing biomass by the time between the date of snowmelt and peak<br />
biomass (Table 1).<br />
The soils are classified as a stagnogley, enriched in clay, in late snowmelt locations, and as an<br />
alpine ranker in early snowmelt locations. The bedrock is basic flysh in sites A and B and<br />
calcareous in site C.<br />
Climatic recordings<br />
Hourly soil temperature was recorded in each topographical location from 2003 to 2006 with<br />
Hobo probes (Onset computer corporation, Bourne, MA, USA) buried at 5 cm belowground<br />
(one per topographical location, in total 6 hobo probes). Soil temperatures that remain close to<br />
0 °C (usually between –1 and 1°C) throughout the day indicate a persistent snow cover. The<br />
wintertime period was calculated as the number of days exhibiting a mean soil temperature<br />
equal or below 0°C (Table 1). Five weeks separated snowmelt in early snowmelt compared to<br />
late snowmelt locations (Table 1). Mean wintertime soil temperature was also determined in<br />
each topographical location. Finally, volumetric soil water content in each topographical<br />
138
Chapitre II Article 2A<br />
location at a depth of 5 cm was measured continuously during growing seasons 2005 and<br />
2006 with an Echo Probe (Decagon Devices, Pullman, WA).<br />
Litter decomposition experiments<br />
Experiment I<br />
We chose litter from two dominant species in late snowmelt locations (here after “substrate”)<br />
which represented more than 70% of aboveground biomass: one graminoid (Carex foetida)<br />
and one shrub (Salix herbacea). In early snowmelt locations, we selected one graminoid<br />
(Kobresia myosuroides) and one shrub (Dryas octopetala) which corresponded to more than<br />
90% of total community biomass. We constructed 10×10-cm polyethylene litter-bags. They<br />
were separately filled with 1g of the litter of each species which was removed from the field<br />
at the end of the growing season and previously oven dried at 60°C for 48H.<br />
The reciprocal-transplant litter experiment followed a split-plot-design. In total 384 litter-bags<br />
were deployed giving 8 replicates for 2 harvests of all substrates (CF, SH, KM and DO) in the<br />
three sites A, B and C in both topographical locations. This experiment was conducted in two<br />
stages, first with the two graminoid species (2003-2005), and second with the two shrub<br />
species (2004-2006). To allow for comparison between the two stages, a “standard” litter<br />
(SL), removed from a sweden grassland and used for a similar purpose in a global European<br />
survey (Quétier et al. 2007) was monitored in parallel (192 additional litter-bags). The first<br />
stage, concerning graminoid decomposition, was set up on 10/10/03 (KM/CF + SLI) and the<br />
second stage concerning shrub decomposition on 24/09/04 (DO/SH + SLII). The first harvest<br />
took place on 24/09/04 for KM, CF and SLI, the second on 10/10/05 for KM, CF, DO, SH<br />
and SLI/II, and the third on 02/10/06 for DO, SH and SLII. Litter remaining was carefully<br />
sorted then weighed after drying at 60°C during 48H.<br />
Experiment II<br />
Similarly to experiment I, we harvested at the end of september 2005 the litter from CF, SH,<br />
KM, and DO. We added a fifth species, Alopecurus gerardi (gramineae, AG) present in late<br />
snowmelt locations. This subtrate was harvested still green, because it senesced later under<br />
the snow. The same procedure in experiment I was conducted for the litter bag construction<br />
and filling. The seasonal litter experiment was set up on 10/10/05. Litterbags filled with<br />
substrates from the late snowmelt (CF, SH, AG) and from the early snowmelt locations (KM<br />
and DO) were respectively deployed in each topographical location for a total of 225 litterbags.<br />
The design was therefore not orthogonal with respect to topographical effect. Three<br />
harvests were performed, at the end of the first winter just after snowmelt, at the end of the<br />
139
Chapitre II Article 2A<br />
growing season, and after the second winter. In early snowmelt locations, the first harvest<br />
(here after reported as “Winter I”) took place on the 03/05/06 in all sites. In the late snowmelt<br />
locations, harvests were carried out on the 20/06/06 in site A, on the 14/06/06 in site B, and<br />
on the 19/06/06 in site C. The second harvest (“summer”) took place on the 02/10/06 and the<br />
final harvest (“Winter II”) was performed after a second wintertime period on the 18/05/07 in<br />
early snowmelt locations, and on 14/06/07 and 25/06/07 respectively in sites C, A and B.<br />
Treatment of litter-bags followed the same protocol as in Experiment I.<br />
For each experiment I and II, we analysed three sub-samples of each substrate for<br />
initial C and N litter content using an elemental analyser (CHS NA1500, Carbo Erba<br />
Instrument, Milan, Italy) and for lignin content using the H2SO4 digestion method. .<br />
To estimate litter decomposition, we calculate mass loss (%) over the different periods as<br />
follows:<br />
Mass loss<br />
∆t<br />
= ( masst<br />
− mass(<br />
t−1)<br />
) * 100<br />
Statistical procedures<br />
For experiment I, we used Linear Mixed Models (Pinheiro and Bates 2000) to assess<br />
effects of topography and species on mass loss. In a split-plot design, sites were considered as<br />
random factors, whereas harvest times, topographical location, species and their interactions<br />
were fixed factors. We also applied similar models within each harvest, to facilitate the<br />
interpretation of results. In the latter case, to estimate the variance explained by each effect<br />
compared to the total variance of the response variable, we followed Xu (2003). Partial<br />
coefficients of determination R 2 are given by:<br />
RSS<br />
= 1 ,<br />
RSS<br />
2<br />
R −<br />
0<br />
where RSS and RSS0 are respectively the residual sums of squares for the model testing the<br />
specific effect and the global model. They therefore give an indication on the importance of<br />
the effect in addition to its significance. Goodness-of-fit of mixed models was assessed using<br />
residuals plotted at the different levels (sites/topographical location). Constant variance of<br />
residuals was assessed using Bartlett’s test.<br />
In addition, we determined the exponential decay constant, k, assuming a single exponential<br />
decay model following Hobbie (2000) and Hobbie and Gough (2004):<br />
Mass<br />
t<br />
= Mass<br />
t0<br />
⋅e<br />
−kt<br />
where Masst is the remaining mass at time t, Masst0; the initial mass (1 g), and k; the constant<br />
140
Chapitre II Article 2A<br />
decay (yr -1 ). Decay constants were determined for each species in each topographical location<br />
by fitting a linear-regression of the (LN-transformed) litter remaining against time. An<br />
ANCOVA was applied within topographical location to test the significance of the Mass<br />
remaining × Species interaction.<br />
Finally, an ANCOVA was applied to test the regression between (1) yearly mass loss of each<br />
substrate against mean wintertime soil temperature and (2) litter N content (proportion of<br />
initial N content) of each species against mass loss. Analysed data were the mean of each<br />
harvest, in each topographical location. Species were considered as the qualitative factor<br />
whereas mean wintertime soil temperature (1) or mass loss (2) were the continuous factors.<br />
In Experiment II, we estimated decomposition rate for each period, each species and for each<br />
topographical situation by applying the following formula :<br />
1<br />
T<br />
[ remaining mass − remaining mass ]<br />
Decomposition rate ( mg / d)<br />
= ⋅<br />
t<br />
t−1<br />
where T is the period between t-1 and t (in days). We did not estimate the exponential decay<br />
constant (as done in experiment I) as the aims of this experiment were to precise for each<br />
period the decomposition rate of each substrate rather than the mean decomposition rate over<br />
all the period of the experiment. We used a two-way analysis of variance (ANOVA) to<br />
compare period and site effects for each species separately and to test differences in litter N<br />
content for each species (proportion of initial N content) after the first winter, summer and<br />
second winter. Finally, a Student’s t-test was used to assess the initial value (=1) litter N<br />
content (in proportion to initial) and that after winter I, summer and winter II. Statistical<br />
analyses were performed using R software (R Development Core Team 2006).<br />
Characteristics<br />
Winter duration (d)<br />
Mean winter soil temperature (°C)<br />
Mean summer soil temperature (°C)<br />
Gravimetric summer soil moisture (gH2O g -1 soil)<br />
Productivity (g m -2 d -1 )<br />
Total biomass (g m -2 )<br />
Late snowmelt<br />
location<br />
240 (12)<br />
-0.15 (0.01)<br />
7.7 (1.55)<br />
0.35 (0.03)<br />
7.23 (0.45)<br />
325.67 (22.04)<br />
Early snowmelt<br />
location<br />
206 (15)<br />
-3.05 (0.45)<br />
7.6 (1.62)<br />
0.42 (0.03)<br />
2.18 (0.14)<br />
185.90 (11.72)<br />
Table 1 Winter duration, soil temperature records and soil moisture are an average of three years records from<br />
the three sites A, B and C within each topographical location (from the end of 2003 to the end of 2006). Values<br />
are the estimated parameter ± standard error except for winter duration where it is standard deviation.<br />
141
1<br />
2<br />
3<br />
4<br />
5<br />
6<br />
Species Location<br />
Growth<br />
form<br />
SLA (cm 2 /gr)<br />
LDMC<br />
(%)<br />
C/N<br />
Lignin<br />
content (%)<br />
Experiment I Experiment II<br />
C/N litter % N % C C/N litter % N % C<br />
CF Late snowmelt Graminoid 194.5 (7.2) 26.1 (0.6) 11.2 (0.5) 6.1 (0.3) 20.6 (0.3) 2.32 (0.04) 47.1 (0.1) 37.7 (2.1) 1.22 (0.07) 45.1 (0.5)<br />
KM Early snowmelt Graminoid 123.7 (2.27) 32.2 (0.5) 19.2 (0.7) 7.4 (0.5) 85.6 (5.2) 0.57 (0.03) 48.0 (0.1) 82.5 (5.5) 0.58 (0.05) 47.2 (0.5)<br />
AG Late snowmelt Graminoid 191.1 (3.7) 24.5 (0.4) 13.1 (0.6) 3.8 (0.3) - - - 25.6 (0.9) 1.76 (0.09) 44.6 (1.0)<br />
SH Late snowmelt Shrub 198.4 (6.1) 31.8 (2.8) 14.7 (0.7) 33.5 (0.8) 23.0 (0.7) 2.20 (0.07) 50.6 (0.3) 21.7 (0.6) 2.27 (0.06) 48.9 (0.8)<br />
DO Early snowmelt Shrub 115.9 (4.9) 38.7 (1.7) 20.3 (0.7) 36.1 (0.2) 50.2 (0.7) 1.02 (0.01) 51.0 (1.0) 35.6 (2.4) 1.43 (0.08) 50.4 (0.3)<br />
Standard - Graminoid - - -<br />
37.3 (1.9) 1.26 (0.06) 46.2 (0.3) - - -<br />
Table 2 Habitat, growth form, and functional traits of green leaves (SLA, LDMC and C/N) and litter (C/N, lignin content) of C. foetida, K. myosuroides, A. gerardi, S.<br />
herbacea, D. octopetala and standard litter. In case of C/N litter characteristics, n=3, in the case of green leaf traits, n=10. Values are the estimated parameter (standard error).<br />
142
Chapitre II Article 2A<br />
Results<br />
Standing biomass in late snowmelt communities was twice as large as in early snowmelt<br />
communities (Table 1). Late snowmelt communities produced more aboveground biomass in<br />
a shorter period, which explains the four-fold difference in productivity between early and<br />
late snowmelt locationss when expressed on a daily basis (Table 1). Species had contrasting<br />
leaf traits as well as litter chemistry (Table 2). Green tissue from late snowmelt locations<br />
species (CF, AG and SH) characteristically had high Specific Leaf Area (SLA), low Leaf Dry<br />
Matter Content (LDMC), low green leaf C/N, and litter C/N because of higher %N. Species<br />
from early snowmelt locations (KM and DO) had the inverse suite of leaf traits attributes. In<br />
contrast, lignin content correlate with growth form : shrubs exhibit logically higher lignin<br />
content than graminoids.<br />
Annual litter mass loss: Experiment I<br />
The slope of the relationship between the remaining biomass of SLII and SLI was not<br />
significantly different from one (slope = 0.85±0.09, confidence intervals =[0.65,1.04]),<br />
whereas the intercept was different from zero (intercept = 10.98±4.75, t1,11 = 2.31, P=0.04)<br />
(Fig. 1). This indicates that decomposition was higher during the 2004-2006 than during<br />
2003-2005. However, after constraining the slope to a value of 1, the intercept was greatly<br />
reduced (intercept: 2.65±0.92, t1,11=2.87 P=0.01) and ranged from 0.62 to 4.67 % of mass<br />
loss. Compared to the magnitude of the differences observed between graminoids and shrubs<br />
(Fig. 2), this effect was negligible and hence was ignored in later analysis. Mass loss from<br />
graminoids and shrubs was therefore analysed within the same model.<br />
143
Chapitre II Article 2A<br />
There were large species specific differences in total litter mass loss, whereas the effect of<br />
topography was only marginally significant (Table 3, Fig. 2A and APPENDIX 1 for raw data<br />
within each site and each topographical location). The species × year interaction was highly<br />
significant, showing that patterns of mass loss over time depend on species composition.<br />
When analysed within the year, the species effect remained highly significant and explained<br />
82 % of the model variability (Table 3). Graminoids exhibited the greatest mass loss (Fig. 2B,<br />
Table 4). SH and DO experienced almost two-fold-less mass loss than the graminoids (Fig.<br />
2B). Consistent with the whole-model statistical analysis, the decay constant indicated more<br />
rapid decomposition of graminoids compared to shrubs at both early- and late snowmelt<br />
locations (Table 4).<br />
Source F, df P Partial R 2<br />
Whole model<br />
Years<br />
Species<br />
Topography<br />
Years × Species<br />
Years × Topography<br />
Species × Topography<br />
Whole model – year I<br />
Species<br />
Topography<br />
Species × Topography<br />
Whole model – year II<br />
Species<br />
Topography<br />
Species × Topography<br />
767.98(1,358)<br />
615.63(3,358)<br />
8.80(1,2)<br />
7.16(3,358)<br />
0.00(1,358)<br />
2.15(3,358)<br />
290.99(3,175)<br />
17.71(1,2)<br />
2.58(3,175)<br />
432.1(3,176)<br />
5.02(1,2)<br />
2.00(3,176)<br />
Fig. 1 Mass loss of standard litter set up in<br />
2003 against mass loss of standard litter<br />
set up in 2004 (Experiment I). Each point<br />
corresponds to the mean of 8 replicates ±<br />
se from one site and one year. Short dash<br />
line: linear regression to data, dotted line:<br />
linear regression when slope is forced to<br />
one, solid line 1:1 slope.<br />
Chapitre II Article 2A<br />
The estimated uncertainty of the overall effect of topography was large (Table 3). However,<br />
the effect size (as measured by the differences between mass loss in the late snowmelt<br />
locations and mass loss in early snowmelt locations for each site and each year) always<br />
produced the same trend, as illustrated on Fig. 2C (see also Appendix 1). The probability that<br />
no negative value is obtained with 12 replicates, as shown on Fig. 3, is equal to 0.0002<br />
(binomial test), providing strong evidence for an effect of topography. Thus, we can conclude<br />
that litter degradation was significantly higher in late snowmelt compared to early snowmelt<br />
locations.<br />
As no summertime soil temperature and soil moisture differences could be detected between<br />
the late snowmelt and the early snowmelt locations (Table 1), we focused on wintertime<br />
conditions to explain topographical effect. The inconsistent snow cover in early snowmelt<br />
locations lead to low soil temperatures associated with large temperature fluctuations (Table<br />
1). Regression of mass loss of each species after one year in each topographical situation<br />
against the respective mean wintertime soil temperatures (Fig. 4), showed a clear effect of<br />
both wintertime soil temperature (F1,16=76.86, P
Chapitre II Article 2A<br />
Fig. 2 Mean and 95% confidence intervals of litter mass loss after the first and second year of<br />
decomposition (a) in late snowmelt and early snowmelt locations (all species), (b) for each<br />
species (both topographical locations) and (c) for each species in each topographical location<br />
(Experiment I).<br />
Seasonal litter mass loss: Experiment II<br />
Similarly to Experiment I, there was large and significant effects of species on seasonal mass<br />
loss and decomposition rate (Fig. 5). After 1.5 year, the three graminoid species (CF, AG,<br />
KM) lost respectively 45.8%, 72.5%, and 49.3%, whereas DO lost 20.60% and SH 23.4% of<br />
their initial litter mass. Proportion of mass loss in winter I in comparison to total litter mass<br />
loss was high, ranging from 46.2% for SH to 80.7% for AG. In contrast, it ranged from 10 to<br />
40% during summer and 7 to 27 % during Winter II. Only the decomposition of SH followed<br />
a different pattern, with similar mass loss observed during Winter I and the summer.<br />
The estimates of decomposition rate were higher during the first winter for most species,<br />
except SH (Fig. 5, Table 5). During Winter II, decomposition rates were in general lower than<br />
summer and Winter I rates. The periods × sites interaction was significant for all species. This<br />
was related to variable patterns of decomposition among sites between summer and winter II.<br />
However, the higher decomposition rates recorded during winter I compared to others seasons<br />
was consistent throughout the sites.<br />
Finally, the large variation in wintertime decomposition rate between species highlighted the<br />
importance of species and litter quality on decomposition, toward lower decomposition rate in<br />
the case of shrubs compared to graminoids, as in Experiment I.<br />
146
Chapitre II Article 2A<br />
Fig. 3 Mass loss difference (%): late snowmelt<br />
locations minus early snowmelt locations mass loss<br />
for each species, each site (A, B and C) for (a) year I<br />
and (b) year II (experiment I). See text for statistical<br />
analysis.<br />
Litter nitrogen dynamics<br />
Litter exhibited very little net N release after two years of decomposition (Fig. 6). Within each<br />
species, there were no consistent differences in the patterns of N immobilization between both<br />
topographic locations. Significant regression between N immobilization and mass loss<br />
suggests that topography controls the timing rather than the pattern of N release (mass loss<br />
effect: F1,40=294.50, P
Chapitre II Article 2A<br />
Species<br />
Late snowmelt location Early snowmelt location<br />
Decay<br />
constant<br />
(k, yr -1 ) F,df r 2 P<br />
Decay<br />
constant<br />
(k, yr -1 ) F,df r 2 P<br />
C. foetida 0.56 (0.01) 14621,47 0.97
Chapitre II Article 2A<br />
Discussion<br />
In this study, we showed that wintertime soil temperature and litter quality are the two<br />
key drivers of dominant-species litter decomposition in early and late snowmelt locations of<br />
alpine tundra. Only a few studies have addressed the relative importance of species vs.<br />
climatic effects on decomposition in alpine or arctic tundra. Hobbie (1996) compared the<br />
effects of increased temperature and litter from different Alaskan tundra on carbon and<br />
nitrogen mineralization in microcosms. They also tried to disentangle the influence of plant<br />
community composition from that of the soil environment at a moist acidic and a moist nonacidic<br />
site (Hobbie and Gough 2004). In alpine environments, Bryant et al. (1998) considered<br />
that the variation in decomposition rates along a snowmelt gradient was a function of<br />
temperature and moisture, however snow was not assessed as a potential determinant of litter<br />
decomposition. O’Lear and Seastedt (1994) reported higher decomposition of Acomastylis<br />
rossi in a late snowmelt compared to an early snowmelt locations, but this study addressed<br />
only decomposition of one species. Thus, despite numerous studies in snow-covered<br />
ecosystem highlighting the major role played by snow in nutrient cycling (Campbell et al.<br />
2005), ours is to our knowledge the first study which hierarchies the snow-induced change<br />
effects on litter decomposition.<br />
Fig. 4 Regression of mass loss against<br />
corresponding wintertime soil<br />
temperature for each species<br />
(experiment I). Each point corresponds<br />
to first year mass loss in each<br />
topographical location. White : late<br />
snomelt locations and black : early<br />
snowmelt locations. See text for<br />
statistical analysis.<br />
Seasonal controls on litter decomposition<br />
Our experiment indicated that, on average, 50 to 80% of the two-year mass losses<br />
occurred during the winter subsequent to the litter fall. Similarly, previous studies have<br />
reported that significant litter mass loss occurred during winter (Bleak 1970, O'Lear and<br />
149
Chapitre II Article 2A<br />
Seastedt 1994, Hobbie and Chapin 1996, Uchida et al. 2005). Moreover, recent studies have<br />
demonstrated that soil respiration persists under the snowpack (Brooks et al. 1997, Oechel et<br />
al. 1997, Fahnestock et al. 1999, Zimov et al. 1999, Welker et al. 2000), suggesting that coldadapted<br />
microorganisms may be able to survive even at sub-zero soil temperature (Brooks et<br />
al. 2004). Nevertheless, we can not exclude the possibility that physical processes, such as<br />
fragmentation, may affect mass loss (Hobbie and Chapin 1996). However, the freeze thaw<br />
cycles which can contribute to litter fragmentation are less frequent in late snowmelt<br />
locations, so one should reasonably expect a lower litter mass loss in these areas, which is in<br />
contradiction to what is observed. Thus, we conclude that biological origin largely<br />
predominates over physical fragmentation to explain higher mass loss during winter.<br />
High wintertime decomposition rates compared to summertime rates suggest that<br />
specific microbial activity in the surface organic horizon may be at least as important in<br />
winter as in summer. This suggestion is supported by evidence that a high level of microbial<br />
biomass was also detected during winter in the top soil layer (Baptist, unpublished results), as<br />
reported elsewhere by others (Lipson et al. 1999, Schadt et al. 2003, Lipson and Schmidt<br />
2004). Total CO2 efflux, which is lower during winter, would mainly be the result of fresh<br />
litter decomposition, instead of total soil organic matter mineralization. This assumption<br />
differs from studies (Clein and Schimel 1995, Hobbie et al. 2000), proposing that much of the<br />
wintertime decomposition activity may occur deeper in the soil profile in warmer horizons.<br />
But it is supported by Loya et al. (2004), who indicate that C compounds from fresh litter<br />
inputs can contribute strongly to winter C respiration in soil, and by Uchida et al. (2005), who<br />
show that microorganisms in the litter layer can play an important role in the carbon cycle<br />
during the winter. These results illustrate that the growth of wintertime microbial populations<br />
may be supported by the large input of litter at the end of the growing season. Thus, seasonal<br />
variations in decomposition rate would seem to be closely related to C compound availability<br />
during the first stage of decomposition. Brooks et al. (2004) drew similar conclusions as they<br />
showed that CO2 fluxes from snow-covered soil at soil temperatures between 0 and -3°C were<br />
carbon-limited.<br />
Seasonal decomposition of SH exhibited very different patterns from the other species.<br />
These results may be explained by the high concentration of polyphenols observed generally<br />
in Salix sp. leaves (Nyman and Julkunen Tiitto 2005). Indeed, the enzymatic degradation of<br />
these recalcitrant compounds is hindered by very high activation energy and low temperatures<br />
150
Chapitre II Article 2A<br />
may restrict their catabolisation (Bosatta and Agren 1999). Warmer conditions during summer<br />
would favour their degradation.<br />
Fig. 5 Decomposition rates by species for each period (mg/d) (experiment II). Circle graphs depict<br />
mass loss (in % of total mass loss from fall 2005 to spring 2007) and correspond to each period within<br />
species. See Table 5 and text for statistical analysis. Values are the mean ± se.<br />
Topographical controls on decomposition<br />
All the species studied here experienced lower decomposition in early snowmelt<br />
compared to late snowmelt locations. During summer, soil temperature and soil moisture were<br />
similar in late snowmelt and early snowmelt locations, which is contrary to previous studies<br />
considering topographical gradients (O'Lear and Seastedt 1994, Bryant et al. 1998, Fisk et al.<br />
151
Chapitre II Article 2A<br />
1998). Thus, summertime conditions can not explain the effect of topography on yearly mass<br />
loss. In contrast, the positive relationship between mass loss and mean wintertime soil<br />
temperature shows clearly that the topographical effect is related to soil temperature and<br />
therefore to snow depth during winter. In late snowmelt locations, deep snow cover, which<br />
acts as an insulating layer, maintains soil temperature at 0° C, whereas the shallow and<br />
variable snow cover on early snowmelt locations leads to very low soil temperatures during<br />
winter and tends to limit microbial activity. Snow cover, through soil temperature, may<br />
therefore impact decomposition in a significant way. Results from Experiment II support this<br />
assumption as they showed that decomposition mainly occurs during winter. Thus, our<br />
experiment suggests that deeper snow is creating an abiotic environment which is more<br />
favourable for litter decomposition in late snowmelt compared to early snowmelt locations.<br />
Nevertheless, besides a significant effect of topography, the main determinant of litter<br />
decomposition remained species composition (Experiment I). Strong interspecific variability<br />
in wintertime decomposition rate suggests that the nature of available substrates exerts an<br />
important control over microbial activity (Experiment II). Nadelhoffer et al. (1991) reported<br />
similar results in arctic ecosystems, as they showed that C mineralization was more strongly<br />
related to organic matter quality than to temperature.<br />
Source F, df P<br />
C. foetida<br />
Periods<br />
Sites<br />
Periods × Sites<br />
K. myosuroides<br />
Periods<br />
Sites<br />
Periods × Sites<br />
A. gerardi<br />
Periods<br />
Sites<br />
Periods × Sites<br />
S. herbacea<br />
Periods<br />
Sites<br />
Periods × Sites<br />
D. octopetala<br />
Periods<br />
Sites<br />
Periods × Sites<br />
39.63 (2, 36)<br />
0.95 (2, 36)<br />
10.92 (4, 36)<br />
11.18 (2, 36)<br />
0.59 (2, 36)<br />
3.55 (4, 36)<br />
154.38 (2, 36)<br />
1.42 (2, 36)<br />
6.18 (4, 36)<br />
13.71 (2, 36)<br />
5.33 (2, 36)<br />
4.83 (4, 36)<br />
18.27 (2, 36)<br />
0.42 (2, 36)<br />
4.92 (4, 36)<br />
Chapitre II Article 2A<br />
However, the reciprocal transplant litter experiment underlined that, despite distinct<br />
functional trait syndromes along the snowmelt gradient (Choler 2005, Baptist and Choler<br />
2008), species effect was firstly structured by lignin content –growth form - rather than leaf<br />
nitrogen content associated to nutrient acquisition strategy (see Table 1). Interspecific<br />
variations in litter decomposition largely mirrored growth form diversity in alpine tundra,<br />
underlying the importance of lignin in decomposition process. These results are in agreement<br />
with previous studies, which showed that shrubs were characterized by a lower decomposition<br />
rate compared to sedge species in arctic and sub-arctic systems (e.g. Hobbie 1996,<br />
Cornelissen et al. 2007).<br />
Fig. 6 Litter N content (proportion of<br />
initial N) by species in relation to mass<br />
loss (Experiment I). Symbols are the<br />
mean ± se at each period and each site.<br />
See text for statistical analysis.<br />
Implications for N cycling<br />
After two years of decomposition, litter still exhibited N immobilization. We would<br />
expect a subsequent period of net N release (mainly N mineralization) (Melillo et al. 1989),<br />
however the two-year duration of this experiment was insufficient time to reach this stage. No<br />
significant effect of topography on N immobilization was detected. Patterns of N<br />
immobilization was primarily the result of faster decomposition. The inconsistent snowpack<br />
in early snowmelt locations may delay the final stage of N mineralization, limiting N<br />
availability in the ecosystem. However, this phenomenon may also contribute to limit N loss<br />
during snowmelt as a result of steep slopes between early and late snowmelt locations and<br />
thus promote N retention in the ecosystem, even in an organic form (Steltzer and Bowman<br />
2005). Litter quality affects N immobilization by delaying mass loss and so final N<br />
mineralization stage, but also by controlling the magnitude of N immobilization. KM<br />
153
Chapitre II Article 2A<br />
exhibited the highest immobilization in both experiments, which could be related to high<br />
initial C/N whereas CF weakly immobilized nitrogen. However, no significant relationship<br />
could be drawn between initial litter C/N and N immobilization after one year of<br />
decomposition. The different patterns of N immobilization depend on interspecific differences<br />
in nutrient concentration but also resorption and leaching from dead leaves. As a result, they<br />
are more likely to be idiosyncratic effects and, as such, difficult to predict.<br />
Fig. 7 Litter N content (proportion ofinitial N) by species for each period (Experiment II). Values<br />
are the mean ± se of each period for all sites. See Table 6 and text for statistical analysis.<br />
154
Chapitre II Article 2A<br />
Conclusion<br />
In a context of global change, our results suggest that a decreasing winter snowpack<br />
would reduce mass loss during winter and would enhance the potential for C sequestration<br />
(Monson et al. 2006). However, the results highlighted growth forms as the primary drivers of<br />
decomposition compared to topography. Thus, it is suggested that changes in litter quality, as<br />
a result of community-level shifts in growth form will have a stronger impact on litter<br />
decomposition in alpine tundra than the direct effect of insulating snowpack.<br />
Acknowledgements<br />
We are grateful to Céline Flahaut, Geneviève Girard, Cécile Bayle, Marie-Pascale<br />
Colace and Mathieu Chausson for their help in the field and in the laboratory. Logistical<br />
support was provided by the <strong>Station</strong> <strong>Alpine</strong> <strong>Joseph</strong> <strong>Fourier</strong>, the alpine field station of the<br />
University <strong>Joseph</strong> <strong>Fourier</strong>. The project was financed by a grant from the research and<br />
education ministery of France and from the University <strong>Joseph</strong> <strong>Fourier</strong> of Grenoble. We thank<br />
Matt Robson and Mason Campbell for their helpful comments on an earlier version of this<br />
manuscript.<br />
References<br />
Baptist, F., and P. Choler. 2008. A simulation on the importance of growing season length<br />
and canopy functional properties on the seasonal Gross Primary Production of<br />
temperate alpine meadows. Annals Of Botany doi:10.1093/aob/mcm318.<br />
Beniston, M. 2005. Mountain climates and climatic change: An overview of processes<br />
focusing on the European Alps. Pure and Applied Geophysics 162:1587-1606.<br />
Bleak, A. T. 1970. Disappearance of plant material under winter snow cover. Ecology 51:915-<br />
917.<br />
Bosatta, E., and G. I. Agren. 1999. Soil organic matter quality interpreted thermodynamically.<br />
Soil Biology & Biochemistry 31:1889-1891.<br />
Brooks, P. D., D. McKnight, and K. Elder. 2004. Carbon limitation of soil respiration under<br />
winter snowpacks: potential feedbacks between growing season and winter carbon<br />
fluxes. Global Change Biology 11:231-238.<br />
Brooks, P. D., S. K. Schmidt, and M. W. Williams. 1997. Winter production of CO2 and N2O<br />
from <strong>Alpine</strong> tundra: Environmental controls and relationship to inter-system C and N<br />
155
Chapitre II Article 2A<br />
fluxes. Oecologia 110:403-413.<br />
Bryant, D. M., E. A. Holland, T. R. Seastedt, and M. D. Walker. 1998. Analysis of litter<br />
decomposition in an alpine tundra. Canadian Journal of Botany 76:1295-1304.<br />
Campbell, J. L., M. J. Mitchell, P. M. Groffman, L. M. Christenson, and J. P. Hardy. 2005.<br />
Winter in northeastern North America: a critical period for ecological processes.<br />
Frontiers In Ecology and the Environment 3:314-322.<br />
Chimner, R. A., and J. M. Welker. 2005. Ecosystem respiration responses to experimental<br />
manipulations of winter and summer precipitation in a Mixedgrass Prairie, WY, USA.<br />
Biogeochemistry 73:257-270.<br />
Choler, P. 2005. Consistent shifts in <strong>Alpine</strong> plant traits along a mesotopographical gradient.<br />
Arctic Antarctic And <strong>Alpine</strong> Research 37:444-453.<br />
Clein, J. S., and J. P. Schimel. 1995. Microbial activity of tundra and taiga soils at sub-zero<br />
temperatures. Soil Biology and Biochemistry 27:1231-1234.<br />
Cornelissen, J. H. C., N. Perez Harguindeguy, S. Diaz, J. P. Grime, B. Marzano, et al. 1999.<br />
Leaf structure and defence control litter decomposition rate across species and life<br />
forms in regional floras on two continents. New Phytologist 143:191-200.<br />
Cornelissen, J. H. C., P. M. van Bodegom, R. Aerts, T. V. Callaghan, R. S. P. van Logtestijn,<br />
et al. 2007. Global negative vegetation feedback to climate warming responses of leaf<br />
litter decomposition rates in cold biomes. Ecology Letters 10:619-627.<br />
Fahnestock, J. T., M. H. Jones, and J. M. Welker. 1999. Wintertime CO2 efflux from arctic<br />
soils: Implications for annual carbon budgets. Global Biogeochemical Cycles 13:775-<br />
779.<br />
Fisk, M. C., S. K. Schmidt, and T. R. Seastedt. 1998. Topographic patterns of above- and<br />
belowground production and nitrogen cycling in <strong>Alpine</strong> tundra. Ecology 79:2253-<br />
2266.<br />
Groffman, P. M., C. T. Driscoll, T. J. Fahey, J. P. Hardy, R. D. Fitzhugh, et al. 2001. Effects<br />
of mild winter freezing on soil nitrogen and carbon dynamics in a northern hardwood<br />
forest. Biogeochemistry 56:191-213.<br />
Hobbie, S. E. 1996. Temperature and plant species control over litter decomposition in<br />
Alaskan tundra. Ecological Monographs 66:269-279.<br />
Hobbie, S. E. 2000. Interactions between litter lignin and soil nitrogen availability during leaf<br />
litter decomposition in a Hawaiian Montane forest. Ecosystems 3:484-494.<br />
Hobbie, S. E., and F. S. Chapin. 1996. Winter regulation of tundra litter carbon and nitrogen<br />
dynamics. Biogeochemistry 35:327-338.<br />
156
Chapitre II Article 2A<br />
Hobbie, S. E., and L. Gough. 2004. Litter decomposition in moist acidic and non-acidic<br />
tundra with different glacial histories. Oecologia 140:113-124.<br />
Hobbie, S. E., J. P. Schimel, S. E. Trumbore, and J. R. Randerson. 2000. Controls over carbon<br />
storage and turnover in high-latitude soils. Global Change Biology 6 Suppl. 1:196-<br />
210.<br />
Kazakou, E., D. Vile, B. Shipley, C. Gallet, and E. Garnier. 2006. Co-variations in litter<br />
decomposition, leaf traits and plant growth in species from a Mediterranean old-field<br />
succession. Functional Ecology 20:21-30.<br />
Kudo, G. 1996. Intraspecific variation of leaf traits in several deciduous species in relation to<br />
lenght of growing season. Ecoscience 3:483-489.<br />
Lipson, D. A., and S. K. Schmidt. 2004. Seasonal changes in an alpine soil bacterial<br />
community in the Colorado Rocky Mountains. Applied And Environmental<br />
Microbiology 70:2867-2879.<br />
Lipson, D. A., S. K. Schmidt, and R. K. Monson. 1999. Links between microbial population<br />
dynamics and nitrogen availability in an alpine ecosystem. Ecology 80:1623-1631.<br />
Loya, W. M., L. C. Johnson, and K. J. Nadelhoffer. 2004. Seasonal dynamics of leaf- and<br />
root-derived C in arctic tundra mesocosms. Soil Biology and Biochemistry 36:655-<br />
666.<br />
Melillo, J. M., J. D. Aber, A. E. Linkins, A. Ricca, B. Fry, et al. 1989. Carbon and nitrogen<br />
dynamics along the decay continuum: Plant litter to soil organic matter. Plant And Soil<br />
115:189-198.<br />
Monson, R. K., D. L. Lipson, S. P. Burns, A. A. Turnipseed, A. C. Delany, et al. 2006. Winter<br />
forest soil respiration controlled by climate and microbial community composition.<br />
Nature 439:711-714.<br />
Nadelhoffer, K. J., A. E. Giblin, G. R. Shaver, and J. A. Laundre. 1991. Effects of<br />
temperature and substrate quality on element mineralization in six arctic soils.<br />
Ecology 72:75-86.<br />
Nyman, T., and R. Julkunen Tiitto. 2005. Chemical variation within and among six northern<br />
willow species. Phytochemistry 66:2836-2843.<br />
O'Lear, H. A., and T. R. Seastedt. 1994. Landscape patterns of litter decomposition in alpine<br />
tundra. Oecologia 99:95-101.<br />
Oechel, W. C., G. Vourlitis, and S. J. Hastings. 1997. Cold season CO2 emission from arctic<br />
soils. Global Biogeochemical Cycles 11:163-172.<br />
Pinheiro, J. C., and D. M. Bates. 2000. Mixed-Effects Models in S and S-Plus. Springer.<br />
157
Chapitre II Article 2A<br />
Quétier, F., A. Thebault, and S. Lavorel. 2007. Plant traits in a state and transition framework<br />
as markers of ecosystem response to land-use change. Ecological monograph 77:33-<br />
52.<br />
R Development Core Team. 2006. R: A language and environment for statistical computing.<br />
in R. F. f. S. Computing, editor., Vienna, Austria.<br />
Robinson, C. H. 2002. Controls on decomposition and soil nitrogen availability at high<br />
latitudes. Plant And Soil 242:65-81.<br />
Rustad, L. E. 2006. From transient to steady-state response of ecosystems to atmospheric<br />
CO2-enrichment and global climate change: Conceptual challenges and need for an<br />
integrated approach. Plant Ecology 182:43-62.<br />
Schadt, C. W., A. P. Martin, D. A. Lipson, and S. K. Schmidt. 2003. Seasonal dynamics of<br />
previously unknown fungal lineages in tundra soils. Science 301:1359-1361.<br />
Serreze, M. C., J. E. Walsh, F. S. Chapin, T. Osterkamp, M. Dyurgerov, et al. 2000.<br />
Observational evidence of recent change in the northern high-latitude environment.<br />
Climatic Change 46:159-207.<br />
Steltzer, H., and W. D. Bowman. 2005. Litter N retention over winter for a low and a high<br />
phenolic species in the alpine tundra. Plant And Soil 275:361-370.<br />
Uchida, M., W. Mo, T. Nakatsubo, Y. Tsuchiya, T. Horikoshi, et al. 2005. Microbial activity<br />
and litter decomposition under snow cover in a cool-temperate broad-leaved<br />
deciduous forest. Agricultural And Forest Meteorology 134:102-109.<br />
Walker, D. A., J. C. Halfpenny, M. D. Walker, and C. A. Wessman. 1993. Long-term studies<br />
of snow-vegetation interactions. Bioscience 43:471-480.<br />
Walker, M. D., D. A. Walker, J. M. Welker, A. M. Arft, T. Bardsley, et al. 1999. Long-term<br />
experimental manipulation of winter snow regime and summer temperature in arctic<br />
and alpine tundra. Hydrological Processes 13:2315-2330.<br />
Welker, J. M., J. T. Fahnestock, and M. H. Jones. 2000. Annual CO2 flux in dry and moist<br />
arctic tundra: Field responses to increases in summer temperatures and winter snow<br />
depth. Climatic Change 44:139-150.<br />
Xu, R. H. 2003. Measuring explained variation in linear mixed effects models. Statistics In<br />
Medicine 22:3527-3541.<br />
Zimov, S. A., S. P. Davidov, G. M. Zimova, A. I. Davidova, F. S. Chapin, et al. 1999.<br />
Contribution of disturbance to increasing seasonal amplitude of atmospheric CO2.<br />
Science 284:1973-1976.<br />
158
Chapitre II Article 2A<br />
Appendix 1<br />
Appendix 1 Mass loss of each substrate, in each site for early (black) and late (white) snowmelt<br />
locations after one (left) and two (right) years of decomposition (Experiment I).<br />
159
Chapitre II Article 2A<br />
160
Article 2B<br />
Soil respiration in alpine tundra: impacts of<br />
seasonal snow cover and soil carbon content<br />
Baptist, F., Flahaut, C. and Ph. Choler<br />
In prep. for Global Change Biology<br />
Mesure de respiration des sols dans les systèmes thermiques (site B) le 29/05/06.<br />
En premier plan, les thermocouples connectés à l’enregistreur de température.<br />
Photo : C. Flahaut.<br />
161
162
Chapitre II Article 2B<br />
Abstract<br />
Topographical variations and its associated changes in snow cover duration have long<br />
been recognized as the primary source of ecosystem structure and functioning in alpine<br />
landscapes. Yet, our understanding of the factors controlling soil heterotrophic respiration<br />
along snow cover gradients remains incomplete. Here, we examined the temperature<br />
sensitivity of alpine soils from early and late snowmelt locations. We conducted laboratory<br />
experiments on soil cores to disentangle the relative effect of temperature, soil water content<br />
and soil carbon content on heterotrophic respiration. Two set of soil cores, collected in<br />
summer and just before snowfall, were submitted to a high (2 - 30 °C) and a low (-8 - 0 °C)<br />
temperature range, respectively. A four parameter model explained 90 %, and 80 %, of the<br />
variance for the high and the low temperature range, respectively. A noticeable finding was a<br />
significant inverse relationship between soil carbon content and basal respiration. The model<br />
was adequate in predicting field effluxes measured on a weekly basis during the summer<br />
season. We built on these results to simulate summertime and wintertime CO2 production<br />
rates using a 6-years long soil temperature time-series. Despite a much shortened growing<br />
season length, summer respiration of late snowmelt locations was 50% above that of soils<br />
from early snowmelt locations. This was due to a higher basal respiration rate which over<br />
compensated the negative impact of delayed snowmelt. During wintertime, the insulated<br />
effect of snowpack along with higher basal respiration explained increased soil CO2<br />
production rate in late snowmelt locations. The linkage between soil carbon content and<br />
substrate quality, and the interplay between carbon quality and soil climate on heterotrophic<br />
respiration in alpine tundra are discussed. We emphasized the need to care for topographical<br />
variations in any attempt to model soil CO2 fluxes in cold, snow-covered ecosystems.<br />
Keywords : alpine ecosystems, heterotrophic respiration, snowmelt gradient, soil organic<br />
matter, soil climatology<br />
163
Chapitre II Article 2B<br />
Introduction<br />
In the next decades, snow-covered ecosystems may experience severe and rapid<br />
changes in response to global warming and variations in snowfalls (IPCC 2001). For example,<br />
high-elevation ecosystems from temperate European Mountains may be specifically exposed<br />
to lower snow deposition because of increasing temperature (Diaz and Bradley 1997,<br />
Beniston 2005, Noguès-Bravo et al. 2007). Soils of arctic and alpine ecosystem sequester<br />
large amount of organic carbon, and the impact of climate forcing on these carbon stocks is a<br />
main issue in global carbon cycle studies (Hobbie et al. 2000). However, there are still large<br />
uncertainties in predicting the impact of global change on the dynamics of this carbon stock<br />
(Grogan and Jonasson 2005, Knorr et al. 2005). A main reason is that our knowledge of the<br />
relative importance of different drivers controlling soil heterotrophic respiration remains<br />
incomplete for seasonally snow-covered ecosystems.<br />
In arctic and alpine landscapes, changes in topography over short distances (i.e. < 100<br />
m), also known as mesotopographical gradients (Billings 1973), are associated with dramatic<br />
changes in plant species composition (Chapin et al. 1995) and plant functional diversity<br />
(Kudo 1996, Choler 2005). Winter snow cover depth and snow cover duration are widely<br />
regarded as the main determinants of these mesoscale patterns (Isard 1986, Walker et al.<br />
1999). The length of the favourable period for plant growth, the number of days when soil<br />
temperature drops below 0 °C are among the direct consequences of the seasonal dynamics of<br />
snow cover. There have been a number of studies comparing ecosystem functioning in early<br />
and late snowmelt alpine tundra (e.g. Bowman et al. 1993, Fisk et al. 1998, Soudzilovskaia et<br />
al. 2005, Baptist and Choler 2008). But so far, the interplay between soil properties - among<br />
which soil carbon content - and soil climate on instantaneous CO2 effluxes and seasonal<br />
production of CO2 has never been investigated along a snow cover gradient in temperate<br />
alpine tundra.<br />
Heterotrophic respiration is the main component of ecosystem respiration in snowcovered<br />
ecosystem especially because the favourable period for plant root growth and activity<br />
is reduced (Elberling 2007). Temperature and soil moisture are the main soil climatic<br />
variables controlling CO2 effluxes (Reichstein et al. 2003). Several authors reported that<br />
instantaneous, seasonal and annual CO2 fluxes in arctic and alpine ecosystems were mainly<br />
controlled by temperature while soil moisture conditions had little impact (Kato et al. 2005,<br />
Kato et al. 2006, Elberling 2007), though opposite views exist (Illeris et al. 2004). The yearly<br />
time course of soil temperature is strongly determined by snow cover dynamics, and one may<br />
164
Chapitre II Article 2B<br />
expect an increased summer CO2 production rate in early snowmelt locations compared to<br />
late snowmelt locations.<br />
Other studies have put the emphasis on substrate quality (Grogan and Jonasson 2005,<br />
2006, Elberling 2007) and substrate availability (Brooks et al. 2004) in determining CO2<br />
effluxes. Basal respiration measured on the upper soil layer is used as a surrogate of either<br />
carbon availability when expressed per gram of soil (Fierer et al. 2007) or either carbon<br />
quality when expressed per gram of carbon (Mikan et al. 2002). A much higher soil carbon<br />
content in the upper soil layer of early snowmelt locations is a common feature in alpine<br />
tundra (Gensac 1990). However, the impact of these contrasting carbon stocks along the snow<br />
cover gradient on basal respiration rate remains unknown. It is assumed that slow-growing,<br />
stress-tolerant species from early snowmelt locations produce more recalcitrant litter (Choler<br />
2005, Baptist, unpublished results). A working hypothesis is that the negative impact of a<br />
lower organic matter quality in early snowmelt locations could counterbalance the positive<br />
effect of an extended growing season.<br />
In this study, we combined laboratory and field measurements to examine the<br />
sensitivity of heterotrophic respiration of alpine tundra soil to temperature, water and soil<br />
carbon content. In a first approach, we favoured laboratory measurements in order (1) to<br />
model the relative effect of the main factors controlling soil respiration (Davidson et al. 1998,<br />
Reichstein et al. 2005) and (2) to allow a more straightforward measurement of soil<br />
respiration per gram of soil or per gram of carbon.<br />
Because laboratory measurements of CO2 effluxes have sometimes been considered as poorly<br />
indicators of field processes (Schimel et al. 2006), we also performed field measurements to<br />
assess the adequacy of the respiration model derived form laboratory experiments. We<br />
focused on a comparison between soils from early and late snowmelt locations, i.e.<br />
corresponding to the two extremes of the mesotopographical gradient. The investigated<br />
ecosystems corresponded to the dominant temperate alpine tundra in the Alps. We addressed<br />
the following questions: (1) are there any difference in the temperature sensitivity of CO2<br />
effluxes between soil cores from early and late snowmelt locations ?; (2) what is the impact of<br />
soil carbon content and soil water content on the basal respiration ?; (3) Is a model based on<br />
laboratory experiments adequate to predict summertime field CO2 efflux measured in early<br />
and late snowmelt locations ?; and finally (4) how can we build on this knowledge to assess<br />
the relative impact of seasonal snow cover and soil carbon content on the summertime and<br />
wintertime CO2 production in early and late snowmelt locations ?<br />
165
Chapitre II Article 2B<br />
Materials and methods<br />
Study sites<br />
Our three research sites were located in the mountain ranges of Grand Galibier in<br />
South-Western Alps, France (45°7’N, 6°5’E). The bedrock was predominantly made of<br />
calcareous shales. The elevation of the three investigated sites were 2520 m (site A), 2550 m<br />
(site B), and 2550 m (site C). The lower elevation limit of alpine tundra is thought to occur<br />
around 2300 - 2400 m in the area (Ozenda 1985). The distance between two any sites<br />
exceeded 500 m. Each site corresponded to a mesotopographical gradient (sensu Billings<br />
1973), with alpine tundra from early and late snowmelt locations at a distance of about 30 to<br />
50 m apart. In early snowmelt locations, the vegetation cover was discontinuous and the two<br />
dominant species are a turf graminoid, Kobresia myosuroides (Cyperaceae) and a dwarf<br />
shrub, Dryas octopetala (Rosaceae). In late snowmelt locations, the vegetation cover was<br />
higher and the plant community was dominated by tiny species with a marked ability for<br />
clonal lateral spread. Carex foetida (Cyperaceae), Salix herbaceae (Salicaceae), Alopecurus<br />
gerardi (Poaceae) and Poa alpina (Poaceae) were the most common species of late snowmelt<br />
locations. Further details on the taxonomy and plant functional diversity along the<br />
investigated mesotopographical gradient are given in Choler (2005).<br />
Biogeochemical characterization of the soils<br />
Soils of early snowmelt locations were alpine rankers, those of the late snowmelt<br />
locations are stagnogley (Bounemoura et al. 1998). At the end of summer 2006, the upper 10<br />
cm of the soils were randomly sampled in early and late snowmelt locations with a coring<br />
tube (10 cm diameter) after litter removal. In early snowmelt locations, soil cores were<br />
collected between K. myosuroides tussocks. Soils were sieved at 2 mm for further<br />
biogeochemical analyses. Soil Organic Matter content (SOM) was determined by loss-onignition<br />
and the C mass was calculated by dividing SOM fraction by 1.72 (Schulte and<br />
Hopkins 1996). In order to determine bulk soil density, stone mass was determined and<br />
converted to stone volume using an average stone density of 2650 kg.m -3 (Hillel 1971). The<br />
distribution of grain size (granulometry) was obtained by sieving.<br />
Another set of sampling was designed to quantify the soil carbon stock in early and<br />
late snowmelt locations. We excavated a soil cylinder of approximately 5 cm of diameter with<br />
a hand auger. Soils of late snowmelt locations are unusually deep for a high-elevation<br />
ecosystem and we did not reach the bedrock with a 1 m depth soil column. On the contrary,<br />
soils of early snowmelt locations are shallower and the bedrock was located at around 50 to<br />
166
Chapitre II Article 2B<br />
70 cm depth. Soil carbon content was determined for each 20 cm layers. The total soil carbon<br />
on an area basis layer was estimated as in Rodeghiero & Cescatti (2005) on the entire profile.<br />
Soil climatology<br />
Continuous soil temperature recordings were performed at 5 cm belowground using<br />
Hobo probes (Onset computer corporation, Bourne, MA, USA). Hourly data were averaged to<br />
provide the daily means used in the seasonal simulations of CO2 effluxes. Soil temperature<br />
time series for three to five early and three to five late snowmelt locations (including sites A,<br />
B and C) were available from 2000 to 2005. Depending on the site, 10 to 15 % of the<br />
presented temperature data are gap filled data. Temperatures closed to 0°C (usually between –<br />
0.5 and 0.5°C) all the day long were indicative of a persistent snow cover. Based on soil<br />
temperature data, the year was divided in two periods. The summertime period was defined as<br />
from the day the mean soil temperature rose above 0°C to the day it kept around 0°C (snowcovered<br />
soil) or to the day it dropped below 0°C (frozen soils). The wintertime period<br />
corresponded to the snow-covered period for late snowmelt locations, but this did not hold for<br />
early snowmelt locations because these locations exhibited inconsistent snow cover during<br />
winter (see Fig. 1).<br />
Volumetric soil water content (m 3 m -3 ) at a depth of 10 cm was measured with the soil<br />
dielectric sensor ECH2O (Decagon Device, Inc. Pullman WA, USA). Data from four different<br />
probes per location were recorded at 20 min intervals during part of the summer seasons 2005<br />
and 2006, for a total of around 100 days per location and per year. Data were pooled to have a<br />
representative sample of soil moisture at each location.<br />
Laboratory measurements of soil respiration<br />
Our aim was to compare the temperature response of early and late snowmelt soil<br />
respiration to summertime and wintertime range of temperature. In the case of summertime<br />
soil cores, we measured temperature response of early and late snowmelt soil cores at three<br />
levels of soil water content. Water content was not manipulated in the case of wintertime soil<br />
cores. The summertime range of temperature was set between 2 °C and 30 °C and the<br />
wintertime range between -8 °C and 0 °C. To match field situation as close as possible, we<br />
did not apply these two differing temperature treatments to the same soil samples: the<br />
summertime temperature range was applied to soils sampled in July 2006 (hereafter referred<br />
as unfrozen soil cores), whereas the wintertime temperature range was applied to soils<br />
sampled just before the first snowfalls in October 2006 (hereafter referred as frozen soil<br />
167
Chapitre II Article 2B<br />
cores). Intact soil cores were excavated carefully from in PVC pipes (15 cm depth and 10 cm<br />
diameter) in the late and early snowmelt locations of site A. Seven soil cores were randomly<br />
sampled in each topographical location. The base of the cores was covered by perforated<br />
plastic to contain soil. To limit efflux disturbance due to excavation, the cores were<br />
maintained during two weeks in the nearby common garden of <strong>Station</strong> <strong>Alpine</strong> <strong>Joseph</strong> <strong>Fourier</strong><br />
at an altitude of 2100 m. Mean air temperature was locally 13.3 °C ± 3.4 in July 2006 and 5.7<br />
± 3.5 in October 2006. We assumed that this period was long enough for the roots to die, and<br />
that the measured respiration after two weeks was mainly due to heterotrophic respiration. We<br />
determined field capacity for soil cores as follows: an aliquote of soil in three out of seven soil<br />
cores was oversaturated with water, the excess water was allowed to drain for 2h and then<br />
weighed. Soil water content was assumed to be at field capacity and was determined after<br />
sieving at 2mm and oven drying at 105°C during 48h. Field capacity of soil cores<br />
corresponded to 59.6 g H2O / g soil and 57.8 g H2O / g soil in late and early snowmelt<br />
locations respectively (Table 1). During the experiment, soil water content was estimated<br />
gravimetrically by sampling small amount of soil in three out of seven soil cores in each<br />
snowmelt location. Wet treatment corresponded to 95.8 % (± 2.4) and 95.1 % (± 0.8) of field<br />
capacity respectively for late and early snowmelt soil cores. Similarly, moist treatment<br />
corresponded to 64.6 % (± 3.9) and 68.3 % (± 3.5) and dry one, 49.0 % (± 2.0) and 55.1 % (±<br />
1.9). We used bulk soil density of each core to convert gravimetric soil water content into<br />
volumetric soil water content. Wet treatment corresponded to 29.0 % (± 1.0) and 28.0 % (±<br />
1.0) for late and early snowmelt soil cores respectively. In moist treatment, it equalled 19.0 %<br />
(± 1.0) and 20.0 % (± 1.0), and in dry treatment 14.0 % (± 0.1) and 16.0 % (± 0.1). Finally,<br />
volumetric soil water content equalled 19.6 % (± 1.6) and 22.6 (± 0.7) for late and early<br />
snowmelt wintertime soil cores respectively.<br />
Before starting measurements, the cores were let at least 24 h in a cooled incubator<br />
(Fisher Bioblock Scientific, Illkirch, Fr) to let soil CO2 effluxes stabilize at a given<br />
temperature. Soil temperature was measured before each respiration record with<br />
thermocouples of 1mm diameter (Thermocoax SAS, Suresnes, Fr) inserted into soil at a depth<br />
of 5 cm. In the case of summertime soil cores, we started by measuring CO2 effluxes for the<br />
wet treatment and then let the soil cores dry until adequate soil water content level was<br />
reached. To measure CO2 effluxes, soil cores were enclosed in a respiration chamber<br />
connected to a closed system (EGM 4, PP Systems International Ltd., Hertfordshire, UK)<br />
staid outside the incubator. Data records lasted 4 to 6 min. Beyond this point, the respiration<br />
was decreasing because of an inversion of CO2 gradient between soil and atmosphere<br />
168
Chapitre II Article 2B<br />
chamber. Soil respiration was calculated on the basis of a linear increase of CO2 chamber<br />
concentration. At the end of the experiments soil were sieved at 2 mm and SOM fraction was<br />
estimated as described above.<br />
Field measurements of soil respiration<br />
In October 2005, we inserted at random three PVC pipes (10×12 cm) (hereafter<br />
collars) at about 10 cm in each topographical location (sites A, B and C). We made the<br />
assumption that CO2 efflux measured the following summer was only due to heterotrophic<br />
respiration. During summer 2006, we measured soil CO2 effluxes in each topographical<br />
location each week from snowmelt until the end of august with a closed system (EGM 4, PP<br />
Systems International Ltd., Hertfordshire, UK). The CO2 analyser was attached to a dark and<br />
closed respiration chamber which was placed on top of the pre-installed collars. Recording<br />
lasted from 4 to 6 min depending on signal fluctuation. Soil temperature was simultaneously<br />
measured next to each core with thermocouples inserted in the soil (Thermocoax SAS,<br />
Suresnes, Fr).<br />
We did not measured soil respiration immediately after rainfall events to avoid CO2<br />
effluxes due to CO2 displacement from soil pores (Rodeghiero and Cescatti 2005). Data from<br />
the beginning of the vegetation season have been omitted as soil anoxia impacted strongly<br />
CO2 signal and measurements.<br />
Soil respiration modelling<br />
We used non-linear regression models to describe the response of soil respiration (R)<br />
to temperature (T) in °C, volumetric soil water content (W) in m 3 m -3 and soil carbon content<br />
(C) in percentage of soil mass. Unless otherwise stated, respiration rate in this study are<br />
expressed in mg C g C -1 d -1 . The models were fitted separately to the respiration data from<br />
frozen and unfrozen soil cores obtained during laboratory temperature experiments. Model<br />
coefficients were determined for each soil core at a given soil water content level. The first<br />
model we used to fit the experimental data was the widely used Arrhenius-type first-order<br />
exponential equation:<br />
(model 1) R = α1 e (β1 T) ,<br />
where α1 is the exponential coefficient of basal respiration, i.e. the respiration rate at a<br />
temperature of 0 °C, and β1 is a temperature scalar.<br />
Empirical log-log linear relationships were found between α1 and the explanatory<br />
169
Chapitre II Article 2B<br />
variables W and C. Therefore, we modified structure of model 1 to account for the impacts of<br />
C and / or W on soil respiration:<br />
(model 2) R = α 2 W υ2 (β 2 T)<br />
e<br />
(model 3) R = α 3 C γ3 (β 3 T)<br />
e<br />
(model 4) R = α 4 W υ4 C γ4 (β 4 T)<br />
e<br />
where υi and γi are empirical coefficients determining the sensitivity of the basal respiration<br />
rate to W and C, respectively.<br />
We calculated the respiration coefficient Q10 which describes the sensitivity of<br />
respiration to a 10 °C change in temperature following the formula Q10 = e (10 βi) . For each<br />
model, we estimated the line that best describes the bivariate scatter between measured and<br />
predicted values using a model II regression. This line of best fit corresponds to the<br />
standardized major axis (SMA) (Warton et al. 2006). Model performance was estimated<br />
quantitatively by calculating the square of Pearson’s correlation coefficient (r 2 ), and<br />
qualitatively by calculating the root mean square error (RMSE) and the mean absolute error<br />
(MAE) (Willmott and Matsuura 2005). Tests of the difference between estimated and<br />
hypothesised elevation (or slope) were based on t-statistic. The null hypotheses were slope ≠ 1<br />
and intercept ≠ 0. These analyses were performed using the ‘smatr’ R package (Warton and<br />
Ormerod 2007).<br />
We estimated the sensitivity of summertime CO2 effluxes to C and T by varying C in a<br />
range from 5 to 15 % and by varying the summertime period length in a range from 120 to<br />
180 days. The chosen ranges encompassed the observed variations between early and late<br />
snowmelt locations. A daily mean temperature of 9 °C was chosen for these simulations<br />
because this temperature corresponded to the summertime mean temperature for both early<br />
and late snowmelt locations. Therefore, sensitivity to T should be understood as sensitivity to<br />
summertime cumulated degree days. These simulations were performed with model 4 using<br />
two constant levels of soil water content throughout the simulation period, i.e. 20% and 30%.<br />
A different approach was used for estimating the sensitivity of wintertime CO2<br />
effluxes to C and T. The main reason was that the daily mean temperature between early and<br />
late snowmelt locations strongly differed during winter (see fig. 1). Here we assumed that the<br />
key driver was the number of snow-covered days (i.e. days for which the mean soil<br />
temperature was around 0 °C). We simulated changes in wintertime respiration by varying the<br />
number of snow-covered days during winter. More than 160 days under a deep snowpack as<br />
observed in late snowmelt locations corresponded to a full wintertime period under the snow.<br />
170
Chapitre II Article 2B<br />
In this case, soil temperature of snow-covered days was set to 0 °C. By contrast, a full<br />
wintertime period without snow or under a shallow snow pack was typical of early snowmelt<br />
locations. In this case, soil temperature was randomly chosen from the distribution of<br />
wintertime daily mean soil temperature recorded in snow-free early snowmelt locations. For<br />
these simulations, we used model 3, i.e. assuming that the impact of soil water content was<br />
negligible during winter. We performed the simulations with the Q10 values of frozen and<br />
unfrozen soils. All computations and graphs were performed using R software (R<br />
Development Core Team 2006).<br />
Summer length (d)<br />
Cumulated GDD (°C)<br />
Summer mean temp. (°C)<br />
Winter mean temp. (°C)<br />
Bulk soil density (g.cm -3 )<br />
Depth (cm)<br />
pH in water<br />
SOC in<br />
upper layer (%)<br />
Soil Carbon stock<br />
(kgC m -2 )<br />
Granulometry (%)<br />
Clay (120<br />
5.11 (0.0 4.96 (0.06)<br />
10.6 ± 2.3 6.1 ± 1.0<br />
26.2 37.8<br />
9.7 (0.5)<br />
41.4 (1.0)<br />
48.6 (1.2)<br />
26.4 (2.6)<br />
61.7 (2.0)<br />
11.9 (4.5)<br />
Table 1. Climatic and geochemical<br />
characteristics of the soils from early and<br />
late snowmelt locations. For temperaturerelated<br />
values, data are averaged over the<br />
period 2000-2005 and over the three<br />
investigated sites (see also Fig. 1). For<br />
volumetric soil water content, the mean<br />
values of discontinuous measurements<br />
performed in the three sites during the<br />
growing seasons 2005 and 2006 are given<br />
(see Supplementary Material for further<br />
details). Geochemical characteristics,<br />
including soil pH, bulk density, soil<br />
carbon content and granulometry were<br />
measured on the soil samples used for<br />
respiration (n=5). Soil depth and total soil<br />
carbon on an area basis were estimated<br />
from 2 soil profiles in each sites.<br />
171
Chapitre II Article 2B<br />
Results<br />
Soil characteristics and soil climatology<br />
Soils from late snowmelt locations were deeper, slightly more acidic, and strongly<br />
enriched in fine particles compared to soils from early snowmelt locations (Table 1). Soil<br />
development in early snowmelt locations was weak, and the upper 30 cm layer of the soil<br />
profile was characterized by a high content of soil organic carbon (Table 1 and Fig. 1 in<br />
Supplementary Material). By contrast, soil profile in late snowmelt locations are more<br />
differentiated with a distinguishable anoxic B-horizon and evidence of duplicated soils along<br />
the profile. Soil organic matter was more evenly distributed along the profile (Table 1 and<br />
Fig.1 in Supplementary Material). Compared to lowland soils, both soil types are sequestering<br />
a large amount of organic carbon: from 26 kg C m -2 in the early snowmelt locations to 38 kg<br />
C m -2 in late snowmelt locations.<br />
Temperature (°C)<br />
-5 0 5 10 15 20<br />
11 22 3 44 55 66 7 88 99 10 11 12<br />
Month<br />
Fig. 1 Annual variations of<br />
daily mean soil temperature<br />
(± s.e.) observed for early<br />
(black) and late (gray)<br />
snowmelt locations. Data are<br />
averaged over the period<br />
2000-2005 and were<br />
recorded in two or three of<br />
the investigated sites<br />
depending on the year.<br />
The seasonal snow cover was the primary determinant of the yearly course of soil<br />
temperature (Fig. 1). In early snowmelt locations, the inconsistent snow cover during winter<br />
lead to an extended soil freezing period with a mean wintertime temperature of -2 °C (Table<br />
1). In the late snowmelt locations, a deep and persistent snow pack throughout wintertime<br />
maintained daily mean soil temperature around 0 °C (Table 1 and Fig. 1). Soil warming in<br />
early snowmelt locations occurred nearly 40 days before what was observed in snowy<br />
locations (Fig. 1). This time shift was remarkably constant throughout the 6 years of<br />
recordings and across the three sites (Table 1). During the summertime snow free period, both<br />
topographical locations exhibited very similar daily mean soil temperatures (Table 1 and Fig.<br />
1). Therefore, the observed difference in summertime cumulated degree days between the<br />
172
Chapitre II Article 2B<br />
locations was almost entirely due to the delayed onset of the growing period (Table 1).<br />
Volumetric soil water content measured during the growing season showed that, on<br />
average, soils of early snowmelt locations were weakly drier that soils from late snowmelt<br />
locations (Table 1). This was especially noticeable in site C (Fig. 2 in Supplementary<br />
Material).<br />
Soil respiration<br />
(nmol CO 2 g −1 C s −1 ) [log scale]<br />
Basal respiration<br />
(nmol CO 2 g −1 C s −1 ) [log scale]<br />
-4 -3 -2 -1 0 1<br />
-2.5 -2.0 -1.5 -1.0<br />
(a)<br />
-10 0 10 20 30<br />
(c)<br />
Temperature (°C)<br />
1.6 1.8 2.0 2.2 2.4 2.6 2.8<br />
Soil carbon content (%) [log scale])<br />
-4 -3 -2 -1 0 1<br />
-2.5 -2.0 -1.5 -1.0<br />
(b)<br />
-10 0 10 20 30<br />
(d)<br />
Temperature (°C)<br />
7.0 7.2 7.4 7.6 7.8 8.0 8.2 8.4<br />
Soil Water Content (% vol.) [log scale]<br />
Fig. 2 Laboratory data on CO2 efflux from -10 to 0 °C (frozen, open symbols) and from 0 to 30 °C<br />
(unfrozen, closed symbols). Soils samples represented upper layer of early (a) and late (b)<br />
snowmelt locations. The lines of best fit, using a simple first-order exponential model (Respiration<br />
= α e (β T) ), are shown separately for the two temperature ranges. The relationships between the<br />
exponential constant α and soil carbon content (c), and between α and volumetric relative water<br />
content (d). The lines of best fit, using a log-log linear model, were adjusted for a single dataset<br />
including unfrozen and frozen samples from early (black) and late (gray) snowmelt locations.<br />
Observed and simulated CO2 efflux<br />
To investigate the relative effect of temperature, water and carbon content on soil CO2<br />
effluxes, we conducted laboratory experiments on soil cores collected in early and late<br />
snowmelt locations. A simple first-order exponential model (model 1) explained 59 %, and 75<br />
%, of the observed variance with unfrozen soils from early and late snowmelt locations,<br />
173
Chapitre II Article 2B<br />
respectively (Fig. 2a, b and Table 2). The corresponding values for frozen soils were 86 %<br />
and 73 % (Table 2). For each soil type, the results showed an abrupt change of the<br />
temperature sensitivity of CO2 release when comparing frozen and unfrozen soils (Fig. 2).<br />
Though the Q10 values were very comparable for both soil types incubated at temperatures<br />
above 0°C (F1,34 = 0.82, P=0.37), there was a difference for frozen soils (F1,7 = 6.12, P =<br />
0.04). Soils from early snowmelt locations displayed a higher sensitivity to temperature (Q10<br />
around 12) compared to soils from late snowmelt locations (Q10 around 7) (Table 2). Finally,<br />
we found that the basal respiration, i.e. coefficient α1, of unfrozen soils was much higher in<br />
late snowmelt soils compared to early snowmelt soils (F1,34 = 16.54, P < 10 -3 ) (Table 2). There<br />
were significant log-log linear relationships between α1 and soil carbon content (r 2 = 0.40, P <<br />
10 -3 ), and between α1 and soil water content (r 2 = 0.61, P < 10 -3 ) (Fig. 2c, d). Because part of<br />
the observed variance in α1 was explainable by these two additional variables, models 2, 3<br />
and 4 largely improved on model 1 (Table 2). For example, RMSE and MAE were reduced by<br />
nearly a factor two when comparing the model 1 and 4 adjusted for all unfrozen soil cores<br />
(Table 2), resulting in a good adequacy between measured and predicted values (Fig. 3a). For<br />
all the models, the slope between measured and predicted values was significantly below one<br />
(Table 2). By comparison, we did not find significant bias in the elevation coefficient in most<br />
of the models except model 1 (Table 2). This led to slight overestimation of CO2 release in the<br />
low range of temperature and to an underestimation at the highest temperature (Fig. 3).<br />
Predicted<br />
-2.0 -1.5 -1.0 -0.5 0.0 0.5 1.0 1.5<br />
(a)<br />
-2.0 -1.5 -1.0 -0.5 0.0 0.5 1.0 1.5<br />
Measured<br />
Predicted<br />
-4.0 -3.5 -3.0 -2.5 -2.0 -1.5 -1.0 -0.5<br />
(b)<br />
-4.0 -3.5 -3.0 -2.5 -2.0 -1.5 -1.0 -0.5<br />
Measured<br />
Fig. 3 The relationships between measured (laboratory data) and predicted values of CO2<br />
efflux for unfrozen (a) and frozen soil samples. Model 4 was used for unfrozen soils and<br />
Model 3 for frozen soils (see Material and Methods). Evaluation of the model performances<br />
are given in Table 2. Colours and symbols are as shown in Fig. 3.<br />
174
Chapitre II Article 2B<br />
Plot<br />
Early<br />
snowmelt<br />
Late<br />
snowmelt<br />
Late and<br />
early<br />
snowmelt<br />
Temperature<br />
range<br />
Unfrozen soils<br />
Frozen soils<br />
Unfrozen soils<br />
Frozen soils<br />
Unfrozen soils<br />
Frozen soils<br />
Model n<br />
Model coefficients Model evaluation<br />
α β γ υ Q 10 r 2<br />
Elev.<br />
Elev.<br />
= 0 Slope<br />
Slope<br />
= 1 RMSE MAE<br />
1 128 -1.98 0.07 - - 2.03 0.59 -0.22 < 10-3 0.77 < 10-3 0.44 0.37<br />
2 128 -8.07 0.07 - 1.62 2.11 0.8 -0.1 0.018 0.89 0.006 0.31 0.25<br />
3 128 -0.27 0.07 -0.74 - 2.04 0.63 -0.2 < 10-3 0.79 < 10-3 0.42 0.36<br />
4 128 -6.25 0.08 -0.88 1.67 2.12 0.85 -0.08 0.047 0.92 0.018 0.27 0.21<br />
1 40 -2.11 0.25 - - 12.2 0.81 -0.21 0.167 0.9 0.148 0.43 0.33<br />
3 40 -2.18 0.25 0.03 - 12.2 0.81 -0.21 0.167 0.9 0.148 0.43 0.33<br />
1 177 -1.57 0.08 - - 2.13 0.75 -0.06 0.03 0.87 < 10-3 0.34 0.29<br />
2 177 -5.38 0.07 - 1.04 2.05 0.9 -0.02 0.216 0.95 0.029 0.22 0.18<br />
3 177 1.58 0.07 -1.79 - 2.1 0.79 -0.05 0.05 0.89 0.001 0.32 0.25<br />
4 177 -2.7 0.07 -1.45 1 2.03 0.92 -0.02 0.284 0.96 0.057 0.19 0.15<br />
1 48 -1.57 0.18 - - 6.26 0.86 -0.14 0.201 0.93 0.172 0.33 0.27<br />
3 48 -0.98 0.18 -0.3 - 6.11 0.86 -0.13 0.208 0.93 0.178 0.33 0.28<br />
1 305 -1.75 0.07 - - 2.1 0.62 -0.14 < 10-3 0.78 < 10-3 0.45 0.36<br />
2 305 -6.07 0.07 - 1.17 2.07 0.75 -0.09 < 10-3 0.87 < 10-3 0.37 0.29<br />
3 305 0 0.07 -0.9 - 2.09 0.75 -0.09 < 10-3 0.86 < 10-3 0.37 0.3<br />
4 305 -4.4 0.07 -0.9 1.21 2.05 0.89 -0.04 0.038 0.94 0.003 0.24 0.19<br />
1 88 -1.81 0.2 - - 7.16 0.73 -0.29 0.008 0.85 0.006 0.49 0.39<br />
3 88 -0.1 0.2 -0.8 - 7.29 0.79 -0.22 0.028 0.89 0.021 0.43 0.34<br />
Table 2 Coefficients and evaluation of the performance of the different soil respiration models (see Material and<br />
Methods). Results are shown for early and late snowmelt locations as well as for the global data set. Data for<br />
frozen and unfrozen soils are presented separately. The fit between measured and predicted values was evaluated<br />
quantitatively by the square of Pearson’s correlation coefficient (r 2 ), and qualitatively by the root mean square<br />
error (RMSE) and the mean absolute error (MAE). Tests of the difference between estimated and hypothesised<br />
elevation (or slope) were based on t-statistic. Bold values indicate when one can not reject the null hypotheses<br />
(i.e. slope = 1, elevation = 0) given the data. Rows in italic points to the model used for seasonal estimates (see<br />
Fig. 4 and 5).<br />
We examined whether model 4 was adequate in predicting field CO2 effluxes. Our<br />
field measurements were performed in three different sites during the summer 2006, and<br />
repeated on a weekly basis. In situ heterotrophic respiration rates expressed per surface unit<br />
were transformed in mg C g C -1 d -1 . For this estimate, we made the assumption that only the<br />
first 30 cm of the soil profile were really contributing to soil respiration and we used the total<br />
amount of carbon in this layer to transform the data. Overall, the model captured most of the<br />
variance of the empirical data but had a tendency to underestimate CO2 fluxes (Fig. 4). It was<br />
fairly adequate in predicting actual soil CO2 effluxes from late snowmelt locations. By<br />
contrast, we found much more scattered values when examining data from early snowmelt<br />
locations (Fig. 5 and Table 3). We did not find any evidence of a significant effect of the date<br />
of soil respiration measurement on this pattern (data not shown).<br />
175
Chapitre II Article 2B<br />
Predicted<br />
-3.0 -2.5 -2.0 -1.5 -1.0 -0.5<br />
-3.0 -2.5 -2.0<br />
Measured<br />
-1.5 -1.0 -0.5<br />
Simulation of seasonal CO2 production rates<br />
Fig. 4 The relationships between measured (field<br />
data) and predicted values of CO2 efflux. Field<br />
measurements were conducted during summer<br />
2006. Measured respiration rates per soil area were<br />
transformed to respiration rates per g of soil carbon<br />
and were fitted against model 4 (see Material and<br />
Methods). Evaluation of the model performance is<br />
given in Table 2. Colours are as shown in Fig. 2.<br />
We questioned the relative importance of snow cover dynamics and soil carbon<br />
content on total CO2 production during summer and winter periods. At a given temperature,<br />
CO2 release from early snowmelt unfrozen soils was depressed because of a lower basal<br />
respiration rate compared to late snowmelt locations. Simulations revealed that the total CO2<br />
production during summer is higher in late snowmelt locations than in early snowmelt<br />
locations, despite a shortened favourable period (Fig. 5a, b). The same results were found at<br />
two levels of soil water content (Fig. 5a, b). The difference between the topographical<br />
locations would be even larger if contrasting values of soil water content – i.e. slightly higher<br />
in late snowmelt locations - had been considered (data not shown).<br />
Qualitatively similar results were obtained for simulations of wintertime CO2<br />
production (Fig. 5c, d). For a given soil carbon content, the wintertime CO2 production rate<br />
slightly increased with increasing fraction of snow-covered days (Fig. 5c), and the trend was<br />
more pronounced with high Q10 values (Fig. 5d). Noticeably, the effect of varying number of<br />
snow-covered days on soil respiration remained weak because respiration rates are estimated<br />
in a low temperature range (typically from -8 °C to 0 °C). In both simulations, the CO2<br />
production in late snowmelt locations was approximately twice as much as in early snowmelt<br />
locations (around 40 g C g -1 against 20 g C g -1 C). Clearly, this difference was mainly due to<br />
the effect of soil carbon content on basal respiration and to a lesser extent to the difference in<br />
the number of snow-covered days (Fig. 5c, d).<br />
176
Chapitre II Article 2B<br />
Plot n<br />
Soil carbon content (%)<br />
Soil carbon content (%)<br />
4 6 8 10 12 14<br />
4 6 8 10 12 14<br />
(a)<br />
120 130 140 150 160 170 180<br />
Summertime length (days)<br />
(c)<br />
r 2<br />
Elev.<br />
Model evaluation<br />
Elev.<br />
= 0 Slope<br />
0 50 100 150<br />
Number of snow-covered days<br />
Slope<br />
= 1 RMSE MAE<br />
Late and early<br />
snowmelt 241 0.44 0.09 0.342 0.99 0.818 0.39 0.30<br />
Early snowmelt<br />
157 0.15 -0.23 0.099 0.88 0.077 0.36 0.29<br />
Late snowmelt<br />
84 0.47 -0.39 < 10 -3<br />
0.59 < 10 -3<br />
0.45 0.34<br />
Soil carbon content (%)<br />
Soil carbon content (%)<br />
4 6 8 10 12 14<br />
4 6 8 10 12 14<br />
(b)<br />
Table 3 Performance of the soil<br />
respiration models based on<br />
laboratory experiments in<br />
predicting field CO2 efflux<br />
measurements. See Table 2 and<br />
Material and Methods for details<br />
on statistical analysis.<br />
120 130 140 150 160 170 180<br />
Summertime length (days)<br />
(d)<br />
0 50 100 150<br />
Number of snow-covered days<br />
Fig. 5 (a, b) The relative impact of growing season length and soil carbon content on the<br />
total summertime CO2 efflux. Simulations were done with model 4 using two levels of soil<br />
water content: 20% (a) and 30% (b). We used a constant daily mean temperature of 9 °C,<br />
corresponding to the mean temperature of the growing season period (see Table 1). (c, d)<br />
The relative impact of the snow-covered period and soil carbon content on the total<br />
wintertime soil respiration. Simulations were done with model 3 using Q10 values of<br />
unfrozen (c) and frozen (d) soils. For all panels, seasonal CO2 productions (in g CO2 g -1 C)<br />
are represented by the contour gray lines.<br />
177
Chapitre II Article 2B<br />
Discussion<br />
The goal of the study was to assess the relative effects of temperature, soil water<br />
content and soil carbon content on CO2 effluxes in late and early snowmelt locations in alpine<br />
tundra. Combining modelling and empirical approaches, we showed that differences among<br />
basal respiration rates accounted for much of the differences on CO2 effluxes between the two<br />
contrasting topographical situations. A higher basal respiration rate in late snowmelt locations<br />
explained a higher summertime CO2 production despite a shortened growing season. This<br />
impact of basal respiration rate also overrode temperature effect when simulating CO2<br />
production during wintertime.<br />
Impact of soil water content and soil carbon content on basal respiration rate<br />
Soil water content and soil carbon content accounted for most of the variation<br />
observed in the basal respiration rate of a first-order exponential model of soil respiration<br />
temperature dependence. For water, average values of summertime basal respiration were<br />
reduced by 34% and 30% from wet to moist conditions in early and late snowmelt cores<br />
respectively. This confirmed previous studies (Sjögersten and Wookey 2002, Illeris et al.<br />
2004, Sjogersten et al. 2006) which provided evidence for a significant effect of water on CO2<br />
effluxes in cold ecosystems. However, the differences of soil water content between early and<br />
late snowmelt locations measured in the field were relatively weak. Therefore, it is unlikely<br />
that soil water content would represent a key driver of CO2 effluxes variations along the<br />
investigated topographical gradients. These results contrast with those obtained in arctic<br />
tundra where soil water table was shown determinant in regulating local and regional and CO2<br />
effluxes (Ostendorf 1996, Sjogersten et al. 2006). Also they are not in line with other studies<br />
performed in temperate alpine tundra suggesting higher hydric limitation in early compare to<br />
late snowmelt locations (O'Lear and Seastedt 1994, Bryant et al. 1998, Fisk et al. 1998). In the<br />
investigated area, late snowmelt locations are sufficiently well-drained so that the flooding<br />
period at the time of snowmelt does not generally exceed one week (Ph. Choler, pers. obs.).<br />
Later on, low summer rainfall and prolonged clear sky periods rapidly attenuate the initial<br />
differences in soil water content along the topographical gradient.<br />
The comparison of early and late snowmelt locations indicated an inverse relationship<br />
between soil carbon content and basal respiration (Fig. 2). There are only few examples of<br />
such relationships in the literature and they generally report the opposite pattern. Gough &<br />
Seiler (2004) reported a weak but significant positive relationship between total soil carbon<br />
and soil respiration in a loblolly pine stand (per unit area), while Rodeghiero & Cescatti<br />
178
Chapitre II Article 2B<br />
(2005) indicated a highly significant relationship between soil respiration at the reference<br />
temperature of 10°C and soil carbon content (per unit area). Conversely, no clear trend<br />
emerged between soil carbon stock and soil respiration (per unit area) in the study of<br />
Reichstein et al. (2003). These contrasting reports are firstly explained by the absence of<br />
standardized protocols for soil respiration and soil carbon stocks (Rodeghiero and Cescatti<br />
2005). They also result from confounding effect of C quantity and quality as soil respiration is<br />
generally expressed per unit area. In this experiment, we expressed CO2 effluxes per gram of<br />
carbon so as to gain insights on the specific activity of microorganisms. Our results showed<br />
that this specific activity was strongly reduced in early snowmelt compared to late snowmelt<br />
locations, providing evidence for a higher C recalcitrance in early snowmelt locations. This is<br />
in agreement with the observation that litter from the dominant Dryas octopetela in early<br />
snowmelt locations contains high amount of tannin and lignin (Baptist et al. 2008, Baptist,<br />
unpublished results). By contrast, it has been shown that the presence of a deep snow pack<br />
during winter enhanced microbial decomposition, and thus limited the accumulation of<br />
recalcitrant compounds in the soil (Hobbie and Chapin 1996).<br />
Seasonal and spatial variations of temperature sensitivity<br />
The range of Q10 values observed in this study was in accordance with the values<br />
generally reported in arctic and alpine ecosystems. Various studies measured Q10 between 2<br />
and 9 above 0°C, and from 8 to 240 below freezing point (Mikan et al. 2002, Elberling and<br />
Brandt 2003, Kato et al. 2005, Panikov et al. 2006). The underlying mechanisms responsible<br />
for the abrupt change in temperature dependency at freezing point have been widely debated.<br />
Mikan et al. (2002) proposed that physical processes such as extracellular substrate diffusion<br />
or intracellular dehydratation may affect biological activity under freezing point leading to<br />
various temperature sensitivity of saprophytic microorganisms. The occurrence of<br />
psychrophylic microbial community exhibiting exponential growth rate and high rates of<br />
substrate utilization at below zero temperature tend to support this hypothesis (Monson et al.<br />
2006). However, soil water content affects gas diffusion under freezing point and thus<br />
modulates CO2 release around 0°C (Elberling and Brandt 2003, Panikov et al. 2006). These<br />
physical processes may also explain the abrupt changes of Q10 values around 0°C.<br />
While summertime soil cores from both locations exhibited equivalent temperature<br />
sensitivity, soil cores from early snowmelt locations exhibited higher temperature sensitivity<br />
below 0°C. Different soil textural properties between the two soil types might impact the<br />
dynamics of unfrozen water, microbial access to substrate and therefore modulate CO2<br />
179
Chapitre II Article 2B<br />
trapping and release. Another explanation might lay in the contrasting functional properties of<br />
microbial communities along the topographical gradient. Molecular studies provided evidence<br />
for large shifts in fungal and bacterial communities between early and late snowmelt sites<br />
(Zinger, unpublished results). Furthermore, we showed that specific substrate and frozen<br />
temperature lead to the development of a psychrophylic fungal community in early snowmelt<br />
locations (Baptist et al. 2008). Further studies are now required to test whether these<br />
wintertime microbial communities from early snowmelt locations are more sensitive to<br />
temperature changes.<br />
The interplay of soil carbon content and soil climate on seasonal CO2 effluxes<br />
We are aware of only a few number of studies that investigated the impact of carbon<br />
quality on CO2 efflux spatial variation in cold ecosystems (Vance and Chapin III 2001, Smith<br />
2005, Elberling 2007). All of these studies highlighted an important effect of carbon quality<br />
on spatial variations of CO2 effluxes and suggested that, in snow-covered ecosystems, this<br />
parameter may exert primary control on heterotrophic soil respiration at least during growing<br />
season. Here, we developed a 4-parameter model which predicted reasonably well the fieldmeasured<br />
soil CO2 effluxes during the growing season. We are therefore confident that the<br />
relative importance of soil carbon content and soil climate on summertime CO2 production<br />
were well captured by our model.<br />
By contrast, large uncertainties remain for the wintertime estimates of CO2 production.<br />
For example, our simulations showed that in late snowmelt locations, the wintertime estimates<br />
of CO2 production were roughly identical to summertime estimates with low Q10 values, but<br />
nearly two times higher if Q10 values from frozen soils were used. A more accurate estimate<br />
of wintertime soil respiration in snow-covered ecosystems remains a challenge because (1)<br />
the temperature sensitivity of soil micro-organisms in frozen soils has proven quite difficult to<br />
estimate (see above) and (2) there are still considerable technical difficulties in measuring soil<br />
CO2 effluxes under the snowpack (Hubbard et al. 2005). Clearly, a better understanding of<br />
wintertime soil respiration is required in order to predict impact of climate change on annual<br />
net carbon balance in snow-covered ecosystems (Elberling and Brandt 2003).<br />
Conclusion<br />
Our results established that regional models of soil CO2 fluxes in alpine tundra should<br />
properly take into account the interplay of snow-cover dynamics and soil carbon content at<br />
the mesotopographical scale. This up-scaling would require further comparative studies of<br />
basal respiration rate and temperature sensitivity of soil respiration conducted over a larger set<br />
180
Chapitre II Article 2B<br />
of dominant subalpine/alpine vegetation types. At a larger scale, it would be worth to examine<br />
to what extent soil carbon content could be used as a surrogate for basal respiration.<br />
The effects of that land-use and climate change on species distribution in temperate<br />
mountains have received considerable attention over the last decade (Keller et al. 2000,<br />
Cannone et al. 2007, Lenoir et al. 2008). Shifts in plant community composition as a result of<br />
these changes in elevational ranges could rapidly modify the quantity and quality of soil<br />
organic matter, at least in the upper layer. Our results also call for a better understanding of<br />
these associated changes in soil organic matter quality to predict CO2 effluxes from the large<br />
carbon stock sequestered in the soils of these ecosystems.<br />
Acknowledgements<br />
We are grateful to S. Aubert, C. Bayle, G. Girard for their help during field campaigns<br />
and in the laboratory. Logistical supports were provided by the “<strong>Station</strong> <strong>Alpine</strong> <strong>Joseph</strong><br />
<strong>Fourier</strong>”, the alpine field station of the University <strong>Joseph</strong> <strong>Fourier</strong>. F. Baptist received a Ph.D<br />
fellowship from the “Ministère de l’Education Nationale, de la Recherche et de<br />
l’Enseignement Supérieur”. This work was also partly supported by the project ANR<br />
MICROALP.<br />
References<br />
Baptist, F., and P. Choler. 2008. A simulation of the importance of length of growing season<br />
and canopy functional properties on the seasonal gross primary production of<br />
temperate alpine meadows. Annals of Botany 101:549-559.<br />
Baptist, F., L. Zinger, J. C. Clement, C. Gallet, R. Guillemin, et al. 2008. Tannin impacts on<br />
microbial diversity and the functioning of alpine soils: a multidisciplinary approach.<br />
Environmental Microbiology 10:799-809.<br />
Beniston, M. 2005. Mountain climates and climatic change: An overview of processes<br />
focusing on the European Alps. Pure and Applied Geophysics 162:1587-1606.<br />
Billings, W. D. 1973. Arctic and alpine vegetations: similarities, differences, and<br />
susceptibility to disturbance. Bioscience 23:697-704.<br />
Bounemoura, Z., K. Lambert, G. Cadel, P. Choler, O. Manneville, et al. 1998. Influence des<br />
facteurs edapho-climatiques sur la distribution des pelouses alpines dans le massif du<br />
Galibier (Alpes francaises). Ecologie 29:53-58.<br />
Bowman, W. D., T. A. Theodose, J. C. Schardt, and R. T. Conant. 1993. Constraints of<br />
nutrient availability on primary production in two alpine communities. Ecology<br />
181
Chapitre II Article 2B<br />
74:2085-2097.<br />
Brooks, P. D., D. McKnight, and K. Elder. 2004. Carbon limitation of soil respiration under<br />
winter snowpacks: potential feedbacks between growing season and winter carbon<br />
fluxes. Global Change Biology 11:231-238.<br />
Bryant, D. M., E. A. Holland, T. R. Seastedt, and M. D. Walker. 1998. Analysis of litter<br />
decomposition in an alpine tundra. Canadian Journal of Botany 76:1295-1304.<br />
Cannone, N., S. Sgorbati, and M. Guglielmin. 2007. Unexpected impacts of climate change<br />
on alpine vegetation. Frontier in Ecology and Environment 5:360-364.<br />
Chapin, I., F.S., S. E. Hobbie, M. S. Bret-Harte, and G. Bonan. 1995. Causes and<br />
consequences of plant functionnal diversity in arctic ecosystems. Pages 189-209 in F.<br />
S. I. Chapin and C. Körner, editors. Arctic and alpine biodiversity: Patterns, causes<br />
and ecosystem consequences. Springer Verlag, Berlin.<br />
Choler, P. 2005. Consistent shifts in <strong>Alpine</strong> plant traits along a mesotopographical gradient.<br />
Arctic Antarctic And <strong>Alpine</strong> Research 37:444-453.<br />
Davidson, E. A., E. Belk, and R. D. Boone. 1998. Soil water content and temperature as<br />
independent or confounded factors controlling soil respiration in a temperate mixed<br />
hardwood forest. Global Change Biology 4:217-227.<br />
Diaz, H. F., and R. S. Bradley. 1997. Temperature variations during the last century at high<br />
elevation sites. Climatic Change 36:253-279.<br />
Elberling, B. 2007. Annual soil CO2 effluxes in the High Arctic: The role of snow thickness<br />
and vegetation type. Soil Biology and Biochemistry 39:646-654.<br />
Elberling, B., and K. K. Brandt. 2003. Uncoupling of microbial CO2 production and release in<br />
frozen soil and its implications for field studies of arctic C cycling. Soil Biology and<br />
Biochemistry 35:263-272.<br />
Fierer, N., M. A. Bradford, and R. B. Jackson. 2007. Toward an ecological classification of<br />
soil bacteria. Ecology 88:1354-1364.<br />
Fisk, M. C., S. K. Schmidt, and T. R. Seastedt. 1998. Topographic patterns of above- and<br />
belowground production and nitrogen cycling in <strong>Alpine</strong> tundra. Ecology 79:2253-<br />
2266.<br />
Gensac, P. 1990. Plant and soil groups in the alpine grasslands of the Vanoise Massif, French<br />
Alps. Arctic And <strong>Alpine</strong> Research 22:195-201.<br />
Gough, C. M., and J. R. Seiler. 2004. The influence of environmental, soil carbon, root, and<br />
stand characteristics on soil CO2 efflux in loblolly pine (Pinus taeda L.) plantations<br />
located on the South Carolina Coastal Plain. Forest Ecology and Management<br />
182
Chapitre II Article 2B<br />
191:353-363.<br />
Grogan, P., and S. Jonasson. 2005. Temperature and substrate controls on intra-annual<br />
variation in ecosystem respiration in two subarctic vegetation types. Global Change<br />
Biology 11:465-475.<br />
Grogan, P., and S. Jonasson. 2006. Ecosystem CO2 production during winter in a Swedish<br />
subarctic region: the relative importance of climate and vegetation type. Global<br />
Change Biology 12:1479-1495.<br />
Hillel, D. 1971. Soil and water - Physical principles and processes, New York, USA.<br />
Hobbie, S. E., and F. S. Chapin. 1996. Winter regulation of tundra litter carbon and nitrogen<br />
dynamics. Biogeochemistry 35:327-338.<br />
Hobbie, S. E., J. P. Schimel, S. E. Trumbore, and J. R. Randerson. 2000. Controls over carbon<br />
storage and turnover in high-latitude soils. Global Change Biology 6 Suppl. 1:196-<br />
210.<br />
Hubbard, R. M., M. G. Ryan, K. Elder, and C. C. Rhoades. 2005. Seasonal patterns in soil<br />
surface CO2 flux under snow cover in 50 and 300 year old subalpine forests.<br />
Biogeochemistry 73:93-107.<br />
Illeris, L., T. R. Christensen, and M. Mastepanov. 2004. Moisture effects on temperature<br />
sensitivity of CO2 exchange in a subarctic heath ecosystem. Biogeochemistry 70:315-<br />
330.<br />
IPCC. 2001. The carbon cycle and atmospheric carbon dioxide. Pages 183-237 in Climate<br />
Change 2001. The Third Assessment Report of the Intergovernmental Panel on<br />
Climate Change. Cambridge University Press, Cambridge, UK.<br />
Isard, S. A. 1986. Factors influencing soil moisture and plant community distribution on<br />
Niwot Ridge, Front Range, Colorado, U.S.A. Arctic And <strong>Alpine</strong> Research 18:295-<br />
304.<br />
Kato, T., M. Hirota, Y. Tang, X. Cui, Y. Li, et al. 2005. Strong temperature dependence and<br />
no moss photosynthesis in winter CO2 flux for a Kobresia meadow on the Qinghai-<br />
Tibetan plateau. Soil Biology and Biochemistry 37:1966-1969.<br />
Kato, T., Y. H. Tang, S. Gu, M. Hirota, M. Y. Du, et al. 2006. Temperature and biomass<br />
influences on interannual changes in CO2 exchange in an alpine meadow on the<br />
Qinghai-Tibetan Plateau. Global Change Biology 12:1285-1298.<br />
Keller, F., F. Kienast, and M. Beniston. 2000. Evidence of response of vegetation to<br />
environmental change on high-elevation sites in the Swiss Alps. Regional<br />
Environmental Change 1:70-77.<br />
183
Chapitre II Article 2B<br />
Knorr, W., I. C. Prentice, J. I. House, and E. A. Holland. 2005. Long-term sensitivity of soil<br />
carbon turnover to warming. Nature 433:298-301.<br />
Kudo, G. 1996. Intraspecific variation of leaf traits in several deciduous species in relation to<br />
lenght of growing season. Ecoscience 3:483-489.<br />
Lenoir, J., J. C. Gégout, P. A. Marquet, P. de Ruffray, and H. Brisse. 2008. A significant<br />
upward shift in plant species optimum elevation during the 20th century. Science<br />
320:1768-1771.<br />
Mikan, C. J., J. P. Schimel, and A. P. Doyle. 2002. Temperature controls of microbial<br />
respiration in arctic tundra soils above and below freezing. Soil Biology &<br />
Biochemistry 34:1785-1795.<br />
Monson, R. K., D. L. Lipson, S. P. Burns, A. A. Turnipseed, A. C. Delany, et al. 2006. Winter<br />
forest soil respiration controlled by climate and microbial community composition.<br />
Nature 439:711-714.<br />
Noguès-Bravo, D., M. B. Araujo, M. P. Errea, and J. P. Martinez-Rica. 2007. Exposure of<br />
global mountain systems to climate warming during the 21st Century. Global<br />
Environmental Change 17:420-428.<br />
O'Lear, H. A., and T. R. Seastedt. 1994. Landscape patterns of litter decomposition in alpine<br />
tundra. Oecologia 99:95-101.<br />
Ostendorf, B. 1996. Modelling the influence of hydrological processes on spatial and<br />
temperal patterns of CO2 soil efflux from an arctic tundra catchement. Arctic And<br />
<strong>Alpine</strong> Research 28:318-327.<br />
Ozenda, P. 1985. La végétation de la chaîne alpine dans l'espace montagnard européen.<br />
Masson, Paris.<br />
Panikov, N. S., P. W. Flanagan, W. C. Oechel, M. A. Mastepanov, and T. R. Christensen.<br />
2006. Microbial activity in soils frozen to below -39C. Soil Biology and Biochemistry<br />
38:785-794.<br />
R Development Core Team. 2006. R: A Language and Environment for Statistical<br />
Computing. in R Foundation for Statistical Computing, editor., Vienna, Austria.<br />
Reichstein, M., A. Rey, A. Freibauer, J. Tenhunen, R. Valentini, et al. 2003. Modeling<br />
temporal and large-scale spatial variability of soil respiration from soil water<br />
availability, temperature and vegetation productivity indices. Global Biogeochemical<br />
Cycles 17:1-15.<br />
Reichstein, M., J. A. Subke, A. C. Angeli, and J. D. Tenhunen. 2005. Does the temperature<br />
sensitivity of decomposition of soil organic matter depend upon water content, soil<br />
184
Chapitre II Article 2B<br />
horizon, or incubation time? Global Change Biology 11:1754-1767.<br />
Rodeghiero, M., and A. Cescatti. 2005. Main determinants of forest soil respiration along an<br />
elevation/temperature gradient in the Italian Alps. Global Change Biology 11:1024-<br />
1041.<br />
Schimel, J. P., J. Fahnestock, G. Michaelson, C. Mikan, C. L. Ping, et al. 2006. Cold-season<br />
production of CO2 in arctic soils: Can laboratory and field estimates be reconciled<br />
through a simple modeling approach? Arctic Antarctic And <strong>Alpine</strong> Research 38:249-<br />
256.<br />
Schulte, E. E., and G. G. Hopkins. 1996. Estimation of organic matter by weight loss-onignition.<br />
Pages 21–31 in I. F. R. M. e. a. (ed.), editor. Soil organic matter: Analysis<br />
and interpretation. SSSA Spec. Publ. 46. SSSA, Madison, WI.<br />
Sjogersten, S., R. Van der Wal, and S. J. Woodin. 2006. Small-scale hydrological variation<br />
determines landscape CO2 fluxes in the high Arctic. Biogeochemistry 80:205–216.<br />
Sjögersten, S., and P. A. Wookey. 2002. Climatic and resource quality controls on soil<br />
respiration across a forest-tundra ecotone in Swedish Lapland. Soil Biology and<br />
Biochemistry 34:1633-1646.<br />
Smith, V. R. 2005. Moisture, carbon and inorganic nutrient controls of soil respiration at a<br />
sub-Antarctic island. Soil Biology and Biochemistry 37:81-91.<br />
Soudzilovskaia, N. A., V. G. Onipchenko, J. H. C. Cornelissen, and R. Aerts. 2005. Biomass<br />
production, N: P ratio and nutrient limitation in a Caucasian alpine tundra plant<br />
community. Journal of Vegetation Science 16:399-406.<br />
Vance, E. D., and F. S. Chapin III. 2001. Substrate limitations to microbial activity in taiga<br />
forest floors. Soil Biology and Biochemistry 33:173-188.<br />
Walker, M. D., D. A. Walker, J. M. Welker, A. M. Arft, T. Bardsley, et al. 1999. Long-term<br />
experimental manipulation of winter snow regime and summer temperature in arctic<br />
and alpine tundra. Hydrological Processes 13:2315-2330.<br />
Warton, D., and J. Ormerod. 2007. smatr: (Standardised) Major Axis Estimation and Testing<br />
Routines. R package version 2.1. http://web.maths.unsw.edu.au/~dwarton.<br />
Warton, D. I., I. J. Wright, D. S. Falster, and M. Westoby. 2006. Bivariate line-fitting<br />
methods for allometry. Biological Reviews 81:259-291.<br />
Willmott, C. J., and K. Matsuura. 2005. Advantages of the mean absolute error (MAE) over<br />
the root mean square error (RMSE) in assessing average model performance. Climate<br />
Research 30:79-82.<br />
185
Chapitre II Article 2B<br />
Appendix 1<br />
Soil depth (m)<br />
-1.0 -0.8 -0.6 -0.4 -0.2 0.0<br />
0 5 10 15<br />
0 10 20 30 40 50<br />
Soil carbon content (%)<br />
Cumulated soil carbon content (kg m −2 )<br />
Fig. S1 Soil carbon content along the soil profile for early (black) and late (gray) snowmelt<br />
locations.<br />
Soil depth (m)<br />
-1.5 -1.0 -0.5 0.0<br />
186
Chapitre II Article 2B<br />
Appendix 2<br />
% of measurements<br />
0 10 20 30 40 50<br />
0 10 20 30 40 50<br />
0 10 20 30 40 50<br />
Site A<br />
0.1 0.12 0.14 0.16 0.18 0.2 0.22 0.24 0.26 0.28 0.3 0.32 0.34 0.36 0.38<br />
Site B<br />
0.1 0.12 0.14 0.16 0.18 0.2 0.22 0.24 0.26 0.28 0.3 0.32 0.34 0.36 0.38<br />
Site C<br />
0.1 0.12 0.14 0.16 0.18 0.2 0.22 0.24 0.26 0.28 0.3 0.32 0.34 0.36 0.38<br />
Soil water content (m 3 m −3 )<br />
Fig. S2 Volumetric soil water content observed for early (black) and late (gray) snowmelt<br />
locations. Measurements were made discontinuously during the growing seasons 2005 and 2006.<br />
N is the total number of days for which time-series are available. Histograms show the frequency<br />
distribution of values recorded every 20 min.<br />
187
Chapitre II Article 2B<br />
188
Article 2C<br />
Tannin impacts on microbial diversity and the functioning<br />
of alpine soils: a multidisciplinary approach.<br />
Baptist, F., Zinger, L., Clement, J.C., Gallet, C., Guillemin, R.,<br />
Martins, J.M.F., Sage, L., Shahnavaz, B. and Choler Ph. 2008.<br />
Environmental Microbiology 10:799-809<br />
Dryas octopetala dans les systèmes thermiques à Combe Roche Noire durant le mois<br />
d’août. Photo : Ph. Choler<br />
189
190
Environmental Microbiology (2008) 10(3), 799–809 doi:10.1111/j.1462-2920.2007.01504.x<br />
Tannin impacts on microbial diversity and the<br />
functioning of alpine soils: a multidisciplinary<br />
approach<br />
F. Baptist, 1 L. Zinger, 1 J. C. Clement, 1 C. Gallet, 2 *<br />
R. Guillemin, 1 J. M. F. Martins, 3 L. Sage, 1<br />
B. Shahnavaz, 1 Ph. Choler 1,4 and R. Geremia 1<br />
1 Laboratoire d’Ecologie <strong>Alpine</strong>, CNRS UMR 5553,<br />
<strong>Université</strong> de Grenoble, BP 53, F-38041 Grenoble<br />
Cedex 09, France.<br />
2 Laboratoire d’Ecologie <strong>Alpine</strong>, CNRS UMR 5553,<br />
<strong>Université</strong> de Savoie, F-73367 Bourget-du-Lac, France.<br />
3 Laboratoire d’études des Transferts en Hydrologie et<br />
Environnement, CNRS UMR 5564 <strong>Université</strong> de<br />
Grenoble, F-38041 Grenoble, France.<br />
4 <strong>Station</strong> <strong>Alpine</strong> J. <strong>Fourier</strong>, CNRS UMS 2925, <strong>Université</strong><br />
de Grenoble, F-38041 Grenoble, France.<br />
Summary<br />
In alpine ecosystems, tannin-rich-litter decomposition<br />
occurs mainly under snow. With global change,<br />
variations in snowfall might affect soil temperature<br />
and microbial diversity with biogeochemical consequences<br />
on ecosystem processes. However, the<br />
relationships linking soil temperature and tannin<br />
degradation with soil microorganisms and nutrients<br />
fluxes remain poorly understood. Here, we combined<br />
biogeochemical and molecular profiling approaches<br />
to monitor tannin degradation, nutrient cycling and<br />
microbial communities (Bacteria, Crenarcheotes,<br />
Fungi) in undisturbed wintertime soil cores exposed<br />
to low temperature (0°C/-6°C), amended or not with<br />
tannins, extracted from Dryas octopetala. No toxic<br />
effect of tannins on microbial populations was found,<br />
indicating that they withstand phenolics from alpine<br />
vegetation litter. Additionally at -6°C, higher carbon<br />
mineralization, higher protocatechuic acid concentration<br />
(intermediary metabolite of tannin catabolism),<br />
and changes in fungal phylogenetic composition<br />
showed that freezing temperatures may select fungi<br />
able to degrade D. octopetala’s tannins. In contrast,<br />
negative net nitrogen mineralization rates were<br />
observed at -6°C possibly due to a more efficient N<br />
Received 27 June, 2007; accepted 23 October, 2007. *For<br />
correspondence. E-mail christiane.gallet@univ-savoie.fr; Tel. 33 (0)<br />
4 79 75 86 01; Fax 33 (0) (0) 4 79 88 80.<br />
immobilization by tannins than N production by<br />
microbial activities, and suggesting a decoupling<br />
between C and N mineralization. Our results confirmed<br />
tannins and soil temperatures as relevant controls<br />
of microbial catabolism which are crucial for<br />
alpine ecosystems functioning and carbon storage.<br />
Introduction<br />
Journal compilation © 2008 Society for Applied Microbiology and Blackwell Publishing Ltd<br />
No claim to original French government works<br />
In arctic and alpine ecosystems, seasonally snowcovered<br />
soils sequester a very large pool of organic<br />
carbon, which appears particularly vulnerable in the<br />
context of global warming (Hobbie et al., 2000). A positive<br />
feed-back between increased soil respiration and rising<br />
atmospheric CO2 has been put forward several times in<br />
global carbon balance models (Knorr et al., 2005).<br />
However, whether snow-covered ecosystems are carbon<br />
sources or sinks is still highly debated (Mack et al., 2004;<br />
Knorr et al., 2005). This is partly explained by the incomplete<br />
understanding we have of the processes involved in<br />
the wintertime heterotrophic respiration in relation to snow<br />
cover duration in cold ecosystems (McGuire et al., 2000;<br />
Monson et al., 2006). The variations of soil microbial activity<br />
in relation with the dynamic of the snow cover and litter<br />
inputs are poorly documented, though some seasonal<br />
changes in the structure and function of microbial communities<br />
in alpine soils have been described (Lipson<br />
et al., 2002; Schadt et al., 2003; Lipson and Schmidt,<br />
2004). It has been shown that the cooler temperature at<br />
the end of the growing season triggers a marked shift to a<br />
psychrophilic microflora dominated by fungi (Lipson et al.,<br />
2002). Additionally, the microbial biomass increased<br />
sharply during wintertime. These microbial communities<br />
are able to decompose efficiently recalcitrant carbon<br />
sources, such as polyphenols, which are likely to be abundant<br />
in alpine plants tissues (Steltzer and Bowman,<br />
2005). It is widely recognized that phenolics play a major<br />
role in nutrient cycling and litter decomposition through<br />
their multilevel interactions with mineralization processes<br />
(Cornelissen et al., 1999; Hattenschwiler and Vitousek,<br />
2000). Aside from their toxicity towards some microorganisms,<br />
polyphenols, especially the tannin fraction, are<br />
expected to affect the availability of nitrogen to plants<br />
during their growing season, mainly through complexation
800 F. Baptist et al.<br />
of the organic nitrogen in soils (Kraus et al., 2003; Kaal<br />
et al., 2005; Nierop and Verstraten, 2006).<br />
Fungus-dominated microbial communities are particularly<br />
abundant in the most constraining habitats of the<br />
alpine landscape such as exposed dry meadows (Nemergut<br />
et al., 2005). These ecosystems are dominated by<br />
slow-growing plant species – mainly Kobresia myosuroides,<br />
Dryas octopetala – and are characterized by a low<br />
net primary productivity, a high soil organic matter (SOM)<br />
content, and a limited supply of soil nutrients (Choler,<br />
2005). Furthermore, D. octopetala produces high<br />
amounts of polyphenols, with proanthocyans as the major<br />
tannin compounds. In dry meadows, the low and irregular<br />
snow pack leads to frequent periods where soils are<br />
frozen (< -5°C) between plant senescence and renewal.<br />
However, the impact of repeated low temperature events<br />
on both recalcitrant litter decomposition and soil functioning<br />
remains unknown. Additionally, these abiotic constraints<br />
are likely to be modified by climatic change.<br />
Recent climate scenarios for the Alps show changes in<br />
the seasonality and quantity of snow at high altitude, i.e.<br />
above 2000 m (Beniston, 2003; Keller et al., 2005). The<br />
predicted decrease in precipitation between autumn and<br />
early spring will most likely reduce the winter snowcovered<br />
period of alpine dry meadows, consequently,<br />
increasing the length of the soil freezing period. It is not<br />
known to what extent these changes will affect the wintertime<br />
decomposition of organic matter, recalcitrant compounds<br />
in particular.<br />
In this study, we focused on the combined effect of low<br />
temperature (< 0°C) and the input of recalcitrant compounds<br />
on alpine soil functioning. We expected a shift in<br />
microbial communities as a consequence of changes in<br />
these two ecological factors during the late-fall critical<br />
period. We set up an incubation experiment with soil cores<br />
under laboratory conditions to disentangle the effects of<br />
temperature and tannin addition on the diversity of microbial<br />
communities and the carbon and nitrogen cycles.<br />
More specifically, we addressed the following questions:<br />
how does tannin input affect (i) carbon and nitrogen mineralization<br />
and (ii) overall soil bacterial and fungal phylogenetic<br />
structures? (iii) how are these functional and<br />
phylogenetic responses are modulated by a prior treatment<br />
at freezing temperature (-6°C)?<br />
We simulated a late-fall litter flux by adding tannins<br />
extracted from D. octopetala leaves to soil cores collected<br />
in dry meadows during the fall, and we mimicked the<br />
snow-pack reduction by a freezing treatment. We monitored<br />
the C and N soil dynamics (including tannin evolution)<br />
and assessed the microbial soil diversity through<br />
rRNA genes (16S rRNA gene for prokaryotes, ITS for<br />
fungi) using molecular profiling [single-strand conformation<br />
polymorphism (SSCP)] in addition to classical microbial<br />
techniques.<br />
Results<br />
Impact of tannin on structure and metabolism of microbial<br />
populations were addressed in an incubation experiment<br />
with soil cores under laboratory conditions. Four treatments<br />
were applied (n = 3). In W/S and T/S treatments,<br />
soil cores were amended, respectively, with water and<br />
tannins extracted from D. octopetala leaves, and they<br />
were all maintained at 0°C during 45 days. In W/F and T/F,<br />
soil cores were also amended with water and tannin solution<br />
respectively, but then were stored at -6°C during<br />
15 days (day 15) and kept at 0°C for four more weeks.<br />
Phenolic metabolization<br />
At day 15, more than 10% of the added tannins were<br />
recovered from the soil samples, 12% for S/T (Stable/<br />
Tannin treatment) and 17% for F/T (Freezing/Tannin treatment)<br />
(non-significant difference, U = 2.5, P = 0.376).<br />
After 45 days, both temperature treatments had a recovery<br />
fraction of around 5%. In treatment W, no tannins were<br />
detected in the soils at days 15 and 45, while they were<br />
present in low but detectable amounts at day 0. When<br />
comparing the phenolic acids, significantly higher levels of<br />
protocatechuic acid (last aromatic degradation metabolite<br />
before ring fission) were observed in the treatment T, than<br />
in the treatment W, irrespective of temperature and sampling<br />
times (Fig. 1). The accumulation of this degradation<br />
product was higher in the F/T treatment than in the S/T<br />
treatment for both dates, indicating a better metabolizing<br />
of the tannins in soils submitted to the freezing treatment.<br />
Similar patterns were observed for other phenolic acids:<br />
vanillic and p-hydroxybenzoic acids (data not shown).<br />
Changes in microbial biomass and diversity<br />
Microbial and fungal biomasses and bacterial counts were<br />
not significantly affected by temperature or tannin amendment<br />
(Table 1). However, these treatments affected<br />
microbial diversity differently. The F/T and S/W treatments<br />
had the strongest impact on the bacterial communities<br />
(Fig. 2A). Moreover marked differences between day 15<br />
and day 45 are supported for all the treatments except for<br />
F/W.<br />
For crenarcheotes, we observed the formation of new<br />
SSCP peaks for all the treatments (data not shown). The<br />
F/T treatment had a contrasted effect on the structure<br />
(peak distribution) of the crenarcheote communities compared<br />
with other conditions (data not shown) as there<br />
were less peaks, which suggests the dominance of few<br />
phylotypes.<br />
Diversity of fungal communities was significantly<br />
affected for all conditions and especially for S/T and F/W.<br />
The SSCP profile of day 45 (F/T) was an outlier because<br />
Journal compilation © 2008 Society for Applied Microbiology and Blackwell Publishing Ltd, Environmental Microbiology, 10, 799–809<br />
No claim to original French government works
Fig. 1. A. Average tannins concentrations in soil amended with<br />
sterilized water (white bars) or a tannin solution (black bars). The<br />
concentration of tannins is negligible in the case of sterilized water<br />
amendment.<br />
B. Protocatechuic acid concentration in soils amended with<br />
sterilized water (white bars) or a tannin solution (black bars).<br />
Differences between water and tannin treatments (*P < 0.05) and<br />
between temperature treatments (a, b; P < 0.05) were tested with<br />
Mann–Whitney tests. n = 3 standard error of the mean.<br />
the data file containing the migration value for statistical<br />
analysis was corrupted. The longest distance corresponded<br />
to the F/W cores, which showed fewer peaks<br />
than the other treatments (Fig. 3D). The day 0 and S/W<br />
profiles (Fig. 3A and B) had more than 10 peaks. The S/T<br />
profiles (Fig. 3C) presented a low signal, but as many<br />
peaks as S/W and day 0. A broad analysis of the raw data<br />
for S/T revealed that the baseline increased, which may<br />
indicate the co-migration of numerous fungal phylotypes<br />
(Loisel et al., 2006). For all profiles, the predominant phylotypes<br />
became relatively more abundant between days<br />
15 and 45. Moreover, the F/T profiles presented more<br />
peaks than the S/T ones (Fig. 3E). These results suggest<br />
that tannins prevented the loss of fungal phylotypes due<br />
to freezing.<br />
Impact on carbon mineralization<br />
Between days 0 and 15, the total CO2 efflux measured<br />
with the F treatment was significantly lower (approximately<br />
two- to fourfold) than with the S treatment<br />
Tannin and temperature effect on microbial diversity, carbon and nitrogen cycles 801<br />
(Table 2). Although marginally significant, the tannin treatment<br />
(F/T) led to an increase (approximately twofold) in<br />
CO2 efflux between days 0 and 15 compared with the F/W<br />
treatment. However, the total CO2 efflux at 0°C was not<br />
affected by the presence of tannins.<br />
On day 15, when the temperature shifted from -6°C to<br />
0°C, the CO2 efflux doubled from soils of F/T treatment<br />
and increased fourfold in the F/W treatment. Between<br />
days 15 and 45, no additional differences were detected<br />
between the treatments with and without tannins<br />
(Table 2). These results indicated that tannins enhanced<br />
the CO2 efflux only with the freezing treatment between<br />
days 0 and 15.<br />
Impact on nitrogen cycling<br />
The nitrogen dissolved in the soil extracts was mainly in<br />
organic forms [~529.6–1416.7 mg Ng -1 dry weight (dw),<br />
90.4–99.6% of total dissolved nitrogen (TDN)], while<br />
ammonia (~3.2–67.1 mg Ng -1 dw, 0.3–8.7% of TDN) and<br />
nitrate/nitrite (0.1–10.2 mg Ng -1 dw, 0.0–1.3% of TDN)<br />
made up smaller proportions of the TDN. Total dissolved<br />
nitrogen and dissolved organic nitrogen (DON) soil contents<br />
were changed neither by the temperature (F versus<br />
S treatments, data not shown) nor by the addition of<br />
tannins (T versus W treatments). Within S treatment, net<br />
N mineralization rates between days 15 and 45 were not<br />
influenced by the presence of tannins, whereas they were<br />
significantly reduced in soils previously stored at -6°C (F<br />
treatment, Fig. 4A). This effect was even stronger in soils<br />
in the F/T treatment, for which we measured net N<br />
immobilization values suggesting that the production of<br />
inorganic N was not sufficient to compensate for its<br />
disappearance.<br />
Net mineralization potentials (NMP) measured on soil<br />
subsamples at days 0, 15 and 45 were 10–400 times<br />
Table 1. Microbial and fungal biomasses and bacterial count estimated<br />
from soil cores on days 15 and 45 (n = 3).<br />
Treatments<br />
Microbial<br />
biomass<br />
(mgCg -1 C)<br />
Fungal biomass<br />
(mg ergosterol g -1 C)<br />
Bacterial count<br />
(10 9 cells g -1 C)<br />
T15<br />
S/W 44.9 (11.9) aA 60.9 (12.6) aA 1.13 (0.13) aA<br />
F/W 45.8 (15.5) aA 182.1 (38.1) aA 1.46 (0.28) aA<br />
S/T 35.3 (8.6) aA 53.8 (5.2) aA 1.01 (0.06) aA<br />
F/T 38.0 (17.0) aA 94.1 (37.3) aA 1.12 (0.20) aA<br />
T45<br />
S/W 16.6 (2.2) aA 114.3 (18.1) aA 1.40 (0.34) aA<br />
F/W 48.1 (5.3) aA 232.0 (42.7) aA 1.59 (0.45) aA<br />
S/T 18.7 (6.3) aA 103.8 (20.3) aA 1.19 (0.50) aA<br />
F/T 19.3 (7.1) aA 117.2 (35.5) aA 0.89 (0.06) aA<br />
Differences between day 15 and day 45 were tested by Wilcoxon<br />
signed rank test (upper case, P < 0.05) and differences between<br />
treatment (temperature or tannin amendment) by Mann–Whitney rank<br />
sum test (lower case, P < 0.05). n = 3 standard error of the mean.<br />
Journal compilation © 2008 Society for Applied Microbiology and Blackwell Publishing Ltd, Environmental Microbiology, 10, 799–809<br />
No claim to original French government works
802 F. Baptist et al.<br />
Fig. 2. Neighbour-Joining trees of microbial communities under different treatments: = day 0; = S/W; = S/T, = F/W; = F/T. Lower<br />
cases indicate the day of treatments. Supported branches (bootstrap value >50%) are in bold. Grey corresponds to the SSCP replicates after<br />
pooling the three soil cores from the same treatment. Black corresponds to supported clustering of treatments. Edwards’s distances are shown<br />
by a scale bar.<br />
higher than the net N mineralization measured between<br />
days 15 and 45 (Fig. 4B and C). Yet, NMP increased<br />
during the incubation in the case of the F/W treatment but<br />
not in the F/T treatment. On days 15 and 45, NMP from<br />
soils amended with tannins were significantly lower than<br />
for the unamended ones (Fig. 4B). In treatment S, soils<br />
incubated with tannins (S/T) had also lower NMP than on<br />
soils amended with water (S/W) but only on day 15<br />
(Fig. 4C). Net mineralization potentials were therefore<br />
strongly reduced in F/T treatment compared with the<br />
others.<br />
Discussion<br />
In our study, the role of tannins was evaluated through the<br />
combination of biogeochemical analyses with molecular<br />
profiling approach. The few other studies which examined<br />
the impact of polyphenols through purified tannin addition<br />
focused on forested ecosystems, characterized by faster<br />
nutrient cycling and higher productivity (Bradley et al.,<br />
2000; Fierer et al., 2001). Furthermore, unlike those<br />
studies, we used undisturbed soil cores instead of composite<br />
and homogenized samples to maintain the vertical<br />
stratification and its associated physical and microbiological<br />
properties.<br />
Impact on carbon and nitrogen cycles<br />
The organic and inorganic nitrogen soil concentrations<br />
measured in the alpine soils, as well as the dominance of<br />
organic N forms, were in accordance with the literature<br />
(Tosca and Labroue, 1986; Lipson et al., 1999; Zeller<br />
et al., 2000). Similarly, CO2 efflux measurements were<br />
within the range of previous observations (Leifeld and<br />
Fuhrer, 2005; Schimel and Mikan, 2005). After 1 month,<br />
only a minor fraction of the added tannins was recovered<br />
from the amended soils. The disappearance of tannins<br />
could be explained either by degradation or by insolubilization,<br />
due to complexation with proteins or adsorption on<br />
organo-mineral soil fractions (Kaal et al., 2005; Nierop<br />
and Verstraten, 2006).<br />
In stable treatment, tannin addition had limited effects<br />
on C and N mineralization as well as on microbial biomass<br />
indicating (i) that tannins were not used as a significant<br />
extra C source and (ii) that they did not inhibit microbial<br />
communities. The slight increase in protocatechuic acid<br />
Table 2. Soil water content, daily mean CO2 efflux over the days<br />
0–15 and days 15–45.<br />
Treatments<br />
Soil water<br />
content (%)<br />
CO2 efflux<br />
(mg Cg -1 C day -1 )<br />
T0-T15<br />
S/W 33.4 (1.0) aA 318.8 (70.4) aA<br />
F/W 34.8 (3.8) aA 76.7 (7.8) bA<br />
S/T 37.6 (4.1) aA 267.9 (71.9) abA<br />
F/T 30.9 (4.5) aA 128.6 (19.2) abA<br />
T15-T45<br />
S/W 33.2 (1.2) aA 281.3 (131.0) aA<br />
F/W 34.9 (3.1) aA 269.4 (51.5) aB<br />
S/T 39.1 (4.2) aA 210.7 (23.7) aA<br />
F/T 34.0 (4.7) aA 273.8 (94.5) aB<br />
The differences between days 15 and 45 within each treatment<br />
(upper case, P < 0.05) were tested by Wilcoxon signed rank test and<br />
the differences between treatment (temperature or tannin addition)<br />
within each period (lower case, P < 0.05) were tested by Mann–<br />
Whitney rank sum test. n = 3 standard error of the mean.<br />
Journal compilation © 2008 Society for Applied Microbiology and Blackwell Publishing Ltd, Environmental Microbiology, 10, 799–809<br />
No claim to original French government works
Fig. 3. Capillary electrophoresis-SSCP profiles of fungal<br />
communities for each treatment. A = day 0; B = S/W; C = S/T; D<br />
= F/W; E = F/T. Black lines: day 15; grey lines: day 45. All profiles<br />
are displayed for an arbitrary fluorescence intensity interval of<br />
4000.<br />
Tannin and temperature effect on microbial diversity, carbon and nitrogen cycles 803<br />
Fig. 4. A. Net N mineralization rates between days 15 and 45 in<br />
soils for F and S treatments amended with sterilized water (white<br />
bars) or a tannin solution (black bars).<br />
B and C. Net N mineralization potentials in soils after 0, 15 and<br />
45 days of incubation in the F treatment (B) and the S treatment<br />
(C), amended with sterilized water (white bars) or a tannin solution<br />
(black bars). Mann–Whitney rank sum tests were performed to test<br />
for differences between treatment (temperature or tannin addition)<br />
within each period (lower case, P < 0.05). n = 3 standard error of<br />
the mean.<br />
Journal compilation © 2008 Society for Applied Microbiology and Blackwell Publishing Ltd, Environmental Microbiology, 10, 799–809<br />
No claim to original French government works
804 F. Baptist et al.<br />
indicated only weak tannin degradation. This suggests<br />
that tannins were preferentially adsorbed on organomineral<br />
soils or complexed with decomposing organic<br />
compounds (Fierer et al., 2001). But this hypothesis,<br />
largely mentioned in the literature, is hypothetical as efficient<br />
methods to quantify such insoluble compounds are<br />
missing (Lorenz et al., 2000; Kanerva et al., 2006). Also,<br />
we did not assess the impact of a prolonged exposure to<br />
tannins as it occurs in natural habitats, but rather try to<br />
mimic a pulse of tannins corresponding to the litter fall<br />
period. Thus, it should not be considered as a long-term<br />
effect.<br />
The incubation of alpine soils at -6°C led to a decrease<br />
in C mineralization between day 0 and day 15. Lower<br />
temperatures strongly affect soil processes by lowering<br />
microbial enzymatic activities (Schimel et al., 2004) but do<br />
not affect microbial biomass as already shown by others<br />
authors (Lipson et al., 2000; Groffman et al., 2001;<br />
Grogan et al., 2004). Surprisingly, higher CO2 effluxes<br />
were detected in F/T than in F/W treatments and higher<br />
concentrations of protocatechuic acid in F/T than in S/T<br />
treatments in the first step of the experiment. These<br />
results indicate a higher tannin degradation at -6°C.<br />
Added to limited microbial growth, this suggests that<br />
some microorganisms may be able to use this C source,<br />
unlike the populations present at 0°C (S/T). However, the<br />
lack of data on N mineralization between day 0 and day<br />
15 prevents us from drawing further conclusions.<br />
From day 15 to day 45, the only significantly affected<br />
process was net N mineralization, which decreased in<br />
F/W-treated alpine soils. This confirms that a prolonged<br />
pre-period of frost slowed down N cycling in alpine soils<br />
(Schimel et al., 2004). The reduction of metabolic activities<br />
in the soil microbial community may be responsible for<br />
this effect. The addition of tannins in our alpine soils<br />
amplified the freezing effect on net N mineralization<br />
described previously and even led to apparent N immobilization<br />
(F/T, Fig. 4A). Possibly, the complexing capacity<br />
of tannins may have been detected only when microorganisms<br />
were less active due to freezing, suggesting that<br />
the kinetics of N mineralization by living microorganisms<br />
was faster than that of abiotic N immobilization by tannins.<br />
Both processes occurred in the stable treatment, but N<br />
microbial mineralization was dominant and microorganisms<br />
transformed Norg into NH4 + and NO3 – in much larger<br />
quantities than could be complexed by tannins. As a<br />
result, we measured no tannin effect on net N mineralization<br />
in soils for the S treatment (measured as the amount<br />
of NH4 + and NO3 – produced).<br />
In F treatment, the reduction of microbial activities<br />
reduced the production of NH4 + and NO3 – , which did not<br />
compensate for the complexation by tannins (Fierer et al.,<br />
2001; Castells et al., 2003). In our experiment, this was<br />
perceived as a negative net N mineralization or an appar-<br />
ent NH4 + and NO3 – immobilization. This hypothesis is<br />
further supported by NMP results (at 30°C) which were<br />
significantly lower in soils amended with tannins, most<br />
probably due to complexation of organic compounds<br />
(Fierer et al., 2001).<br />
The high concentration of protocatechuic acid and C<br />
mineralization during the first step of freezing treatment<br />
suggests that the added tannins were metabolized despite<br />
very low temperatures. C mineralization was strongly<br />
affected by the temperature shift and no long-term effect of<br />
tannin addition was detected, possibly due to the shortage<br />
of easily decomposable tannin (Kraus et al., 2004). The<br />
absence of relationship between N immobilization and C<br />
mineralization between days 15 and 45 suggests a decoupling<br />
between both processes, as reported by Mutabaruka<br />
and colleagues (2007). This is probably because N immobilization<br />
is driven by both abiotic and biotic factors,<br />
whereas C mineralization depends on biotic controls.<br />
Impact on microbial diversity<br />
There have been several studies of microbial diversity<br />
fingerprints for bacterial communities in mesocosm<br />
experiments (Hewson et al., 2003; Hendrickx et al., 2005;<br />
Lejon et al., 2007), but none, in alpine soils, were carried<br />
out on the three main groups of microorganisms as we did<br />
here. We determined three distinct patterns, one for each<br />
microbial community. Previous studies showed that the<br />
bacterial SSCP patterns are specific for a given bacterial<br />
community (Godon et al., 1997; Mohr and Tebbe, 2006;<br />
Zinger et al., 2007a). Here, the bacteria profiles showed a<br />
high baseline suggesting a large number of rare phylotypes<br />
(Loisel et al., 2006), preventing the detection of<br />
minor changes. We found effects supported by bootstrapping<br />
for most treatments. However, because of the high<br />
baseline masking the community shifts (Fig. 3), the<br />
branch length remained very short between treatments<br />
(Fig. 2). Therefore, minor relevant changes in bacterial<br />
diversity cannot be detected and a more detailed study<br />
is needed to assess the tannin impact on bacterial<br />
communities.<br />
For the crenarcheotes, freezing and tannin amendment<br />
resulted in a reduction in the number of peaks. Possibly,<br />
the convergence of both factors led to the disappearance<br />
of some crenarcheote phylotypes. However, the effects<br />
on nutrient cycling were likely to be negligible, as no<br />
decrease in population biomass or in C mineralization<br />
was detected.<br />
Fungal communities, whose biomasses were found to<br />
increase during winter (Schadt et al., 2003), showed<br />
strong responses to all treatments. Tannin amendment<br />
associated with low temperature maintained a relatively<br />
high diversity whereas freezing temperatures alone led to<br />
a decrease in fungal richness. This result suggests that<br />
Journal compilation © 2008 Society for Applied Microbiology and Blackwell Publishing Ltd, Environmental Microbiology, 10, 799–809<br />
No claim to original French government works
some wintertime fungal strains may be able to benefit<br />
from the addition of tannins, as it has been already shown<br />
for bacterial communities (Chowdhury et al., 2004) or<br />
fungal populations (Mutabaruka et al., 2007). Previous<br />
studies on alpine meadows also suggested that a strong<br />
supply of allelochemical-rich litter in the fall may select<br />
wintertime populations able to grow on phenolic compounds<br />
(Lipson et al., 2002; Schmidt and Lipson, 2004).<br />
Unexpectedly, the phylotypes reacted differently in<br />
response to the addition of these compounds, depending<br />
on the thermic regime. This interaction may be related to<br />
the presence of psychrophilic fungi which were excluded<br />
at relatively high temperature. Another explanation is that<br />
the available labile C, which decreased at lower temperatures,<br />
created a selective pressure in favour of fungal<br />
strains which metabolize more resistant C substrates<br />
(Bradley et al., 2000).<br />
Ecological implications<br />
CO2 efflux measurements showed that there were significant<br />
levels of microbial activities even well below 0°C<br />
(Brooks et al., 1998). In snow-covered ecosystems, litter<br />
decomposition occurs principally during the winter<br />
(Hobbie and Chapin, 1996) and recent studies indicate<br />
that winter microbial communities degrade phenolic compounds<br />
(vanillic and salicylic acids) better than summer<br />
microbial communities (Schmidt et al., 2000; Lipson et al.,<br />
2002). However, because of inconsistent snow cover<br />
during winter, dry meadows frequently experience very<br />
low temperatures (< -5°C) reducing soil microbial activity<br />
and litter decomposition rates (F. Baptist, unpubl. results,<br />
O’Lear and Seastedt, 1994). Furthermore, high concentrations<br />
of tannins in the fresh litter of D. octopetala, which<br />
is a dominant species in this ecosystem, potentially contribute<br />
to a decrease in N mineralization by complexing<br />
soil organic compounds (Northup et al., 1995; Hattenschwiler<br />
and Vitousek, 2000). Severe soil edapho-climatic<br />
conditions probably act by inhibiting microbial activity.<br />
However, we detected no toxic effects of compounds<br />
extracted from D. octopetala on microbial activity which<br />
indicates that plants producing phenolic compounds may<br />
select microbial populations able to use these compounds,<br />
or at least able to withstand them (Schmidt et al.,<br />
2000). Changes in phylogenetic composition coupled with<br />
higher C mineralization and protocatechuic acid contents<br />
showed that freezing temperatures selected psychrophilic<br />
fungi. These may be able to degrade D. octopetala’s<br />
tannins, and their activities are potentially initiated by a<br />
decrease in temperature. However, this particular effect of<br />
temperature remains unclear and could also be related to<br />
a decrease in labile C availability.<br />
This study illustrates how soil and climatic conditions<br />
interact with soil microorganisms to enhance the metabo-<br />
Tannin and temperature effect on microbial diversity, carbon and nitrogen cycles 805<br />
lization of the tannins released by the plants which dominate<br />
alpine ecosystems. The degradation of recalcitrant<br />
compounds, during winter, produces a less recalcitrant<br />
litter which becomes available by the time plant growth<br />
starts. This limits nutrient immobilization thanks to a<br />
reduced litter C/N ratio (Schmidt and Lipson, 2004). Consequently,<br />
the microbial catabolism of these compounds<br />
during winter is of functional importance. A variation in<br />
snowfall might affect microbial functional diversity with<br />
cascading biogeochemical consequences on ecosystem<br />
processes and carbon sequestration. Nevertheless,<br />
further investigations remain necessary to identify the<br />
exact role of microorganisms in tannin catabolism and<br />
their vulnerability to climate change.<br />
Experimental procedures<br />
Field site<br />
The study site was located in the Grand Galibier massif<br />
(French south-western Alps, 45°0.05′N, 06°0.38′E) on an<br />
east facing slope at 2520 m. The growing season lasts<br />
around 169 6 days and the mean soil temperature is<br />
7.7 1.5°C in summer and -2.2 1.7°C in winter. The<br />
mean soil temperature reaches very low values (< -5°C)<br />
during relatively long periods because of inconsistent<br />
snow cover. Dry meadow soils are classified as typical<br />
alpine rankers. The bedrock is calcareous shales. The<br />
dominant plant community in the field site consist mainly<br />
of K. myosuroides (Cyperaceae) and D. octopetala<br />
(Rosaceae). Fifteen soil cores were sampled in October 2005<br />
using sterilized (ethyl alcohol 90°) PVC pipes (h = 10 cm,<br />
Ø = 10 cm) and tools, to avoid contamination. In the laboratory,<br />
the plants were separated from the soil cores which were<br />
covered with perforated plastic bags and stored at 0°C until<br />
the beginning of the experiment.<br />
Experimental design<br />
On day 0, three soil cores were destructively harvested and<br />
used as controls (Table 3), six soil cores were amended with<br />
19 ml of a tannin solution (with a mean of 749 mg of C/core or<br />
32.4 mg C g -1 soil C, tannin treatment, T) and six cores with<br />
sterilized water (water treatment, W) to reach similar gravimetric<br />
soil moisture contents (34.2 1.7% and 34.1 1.6%<br />
for cores amended with tannins and water respectively).<br />
Three W cores and three T cores were incubated at -6°C for<br />
2 weeks (freeze treatment, F) and then at 0°C for four more<br />
weeks. The six remaining cores were kept at 0°C (stable<br />
temperature treatment, S) during the whole period. To limit<br />
temperature gradients inside the incubators, the soil cores<br />
were regularly rotated. At the end of the first period (day 15),<br />
half of each soil core (3 S/T, 3 S/W, 3 F/T, 3 F/W) was<br />
harvested for a first analysis (longitudinal section). To limit<br />
disturbance, the harvested soil was replaced by a sterile and<br />
closed bag full of sand. The remaining soil cores were placed<br />
back in the incubator for four more weeks at 0°C and then<br />
were harvested for final analysis.<br />
Journal compilation © 2008 Society for Applied Microbiology and Blackwell Publishing Ltd, Environmental Microbiology, 10, 799–809<br />
No claim to original French government works
806 F. Baptist et al.<br />
Table 3. A. Soil characteristics of the cores. B. Initial parameters<br />
estimated on the three control soil cores.<br />
(A) Soil characteristics<br />
Soil water content (%) 32.9 (3.7)<br />
Bulk soil density on < 2 mm fraction (g cm -3 ) 0.24 (0.04)<br />
Organic matter (%) 16.9 (4.3)<br />
pH (H2O) 5.1 (0.1)<br />
pH (KCl) 4.1 (0.1)<br />
Grain size analysis<br />
Clay (< 2 mm) 9.7 (0.5)<br />
Silt (2–50 mm) 41.4 (1.0)<br />
Sand (50–2000 mm) 48.6 (1.2)<br />
(B) Initial parameters (T0)<br />
Microbial biomass (mg C g -1 C) 170.6 (37.3)<br />
Bacterial count (10 9 cells g -1 C) 1.45 (0.21)<br />
Fungal biomass (mg ergosterol g -1 C) 130.2 (14.0)<br />
Tannin (mg g -1 C) 0.30 (0.10)<br />
NO3 – (mg Ng -1 soil) 0.10 (0.02)<br />
NH4 + (mg Ng -1 soil) 3.25 (0.10)<br />
Norg (mg Ng -1 soil) 914.2 (65.7)<br />
Potential mineralization<br />
NH4 production (mg Ng -1 soil day -1 ) 12.1 (2.9)<br />
Norg production (mg Ng -1 soil day -1 ) 145.9 (40.9)<br />
n = 3 standard error of the mean.<br />
At each sampling time (day 0, day 15 and day 45), the soils<br />
were sieved (2 mm) and further analysed to determine the<br />
tannins and phenolic acid contents, microbial and fungal biomasses,<br />
bacterial counts, microbial diversity and nitrogen<br />
mineralization rates. The CO2 efflux was measured between<br />
each harvest.<br />
Soil characterization<br />
Soil water content, pHH2O, pHKCl, bulk soil density and texture<br />
were determined following standard methods (Robertson<br />
et al., 1999). The SOM content was determined by loss-onignition<br />
and the C mass was calculated by dividing SOM<br />
fraction by 1.72. In order to determine bulk soil density, the<br />
stones mass was determined and converted to stone volume<br />
using mean stone density of 2650 kg m -3 (Hillel, 1971).<br />
Tannin extraction and phenolic analysis<br />
Dryas octopetala leaves were collected at the end of July, and<br />
air-dried. Tannins were extracted from about 300 g of ground<br />
leaves, using liquid sequential extractions and a final purification<br />
on Sephadex LH-20 (Preston, 1999). The elemental<br />
composition of the dried final fraction was obtained by CHN<br />
analysis (C %: 62.4; N %: 0). The addition of tannins was<br />
performed with a solution of 15.85 g of purified tannins dissolved<br />
in 250 ml of distilled water. Proanthocyans (here after<br />
referred to tannins) were quantified in the soil extracts by<br />
spectrophotometry, after hydrolysis with butanol/HCl using<br />
the proanthocyanidin assay (Preston, 1999). The calibration<br />
curves were prepared with a previously purified proanthocyan<br />
fraction from D. octopetala. Phenolic acids were<br />
obtained (5 g FW) by a double ethanolic extraction (ethanol<br />
70%) under reflux. Aliquots (20 ml) of the ethanolic solution<br />
filtered at 0.5 mm, were used for high-performance liquid<br />
chromatography (HPLC) analysis on a RP C18 mBondapak<br />
column (4.6 mm ¥ 250 mm) monitored by a Waters 600 Controller<br />
with a UV detection at 260 nm (Waters 996 PDA).<br />
Phenolic acids were separated using a linear gradient from 0<br />
to 20% of solvent B (acetonitrile) in solvent A (acetic acid<br />
0.5% in distilled water) in 45 min, at 1.5 ml min -1 . Standards<br />
of common phenolic acids (including protocatechuic) were<br />
obtained from Sigma-Aldrich (L’Isle d’Abeau, France).<br />
Nitrogen mineralization<br />
Nitrogen was extracted from fresh soil samples with 2 M KCl.<br />
The soil extracts were analysed for ammonia (NH4 + ) and<br />
nitrate/nitrite (NO3 – /NO2 – ) contents using an FS-IV autoanalyser<br />
(OI-Analytical, College <strong>Station</strong>, TX). The TDN content in<br />
the soil extracts was measured after oxidation with K2S2O8 at<br />
120°C. The DON contents in the soil extracts (mg Ng -1 dw)<br />
were calculated as: [DON = TDN - (N-NH4 + ) + (N-NO3 – /<br />
NO2 – )]. The net nitrogen mineralization (MINnet, mg Ng -1 dw<br />
day -1 ) between day 15 and day 45 was calculated as:<br />
MINnet = [[(-NH4 + ) + (N-NO3 – /NO2 – )]day45 - [(N-NH4 + ) + (N-NO3 – /<br />
NO2 – )]day15]/dw/30. MINnet was not calculated between day 0<br />
and day 15, because the day 15 did not originate from the<br />
same soil cores as those for day 0. The NMP was determined<br />
from subsamples, using anaerobic incubations (Waring and<br />
Bremner, 1964). This protocol allows comparisons of relative<br />
organic matter degradability in different soils. Under optimized<br />
conditions (dark, 7 day, 30°C, anaerobic) organic N in<br />
fresh soils was mineralized and accumulated as NH4 + . The<br />
difference between the NH4 + in the fresh soil (t1) and after<br />
the anaerobic incubation (t2) gave the N mineralization potential:<br />
NMP (mg N-NH4 g -1 dw day -1 ) = [[(N-NH4) t2 - (N-NH4)<br />
t1]/dw/7].<br />
Soil CO2 efflux<br />
Throughout the experiment, CO2 efflux measurements were<br />
conducted just after tannin amendment (day 0), one before<br />
temperature shift (day 15) and three times between days 15<br />
and 45 on all soil cores. The cores were enclosed in a<br />
hermetic Plexiglas chamber equilibrated to 400 p.p.m. prior<br />
to measurements. The chamber was connected to a LiCor<br />
6200 gas exchange systems (LiCor, Lincoln, NE, USA). Data<br />
recording lasted 3–5 min, depending on the signal fluctuations,<br />
and the soil temperature was monitored.<br />
Microbial community analyses<br />
Microbial biomass and ergosterol determination. Microbial<br />
carbon biomass was determined by the fumigation-extraction<br />
method (Jocteur Monrozier et al., 1993; Martins et al., 1997)<br />
adapted from Amato and Ladd (1988). Duplicated soil<br />
samples (10 g) were fumigated for 10 days with chloroform.<br />
Total organic nitrogen was extracted with 20 ml of 2 m KCl<br />
from both the non-fumigated and fumigated soil samples (T0,<br />
T10), microbial nitrogen biomass being determined from the<br />
difference between the two treatments. After reaction with<br />
ninhydrin, the absorbance (570 nm) of all samples was deter-<br />
Journal compilation © 2008 Society for Applied Microbiology and Blackwell Publishing Ltd, Environmental Microbiology, 10, 799–809<br />
No claim to original French government works
mined by spectrophotometry using leucin as standard. The<br />
microbial carbon biomass calculated using a conversion<br />
factor of 21 (Amato and Ladd, 1988; Martins et al., 1997). The<br />
soil ergosterol content was evaluated as an indirect estimate<br />
of the soil fungal biomass (Nylund and Wallander, 1992; Gors<br />
et al., 2007). Ergosterol was extracted from 5 g of soil (FW)<br />
with 30 ml of 99.6% ethanol by shaking for 30 min at 250 r.<br />
p.m. The soil solution was filtered and immediately submitted<br />
to HPLC under isocratic flow of 1.5 ml min -1 of MeOH, on a<br />
Lichrosorb RP18 column (250 ¥ 4.6 mm, 5 mm). Calibration<br />
curves at 282 nm were recorded with standard ergosterol<br />
solution from Sigma-Aldrich (L’Isle d’Abeau, France).<br />
Bacterial counts. The soil bacterial counting was conducted<br />
using the method described by Martins and colleagues<br />
(1997). Briefly, 10 g of soil (duplicated) was blended in 50 ml<br />
of sterile NaCl 0.9%. After flocculation of the soil particles, an<br />
aliquot of the soil suspension (1 ml) was collected and used<br />
to enumerate the bacteria after successive dilutions. One<br />
millilitre of the diluted suspension was filtered on 0.2 mm<br />
polycarbonate membrane filters (Millipore). Bacteria were<br />
then stained using a sterile solution (filtered at 0.2 mm) of<br />
4′,6-diamidino-2-phenylindole (DAPI) and enumerated by<br />
direct counting with a motorized epifluorescent microscope<br />
(Axioscope, Zeiss) under UV excitation (Hg lamp) with a filter<br />
set for DAPI (365 nm) at 1000-fold magnification.<br />
SSCP analysis of microbial diversity. DNA extraction and<br />
PCR: the protocols for fungal and prokaryotic signatures<br />
have already been described in Zinger and colleagues<br />
(2007a,b). Briefly, the soil DNA was amplified using microbial<br />
community-specific primers and submitted to capillary<br />
electrophoresis-SSCP (CE-SSCP). The 16S rRNA gene was<br />
used as the prokaryotic specific marker. The bacterial primers<br />
were W49 and W104-FAM (Zumstein et al., 2000; Duthoit<br />
et al., 2003) and the crenarcheaotal primers were 133FN6F-<br />
NED and 248R5P (Sliwinski and Goodman, 2004). Fungal<br />
ITS1 was amplified with the primers ITS5 and ITS2-HEX<br />
(White et al., 1990). The soil DNA extraction was performed<br />
with the Power Soil TM Extraction Kit (MO BIO Laboratories,<br />
Ozyme, St Quentin en Yvelines, France) using 250 mg (fresh<br />
weight) of soil per core sample, according to manufacturer’s<br />
instructions. The DNA extracts from the same-condition cores<br />
were then pooled to limit the effects of soil spatial<br />
heterogeneity. The PCR reactions (25 ml) were set up as<br />
follows: 2.5 mM of MgCl2, 1¥ of AmpliTaq Gold TM buffer,<br />
20gl -1 of bovine serum albumin, 0.1 mM of each dNTP,<br />
0.26 mM of each primer, 2 U of DNA polymerase (Applied<br />
Biosystems, Courtaboeuf, France) and 1 ml of DNA (1–10 ng<br />
DNA). The PCR reaction was performed as follows: an initial<br />
step at 95°C (10 min), followed by 30 cycles at 95°C (30 s),<br />
56°C (15 s) and 72°C (15 s), and final step at 72°C (7 min).<br />
The PCR products were visualized on a 1.5% agarose gel.<br />
Then, amplicons of each microbial community were then<br />
pooled for each sample to perform multiplex CE-SSCP. Capillary<br />
electrophoresis-SSCP: 1 ml of the PCR product was<br />
mixed with 10 ml formamide Hi-Di (Applied Biosystems, Courtaboeuf,<br />
France), 0.2 ml standard internal DNA molecular<br />
weight marker Genescan-400 HD ROX (Applied Biosystems,<br />
Courtaboeuf, France), and 0.5 ml NaOH (0.3 M). The sample<br />
mixtures were denatured at 95°C for 5 min and immediately<br />
cooled on ice before loading on the instrument. The non-<br />
Tannin and temperature effect on microbial diversity, carbon and nitrogen cycles 807<br />
denaturing polymer consisted of 5% CAP polymer, 10% glycerol<br />
and 3100 buffer. Capillary electrophoresis-SSCP was<br />
performed on an ABI PRISM 3130 XL Genetic Analyzer<br />
(Applied Biosystems, Courtaboeuf, France) using a 36-cmlong<br />
capillary. The injection time and voltage were set to 22 s<br />
and 6 kV. Electrophoresis was performed for 35 min. The<br />
CE-SSCP profiles were normalized in order to control for<br />
differences in the total fluorescence intensity between<br />
profiles.<br />
Statistical analysis. We tested for differences between the<br />
temperature and tannin amendment treatments using Mann–<br />
Whitney rank sum test (P < 0.05) (Statistica 5.0, Statsoft.<br />
(1995) Statistica 5.0 Software. Statsoft, Tulsa, USA). Paired<br />
differences between days 15 and 45 sampling were tested<br />
using the Wilcoxon signed rank test (P < 0.05). The normalized<br />
profiles of SSCP were analysed by Neighbour-Joining<br />
analysis based on a matrix of Edwards distances (Edwards,<br />
1971). The robustness of the resulting tree was assessed<br />
using 1000 bootstraps. The data analysis was performed<br />
using the Ape package of the R software (RDevelopment-<br />
CoreTeam, 2006).<br />
Acknowledgements<br />
We gratefully acknowledge Olivier Alibeu, Mathieu Buffet,<br />
Alice Durand, Niu Kechang, Claire Molitor and Tarafa Mustafa<br />
for their help in the field and in the laboratory. Logistical<br />
supports were provided by the ‘Laboratoire d’Ecologie <strong>Alpine</strong>’<br />
(UMR 5553 CNRS/UJF, University <strong>Joseph</strong> <strong>Fourier</strong>) and the<br />
‘<strong>Station</strong> <strong>Alpine</strong> <strong>Joseph</strong> <strong>Fourier</strong>’, the alpine field station of the<br />
University <strong>Joseph</strong> <strong>Fourier</strong>. This study was supported by<br />
CNRS and MicroAlpes project funding (ANR). We thank<br />
Sophie Rickebusch, Stéphane Reynaud and Michel Tissut for<br />
their helpful comments on an earlier version of this<br />
manuscript. We also thank the technical platform MOME of<br />
the Envirhonalp Pole, Rhône-Alpes Region.<br />
References<br />
Amato, M., and Ladd, J.N. (1988) Essay for microbial<br />
biomass based on ninhydrin – reactive nitrogen in extracts<br />
of fumigated soils. Soil Biol Biochem 20: 107–114.<br />
Beniston, M. (2003) Climatic change in mountain regions: a<br />
review of possible impacts. Clim Change 59: 5–31.<br />
Bradley, R.L., Titus, B.D., and Preston, C.P. (2000) Changes<br />
to mineral N cycling and microbial communities in black<br />
spruce humus after additions of (NH4)(2)SO4 and condensed<br />
tannins extracted from Kalmia angustifolia and<br />
balsam fir. Soil Biol Biochem 32: 1227–1240.<br />
Brooks, P.D., Williams, M.W., and Schmidt, S.K. (1998) Inorganic<br />
N and microbial biomass dynamics before and during<br />
spring snowmelt. Biogeochemistry 43: 1–15.<br />
Castells, E., Penuelas, J., and Valentine, D.W. (2003) Influence<br />
of the phenolic compound bearing species Ledum<br />
palustre on soil N cycling in a boreal hardwood forest. Plant<br />
Soil 251: 155–166.<br />
Choler, P. (2005) Consistent shifts in alpine plants traits<br />
along a mesotopographical gradient. Arct Antarct Alp Res<br />
37: 444–453.<br />
Chowdhury, S.P., Khanna, S., Verma, S.C., and Tripathi, A.K.<br />
Journal compilation © 2008 Society for Applied Microbiology and Blackwell Publishing Ltd, Environmental Microbiology, 10, 799–809<br />
No claim to original French government works
808 F. Baptist et al.<br />
(2004) Molecular diversity of tannic acid degrading bacteria<br />
isolated from tannery soil. J Appl Microbiol 97: 1210–<br />
1219.<br />
Cornelissen, J.H.C., Perez Harguindeguy, N., Diaz, S.,<br />
Grime, J.P., Marzano, B., Cabido, M., et al. (1999) Leaf<br />
structure and defence control litter decomposition rate<br />
across species and life forms in regional floras on two<br />
continents. New Phytol 143: 191–200.<br />
Duthoit, F., Godon, J.J., and Montel, M.C. (2003) Bacterial<br />
community dynamics during production of registered designation<br />
of origin Salers cheese as evaluated by 16S rRNA<br />
gene single-strand conformation polymorphism analysis.<br />
Appl Environ Microbiol 69: 3840–3848.<br />
Edwards, A.W.F. (1971) Distance between populations on<br />
the basis of gene frequencies. Biometrics 27: 873–881.<br />
Fierer, N., Schimel, J.P., Cates, R.G., and Zou, J. (2001)<br />
Influence of balsam poplar tannin fractions on carbon and<br />
nitrogen dynamics in Alaskan taiga floodplain soils. Soil<br />
Biol Biochem 33: 1827.<br />
Godon, J.-J., Zumstein, E., Dabert, P., Habouzit, F., and<br />
Moletta, R. (1997) Molecular microbial diversity of an<br />
anaerobic digestor as determined by small-subunit rDNA<br />
sequence analysis. Appl Environ Microbiol 63: 2802–2813.<br />
Gors, S., Schumanna, R., Haubnerb, N., and Karstena, U.<br />
(2007) Fungal and algal biomass in biofilms on artificial<br />
surfaces quantified by ergosterol and chlorophyll a as<br />
biomarkers. Int Biodeterior Biodegradation 60: 50–59.<br />
Groffman, P.M., Driscoll, C.T., Fahey, T.J., Hardy, J.P.,<br />
Fitzhugh, R.D., and Tierney, G.L. (2001) Effects of mild<br />
winter freezing on soil nitrogen and carbon dynamics in a<br />
northern hardwood forest. Biogeochemistry 56: 191–213.<br />
Grogan, P., Michelsen, A., Ambus, P., and Jonasson, S.<br />
(2004) Freeze-thaw regime effects on carbon and nitrogen<br />
dynamics in sub-arctic heath tundra mesocosms. Soil Biol<br />
Biochem 36: 641–654.<br />
Hattenschwiler, S., and Vitousek, P.M. (2000) The role of<br />
polyphenols in terrestrial ecosystem nutrient cycling.<br />
Trends Ecol Evol 15: 238.<br />
Hendrickx, B., Dejonghe, W., Boenne, W., Brennerova, M.,<br />
Cernik, M., Lederer, T., et al. (2005) Dynamics of an oligotrophic<br />
bacterial aquifer community during contact with a<br />
groundwater plume contaminated with benzene, toluene,<br />
ethylbenzene, and xylenes: an in situ mesocosm study.<br />
Appl Environ Microbiol 71: 3815–3825.<br />
Hewson, I., Vargo, G.A., and Fuhrman, J.A. (2003) Bacterial<br />
diversity in shallow oligotrophic marine benthos and overlying<br />
waters: effects of virus infection, containment, and<br />
nutrient enrichment. Microb Ecol 46: 322.<br />
Hillel, D. (1971) Soil and Water; Physical Principles and<br />
Processes. New York, USA: Academic Press New York.<br />
Hobbie, S.E., and Chapin, F.S. (1996) Winter regulation of<br />
tundra litter carbon and nitrogen dynamics. Biogeochemistry<br />
35: 327–338.<br />
Hobbie, S.E., Schimel, J.P., Trumbore, S.E., and Randerson,<br />
J.R. (2000) Controls over carbon storage and turnover in<br />
high-latitude soils. Glob Change Biol 6 (Suppl. 1): 196–210.<br />
Jocteur Monrozier, L., Guez, P., Chalamet, A., Bardin, R.,<br />
Martins, J.M.F., and Gaudet, J.P. (1993) Distribution<br />
of micro-organisms and fate of xenobiotic molecules in<br />
unsaturated soil environments. Sci Total Environ 136: 121–<br />
133.<br />
Kaal, J., Nierop, K.G.J., and Verstraten, J.M. (2005) Retention<br />
of tannic acid and condensed tannin by Fe-oxidecoated<br />
quartz sand. J Colloid Interface Sci 287: 72–79.<br />
Kanerva, S., Kitunen, V., Kiikkila, O., Loponen, J., and<br />
Smolander, A. (2006) Response of soil C and N transformations<br />
to tannin fractions originating from Scots pine<br />
and Norway spruce needles. Soil Biol Biochem 38: 1364–<br />
1374.<br />
Keller, F., Goyette, S., and Beniston, M. (2005) Sensitivity<br />
analysis of snow cover to climate change scenarios and<br />
their impact on plant habitats in alpine terrain. Clim Change<br />
72: 299–319.<br />
Knorr, W., Prentice, I.C., House, J.I., and Holland, E.A.<br />
(2005) Long-term sensitivity of soil carbon turnover to<br />
warming. Nature 433: 298–301.<br />
Kraus, T.E.C., Dahlgren, R.A., and Zasoski, R.J. (2003)<br />
Tannins in nutrient dynamics of forest ecosystems – a<br />
review. Plant Soil 256: 41–66.<br />
Kraus, T.E.C., Zasoski, R.J., Dahlgren, R.A., Horwath, W.R.,<br />
and Preston, C.M. (2004) Carbon and nitrogen dynamics in<br />
a forest soil amended with purified tannins from different<br />
plant species. Soil Biol Biochem 36: 309.<br />
Leifeld, J., and Fuhrer, J. (2005) The temperature response<br />
of CO2 production from bulk soils and soil fractions is<br />
related to soil organic matter quality. Biogeochemistry 75:<br />
433–453.<br />
Lejon, D.P.H., Nowak, V., Bouko, S., Pascault, N., Mougel,<br />
C., Martins, J.M.F., and Ranjard, L. (2007) Fingerprinting<br />
and diversity of bacterial copA genes in response to soil<br />
types, soil organic status and copper contamination. FEMS<br />
Microbiol Ecol 61: 424–437.<br />
Lipson, D.A., and Schmidt, S.K. (2004) Seasonal changes in<br />
an alpine soil bacterial community in the Colorado Rocky<br />
Mountains. Appl Environ Microbiol 70: 2867–2879.<br />
Lipson, D.A., Schmidt, S.K., and Monson, R.K. (1999)<br />
Links between microbial population dynamics and nitrogen<br />
availability in an alpine ecosystem. Ecology 80: 1623–<br />
1631.<br />
Lipson, D.A., Schmidt, S.K., and Monson, R.K. (2000)<br />
Carbon availability and temperature control the postsnowmelt<br />
decline in alpine soil microbial biomass. Soil Biol<br />
Biochem 32: 441–448.<br />
Lipson, D.A., Schadt, C.W., and Schmidt, S.K. (2002)<br />
Changes in soil microbial community structure and function<br />
in an alpine dry meadow following spring snow melt.<br />
Microb Ecol 43: 307–314.<br />
Loisel, P., Harmand, J., Zemb, O., Latrille, E., Lobry, C.,<br />
Delgenes, J.-P., and Godon, J.-J. (2006) Denaturing gradient<br />
electrophoresis (DGE) and single-strand conformation<br />
polymorphism (SSCP) molecular fingerprintings<br />
revisited by simulation and used as a tool to measure<br />
microbial diversity. Environ Microbiol 8: 720–731.<br />
Lorenz, K., Preston, C.M., Raspe, S., Morrison, I.K., and<br />
Feger, K.H. (2000) Litter decomposition and humus characteristics<br />
in Canadian and German spruce ecosystems:<br />
information from tannin analysis and C-13 CPMAS NMR.<br />
Soil Biol Biochem 32: 779–792.<br />
McGuire, A.D., Melillo, J.M., Randerson, J.T., Parton, W.J.,<br />
Heimann, M., Meier, R.A., et al. (2000) Modeling the<br />
effects of snowpack on heterotrophic respiration across<br />
northern temperate and high latitude regions: comparison<br />
Journal compilation © 2008 Society for Applied Microbiology and Blackwell Publishing Ltd, Environmental Microbiology, 10, 799–809<br />
No claim to original French government works
with measurements of atmospheric carbon dioxide in high<br />
latitudes. Biogeochemistry 48: 91–114.<br />
Mack, M.C., Schuur, E.A.G., Bret Harte, M.S., Shaver, G.R.,<br />
and Chapin, F.S. (2004) Ecosystem carbon storage in<br />
arctic tundra reduced by long-term nutrient fertilization.<br />
Nature 431: 440–443.<br />
Martins, J.M.F., Jocteur Monrozier, L., Chalamet, A., and<br />
Bardin, R. (1997) Microbial response to repeated applications<br />
of low concentrations of Pentachlorophenol in an<br />
Alfisol under pasture. Chemosphere 35: 1637–1650.<br />
Mohr, K.I., and Tebbe, C.C. (2006) Diversity and phylotype<br />
consistency of bacteria in the guts of three bee species<br />
(Apoidea) at an oilseed rape field. Environ Microbiol 8:<br />
258–272.<br />
Monson, R.K., Lipson, D.L., Burns, S.P., Turnipseed, A.A.,<br />
Delany, A.C., Williams, M.W., and Schmidt, S.K. (2006)<br />
Winter forest soil respiration controlled by climate and<br />
microbial community composition. Nature 439: 711–<br />
714.<br />
Mutabaruka, R., Hairiah, K., and Cadisch, G. (2007) Microbial<br />
degradation of hydrolysable and condensed tannin<br />
polyphenol-protein complexes in soils from different landuse<br />
histories. Soil Biol Biochem 39: 1479–1492.<br />
Nemergut, D.R., Costello, E.K., Meyer, A.F., Pescador, M.Y.,<br />
Weintraub, M.N., and Schmidt, S.K. (2005) Structure and<br />
function of alpine and arctic soil microbial communities.<br />
Res Microbiol 156: 775–784.<br />
Nierop, K.G.J., and Verstraten, J.M. (2006) Fate of tannins in<br />
corsican pine litter. J Chem Ecol 32: 2709–2719.<br />
Northup, R.R., Yu, Z., Dahlgren, R.A., and Vogt, K.A. (1995)<br />
Polyphenol control of nitrogen release from pine litter.<br />
Nature 377: 227–229.<br />
Nylund, J.E., and Wallander, H. (1992) Ergosterol analysis as<br />
a means of quantifying mycorrhizal biomass. In Methods in<br />
Microbiology. Norris, J.R., Read, D.J., and Varna, A.K.<br />
(eds). London, UK: Academic press, pp. 77–88.<br />
O’Lear, H.A., and Seastedt, T.R. (1994) Landscape patterns<br />
of litter decomposition in alpine tundra. Oecologia 99:<br />
95–101.<br />
Preston, C.A. (1999) Condensed tannins of salal (Gaultheria<br />
shallon Pursh): a contributing factor to seedling,<br />
‘growth-check’ on northern Vancouver island? In Plant<br />
Polyphenols 2: Chemistry, Biology, Pharmacology,<br />
Ecology. Gross, G.G., Hemingway, R.W., and Yoshida, T.<br />
(eds). New York, USA: Kluwer Academic/Plenum Publishers,<br />
pp. 825–841.<br />
RDevelopmentCoreTeam (2006) R: A Language and Environment<br />
for Statistical Computing. Vienna, Austria: R Foundation<br />
for Statistical Computing.<br />
Robertson, G.P., Coleman, D.C., Bledsoe, C.S., and Sollins,<br />
P. (1999) Standard Soil Methods for Long-Term Ecological<br />
Research. New York, USA: Oxford University Press.<br />
Schadt, C.W., Martin, A.P., Lipson, D.A., and Schmidt, S.K.<br />
(2003) Seasonal dynamics of previously unknown fungal<br />
lineages in tundra soils. Science 301: 1359–1361.<br />
Tannin and temperature effect on microbial diversity, carbon and nitrogen cycles 809<br />
Schimel, J.P., and Mikan, C. (2005) Changing microbial substrate<br />
use in Arctic tundra soils through a freeze-thaw<br />
cycle. Soil Biol Biochem 37: 1411.<br />
Schimel, J.P., Bilbrough, C., and Welker, J.M. (2004)<br />
Increased snow depth affects microbial activity and nitrogen<br />
mineralization in two Arctic tundra communities. Soil<br />
Biol Biochem 36: 217.<br />
Schmidt, S.K., and Lipson, D.A. (2004) Microbial growth<br />
under the snow: implications for nutrient and allelochemical<br />
availability in temperate soils. Plant Soil 259: 1–7.<br />
Schmidt, S.K., Lipson, D.A., and Raab, T.K. (2000) Effects of<br />
willows (Salix brachycarpa) on populations of salicylatemineralizing<br />
microorganisms in alpine soils. J Chem Ecol<br />
26: 2049–2057.<br />
Sliwinski, M.K., and Goodman, R.M. (2004) Spatial heterogeneity<br />
of crenarchaeal assemblages within mesophilic<br />
soil ecosystems as revealed by PCR-single-stranded conformation<br />
polymorphism profiling. Appl Environ Microbiol<br />
70: 1811–1820.<br />
Steltzer, H., and Bowman, W.D. (2005) Litter N retention over<br />
winter for a low and a high phenolic species in the alpine<br />
tundra. Plant Soil 275: 361–370.<br />
Tosca, C., and Labroue, L. (1986) Nitrogen-cycle in subalpine<br />
meadows of the central pyrenees – nitrogen mineralization<br />
in soil of sub-alpine meadows. Acta Oecol-Oec<br />
Plant 7: 57–73.<br />
Waring, S.A., and Bremner, J.M. (1964) Ammonium production<br />
in soil under waterlogged conditions as an index of<br />
nitrogen availability. Nature 201: 951–952.<br />
White, T.J., Bruns, T., Lee, S., and Taylor, J. (1990) Amplification<br />
and direct sequencing of fungal ribosomal RNA<br />
genes for phylogenetics. In PCR Protocols: A Guide to<br />
Methods and Applications. Innis, M.A., Gelfand, D.H.,<br />
Shinsky, J.J., and White, T.J. (eds). San Diego, California,<br />
USA: Academic press, pp. 315–322.<br />
Zeller, V., Bahn, M., Aichner, M., and Tappeiner, U. (2000)<br />
Impact of land-use change on nitrogen mineralization in<br />
subalpine grasslands in the Southern Alps. Biol Fertil Soils<br />
31: 441–448.<br />
Zinger, L., Gury, J., Giraud, F., Krivobok, S., Gielly, L., Taberlet,<br />
P., and Geremia, R.A. (2007a) Improvements of<br />
polymerase chain reaction and capillary electrophoresis<br />
single-strand conformation polymorphism methods in<br />
microbial ecology: toward a high-throughput method for<br />
microbial diversity studies in soil. Microb Ecol 54: 203–<br />
216.<br />
Zinger, L., Gury, J., Alibeu, O., Rioux, D., Gielly, L., Sage, L.,<br />
et al. (2007b) CE-SSCP and CE-FLA, simple and high<br />
throughput alternatives for fungal diversity studies. J Microbiol<br />
Methods (in press).<br />
Zumstein, E., Moletta, R., and Godon, J.J. (2000) Examination<br />
of two years of community dynamics in an anaerobic<br />
bioreactor using fluorescence polymerase chain reaction<br />
(PCR) single-strand conformation polymorphism analysis.<br />
Environ Microbiol 2: 69–78.<br />
Journal compilation © 2008 Society for Applied Microbiology and Blackwell Publishing Ltd, Environmental Microbiology, 10, 799–809<br />
No claim to original French government works
202
Synthèse et perspectives<br />
« Ceux qui ont commencé à apprendre enchaînent les<br />
formules, mais n’en savent pas encore le sens : car il<br />
faut qu’elles soient parties intégrantes de notre nature.<br />
Or c’est là une chose qui demande du temps »<br />
Aristote. Ethique à Nicomaque,<br />
VI, 1147 a 21-22.<br />
203
SYNTHESE ET PERSPECTIVES<br />
A. Introduction ________________________________________________________ 205<br />
B. The interplay of direct and indirect effects on ecosystem processes __________ 207<br />
1) Features of ecosystem models and methodological considerations__________________________ 207<br />
2) Plant functional diversity and ecosystem processes _____________________________________ 209<br />
3) The need to integrate a new set of plant traits to predict ecosystem functioning? ______________ 214<br />
C. Linkages between carbon and nutrient cycling. The role of soil microbial<br />
communities _____________________________________________________________ 217<br />
1) Links between plants, microbial populations and N availability in alpine tundra_______________ 217<br />
2) The need for the integration of microbial community dynamics in biogeochemical models ______ 221<br />
D. Conclusions ________________________________________________________ 223<br />
1) Control of carbon cycling in alpine tundra ____________________________________________ 223<br />
2) Impact of global changes in alpine ecosystems : a case study of the Lautaret region____________ 226<br />
E. Perspectives ________________________________________________________ 228<br />
204
Synthèse et perspectives<br />
A. Introduction<br />
Mountains cover more than 20% of the global land surface (Beniston and Fox 1996),<br />
and provide goods and services for more than half of humanity. Mountains have a major<br />
influence on regional climates and substantially contribute to carbon sequestration (Becker<br />
and Bugmann 2001). Because of steep environmental gradients and complex topography,<br />
mountains exhibit a greater ecological heterogeneity and are widely viewed as hotspots of<br />
biodiversity.<br />
The combination of strong gradients and presence of organisms close to their<br />
physiological tolerance explains why alpine ecosystems are particularly vulnerable to global<br />
change (Theurillat and Guisan 2001). Remotely-sensed data and climatic recordings indicate<br />
that in addition to increasing temperature (Diaz and Bradley 1997, Noguès-Bravo et al. 2007),<br />
mountain ecosystems may experience decreased snow precipitation as a result of a higher<br />
rain/snow ratio (Serreze et al. 2000, Dye and Tucker 2003, Beniston 2005). In this context,<br />
seasonal snow cover has declined by around 10% (surface area) since 1972 (Serreze et al.<br />
2000) and between 1972 and 2000, the duration of the snow-free period in the Northern<br />
Hemisphere has increased by five to six days per decade (Dye, 2002).<br />
Predicting the response of alpine ecosystems to global change requires understanding<br />
their functioning and sensitivity to key environmental drivers. As formulated by Walker et al.<br />
(1999) “The landscape-scale distribution of snow is perhaps the single most important<br />
mesoscale variable controlling biological systems in […] alpine ecosystems”., In alpine<br />
landscapes, snow distribution is mainly controlled by mesotopography (Billings, 1973) which<br />
determines growing season length, soil temperature and water availability. Therefore, all<br />
temperature-dependent processes in alpine ecosystem are under the ultimate control of the<br />
snow cover. These effects of snow, mediated by its impact on the physical environment, are<br />
hereafter referred to as direct effects. Contrasting seasonal snow cover along the<br />
mesotopographical gradient has long been associated with strong turn-over in plant species<br />
composition, and more recently with important changes in plant functional diversity (Kudo<br />
1996, Kudo et al. 1999, Choler 2005, Baptist and Choler 2008) and soil microbial<br />
communities (Schmidt et al. 2007). These changes of plant and microbe patterns along the<br />
gradient have important consequences for ecosystem processes. These effects of snow,<br />
mediated by plant and microbial functional properties, are hereafter referred as indirect<br />
effects. Few studies have attempted to disentangle direct and indirect effects of snow cover on<br />
ecosystem functioning, and most of them have been conducted in the arctic (e.g. Grogan and<br />
205
Synthèse et perspectives<br />
Jonasson 2006, Elberling 2007). Hence, our understanding of the multiple controls exerted by<br />
snow cover on biogeochemical cycles, especially C and N cycles (and their coupling) remains<br />
largely incomplete in temperate alpine tundra.<br />
Plant functional traits (PFTr) currently form the focus for a broad spectrum of<br />
ecological research attempting to quantify the relationship between ecosystem structure and<br />
function (Lavorel and Garnier 2002). Response traits are defined as markers selected by<br />
environmental conditions whereas effect traits are the traits for which an impact on ecosystem<br />
functioning is proven. According to the ‘biomass ratio hypothesis’ (Grime, 1998), ecosystem<br />
properties and functioning are more likely to be related to the trait values of the dominant<br />
contributors to the plant biomass. This hypothesis has been successfuly tested in several<br />
recent studies (Garnier et al., Garnier et al. 2004, Diaz et al. 2007, Garnier et al. 2007, Quétier<br />
et al. 2007) and tends to indicate that focusing on leaf and plant functional properties might be<br />
an efficient way to assess the effects of biotic components on ecosystems functioning.<br />
Similarly, this study aimed to dissociate the direct (i.e. climatic variables) and indirect<br />
controls (i.e. variations in PFTr) exerted by snow cover along a mesotopographical gradient<br />
(hereafter “snowmelt gradient”). It focused on two main steps of the carbon cycle, Primary<br />
Production (Gross Primary Production, Aboveground Net Primary Production) and Carbon<br />
mineralization (heterotrophic respiration and litter decomposition). <strong>Alpine</strong> plant communities<br />
in the region of Lautaret (French Alps, 2058 m, 45°20’N, 6°24’E were studied along a<br />
snowmelt gradient with a particular focus (1) on communities dominated by Carex foetida<br />
(graminoid, Cyperaceae), Salix herbacea (shrub, Salicaceae), Alopecurus gerardi and Poa<br />
alpina (graminoids, Poaceae) corresponding to “late snowmelt location” and (2) on<br />
communities dominated by Kobresia myosuroides (graminoid, Cyperaceae) and Dryas<br />
octopetata (shrub, Rosaceae) corresponding to “early snowmelt locations”.<br />
The first part of this synthesis emphasizes how climatic drivers and plant functional<br />
properties determine carbon cycling in alpine tundra (section A). The second part addresses<br />
the linkages between carbon and nitrogen cycling within plants and at the plant-soil interface<br />
(section B). This part includes unpublished results on microbial diversity of alpine soils. In<br />
the third part (section Conclusion), we will examine the possible effects of climate change in<br />
alpine tundra based on our results and the litterature. To conclude, we will suggest new<br />
research directions to contribute to a better prediction of the outcomes of climatic change on<br />
carbon cycling in alpine tundra (section Perspectives).<br />
206
Synthèse et perspectives<br />
B. The interplay of direct and indirect effects on ecosystem<br />
processes<br />
1) Features of ecosystem models and methodological considerations<br />
All models in ecosystem physiology make use of variables from the physical<br />
environment (climatic forcing) and parameters related to the biological properties of the<br />
ecosystem. Examples are the widely-used mechanistic ecophysiological model of leaf carbon<br />
gain developped by Farquhar and co-workers (Farquhar et al. 1980, Von Caemmerer and<br />
Farquhar 1981) and the stomatal conductance model proposed by Ball et al. (1987). The VC-F<br />
model is based on the enzymatic kinetic of RUBISCO, the enzyme which reduces CO2 (and<br />
O2) in the Calvin cycle. Two key parameters are Vcmax, the maximal carboxylation efficiency<br />
of RUBISCO and Jmax the maximal electron flux into the transport chain. These two<br />
parameters describe the co-limitation of C fixation by internal CO2 concentration at the<br />
carboxylation sites and by intercepted light. Wohlfahrt et al. (1999) and others demonstrated<br />
that these parameters are strongly correlated to leaf N concentration (LNC), and it is therefore<br />
possible to infer Vcmax and Jmax from a simple measure of LNC. Leaf geometry within the<br />
canopy modulates light interception and leaf temperature and therefore affects the estimated<br />
CO2 fixation. It is therefore necessary to take into account canopy structural properties- the<br />
distribution angle of leaves - and the total leaf area per ground area (Leaf Area Index, LAI) to<br />
estimate whole-plant C gain.<br />
These models provide opportunities to test for the effects of both physical variables<br />
and leaf/canopy features on carbon gain. Along this line, many studies have investigated the<br />
relationships among several canopy properties – Leaf Area Index (LAI), nitrogen content,<br />
canopy architecture - and their effect on carbon uptake in different light conditions (Anten et<br />
al. 1995, Hikosaka and Hirose 1997, Anten 2005). However, these studies mostly focused on<br />
single species canopies grown in controlled conditions. Addressing the same questions for<br />
multi-specific canopies has rarely been done (see Wohlfahrt et al. 2000).<br />
Recently, Lavorel and Garnier (2002) proposed the use of community-aggregated<br />
traits (CFP) to scale up processes from leaf to community level. CFP is defined as follows :<br />
= CFP<br />
n<br />
∑<br />
k=<br />
1<br />
k ⋅ T A<br />
k<br />
Where Ak is the abundance of the k species characterized by the value of trait<br />
Tk<br />
A simple idea would be to use these CFP estimates in the framework of ecosystem<br />
modeling. Baptist and Choler (2008) provided evidence that this approach was successful for<br />
207
Synthèse et perspectives<br />
estimating instantaneous gross carbon gain of alpine plant canopies. Simulations were thus<br />
performed to clarify the interplay of growing season length and leaf/canopy properties on the<br />
seasonal gross carbon gain of plant communities along the snowmelt gradient.<br />
We tried to develop a similar approach to assess effects of the snow cover on carbon<br />
mineralization. This latter process has three steps. Leaching dominates during the first phase<br />
of degradation and is associated with litter fragmentation by detritivores. During the second<br />
step, the labile compounds are rapidly consumed by microorganisms. A classical litter<br />
decomposition experiment which would last from one to two years would only give<br />
information about these first two steps in cold ecosystems. The third step is much slower and<br />
mainly involves degradation of recalcitrant compounds (phenol-rich compounds).<br />
Measurement of heterotrophic respiration essentially provides data on the last two steps.<br />
Accordingly, to get a global picture of C mineralization in alpine tundra, we measured (1) an<br />
in situ litter bag experiment following a reciprocal transplantation design (Article 2A) and (2)<br />
heterotrophic respiration in controlled conditions and in situ (Article 2C).<br />
Each step of C mineralization is controlled by abiotic and biotic factors. Temperature<br />
and soil moisture are the main abiotic drivers. Biochemical compounds such as lignin,<br />
polyphenols and nitrogen are major determinants of litter decomposability and the following<br />
indexes C:N, N:lignin, N:polyphenols have been widely used in numerous studies (e.g.<br />
Hobbie 1996, Perez Harguindeguy et al. 2000, Dorrepaal et al. 2005).<br />
In this study, both statistical models applied to litter bag experiments or semiempirical<br />
models applied to heterotrophic respiration allowed testing of the relative<br />
contribution of the climatic variables and biotic factors. However, in contrast to C fixation, we<br />
did not use community-aggregated traits to predict litter decomposition (Article 2A, see<br />
perspectives). Moreover, because of the low number of species, we did not integrate the index<br />
of litter quality (PFTr) within the statistical model. We rather studied the species effect as<br />
compared to topographic effect. Relations to litter quality have been assessed a posteriori.<br />
Concerning heterotrophic respiration, the simplest predicting model is a first order<br />
exponential model (Fang and Moncrieff 2001) :<br />
R = α ⋅ e<br />
( β⋅T<br />
)<br />
Where α is the exponential coefficient of basal respiration (at a temperature of 0°C) and<br />
β a temperature scaler. R : respiration.<br />
If respiration is expressed per gram of soil or C, the parameter A is considered as a surrogate<br />
of SOM quantity or quality (e.g. Mikan et al. 2002, Grogan and Jonasson 2005, Fierer et al.<br />
208
Synthèse et perspectives<br />
2007). This parameter is therefore related to the quality of organic matter and indirectly to<br />
leaf and root-aggregated community traits. As soil moisture is another important factor, model<br />
performance is generally enhanced when it is incorporate in the model. Thus, in this study, we<br />
applied a more complete model in order to determine the relative importance of the direct and<br />
indirect controls exerted by snowcover on heterotrophic respiration (see Article 2B):<br />
R<br />
= α⋅<br />
W<br />
ν<br />
⋅C<br />
γ<br />
⋅e<br />
β⋅T<br />
where υ and γ are empirical coefficients determining the sensitivity of the basal<br />
respiration rate to volumetric soil water content (W) and soil carbon content (C,<br />
i.e. surrogate of carbon quality, see Paper 2B) in percentage of soil mass,<br />
respectively.<br />
2) Plant functional diversity and ecosystem processes<br />
2.1 Control of carbon fixation along the snowmelt gradient<br />
2.1.1 From plant leaf traits to functional properties of canopies<br />
It is generally accepted that cold, snow-covered ecosystems are strongly limited by N<br />
availability (Bowman et al. 1993). In alpine ecosystems, late snowmelt sites exhibit higher<br />
soil fertility (soil content in available nitrogen for plants) than early snowmelt sites. This<br />
difference is particularly strong shortly after snowmelt (Fig. 19, Bowman 1992). Consistent<br />
with these results, strong shifts in plant nutrient economy along this gradient have been<br />
identified. A greater LNC, a higher specific leaf area (SLA),- i.e. trait values associated with<br />
nutrient acquisition strategies -, are common features of species from late snowmelt locations,<br />
(Kudo 1992, Choler 2005, Baptist and Choler 2008). These traits ensure efficient carbon<br />
fixation. Conversely, species from early snowmelt locations are characterized by low SLA<br />
and high C/N, i.e. trait values generally associated with nutrient conservation strategies<br />
(Wright et al., 2004). At the canopy scale, the gradient is characterized by a marked shift from<br />
high LAI and planophilous canopies in late snowmelt locations, to low LAI and erectophilous<br />
canopies in the early snowmelt locations (Baptist and Choler 2008).<br />
Sensitivity analysis revealed that the most relevant traits in predicting gross carbon<br />
uptake were LAI and community-aggregated LNC. In contrast, canopy geometrical properties<br />
(parameterized with k, the extinction coefficient of an ellipsoidal leaf distribution model) did<br />
not exert a strong influence on the Gross Primary Productivity (GPP), a result which has<br />
already been reported for low LAI canopies (Hirose 2005).<br />
209
Synthèse et perspectives<br />
Interestingly, empirical models of NPP/GPP resulted in very similar conclusions<br />
(Green et al. 2003). Building on remotely-sensed data, these authors developped the following<br />
approach:<br />
NPP = ε ⋅<br />
ε =<br />
f<br />
PAR<br />
PAR i<br />
Ncanopy ⋅SLAag<br />
LAI⋅<br />
LNC<br />
=<br />
f<br />
f<br />
PAR<br />
= 1−<br />
e<br />
−k⋅LAI<br />
PAR<br />
PAR<br />
LAI ⋅ LNCag<br />
LAI ⋅ LNCag<br />
NPP =<br />
⋅ PAR i =<br />
⋅ PAR<br />
− k⋅LAI<br />
f<br />
( 1−<br />
e )<br />
ag<br />
i<br />
NPP : Net Primary Productivity<br />
ε: Index of Light Use Efficiency (LUE)<br />
PARi : Photosynthetic Active Radiation<br />
intercepted<br />
Ncanopy : canopy N content expressed per unit of<br />
ground area<br />
LNC ag / SLA ag : community-aggregated LNC<br />
or SLA<br />
fPar : Photosynthetic Active Radiation absorbed<br />
par the canopy.<br />
k : extinction coefficient which derived from the<br />
Monsi-Saeki model (Monsi and Saeki 1953).<br />
This model highlighted that NPP could be reasonably estimated by using very lowdimensional<br />
models with LAI, community-aggregated LNC and light interception/absorption<br />
as the main parameters. The empirical model implemented by Green et al. (2003) and the<br />
mechanistic one implemented by Baptist and Choler (Article 1A, 2008) confirm that these<br />
traits might provide “the best overall integration of the numerous biophysical and biochemical<br />
factors” (Green et al. 2003). Their integration in modeling terrestrial NPP may enhance our<br />
ability to predict vegetation response in response to global change.<br />
Another interesting result we obtained in this study is that the assimilation rate of the<br />
whole canopy (expressed per unit ground area) was of the same magnitude as the leaf<br />
assimilation rate (expressed per unit leaf area). This is consistent with previous studies<br />
(Grabherr and Cernusca 1977, Diemer 1994, Tappeiner and Cernusca 1998) and tends to<br />
show that at the community level the relationship between LNC and photosynthetic capacity<br />
is maintained.<br />
2.1.2 Growing season length and plant functional properties as controls of C<br />
fixation<br />
In accordance with CFP trends, instantaneous ANPP 8 varies along the snowmelt<br />
gradient from high values in late snow melt locations to low values in the early snowmelt<br />
locations (Fig. 26, Fisk et al. 1998, Baptist and Choler 2008). We do not have estimates of<br />
instantaneous BNPP at the community level but we did measure a higher root production for<br />
C. foetida (late snowmelt) as compared to K. myosuroides (early snowmelt) (Fig. 21). These<br />
8 Instantaneous ANPP is the biomass produced divided by the number of day elapsed from snowmelt to peak<br />
standing biomass. Yearly ANPP is the total biomass produced in a year.<br />
210
Synthèse et perspectives<br />
results are in agreement with those obtained by Fisk et al. (1998) at the community level.<br />
The estimation of instantaneous GPP also indicated a marked trend along the<br />
snowmelt gradient (Baptist and Choler 2008). But when expressed over season, simulations<br />
revealed that growing season length was counterbalanced by the particular CFP combination<br />
within each community along the snowmelt gradient (Baptist and Choler 2008). Early<br />
snowmelt species benefit from a longer growing season but exhibit lower photosynthetic<br />
efficiency. In late snowmelt locations, a set of CFP are associated with a high photosynthetic<br />
efficiency compensating for a shorter vegetation season. Hence, along snowmelt gradient,<br />
snow affects C fixation through both its influence on the growing season length (direct effect)<br />
and the ecological sorting of CFP (indirect effect).<br />
Fig. 21 Instantaneous Aboveground Net Primary Productivity (ANPP expressed on a daily basis) (A) and<br />
yearly ANPP (B) for various plant communities located along the snowmelt gradient from the most<br />
exposed (120) to the most snowy locations (200) (Aravo, 2750 m). Instantaneous Belowground Net<br />
Primary (BNPP) is calculated only for communities dominated by C. foetida (180) or K. myosuroides<br />
(140) (C). BNPP measurements are based on in-growth core methods as defined in the paper 1C.<br />
Summer corresponds to the period from the 06/06/2006 to the 16/08/2006 and fall from the 16/08/2006<br />
to the 04/10/2006.<br />
In order to assess the interplay between direct and indirect effects of snow-cover<br />
211
Synthèse et perspectives<br />
duration on the seasonal carbon uptake of alpine canopies, a sensitivity analysis was carried<br />
out. The results indicated that the GPP was predominantly sensitive to a change in snow-cover<br />
duration rather than changes in CFP along the snowmelt gradient (Fig. 6A in the article 1A,<br />
Baptist and Choler 2008). This confirms previous studies which proposed that annual carbon<br />
gains in arctic ecosystems were limited primarily by the length of the growing season and<br />
secondarily by light, temperature and nitrogen (Chapin 1983). Similarly, process-oriented<br />
ecosystem models indicate that longer growing seasons may enhance vegetation growth at<br />
high latitudes in the Northern Hemisphere (Piao et al. 2007). However, predicting the<br />
response of plants to longer growing periods is not easy and it will also depend on the<br />
phenological traits of species (Starr et al., 2000; Wipf et al., 2006; Bjork and Molau, 2007).<br />
The ability to benefit from a higher number of growing degree days may strongly vary from<br />
one species to another. Furthermore, earlier snowmelt may lead to higher frequency of frost<br />
events especially at high elevation (Inouye 2000). Short and extreme freezing events have the<br />
potential to greatly affect growth of alpine plants especially those located in late snowmelt<br />
locations. A semi-controlled experiment carried out at the <strong>Joseph</strong> <strong>Fourier</strong> <strong>Alpine</strong> <strong>Station</strong><br />
revealed that early frosts significantly affected aboveground biomass, productivity and LAI of<br />
late snowmelt communities (Article 1B). Despite a capacity to recover very quickly, frost<br />
damage could severely impair leaf growth, even if meristematic tissues are located<br />
belowground. Carex foetida was the most sensitive species, whereas Alopecurus gerardi and<br />
Poa alpina, two others graminoids were less impacted by these frosts. Hence, it is likely that<br />
the detrimental effect of frost might outweigh the benefits of a slight increase in cumulated<br />
growing degree day when snowmelt occurs earlier in the year (Wipf et al. 2006, Article 2B).<br />
2.2 Control of decomposition and heterotrophic respiration along the snowmelt<br />
gradient<br />
Litter bag experiments indicated that the same substrate decomposes better in late vs.<br />
early snowmelt locations (Reciprocal transplant experiment, Article 2A, Bryant et al. 1998).<br />
As decomposition occurs mainly in winter (Article 1A), it likely that deep snow pack, which<br />
acts as an insulating layer, provides a micro environment that is favourable for litter<br />
decomposition. Soil temperature variations associated with changes in snow cover duration<br />
affect enzymatic activity and reduce C and N mineralization in early snowmelt locations.<br />
Similarly, soil respiration was strongly dependent on soil temperature and moisture during<br />
summer and wintertime thus emphasizing the importance of direct effects (Article 2B).<br />
However, in late snowmelt location, total summer respiration was 50% above that of soils<br />
212
Synthèse et perspectives<br />
from early snowmelt locations and this difference was mainly explainable by the<br />
overwhelming impact of higher substrate quality (i.e. high carbon content). During winter,<br />
this effect was less marked because of the higher temperature sensitivity of microorganisms<br />
(high Q10 , Article 2B). The insulating effect of snowpack and the low recalcitrance acted<br />
simultaneously to increase soil respiration in late snowmelt locations. Nevertheless,<br />
uncertainities remain about the very high Q10 values measured on freezing soils. Indeed,<br />
Schimel et al. (2006) was not able to predict realistic in situ CO2 efflux based on the high Q10<br />
values proposed by Mikan et al. (2002). Similarly, Elberling and Brandt (2003) questionned<br />
the impact of physical trapping on CO2 efflux : it is likely that the important CO2 efflux<br />
observed in response to temperature increment (around 0°C) is primarily related to gas release<br />
initially trapped in freezing soil than biological production (Elberling 2007). Consequently,<br />
variations in wintertime soil temperatures along the snowmelt gradient may not impact CO2<br />
efflux to such an extent (i.e. biological activity) as compared to soil organic matter quality<br />
(Paper 2B). Hence, these results suggest that within alpine ecosystems, spatial variations in<br />
soil respiration is mainly related to SOM quality rather than changes in soil climate, at least<br />
during summer. Nadelhoffer et al. (1991) reported similar results in arctic ecosystems in a<br />
controlled-condition experiment. Grogan and Jonasson (2005) and Elberling (2007) also<br />
indicate that SOM quality was almost as important as soil temperature differences in<br />
determining spatial variations in CO2 efflux in arctic tundra. Their studies principally focused<br />
on the winter period.<br />
In addition, we observed that the proportion of shrubs vs. graminoids might strongly<br />
affect litter decomposition rate (Table 7, Article 2A). Differences in litter mass loss<br />
differences between shrubs and graminoids within early and late snowmelt sites largely<br />
exceeded the differences observed for one species between these two situations. Similarly,<br />
several authors (Hobbie 1996, Dorrepaal et al. 2005, Wahren et al. 2005, Dorrepaal 2007)<br />
showed that leaf decomposition rate differed consistently among growth form with low<br />
decomposability litters being produced by mosses, followed by evergreen shrubs, deciduous<br />
shrubs, graminoids and forbs. These observations emphasized the important role of phenolic<br />
compounds (e.g. lignin or tannin) which are a major determinant of litter decomposition,<br />
because of their structural stability and biochemical recalcitrance.<br />
213
Synthèse et perspectives<br />
Species<br />
Late snowmelt locations<br />
k (yr<br />
Early snowmelt locations<br />
-1 ) r 2 P k (yr -1 ) r 2 Leaf litter<br />
P<br />
C. foetida 0.56 (0.01) 0.97
Synthèse et perspectives<br />
3.1 Regenerative traits and morphological constraints<br />
The preformation of flowers, inflorescences or aerial parts (leaves, branches) is one of<br />
the important adaptive features of alpine plants (Körner 1999). As time for growth is limited,<br />
this mechanism facilitates the rapid emergence of tissues at the onset of growing season.<br />
Conversely, this phenomenon may limit very short-term response to changing environment.<br />
Indeed, alpine plant growth is hindered by the number of preformed buds and the number and<br />
potential area of associated leaves to be produced by a single meristem (Grelet et al. 2003).<br />
These morphological constraints differ between species (Körner 1999) and also<br />
between growth forms. Graminoids are assumed to be generally responsive to perturbation or<br />
changes in resource availability because their leaves grow from intercalary meristems (only<br />
grasses) and are less limited in the size of the leaves that can be produced. By contrast, most<br />
species of deciduous, evergreen shrubs (and many forbs) are limited in their ability to increase<br />
their growth in the short term because (1) they must first form new buds, containing new<br />
leaves and stems (Shaver et al. 1986; Bowman & Conant 1994; Diggle 1997) and (2) they can<br />
not increase leaf size as graminoids do because of morphological constraints.<br />
3.2 Phenological traits<br />
Sørenson (1941) distinguished two phenological patterns in tundra plants : periodic<br />
species, characterized by a fixed growing period, and aperiodic species, for which both<br />
growth and the production of new leaves are maintained as long as conditions are favourable.<br />
Periodic species, such as Polygonum bistorta in the arctic (Starr, 2000), Polygonum viviparum<br />
or C. foetida in alpine tundra (Article 1B, Diggle 1997) may be disadvantaged compared to<br />
aperiodic species such as the shrubs D. octopetala (Welker et al. 1997), S. herbacea (personal<br />
observation) or the forb Ranunculus adoneus (Galen & Stanton, 1993) in a context of a<br />
lengthened growing season.<br />
3.3 Resistance to frost events<br />
During winter, plants are usually protected from low temperature by snow cover, or by<br />
specific features (e.g. higher concentration in sugars or supercooling, Bell and Bliss 1979).<br />
The situation is different during growing season as plants generally display a rapid<br />
dehardenning once snow disapears (Körner 1999). In a context of global change, frost events<br />
215
Synthèse et perspectives<br />
are predicted to increase because of reduced snow cover (Inouye 2000), it is therefore relevant<br />
to compare the ability of alpine species to support and to recover from freezing events.<br />
According to Taschler & Neuner (2004) and Baptist & Streb (unpublished results),<br />
graminoids show on average lower freezing points than shrubs, suggesting than they may be<br />
favored if the frequency of frosts increases in the future (Table 8). In addition, species from<br />
early snowmelt locations displayed similar freezing points to species from late snowmelt<br />
locations (Baptist & Streb, unpublished results). However, the fraction of dead cells following<br />
the frost was much lower from early snowmelt species (data not shown), suggesting a higher<br />
capability to recover.<br />
Species Freezing points (°C)<br />
Dwarf shrubs<br />
Calluna vulgaris<br />
Juniperus communis sps. nana<br />
Loiseleuria procumbens<br />
Rhododendron ferrugineum<br />
Vaccinium gaultherioides<br />
Vaccinium myrtillus<br />
Vaccinium vitis-idaea<br />
Dryas octopetala*<br />
Salix herbacea*<br />
Salix reticulata*<br />
Salix retusa*<br />
Mean<br />
Graminoids<br />
Juncus trifidus<br />
Nardus stricta<br />
Phleum alpinum<br />
Poa alpina<br />
Poa alpina (2)*<br />
Kobresia myosuroides*<br />
Carex foetida*<br />
Alopecurus gerardi*<br />
Mean<br />
-8.3 ± 0.1<br />
-9.0 ± 0.6<br />
-6.6 ± 0.6<br />
-4.7 ± 0.5<br />
-5.6 ± 0.5<br />
-4.1 ± 0.4<br />
-5.5 ± 0.3<br />
-7.6 ± 0.3<br />
-8.1 ± 0.4<br />
-7.2 ± 0.6<br />
-8.7 ± 0.4<br />
-6.8 ± 0.5 a<br />
-7.7 ± 0.3<br />
-10.3 ± 0.6<br />
-10.8 ± 1.5<br />
-9.9 ± 1.4<br />
-9.3 ± 0.4<br />
-10.1 ± 0.5<br />
-10.0 ± 0.5<br />
-12.0 ± 0.8<br />
-10.0 ± 0.4 b<br />
Table 8 Freezing points of alpine species of<br />
different growth forms. Data are from Taschler<br />
& Neuner (2004) and Baptist et al. (Article 1B<br />
and unpublished data, marked with *). Different<br />
upperscript letters mean significant differences<br />
(p
Synthèse et perspectives<br />
C. Linkages between carbon and nutrient cycling. The role of soil<br />
microbial communities<br />
A large body of literature emphasizes the close linkage between the carbon and<br />
nitrogen biogeochemical cycles in terrestrial ecosystems (e.g. Hobbie et al. 2000, Long et al.<br />
2006). In plant functional ecology, the continuum between exploitative and conservative<br />
strategists is generally related to nutrient availability, especially nitrogen (Chapin et al.<br />
1993a)9. Low N availability limits ANPP, leading to recalcitrant tissue construction and by<br />
retroaction affecting N mineralization rates. This positive feedback remains as long as plants<br />
rely on saprophytic microorganisms to satisfy their N requirements. However, it has been<br />
recently discovered that plants can acquire organic N forms with or without mycorrhiza and<br />
therefore subvert the microbial loop (Chapin et al. 1993b, Raab et al. 1999, Chapman et al.<br />
2006). Also, some species can fix atmospheric N limiting their dependance on saprophytic<br />
microbes (rhizobial or actinorhizal species). Finally, plants develop special adaptations to<br />
reduce dependance on nutrients, such as N storage.<br />
The emergence of this new paradigm questions the existence of a bottleneck associate<br />
to SOM mineralization (Schimel and Bennett 2004, Chapman et al. 2006) and calls for further<br />
studies to explore the linkage between plant, microbial and biogeochemical cycles in alpine<br />
tundras.<br />
1) Links between plants, microbial populations and N availability in alpine<br />
tundra<br />
The main constraint in snow-covered ecosystems is the soil temperature which is<br />
principally controlled by snow cover throughout the year. Microbial populations experience a<br />
marked dynamic throughout the year which impacts on plant production and C and N<br />
mineralization.<br />
During summer, bacteria dominate over fungi and feed on both labile carbon exuded by the<br />
plants and soil organic matter. During the transition to winter, microbial communities shift to<br />
psychrophilous fungal-dominated communities (Schadt et al. 2003, Uchida et al. 2005, Bjork<br />
et al. 2008). Wintertime populations display high ability in degrading recalcitrant compounds<br />
such as salycilic acid or lignin-rich compounds present in SOM especially in early snowmelt<br />
locations (Lipson et al. 2002, Loya et al. 2004, Schmidt and Lipson 2004, Baptist et al. 2008).<br />
Additionally, some bacterial populations feed on easy labile substrates which are leached<br />
9 Water availability can independently initiate the same nutrient acquisition trade-off (Chapin et al. 1993a)<br />
217
Synthèse et perspectives<br />
from fresh litter and then contribute to its degradation. These results support our observations<br />
concerning high wintertime compared to summertime decomposition rates (Article 2A,<br />
Hobbie and Chapin 1996). At snowmelt, microbial populations collapse releasing important<br />
quantities of nutrients, especially at snowy sites (Fig. 19, Brooks et al. 1998). The peak of<br />
nutrients, coupled to the mineral release from water snowmelt, is crucial as it may support<br />
seasonal plant growth. Bilbrough et al. (2000) indicated for example that N uptake during<br />
snowmelt averaged 7 to 12% of total uptake during the growing season.<br />
In late snowmelt locations, species probably rely on this flush of mineral nitrogen<br />
which allows a rapid expansion of photosynthetic tissues and ensures efficient light capture<br />
and carbon fixation. Indeed, we demonstrate that a fast growing species from late snowmelt<br />
location (C. Foetida) displayed higher mineral N uptake compare to a slow growing species<br />
present in early snowmelt locations (K. Myosuroides) (Article 1C). The fast N incorporation<br />
and translocation into the leaves was related to an important belowground C allocation,<br />
indicating a tight temporal and spatial C – N coupling in the plant. These features may<br />
contribute to optimize mineral N acquisition at snowmelt and plant growth in locations where<br />
growing season length is limiting.<br />
By contrast, in early snowmelt locations, Baptist et al. (Article 2A) showed that<br />
because of lower soil temperature during winter, litter decomposition and thus N<br />
mineralization was slowed down, limiting N availability during the growing season. The<br />
presence of species rich in tannin may also contribute to reduce N availability through<br />
chemical complexation (Baptist et al. 2008). Finally, as snow cover is limited in early<br />
snowmelt locations, species do not benefit from resources contained in melt water at the onset<br />
of the vegetation season. Brooks et al. (1998) demonstrate that nitrate exported during<br />
snowmelt from the inconsistent snow cover sites was significantly greater than the quantity<br />
exported in late snowmelt locations. Thus, it is likely that plant growth in early snowmelt sites<br />
does not primarily rely on this pulse of mineral nitrogen at the onset of the growing season.<br />
Analysis of root tissues revealed a strong decrease in nitrogen content in roots of K.<br />
myosuroides at the beginning of the growing season. This was not observed for C. foetida<br />
(Fig. 22). These results suggest that, at least for K. myosuroides, nitrogen storage from<br />
previous years may support growth though allocation into aboveground compartments during<br />
the first weeks of the growing season. Regardless of soil N availability, these plants may<br />
preserve relatively more N within their biomass than plants from late snowmelt locations.<br />
These features are frequent in alpine ecosystems (e.g. Lipson et al. 1996) and confirm that<br />
reliance on storage are correlated with the amount of asynchrony between resource supply and<br />
218
Synthèse et perspectives<br />
demand (Chapin et al. 1990).<br />
Fig. 22 Root nitrogen content (g.g -1 ) in<br />
relation to degrees day since snowmelt<br />
(or when sum of degrees days > 0) for K.<br />
myosuroides (early snowmelt locations,<br />
black symbol) and C. foetida (late<br />
snowmelt locations, white symbol)<br />
Moreover, microbial diversity studies indicated the presence of Frankia bacteria in<br />
soils from early snowmelt locations (Zinger et al. unpublished results). These bacteria are<br />
responsible for biological N2 fixation and are associated with D. octopetala roots (Table 9,<br />
Kohls et al. 1994). Thus, an important fraction of N assimilated by this species may result<br />
from biological fixation although nitrogenase activity should be investigated to confirm this<br />
hypothesis.<br />
Late snowmelt Early snowmelt<br />
locations locations<br />
May 0 0<br />
June 0 4.7 %<br />
August 0 7.1 %<br />
October 0 20 %<br />
Table 9 Proportion of Frankia sequences within<br />
Actinobacteria phylum in late and early snowmelt<br />
locations (class: Actinobacteridae, order:<br />
Actinomycetales).<br />
In addition, we detected a higher abundance of the genera Inocyte and Russula and of<br />
the species Cenococcum geophilum in early compared to late snowmelt locations (Zinger et<br />
al., in prep.). These phyla have been previously reported as ectomycorrhiza of D. octopetala<br />
and K. myosuroides respectively (Ascomycota, Gardes and Dahlberg 1996) suggesting these<br />
species may display higher efficiency of N incorporation thanks to these symbionts (Lipson et<br />
al. 1999). Finally, Chapin et al. (1993b) and Kielland (1994) have recently shown that some<br />
plants can assimilate amino acids more rapidly than mineral nitrogen from hydroponic<br />
cultures in the absence of mycorrhizae. This phenomenon appears widely developed in alpine<br />
and arctic ecosystems as a result of low inorganic N availability (Raab et al. 1999, Jonasson et<br />
al. 2001). It is particularly the case for Kobresia myosuroides (Raab et al. 1999). Hence, the<br />
vegetation has the potential capability to access organic N directly without being dependant<br />
on N mineralization. It is however still important to precise that if plants avoid N<br />
mineralization, they still depend on soil microbes for soil protease activity (i.e.<br />
depolymerization, Schimel and Bennett 2004).<br />
219
Synthèse et perspectives<br />
Thus, species from early snowmelt locations appear to subvert the microbial loop of<br />
SOM mineralization through different strategies such as the: remobilization of N storage,<br />
biological N fixation and organic nitrogen assimilation (Fig. 23). In contrast, species from late<br />
snowmelt locations may rely mostly on mineral N at the onset of growing season and<br />
developed specific features in order to maximise N assimilation and plant growth. Although<br />
these conclusions are mainly indirect and require further experiments, they illustrate how<br />
environmental conditions have selected plants with diverse mechanims of obtaining N. They<br />
also outline the importance of considering plant and soil communities together over seasonal<br />
timescales to identify (1) the controls and bottlenecks and (2) the degree of temporal and<br />
spatial coupling between C and nutrient cycles. The incorporation of microbial communities<br />
into current conceptual models of biogeochemical dynamics may be a valuable tool in the<br />
assessment of plant and microbial mediated controls on carbon and nutrient cycling (Zak et al.<br />
2006).<br />
Nitrate peak<br />
at snowmelt<br />
Ammonium<br />
Mainly<br />
ammonium<br />
Mineral N<br />
Microbes<br />
N Norg= org= 535 ± ± 22 µgN g-1 soil DW<br />
Mineral N<br />
Microbe<br />
Norg= 914 ± 66 µgN g-1 Norg= 914 ± 66 µgN g soil DW<br />
-1 soil DW<br />
Late snowmelt location<br />
N storage<br />
Plant biomass<br />
Myc<br />
Soil Organic<br />
Matter<br />
Early snowmelt location<br />
N storage<br />
Plant biomass<br />
?<br />
Myc<br />
Soil Organic<br />
Matter<br />
N atm fixation<br />
bacteria<br />
Litter<br />
Microbes<br />
N Natm atm fixation<br />
bacteria<br />
Litter<br />
Microbes<br />
Acidobacteria<br />
Proteobacteria<br />
Pezizomycotina<br />
Agaricomycota<br />
Mucoromycotina<br />
Frankia<br />
associated to<br />
D. octopetala<br />
(actinorhizal)<br />
Ectomycorrhiza<br />
(Actinomycota)<br />
associated to<br />
K. myosuroides /<br />
D. octopetala<br />
Proteobacteria<br />
Pezizomycotina<br />
Agaricomycota<br />
Mucoromycotina<br />
Fig. 23 Hypothesis regarding Carbon and Nutrient interaction in early and late snowmelt<br />
locations. Data from Zinger et al. (unpublished results) and Baptist et al. (unpublished<br />
results). Modified from Chapman et al. (2006).<br />
220
Synthèse et perspectives<br />
2) The need for the integration of microbial community dynamics in<br />
biogeochemical models<br />
Microbial populations are absent from biogeochemical models (Zak et al. 2006).<br />
Beyond technical difficulties, research is currently limited by (1) the capability to aggregate<br />
microbial populations within a functional classification and (2) the absence of a clear<br />
conceptual framework which articulates plant and microbial effect traits to predict ecosystem<br />
functioning. Accordingly, we propose to modify the conceptual framework proposed by<br />
Lavorel & Garnier (2002) (Fig. 24).<br />
In this figure, microbial and plant functional traits interact to determine a potential<br />
enzymatic activity which is ultimately regulated by environmental variables. This potential<br />
activity refers to RUBISCO and other enzymes involved in plant metabolism when C fixation<br />
is analysed and to enzymes associated with SOM degradation when C mineralization is<br />
addressed. It it important to note that microbial catalysis depend firstly on (1) the nature of the<br />
enzyme selected by climate and substrate and then ultimately on (2) the quality of the<br />
substrate and (3) temperature. This situation is different in plants as the enzyme of<br />
carboxylation (i.e. RUBISCO) and its substrate (i.e. CO2 or O2) are common to all plant<br />
species. As a result, the enzymatic efficiency will only depend on the quantity of enzyme<br />
present in plants whereas it will depend on both quantity and nature of the enzymes in<br />
microbes.<br />
Interdependence of plant and soil microbial communities in alpine tundra can be<br />
illustrated by various mechanisms (Fig. 24). Plants impact microbial populations directly<br />
through rhyzodeposition, exudation rate, litter quality and through ecosystem processes filters<br />
(e.g. litter quantity) (Fig. 24, arrows 4a and 6). Conversely, specific microbial populations<br />
enable plants to acquire nutrients in organic or mineral forms (mycorrhizal symbiosis,<br />
nitrogen fixing bacteria) (Fig. 24, arrow 4b). They can act as carbon sinks and modulate plant<br />
growth and response to disturbances (Grimoldi et al. 2006, Walling and Zabinski 2006).<br />
Finally, microorganisms indirectly affect plant growth by controlling mineral N availability<br />
within the ecosystem (Fig. 24, arrow 7).<br />
Soil microbes play a key role in ecosystems (e.g. Schmidt et al. 2007). A future<br />
challenge will be to determine to which extent changes in microbial diversity may influence<br />
plant community dynamics and ecosystem functionning (van der heijden et al. 2008).<br />
221
Synthèse et perspectives<br />
1<br />
2<br />
3<br />
4<br />
5<br />
6<br />
7<br />
Environmental<br />
constraints<br />
Microbial<br />
3<br />
a communities b<br />
4<br />
a b<br />
Plant 2<br />
a communities b<br />
Potential<br />
activity<br />
Indirect effects<br />
Direct effects of environmental constraints on ecosystem processes<br />
Processes<br />
C, N<br />
Indirect effects of environmental constraints and microbial traits on potential<br />
activity through the selection of community-aggregated plant traits :<br />
a. Response traits (e.g. SLA, LNC, organic nitrogen uptake)<br />
b. Effects traits (e.g. SLA, LNC)<br />
Indirect effects of environmental constraints and community-aggregated plant<br />
traits on potential activity through the selection of microbial traits :<br />
a. Response traits (e.g. fungal:bacterial ratio)<br />
b. Effects traits (e.g. enzyme production, Carbon Use Efficiency)<br />
Interaction between community-aggregated plant traits and microbial traits :<br />
a. Plants to microbes (e.g. litter quality, exsudation, idiosynchratic effect)<br />
b. Microbes to plants (e.g. organic and mineral nitrogen/phosphore assimilation)<br />
Effects of microbial traits and community-aggregated plant traits on<br />
biogeochemical processes<br />
Feedbacks of ecosystem processes on microbial traits (e.g. litter input)<br />
Feedbacks of ecosystem processes on community-aggregated plant traits (e.g. N<br />
mineralization)<br />
Fig. 24 Conceptual diagram showing the direct and indirect effects of environmental<br />
constraints on plant and microbial communities and their impact on biogeochemical<br />
processes. These processes are determined by both the potential activity of plants and<br />
microbes and by environmental conditions. Modified from Lavorel and Garnier (2002).<br />
5<br />
1<br />
6<br />
7<br />
222
Synthèse et perspectives<br />
D. Conclusions<br />
1) Control of carbon cycling in alpine tundra<br />
Along the snowmelt gradient, variations in plant production are<br />
determined by both CFP and growing season length. Nevertheless, in a context of<br />
reduced snow cover, direct effects of snow through variations in vegetation growth<br />
period length should affect primary production to a greater extent than changes in CFP.<br />
As vegetation season length is an important limiting factor in alpine ecosystems, the<br />
capacity to respond rapidly to longer seasons will be determinant. Freezing events might<br />
also affect plant production and their consequences will depend on the ability of species<br />
to support these frosts (Fig. 25).<br />
In order to assess to which extent plant communities will respond to increasing growing<br />
degree days, we identified three sets of response trait (set A) :<br />
- Regenerative traits<br />
- Phenological traits<br />
- Freezing points and recovery<br />
Biotic interactions should also be crucial in predicting the evolution of community<br />
composition as one of the first effects of lengthened growing season will be to modify<br />
competitive relationships between species (Theurillat and Guisan 2001).<br />
In early snowmelt locations, carbon mineralization is mainly determined<br />
by litter quality. Any changes in litter quality will significantly affect CO2 efflux.<br />
However, variations of wintertime soil temperature (through variations in snow cover)<br />
should also slightly alter the turnover of SOM (Fig. 26).<br />
Three traits are therefore considered crucial (set B):<br />
- N:Lignin<br />
- Tannin content which may contribute to complex proteins in the soil and then<br />
decrease N availability<br />
- Allocation coefficients such as the woody:non woody ratio and the root:shoot ratio.<br />
223
Synthèse et perspectives<br />
Directs Effects<br />
Early snowmelt location Late snowmelt location<br />
Long growing<br />
season<br />
Plant communities<br />
"Conservative strategy"<br />
-<br />
+<br />
Abiotic<br />
constraints<br />
Microbial<br />
communities<br />
?<br />
Potential activity<br />
- C fixation +<br />
Short growing<br />
season<br />
Indirect effects<br />
Plant communities<br />
"Exploitative strategy"<br />
Seasonal<br />
C Fixation ∼<br />
+ ∼ Seasonal<br />
-<br />
C Fixation<br />
-<br />
∼<br />
+ ∼<br />
-<br />
-<br />
-<br />
Frost events<br />
Fig. 25 Conceptual diagram for direct and indirects effects of snow cover on C fixation. In early snowmelt<br />
locations, CFP are outweighed by a longer growing season. In late snowmelt locations, we observed the<br />
opposite. The presence of mycorrhiza and biological N fixing bacteria may increase the efficiency of N<br />
acquisition in early snowmelt locations; however no data is available to confirm this hypothesis. Similarly,<br />
uncertainty remains about the impact of mycorrhizal colonization on C fixation. The sensitivity analysis<br />
revealed that a longer growing season may affect C fixation more strongly than compared to a change in<br />
CFP (represented by the larger regulation button), but this will ultimately depend on extreme events such<br />
as the occurence of frosts at snowmelt.<br />
Direct effects<br />
+<br />
Early snowmelt location Late snowmelt location<br />
Long growing<br />
Short growing<br />
season<br />
Abiotic<br />
constraints<br />
season<br />
Plant communities<br />
"Conservative strategy"<br />
-<br />
Microbial<br />
communities<br />
+ -<br />
?<br />
Indirect effects<br />
Plant communities<br />
"Exploitative strategy"<br />
+<br />
-<br />
Potential activity<br />
C Mineralization +<br />
-<br />
- C Mineralization+<br />
Mineralization+ +<br />
Fig. 26 Conceptual diagram for direct and indirect effects of snow cover on C mineralization. In early<br />
snowmelt locations, more efficient microbial populations are selected by both recalcitrant SOM and<br />
abiotic conditions (Baptist et al. 2008). However, despite higher efficiency, potential C mineralization<br />
remains lower than in late snowmelt locations because of lower C quality. This effect is reinforced by<br />
lower soil temperature during winter, but only marginally. Carbon quality is then the main factor<br />
determining C mineralization along the snowmelt gradient (represented by larger regulation buttons).<br />
Direct Effects<br />
Direct effects<br />
224
Synthèse et perspectives<br />
Plant species from late snowmelt locations are dependent upon microbial<br />
N mineralization whereas species from early snowmelt locations appear to subvert the<br />
microbial bottleneck by assimilating organic N and fixing atmospheric N. It is possible<br />
to hypothesize contrasting impacts of climate change on these two types of ecosystem<br />
functioning. Ecosystems exhibiting faster cycling of C and nutrients and tighter linkages<br />
between biogeochemical cycles would probably respond more rapidly and more strongly<br />
to climatic forcing. Conversely, a delayed response is likely in early snowmelt locations.<br />
This would be reinforced by stressful conditions during wintertime which would be only<br />
marginally affected by global warming. (i.e. wintertime (soil) temperatures will remain<br />
very low for plant and microbial life in early snowmelt locations).<br />
Accumulation of SOM, and thus C sequestration, is related to an imbalance between<br />
plant production and the decomposition rate. In cold ecosystems, SOM accumulates to high<br />
concentrations in relatively narrow horizons, despite low annual productivity (Körner 1999).<br />
Carbon mineralization therefore appears to be the limiting step (Körner 1999, De Deyn et al.<br />
in press). Thus, we can hypothesize that C mineralization will be the most sensitive step and<br />
will eventually determine C cycling and the evolution of C stocks in cold ecosystems. As this<br />
process mainly depends on C quality, any shift in plant composition (response traits, set A)<br />
either favoring, or not, one of the three traits listed above (effect traits, set B) may impact C<br />
mineralization.<br />
The methodological approach based on quantitative CFP was successful in<br />
determining the hierarchy of direct and indirect controls exerted by snow cover on C fixation<br />
and mineralization. We showed that it is possible to integrate CFP into biogeochemical<br />
models, allow the prediction of consequences of changes in biotic and abiotic variables on C<br />
processes. This study also indicates that the use of growth-form based groups is not<br />
informative when assessing both production and decomposition in an ecosystem (Green et al.<br />
2003, Dorrepaal 2007, Baptist and Choler 2008). This classification has been widely used in<br />
arctic ecosystems to predict the indirect impact of global change on ecosystem processes (e.g.<br />
Walker et al. 2006). This approach was partly successful because the distinction between<br />
growth forms matched differences in lignin and other polyphenol compounds which are<br />
determinant traits in decomposition process. However, CFP related to C fixation vary widely<br />
within each growth form and thus reduce the pertinence of such classifications to predict<br />
production (Dorrepaal 2007). Hence the selective use of a few set of traits at the leaf and plant<br />
level seems to be more promising in order to analyze both plant response to environmental<br />
225
Synthèse et perspectives<br />
factors and effect on C and nutrient cycles (Dorrepaal 2007).<br />
2) Impact of global changes in alpine ecosystems : a case study of the<br />
Lautaret region<br />
Given the lack of any clear consensus concerning possible climate change scenarios, a<br />
range of possible changes in attributes of snowpack development are considered. These<br />
include potential increases in temperature and decreases in snow precipitation. Decreasing<br />
snow precipitation during winter will likely result in:<br />
(1) Longer growing season<br />
(2) Increased frost frequency<br />
(3) Lower N input into the system<br />
(4) Reduced soil moisture during growing season<br />
(5) Lower soil temperature during winter because of higher coupling between air and soil<br />
temperature<br />
In addition, IPCC (2007) predict a parallel increase of 1 to 3 °C in mid-latitude, which<br />
may reinforce most of these effects, except for freezing events whose frequency might be<br />
reduced. Longer growing seasons and a higher frequency of frost events will directly<br />
stimulate productivity through community and species specific filters based on the set of<br />
response traits defined above (Set A). Shifts in community composition will thus impact C<br />
mineralization through variations in effect traits, defined as the set B.<br />
Schöb et al. (in revision) showed that the abundance of the alpine shrub S. herbacea<br />
decreased with longer growing season, in contrast to graminoids. In parallel, Beerling (1998)<br />
indicated that this species was intolerant to dryness and to shade. Its low prostate habit makes<br />
it susceptible to competition for light with taller vascular plants. Thus, S. herbacea may be<br />
rapidly out competed by graminoids because of a slow response time, higher freezing point,<br />
and a weak capacity to tolerate shade and competition. In parallel, warming may lead to the<br />
rapid expansion of Poa alpina, a generalist species (Article 1B, see also Sandvik et al. 2004).<br />
This species is relatively tolerant to freezing and is able to maintain photosynthetic tissue<br />
during almost of the growing season. Similarly, Körner (1999) indicate that Poa alpina may<br />
respond rapidly to environmental changes. Hence, late snowmelt locations might evolve<br />
toward graminoid-dominated communities. These conclusions are contradictory to the review<br />
226
Synthèse et perspectives<br />
of Bjork and Molau (2007) who proposed that more vigorous shrubs from surrounding areas 10<br />
may rapidly invade these communities and out compete graminoids. In the region of Lautaret,<br />
the only shrubs which could potentially invade snowbed communities are located at lower<br />
altitudes (i.e. subalpine shrubs such as Vaccinium sp.). In the very-long term and in a context<br />
of a marked temperature increase, this hypothesis cannot be neglected. However, alpine<br />
ecosystems are globally dominated by slow-growing species, and the time lag between the<br />
initiation of treatment and ecosystem responses may be very long (Chapin et al. 1995, Körner<br />
1999). Thus, it appears essential to predict the evolution of species dominance in nearby<br />
communities before predicting the outcomes of invasion by subalpine species. In early<br />
snowmelt locations, D. octopetala is able to lengthen it life cycle because of its wintergreen<br />
habits and therefore its increased seasonal carbon gain (Welker et al. 1997). However,<br />
Klanderud and Totland (2005) observed a decreased cover of D. octopetala in response to<br />
warming and/or nutrient addition. These authors suggested that despite an increase of biomass<br />
in the short-term, this species might be outcompeted by graminoids over the longer-term.<br />
Similar changes in competition hierarchies may occur in response to a lengthened growing<br />
season. Indeed, graminoids are expected to respond faster to longer growing seasons and D.<br />
octopetala may therefore be excluded by K. myosuroides and others sedges such as Carex<br />
rupestris.<br />
To conclude, we predict that dwarf shrubs may be outcompeted by graminoids along<br />
the snowmelt gradient because of lower competitive ability, lower resistance to frost events<br />
(case of S. herbacea) and slow response times to environmental changes. C fixation will be<br />
stimulated by higher growing degree-days, especially in late snowmelt situations where<br />
growing season length is the most limiting factor. Additionally, C mineralization may<br />
increase because of better C quality in both late and early snowmelt locations. Positive<br />
feedbacks between the production of good quality tissue and N availability to plants may take<br />
longer in early snowmelt locations because of decoupling between C and N cycles.<br />
Other climatic or anthropogenic drivers may affect ecosystem processes through<br />
impacts on plant community composition, and may strengthen these predictions. Numerous<br />
studies have showed that graminoids may benefit more from N deposition than forbs or other<br />
growth forms. In moist alpine meadows, Bowman et al. (1995) reported an increase in the<br />
biomass of the graminoid Deschampsia caespitosa as compared to the forb Acomastylis rossii.<br />
In a recent survey, Korb & Ranker (2001) reported an increase of nitrophilous species<br />
10 The identity of these shrubs is not given in the paper of Bjork and Molau (2007). We made the hypothesis that<br />
these authors refer to lower altitude shrubs compared to dwarf shrubs present in late snowmelt locations.<br />
227
Synthèse et perspectives<br />
associated with an increase of a few dominant graminoids, especially Carex rupestris<br />
(Bowman et al. 2006). Similarly, N deposition in the central Alps and Northern Caucasus<br />
resulted in strong changes in dry matter production and community change towards a higher<br />
abundance of sedges (especially Carex sempervirens) (Soudzilovskaia and Onipchenko 2005,<br />
Bassin et al. 2007). Hence, the replacement of forbs and shrubs by graminoids in alpine<br />
ecosystems associated with higher production could even accelerate the impact of reduced<br />
snow cover on C cycling. Nevertheless, such prediction will have to be made by<br />
quantitatively linking these feedbacks to others simultaneously operating identified feedbacks<br />
(warming, snow cover).<br />
E. Perspectives<br />
The need to up-scale from leaf traits to CFP for predicting C mineralization<br />
Up-scaling from leaf decomposition to whole-plant decomposition is not<br />
straightforward. While leaf litter decomposition has been studied in various ecosystems and<br />
for a high number of species, functional groups, etc.., measurements of root and branch<br />
decomposition rates are under-investigated because of technical difficulties.<br />
Additionally, predicting community decomposition rate in an ecosystem is hindered by the<br />
need to quantify litter fluxes from aboveground vs. belowground and from woody vs. non<br />
woody plants/parts. Differences in C allocation at the whole-plant level affect ecosystem<br />
processes through the quality and quantity of litter inputs into the ecosystem<br />
(roots/stems/leaves). For example, C allocation to woody or non woody plants/parts affect<br />
decomposition rate as woody parts are characterized by higher lignin contents and lower<br />
decomposition rates. Similarly, species characterized by higher root/shoot ratios (R:S ratio)<br />
may lead to higher mean residence times of C in the ecosystem as root decomposition rates<br />
are generally lower than leaf decomposition rates because of higher lignin contents (e.g.<br />
Bryant et al. 1998).<br />
In order to predict decomposition rate at the community level, we therefore suggest<br />
four relevant steps:<br />
1. Evaluating whole-plant litter flux based on (1) the mean residence time of C within<br />
each plant compartment and (2) plant C allocations. Assessing the decay rate of the<br />
different compartments of the dominant plants by litter bag experiments.<br />
2. Predicting whole-plant decomposition rate based on the decomposition rate of each<br />
organ weighted by its biomass (i.e. additive or not?).<br />
228
Synthèse et perspectives<br />
3. Evaluating to which extent whole-plant aggregated Lignin:N ratio can be an accurate<br />
indicator of whole-plant decomposition rate.<br />
4. Scaling up to the community level following the same methodology as proposed in<br />
section A.<br />
Species-specific effects? The case study of tannins<br />
Tannins are well-known for their capabilities to complex nitrogen in vitro or in situ<br />
and thus reducing its bioavailability (see Kraus et al. 2003 for a review). They therefore<br />
contribute to increase SOM recalcitrance within the ecosystem. In cold and snow-covered<br />
ecosystems, tannin-rich shrubs are abundant (e.g. D. octopetala, Vaccinium sp., Empetrum<br />
sp.) and synthesis of these compounds is enhanced by environmental factors (UV, low<br />
fertility). However, to what extent tannins affect C mineralization remains poorly understood.<br />
Baptist et al. (2008) showed that freezing temperatures may stimulate the degradation of<br />
tannins extracted from D. octopetala. Several hypotheses have been proposed to explain the<br />
underlying processes and need to be addressed. In particular, two main questions raised by<br />
this study are:<br />
- Is there a relationship between the quantity of litter-rich tannin and SOM<br />
recalcitrance? These results suggest the possibility of using tannin quantity as a<br />
predictor of C mineralization in snow-covered ecosystems (when weighted by species<br />
abundance).<br />
- Do freezing temperatures (
Synthèse et perspectives<br />
The need for a better understanding of the interdependence between plants and<br />
microbes<br />
Microbial populations play a crucial role in providing nutrients to vegetation,<br />
illustrating the new paradigm proposed by Schimel & Bennett (2004) and further developed<br />
by Chapman et al. (2006). However, these results need to be confirmed and many points<br />
remain unexplored. The following question should be addressed in future studies:<br />
How important are mycorrhizae in uncorking the microbial bottleneck?<br />
Can alpine plants efficiently assimilate organic nitrogen without the presence of these<br />
symbionts?<br />
To what extent are late snowmelt communities dependant on the peak of nutrients at<br />
snowmelt?<br />
Is the uptake of organic nitrogen still efficient in the presence of higher mineral N<br />
concentrations? Inversely, are late snowmelt species able to assimilate organic N?, is<br />
this property rapidly developed if fertility decreases ?<br />
To what extent do variations in the temporal dynamics of mineral and organic nitrogen<br />
affect plant growth in early and late snowmelt locations respectively?<br />
The need for continous measurements of CO2 fluxes in alpine tundra<br />
This study remains limited in its capacity to predict carbon balance in alpine tundra.<br />
The evaluation of the source-sink dynamic is hindered by the absence of continuous CO2<br />
measurements. Over the last decade, there has been a burst of new sites where continuous<br />
measurements of land-atmosphere exchanges of water and CO2 were achieved using eddy<br />
covariance techniques (Canadell et al. 2000). It remains difficult to interpret eddies sampled<br />
over complex terrain, but some mountain ecosystems are now equipped (see Hammerle et al.<br />
2007), and attempts to correct fluxes are under progress (Rana et al. 2007). Hence, this<br />
technique appears quite promising for assessing carbon balances in alpine tundra.<br />
Beyond CO2 efflux measurements, another challenge will be to disentangle the<br />
controls over CO2 efflux during winter in order to quantify adequately yearly CO2 efflux in<br />
snow-covered ecosystems (Elberling and Brandt 2003, Schimel et al. 2006). Finally,<br />
experimental manipulations of the environment should be coupled with ecosystem process<br />
measurements in order to (1) validate model predictions in regards to the direct effect of snow<br />
cover on CO2 efflux and to (2) evaluate long-term vegetation shifts in response to global<br />
change.<br />
230
Bibliographie<br />
231
232
Bibliographie<br />
Bibliographie<br />
Anten, N. P. R. 2005. Optimal photosynthetic characteristics of individual plants in vegetation<br />
stands and implications for species coexistence. Annals of Botany 95:495-506.<br />
Anten, N. P. R., F. Schieving, and M. J. A. Werger. 1995. Patterns of light and nitrogen<br />
distribution in relation to whole canopy carbon gain in C3 and C4 mono- and<br />
dicotyledonous species. Oecologia 101:504-513.<br />
Arrouays, D., J. Balesdent, J. C. Germon, P. A. Jayet, J. F. Soussana, et al. 2002. Stocker du<br />
carbone dans les sols agricoles de France?<br />
Aubert, G., L. Borel, A. Lavagne, and P. Moutte. 1965. Feuille d'Embrun-Est. Elaboration<br />
d'une carte à moyenne échelle (1/50 000) à partir de relevés exécutés à grande échelle<br />
(1/20 000). Documents pour la Cartographie Végétale des Alpes III:61-86.<br />
Ball, J. T., I. E. Woodrow, and J. A. Berry. 1987. A model predicting stomatal conductance<br />
and its contribution to the control of photosynthesis under different environmental<br />
conditions. Pages 221-224 in J. Biggins, editor. Progress in photosynthetic reseach.<br />
Martinus Nijhoff Publishers.<br />
Baptist, F., and P. Choler. 2008. A simulation on the importance of growing season length<br />
and canopy functional properties on the seasonal Gross Primary Production of<br />
temperate alpine meadows. Annals Of Botany doi:10.1093/aob/mcm318.<br />
Baptist, F., L. Zinger, J. C. Clement, C. Gallet, R. Guillemin, et al. 2008. Tannin impacts on<br />
microbial diversity and the functioning of alpine soils: a multidisciplinary approach.<br />
Environmental Microbiology 10:799-809.<br />
Barnett, T. P., L. Dumenil, U. Schlese, E. Roeckner, and M. Latif. 1989. The effects of<br />
Eurasian snow cover on regional and global climate variations. Journal of atmospheric<br />
science 46:661-685.<br />
Bassin, S., M. Volk, M. Suter, N. Buchmann, and J. Fuhrer. 2007. Nitrogen deposition but not<br />
ozone affects productivity and community composition of subalpine grassland after 3<br />
yr of treatment. New Phytologist 175:523-534.<br />
Becker, A., and H. Bugmann. 2001. Global Changes and Mountain Regions. Stockolm,<br />
Sweden.<br />
Beerling, D. J. 1998. Salix herbacea L. Journal of Ecology 86:872-895.<br />
Bell, K. L., and L. C. Bliss. 1979. Autoecology of Kobresia bellardii: why winter snow<br />
accumulation limits local distribution. Ecological Monographs 49:377-402.<br />
233
Bibliographie<br />
Beniston, M. 2005. Mountain climates and climatic change: An overview of processes<br />
focusing on the European Alps. Pure and Applied Geophysics 162:1587-1606.<br />
Beniston, M., and D. G. Fox. 1996. Incidences de l'évolution du climat sur les régions de<br />
montagne.<br />
Billings, W. D. 1973. Arctic and alpine vegetations: similarities, differences, and<br />
susceptibility to disturbance. Bioscience 23:697-704.<br />
Billings, W. D., and L. C. Bliss. 1959. An alpine snowbank environment and its effect on<br />
vegetation, plant development and productivity. Ecology 40:388-397.<br />
Bjork, R. G., M. P. Bjorkman, M. X. Andersson, and L. Klemedtsson. 2008. Temporal<br />
variation in soil microbial communities in <strong>Alpine</strong> tundra. Soil Biology and<br />
Biochemistry 40:266.<br />
Bjork, R. G., and U. Molau. 2007. Ecology of alpine snowbed and the impact of global<br />
change. Arctic, Antarctic and <strong>Alpine</strong> research 39:34-43.<br />
Boskheim, J. G., L. R. Everett, K. M. Hinkel, F. E. Nelson, and J. Brown. 1999. Soil organic<br />
carbon storage and distribution in arctic tundra, Barrow, Alaska. Soil Sci Soc Am J<br />
63:934-940.<br />
Bowman, W. D. 1992. Inputs and storage of nitrogen in winter snowpack in an alpine<br />
ecosystem. Arctic And <strong>Alpine</strong> Research 24:211-215.<br />
Bowman, W. D., J. R. Gartner, K. Holland, and M. Wiedermann. 2006. Nitrogen critical loads<br />
for alpine vegetation and terrestrial ecosystem response: Are we there yet? Ecological<br />
Applications 16:1183-1193.<br />
Bowman, W. D., T. A. Theodose, and M. C. Fisk. 1995. Physiological and production<br />
responses of plant growth forms to increases in limiting ressources in alpine tundra:<br />
implications for differential community response to environmental change. Oecologia<br />
101:217-227.<br />
Bowman, W. D., T. A. Theodose, J. C. Schardt, and R. T. Conant. 1993. Constraints of<br />
nutrient avaibility on primary production in two alpine communities. Ecology<br />
74:2085-2097.<br />
Brooks, P. D., and M. W. Williams. 1999. Snowpack controls on nitrogen cycling and export<br />
in seasonally snow-covered catchments. Hydrological Processes 13:2177-2190.<br />
Brooks, P. D., M. W. Williams, and S. K. Schmidt. 1998. Inorganic nitrogen and microbial<br />
biomass dynamics before and during spring snowmelt. Biogeochemistry 43:1-15.<br />
Bryant, D. M., E. A. Holland, T. R. Seastedt, and M. D. Walker. 1998. Analysis of litter<br />
decomposition in an alpine tundra. Canadian Journal of Botany 76:1295-1304.<br />
234
Bibliographie<br />
Canadell, J., H. A. Mooney, D. D. Baldocchi, J. A. Berry, J. R. Ehleringer, et al. 2000. Carbon<br />
metabolism of the terrestrial biosphere: A multitechnique approach for improved<br />
understanding. Ecosystems 3:115-130.<br />
Chapin, F. S., III. 1983. Direct and indirect effects of temperature on arctic plants. Polar<br />
Biology 2:47-52.<br />
Chapin, F. S., III, K. Autumn, and F. Pugnaire. 1993a. Evolution of suites of traits in response<br />
to environmental stress. American Naturalist 142:578-592.<br />
Chapin, F. S., III, M. S. Bret-Harte, S. E. Hobbie, and H. Zhong. 1996. Plant functionnal<br />
types as predictors of transcient responses of arctic vegetation to global change.<br />
Journal of Vegetation Science 7:693-702.<br />
Chapin, F. S., III, N. Fetcher, K. Kielland, K. R. Everett, and A. E. Linkins. 1988.<br />
Productivity and nutrient cycling of Alaskan tundra: enhancement by flowing soil<br />
water. Ecology 69:225-238.<br />
Chapin, F. S., III, L. Moilanen, and K. Kielland. 1993b. Preferential use of organic nitrogen<br />
for growth by a non-mycorrhizal arctic sedge. Nature 361:743-751.<br />
Chapin, F. S., III, G. R. Shaver, A. E. Giblin, K. J. Nadelhoffer, and J. A. Laundre. 1995.<br />
Responses of arctic tundra to experimental and observed changes in climate. Ecology<br />
76:167-195.<br />
Chapin, F. S., E. D. Schulze, and H. A. Mooney. 1990. The Ecology And Economics Of<br />
Storage In Plants. Annual Review of Ecology and Systematics 21:423-447.<br />
Chapin, F. S., M. Sturm, M. C. Serreze, J. P. McFadden, J. R. Key, et al. 2005. Role of landsurface<br />
changes in Arctic summer warming. Science 310:657-660.<br />
Chapin, F. S., E. S. Zavaleta, V. T. Eviner, R. L. Naylor, P. M. Vitousek, et al. 2000.<br />
Consequences of changing biodiversity. Nature 405:234-242.<br />
Chapman, S. K., J. A. Langley, S. C. Hart, and G. W. Koch. 2006. Plants actively control<br />
nitrogen cycling: uncorking the microbial bottleneck. New Phytologist 169:27-34.<br />
Choler, P. 2005. Consistent shifts in <strong>Alpine</strong> plant traits along a mesotopographical gradient.<br />
Arctic Antarctic And <strong>Alpine</strong> Research 37:444-453.<br />
De Deyn, G. B., J. H. C. Cornelissen, and R. D. Bardgett. in press. Plant functional traits and<br />
soil carbon sequestration in contrasting biomes. Ecology Letters doi:10.1111/j.1461-<br />
0248.2008.01164.x.<br />
Diaz, H. F., and R. S. Bradley. 1997. Temperature variations during the last century at high<br />
elevation sites. Climatic Change 36:253-279.<br />
Diaz, S., S. Lavorel, F. de Bello, F. Quetier, K. Grigulis, et al. 2007. Incorporating plant<br />
235
Bibliographie<br />
functional diversity effects in ecosystem service assessments. Proceedings Of The<br />
National Academy Of Sciences Of The United States Of America 104:20684-20689.<br />
Diemer, M. W. 1994. Mid-season gas exchange of an alpine grassland under elevated CO2.<br />
Oecologia 98:429-435.<br />
Diggle, P. K. 1997. Extreme preformation in alpine Polygonum viviparum: an architectural<br />
and developmental analysis. Am. J. Bot. 84:154-169.<br />
Dobremez, J. F., and R. Eynard-Machet. 1997. Histoire de l'occupation des sols, cycles du<br />
carbone et biodiversité dans la Réserve naturelle du Plan de Tueda (Savoie, France) -<br />
Les enjeux de la gestion. Revue de géographie alpine 3:27-37.<br />
Dorrepaal, E. 2007. Are plant growth-form-based classifications useful in predicting northern<br />
ecosystem carbon cycling feedbacks to climate change? Journal of Ecology 95:1167-<br />
1180.<br />
Dorrepaal, E., R. Aerts, J. H. C. Cornelissen, T. V. Callaghan, and R. S. P. Van Logtestijn.<br />
2003. Summer warming and increased winter snow cover affect Sphagnum fuscum<br />
growth, structure and production in a sub-arctic bog. Global Change Biology 10:93-<br />
104.<br />
Dorrepaal, E., J. H. C. Cornelissen, R. Aerts, B. O. Wallen, and R. S. P. Van Logtestijn. 2005.<br />
Are growth forms consistent predictors of leaf litter quality and decomposability<br />
across peatlands along a latitudinal gradient? Journal of Ecology 93:817-828.<br />
Dye, D. G., and C. J. Tucker. 2003. Seasonality and trends of snow-cover, vegetation index,<br />
and temperature in northern Eurasia. Geophysical Research Letters 30:9-12.<br />
Edwards, A. C., R. Scalenghe, and M. Freppaz. 2007. Changes in the seasonal snow cover of<br />
alpine regions and its effect on soil processes: A review. Quaternary International<br />
172:162-163.<br />
Elberling, B. 2007. Annual soil CO2 effluxes in the High Arctic: The role of snow thickness<br />
and vegetation type. Soil Biology and Biochemistry 39:646-654.<br />
Elberling, B., and K. K. Brandt. 2003. Uncoupling of microbial CO2 production and release in<br />
frozen soil and its implications for field studies of arctic C cycling. Soil Biology and<br />
Biochemistry 35:263-272.<br />
Elberling, B., B. H. Jakobsen, P. Berg, J. Sondergaard, and C. Sigsgaard. 2004. Influence of<br />
vegetation, temperature, and water content on soil carbon distribution and<br />
mineralization in four high Arctic soils. Arctic Antarctic And <strong>Alpine</strong> Research 36:528-<br />
538.<br />
Fang, C., and J. B. Moncrieff. 2001. The dependence of soil CO2 efflux on temperature. Soil<br />
236
Bibliographie<br />
Biology and Biochemistry 33:155-165.<br />
Farquhar, G. D., S. Von Caemmerer, and J. A. Berry. 1980. A biochemical model of<br />
photosynthetic CO2 assimilation in leaves of C3 species. Planta 149:78-90.<br />
Favarger, C., and P. A. Robert. 1995. Flore et végétation des Alpes.<br />
Fierer, N., M. A. Bradford, and R. B. Jackson. 2007. Toward an ecological classification of<br />
soil bacteria. Ecology 88:1354-1364.<br />
Fisk, M. C., S. K. Schmidt, and T. R. Seastedt. 1998. Topographic patterns of above- and<br />
belowground production and nitrogen cycling in <strong>Alpine</strong> tundra. Ecology 79:2253-<br />
2266.<br />
Flock, J. W. 1978. Lichen-bryophytes distribution along a snow-cover-soil-moisture gradient,<br />
Niwot ridge, Colorado. Arctic And <strong>Alpine</strong> Research 10:31-47.<br />
Friedel, H. 1961. Schneedeckendauer und Vegetationsverteilungen im Gelände. Mitt. Forstl.<br />
Bundes Versuchsanst Mariabrunn (Wien) 59:317-369.<br />
Gardes, M., and A. Dahlberg. 1996. Mycorrhizal diversity in arctic and alpine tundra: An<br />
open question. New Phytologist 133:147-157.<br />
Garnier, E., J. Cortez, G. Billes, M. L. Navas, C. Roumet, et al. 2004. Plant functional<br />
markers capture ecosystem properties during secondary succession. Ecology 85:2630-<br />
2637.<br />
Garnier, E., S. Lavorel, P. Ansquer, H. Castro, P. Cruz, et al. 2007. Assessing the effects of<br />
land-use change on plant traits, communities and ecosystem functioning in grasslands:<br />
A standardized methodology and lessons from an application to 11 European sites.<br />
Annals Of Botany 99:967-985.<br />
Grabherr, G., and A. Cernusca. 1977. Influence of radiation, wind, and temperature on the<br />
CO2 gas exchange of the <strong>Alpine</strong> dwarf shrub community Loiseleurietum<br />
cetrarietosum. Photosynthetica 11:22-28.<br />
Green, D. S., J. E. Erickson, and E. L. Kruger. 2003. Foliar morphology and canopy nitrogen<br />
as predictors of light-use efficiency in terrestrial vegetation. Agricultural And Forest<br />
Meteorology 115:165-173.<br />
Grelet, G. A., I. J. Alexander, P. Millard, and M. F. Proe. 2003. Does morphology or the size<br />
of the internal nitrogen store determine how Vaccinium spp. respond to spring<br />
nitrogen supply? Functional Ecology 17:690-699.<br />
Grime, J. P. 1998. Benefits of plant diversity to ecosystems: immediate, filter and founder<br />
effects. Journal of Ecology 86:902-910.<br />
Grimoldi, A. A., M. Kavanova, F. A. Lattanzi, R. Schaufele, and H. Schnyder. 2006.<br />
237
Bibliographie<br />
Arbuscular mycorrhizal colonization on carbon economy in perennial ryegrass:<br />
quantification by (CO2)-C-13/(CO2)-C-12 steady-state labelling and gas exchange.<br />
New Phytologist 172:544-553.<br />
Groffman, P. M., C. T. Driscoll, T. J. Fahey, J. P. Hardy, R. D. Fitzhugh, et al. 2001a. Colder<br />
soils in a warmer world: A snow manipulation study in a northern hardwood forest<br />
ecosystem. Biogeochemistry 56:135-150.<br />
Groffman, P. M., C. T. Driscoll, T. J. Fahey, J. P. Hardy, R. D. Fitzhugh, et al. 2001b. Effects<br />
of mild winter freezing on soil nitrogen and carbon dynamics in a northern hardwood<br />
forest. Biogeochemistry 56:191-213.<br />
Grogan, P., and S. Jonasson. 2005. Temperature and substrate controls on intra-annual<br />
variation in ecosystem respiration in two subarctic vegetation types. Global Change<br />
Biology 11:465-475.<br />
Grogan, P., and S. Jonasson. 2006. Ecosystem CO2 production during winter in a Swedish<br />
subarctic region: the relative importance of climate and vegetation type. Global<br />
Change Biology 12:1479-1495.<br />
Groisman, P. Y., and T. D. Davies. 2000. Snow cover and the climate system. Pages 1-44 in<br />
H. G. Jones, J. W. Pomeroy, D. A. Walker, and R. W. Hoham, editors. Snow ecology:<br />
an interdisciplinary examination of snow-covered ecosystems. Cambridge University<br />
Press.<br />
Gu, S., Y. H. Tang, X. Y. Cui, T. Kato, M. Y. Du, et al. 2005. Energy exchange between the<br />
atmosphere and a meadow ecosystem on the Qinghai-Tibetan Plateau. Agricultural<br />
And Forest Meteorology 129:175-185.<br />
Hammerle, A., A. Haslwanter, M. Schmitt, M. Bahn, U. Tappeiner, et al. 2007. Eddy<br />
covariance measurements of carbon dioxide, latent and sensible energy fluxes above a<br />
meadow on a mountain slope. Boundary Layer Meteorology 122:397-416.<br />
Hikosaka, K., and T. Hirose. 1997. Leaf angle as a strategy for light competition: optimal and<br />
evolutionarily stable light-extinction coefficient within a leaf canopy. Ecoscience<br />
4:501-507.<br />
Hirose, T. 2005. Development of the Monsi-Saeki theory on canopy structure and function.<br />
Annals Of Botany 95:483-494.<br />
Hobbie, S. E. 1996. Temperature and plant species control over litter decomposition in<br />
Alaskan tundra. Ecological Monographs 66:269-279.<br />
Hobbie, S. E., and F. S. Chapin. 1996. Winter regulation of tundra litter carbon and nitrogen<br />
dynamics. Biogeochemistry 35:327-338.<br />
238
Bibliographie<br />
Hobbie, S. E., J. P. Schimel, S. E. Trumbore, and J. R. Randerson. 2000. Controls over carbon<br />
storage and turnover in high-latitude soils. Global Change Biology 6 Suppl. 1:196-<br />
210.<br />
Hodgson, J. G., P. J. Wilson, R. Hunt, J. P. Grime, and K. Thompson. 1999. Allocating C-S-R<br />
plant functional types: a soft approach to a hard problem. Oikos 85:282-294.<br />
Hurrell, J. W. 1995. Decadal trends in the North Atlantic Oscillation: Regional Temperatures<br />
and Precipitation. Science 269:676-679.<br />
Inouye, D. W. 2000. The ecological and evolutionary significance of frost in the context of<br />
climate change. Ecology Letters 3:457-463.<br />
Jackson, R. B., J. L. Banner, E. G. Jobbagy, W. T. Pockman, and D. H. Wall. 2002.<br />
Ecosystem carbon loss with woody plant invasion of grasslands. Nature 418:623.<br />
Joffre, R., and G. I. Agren. 2001. From Plant to Soil: Litter Production and Decomposition.<br />
Pages 83-99 in A. Press, editor. Terrestrial global productivity.<br />
Jonasson, S., F. S. Chapin, and G. R. Shaver. 2001. Biogeochemistry in the Arctic: Patterns,<br />
Processes and Controls. Pages 139-166 in E. D. Schulze, M. Heimann, S. Harrison, E.<br />
Holland, J. Lloyd, I. C. Prentice, and D. S. Schimel, editors. Global Biogeochemical<br />
cycles in the climate system. Academic Press, San Diego.<br />
Kato, T., M. Hirota, Y. Tang, X. Cui, Y. Li, et al. 2005. Strong temperature dependence and<br />
no moss photosynthesis in winter CO2 flux for a Kobresia meadow on the Qinghai-<br />
Tibetan plateau. Soil Biology and Biochemistry 37:1966-1969.<br />
Kato, T., Y. H. Tang, S. Gu, M. Hirota, M. Y. Du, et al. 2006. Temperature and biomass<br />
influences on interannual changes in CO2 exchange in an alpine meadow on the<br />
Qinghai-Tibetan Plateau. Global Change Biology 12:1285-1298.<br />
Kazakou, E. 2006. Vie, mort et décomposition des feuilles d'espèces de succession secondaire<br />
méditerranéenne: vers une intégration de la gestion des élements minéraux par les<br />
végétaux. <strong>Université</strong> Montpellier II, Montpellier.<br />
Kielland, K. 1994. Amino acid absorption by arctic plants: implications for plant nutrition and<br />
nitrogen cycling. Ecology 75:155-181.<br />
Klanderud, K., and O. Totland. 2005. Simulated climate change altered dominance hierarchies<br />
and diversity of an alpine biodiversity hotspot. Ecology 86:2047-2054.<br />
Knops, J. M. H., K. L. Bradley, and D. A. Wedin. 2002. Mechanisms of plant species impacts<br />
on ecosystem nitrogen cycling. Ecology Letters 5:454-466.<br />
Kohls, S. J., J. Thimmapuram, C. A. Buschena, M. W. Paschke, and J. O. Dawson. 1994.<br />
Nodulation patterns of actinorhizal plants in the family Rosaceae. Plant And Soil<br />
239
Bibliographie<br />
162:229-239.<br />
Korb, J. E., and T. A. Ranker. 2001. Changes in stand composition and structure between<br />
1981 and 1996 in four Front Range plant communities in Colorado. Plant Ecology<br />
157:1-11.<br />
Körner, C. 1999. <strong>Alpine</strong> Plant Life. Springer Verlag, Berlin.<br />
Kraus, T. E. C., R. A. Dahlgren, and R. J. Zasoski. 2003. Tannins in nutrient dynamics of<br />
forest ecosystems - a review. Plant And Soil 256:41-66.<br />
Kudo, G. 1992. Performance and phenology of alpine herbs along a snow-melting gradient.<br />
Ecological Research 7:299-316.<br />
Kudo, G. 1996. Intraspecific variation of leaf traits in several deciduous species in relation to<br />
lenght of growing season. Ecoscience 3:483-489.<br />
Kudo, G., U. Nordenhall, and U. Molau. 1999. Effects of snowmelt timing on leaf traits, leaf<br />
production, and shoot growth of alpine plants: Comparisons along a snowmelt<br />
gradient in northern Sweden. Ecoscience 6:439-450.<br />
Laternser, M., and M. Schneebeli. 2003. Long-term snow climate trends of the Swiss Alps<br />
(1931-99). Journal of climatology 23:733-750.<br />
Lavorel, S., and E. Garnier. 2002. Predicting changes in community composition and<br />
ecosystem functioning from plant traits: revisiting the Holy Grail. Functional Ecology<br />
16:545-556.<br />
Lavorel, S., S. Mcintyre, J. Landsberg, and T. D. A. Forbes. 1997. Plant functional<br />
classifications: from general groups to specific groups based on response to<br />
disturbance. Trends In Ecology And Evolution 12:474-478.<br />
Lipson, D. A., R. K. Monson, and W. D. Bowman. 1996. Luxury uptake and storage of<br />
nitrogen in the rhizomatous alpine herb, Bistorta bistortoides. Ecology 77:569-576.<br />
Lipson, D. A., C. W. Schadt, and S. K. Schmidt. 2002. Changes in soil microbial community<br />
structure and function in an alpine dry meadow following spring snow melt. Microbial<br />
Ecology 43:307-314.<br />
Lipson, D. A., C. W. Schadt, S. K. Schmidt, and R. K. Monson. 1999. Ectomycorrhizal<br />
transfer of amino acid-nitrogen to the alpine sedge Kobresia myosuroides. New<br />
Phytologist 142:163-167.<br />
Long, S. P., E. A. Ainsworth, A. D. B. Leakey, J. Nosberger, and D. R. Ort. 2006. Food for<br />
thought: Lower-than-expected crop yield stimulation with rising CO2 concentrations.<br />
Science 312:1918-1921.<br />
Loya, W. M., L. C. Johnson, and K. J. Nadelhoffer. 2004. Seasonal dynamics of leaf- and<br />
240
Bibliographie<br />
root-derived C in arctic tundra mesocosms. Soil Biology and Biochemistry 36:655.<br />
McGuire, A. D., F. S. Chapin, J. E. Walsh, and C. Wirth. 2006. Integrated regional changes in<br />
arctic climate feedbacks: Implications for the global climate system. Annual Review<br />
Of Environment And Resources 31:61-91.<br />
Messerli, B., and J. D. Ives. 1999. Les montagnes dans le monde. Glénat.<br />
Mikan, C. J., J. P. Schimel, and A. P. Doyle. 2002. Temperature controls of microbial<br />
respiration in arctic tundra soils above and below freezing. Soil Biology &<br />
Biochemistry 34:1785-1795.<br />
Monsi, M., and T. Saeki. 1953. Über den lichtkaktor in den pflanzengesellschaften und seine<br />
bedeutung fur die stoffproduktion. Japanese journal of botany 14:22-52.<br />
Monson, R. K., D. L. Lipson, S. P. Burns, A. A. Turnipseed, A. C. Delany, et al. 2006. Winter<br />
forest soil respiration controlled by climate and microbial community composition.<br />
Nature 439:711-714.<br />
Nadelhoffer, K. J., A. E. Giblin, G. R. Shaver, and J. A. Laundre. 1991. Effects of<br />
temperature and substrate quality on element mineralization in six arctic soils.<br />
Ecology 72:75-86.<br />
Noguès-Bravo, D., M. B. Araujo, M. P. Errea, and J. P. Martinez-Rica. 2007. Exposure of<br />
global mountain systems to climate warming during the 21st Century. Global<br />
Environmental Change 17:420-428.<br />
Norby, R. J., and Y. Luo. 2004. Evaluating ecosystem responses to rising atmospheric CO2<br />
and global warming in a multi-factor world. New Phytologist 162:281-293.<br />
Oechel, W. C., S. J. Hastings, G. Vourlitis, M. Jenkins, G. Riechers, et al. 1993. Recent<br />
change of arctic tundra ecosystems from a net carbon dioxide sink to a source. Nature<br />
361:520-523.<br />
Ozenda, P. 2002. Perspectives pour une géobiologie des montagnes.<br />
Perez Harguindeguy, N., S. Diaz, J. H. C. Cornelissen, F. Vendramini, M. Cabido, et al. 2000.<br />
Chemistry and toughness predict leaf litter decomposition rates over a wide spectrum<br />
of functional types and taxa in central Argentina. Plant And Soil 218:21-30.<br />
Piao, S. L., P. Friedlingstein, P. Ciais, N. Viovy, and J. Demarty. 2007. Growing season<br />
extension and its impact on terrestrial carbon cycle in the Northern Hemisphere over<br />
the past 2 decades. Global Biogeochemical Cycles 21.<br />
Pomeroy, J. W., and E. Brun. 2000. Physical Properties of Snow. Pages 45-126 in H. G.<br />
Jones, J. W. Pomeroy, D. A. Walker, and R. W. Hoham, editors. Snow ecology: an<br />
interdisciplinary examination of snow-covered ecosystems. Cambridge University<br />
241
Bibliographie<br />
Press.<br />
Post, W. M., W. R. Emanuel, P. J. Zinke, and A. G. Stangenberger. 1982. Soil carbon pools<br />
and world life zones. Nature 298:156-159.<br />
Quested, H., O. Eriksson, C. Fortunel, and E. Garnier. 2007. Plant traits relate to wholecommunity<br />
litter quality and decomposition following land use change. Functional<br />
Ecology 21:1016-1026.<br />
Quétier, F., A. Thebault, and S. Lavorel. 2007. Plant traits in a state and transition framework<br />
as markers of ecosystem response to land-use change. Ecological monograph 77:33-<br />
52.<br />
Raab, T. K., D. A. Lipson, and R. K. Monson. 1999. Soil amino acid utilization among<br />
species of the Cyperaceae: Plant and soil processes. Ecology 80:2408-2419.<br />
Rana, G., R. M. Ferrara, N. Martinelli, P. Personnic, and P. Cellier. 2007. Estimating energy<br />
fluxes from sloping crops using standard agrometeorological measurements and<br />
topography. Agricultural And Forest Meteorology 146:116.<br />
Reich, P. B., D. S. Ellsworth, M. B. Walters, J. M. Vose, C. Gresham, et al. 1999. Generality<br />
of leaf trait relationships: A test across six biomes. Ecology 80:1955-1969.<br />
Roumet, C., C. Urcelay, and S. Diaz. 2006. Suites of root traits differ between annual and<br />
perennial species growing in the field. New Phytologist 170:357-368.<br />
Rustad, L. E. 2006. From transient to steady-state response of ecosystems to atmospheric<br />
CO2-enrichment and global climate change: Conceptual challenges and need for an<br />
integrated approach. Plant Ecology 182:43-62.<br />
Sandvik, S. M., E. Heegaard, R. Eleven, and V. Vandvick. 2004. Response of alpine snowbed<br />
vegetation to long-term experimental warming. Ecoscience 11:150-159.<br />
Schadt, C. W., A. P. Martin, D. A. Lipson, and S. K. Schmidt. 2003. Seasonal dynamics of<br />
previously unknown fungal lineages in tundra soils. Science 301:1359-1361.<br />
Schimel, J. P., and J. Bennett. 2004. Nitrogen mineralization: Challenges of a changing<br />
paradigm. Ecology 85:591-602.<br />
Schimel, J. P., C. Bilbrough, and J. M. Welker. 2004. Increased snow depth affects microbial<br />
activity and nitrogen mineralization in two Arctic tundra communities. Soil Biology<br />
and Biochemistry 36:217.<br />
Schimel, J. P., J. Fahnestock, G. Michaelson, C. Mikan, C. L. Ping, et al. 2006. Cold-season<br />
production of CO2 in arctic soils: Can laboratory and field estimates be reconciled<br />
through a simple modeling approach? Arctic Antarctic And <strong>Alpine</strong> Research 38:249-<br />
256.<br />
242
Bibliographie<br />
Schmidt, S. K., E. K. Costello, D. R. Nemergut, C. C. Cleveland, S. C. Reed, et al. 2007.<br />
Biogeochemical consequences of rapid microbial turnover and seasonal succession in<br />
soil. Ecology 88:1379-1385.<br />
Schmidt, S. K., and D. A. Lipson. 2004. Microbial growth under the snow: Implications for<br />
nutrient and allelochemical availability in temperate soils. Plant And Soil 259:1-7.<br />
Schöb, C., P. M. Kammer, P. Choler, and H. Veit. in revision. Sensitivity of small scale<br />
vascular plant species distribution in snowbeds to climate change. Plant Ecology.<br />
Serreze, M. C., J. E. Walsh, F. S. Chapin, T. Osterkamp, M. Dyurgerov, et al. 2000.<br />
Observational evidence of recent change in the northern high-latitude environment.<br />
Climatic Change 46:159-207.<br />
Sorenson, T. 1941. Temperature relations and phenology of north-east Greenland flowering<br />
plants. Meddelelser 125:1-305.<br />
Soudzilovskaia, N. A., and V. G. Onipchenko. 2005. Experimental investigation of<br />
fertilization and irrigation effects on an alpine heath, northwestern Caucasus, Russia.<br />
Arctic Antarctic And <strong>Alpine</strong> Research 37:602-610.<br />
Sturm, M., J. E. McFadden, G. E. Liston, F. S. Chapin, C. H. Racine, et al. 2001. Snow-shrub<br />
interactions in Arctic tundra: a hypothesis with climate implications. Journal of<br />
Climate 14:336-344.<br />
Tappeiner, U., and A. Cernusca. 1998. Model simulation of spatial distribution of<br />
photosynthesis in structurally differing plant communities in the Central Caucasus.<br />
Ecological Modelling 113:201-223.<br />
Taschler, D., and G. Neuner. 2004. Summer frost resistance and freezing patterns measured in<br />
situ in leaves of major alpine plant growth forms in relation to their upper distribution<br />
boundary. Plant Cell And Environment 27:737-746.<br />
Theurillat, J. P., and A. Guisan. 2001. Potential impact of climate change on vegetation in the<br />
European Alps: A review. Climatic Change 50:77-109.<br />
Tranter, M., and H. G. Jones. 2000. The chemistry of Snow: Processes and Nutrient cycling.<br />
Pages 127-167 in H. G. Jones, J. W. Pomeroy, D. A. Walker, and R. W. Hoham,<br />
editors. Snow ecology: an interdisciplinary examination of snow-covered ecosystems.<br />
Cambridge University Press.<br />
Uchida, M., W. Mo, T. Nakatsubo, Y. Tsuchiya, T. Horikoshi, et al. 2005. Microbial activity<br />
and litter decomposition under snow cover in a cool-temperate broad-leaved<br />
deciduous forest. Agricultural And Forest Meteorology 134:102-109.<br />
van der heijden, M. G. A., R. Bardgett, and N. M. van Straalen. 2008. The unseen majority:<br />
243
Bibliographie<br />
soil microbes as drivers of plant diversity and productivity in terrestrial ecosystems.<br />
Ecology Letters 11:296-310.<br />
Violle, C., M.-L. Navas, D. Vile, E. Kazakou, C. Fortunel, et al. 2007. Let the concept of trait<br />
be functional! Oikos 116:882-892.<br />
Von Caemmerer, S., and G. D. Farquhar. 1981. Some relationships between the biochemistry<br />
of photosynthesis and the gas exchange of leaves. Planta 153:376-387.<br />
Wahren, C. H. A., M. D. Walker, and M. S. Bret-Harte. 2005. Vegetation responses in<br />
Alaskan arctic tundra after 8 years of a summer warming and winter snow<br />
manipulation experiment. Global Change Biology 11:537-552.<br />
Walker, D. A., W. D. Billings, and J. G. de Molenaar. 2000. Snow-Vegetation Interactions In<br />
Tundra Environments. Pages 266-324 in H. G. Jones, J. W. Pomeroy, D. A. Walker,<br />
and R. W. Hoham, editors. Snow ecology: an interdisciplinary examination of snowcovered<br />
ecosystems. Cambridge University Press.<br />
Walker, D. A., J. C. Halfpenny, M. D. Walker, and C. A. Wessman. 1993. Long-term studies<br />
of snow-vegetation interactions. Bioscience 43:471-480.<br />
Walker, M. D., R. C. Ingersoll, and P. J. Webber. 1995. Effects of interannual climate<br />
variation on phenology and growth of two alpine forbs. Ecology 76:1067-1083.<br />
Walker, M. D., C. H. Wahren, R. D. Hollister, G. H. R. Henry, L. E. Ahlquist, et al. 2006.<br />
From The Cover: Plant community responses to experimental warming across the<br />
tundra biome. Proceedings of the National Academy of Sciences 103:1342-1346.<br />
Walker, M. D., D. A. Walker, J. M. Welker, A. M. Arft, T. Bardsley, et al. 1999. Long-term<br />
experimental manipulation of winter snow regime and summer temperature in arctic<br />
and alpine tundra. Hydrological Processes 13:2315-2330.<br />
Walling, S. Z., and C. A. Zabinski. 2006. Defoliation effects on arbuscular mycorrhizae and<br />
plant growth of two native bunchgrasses and an invasive forb. Applied Soil Ecology<br />
32:111.<br />
Weiher, E., V. d. W. A., K. Thompson, M. Roderick, E. Garnier, et al. 1999. Challenging<br />
Theophrastus: a common core list of plant traits for functional ecology. Journal of<br />
Vegetation Science 10:609-620.<br />
Welker, J. M., J. T. Fahnestock, and M. H. Jones. 2000. Annual CO2 flux in dry and moist<br />
arctic tundra: Field responses to increases in summer temperatures and winter snow<br />
depth. Climatic Change 44:139-150.<br />
Welker, J. M., U. Molau, A. N. Parsons, C. H. Robinson, and P. A. Wookey. 1997. Responses<br />
of Dryas octopetala to ITEX environmental manipulations: a synthesis with<br />
244
Bibliographie<br />
circumpolar comparisons. Global Change Biology 3:61-73.<br />
Wipf, S., C. Rixen, and C. P. H. Mulder. 2006. Advanced snowmelt causes shift towards<br />
positive neighbour interactions in a subarctic tundra community. Global Change<br />
Biology 12:1496-1506.<br />
Wohlfahrt, G., M. Bahn, E. Haubner, I. Horak, W. Michaeler, et al. 1999. Inter-specific<br />
variation of the biochemical limitation to photosynthesis and related leaf traits of 30<br />
species from mountain grassland ecosystems under different land use. Plant, Cell &<br />
Environment 22:1281-1296.<br />
Wohlfahrt, G., M. Bahn, U. Tappeiner, and A. Cernusca. 2000. A model of whole plant gas<br />
exchange for herbaceous species from mountain grassland sites differing in land use.<br />
Ecological Modelling 125:173-201.<br />
Woodward, F. I., and W. Cramer. 1996. Plant functional types and climatic changes. Journal<br />
of Vegetation Science 7:306-328.<br />
Wright, I. J., P. B. Reich, M. Westoby, D. D. Ackerly, Z. Baruch, et al. 2004. The worldwide<br />
leaf economics spectrum. Nature 428:821-827.<br />
Zak, D. R., C. B. Blackwood, and M. P. Waldrop. 2006. A molecular dawn for<br />
biogeochemistry. Trends In Ecology And Evolution 21:288-295.<br />
Zhao, L., Y. Li, S. Xu, H. Zhou, S. Gu, et al. 2006. Diurnal, seasonal and annual variation in<br />
net ecosystem CO2 exchange of an alpine shrubland on Qinghai-Tibetan plateau.<br />
Global Change Biology 12:1940-1953.<br />
Zhou, C., Q. Zhou, and S. Wang. 2003. Estimating and analysing the spatial distribution of<br />
soil organic carbon in China. Ambio 32:6-12.<br />
Zinke, P. J., A. G. Stangenberger, W. M. Post, W. R. Emanuel, and J. S. Olson. 1998. Global<br />
organic soil carbon and nitrogen. in. www.daac.ornl.gov.<br />
245
Bibliographie<br />
246
Annexes<br />
247
ANNEXES<br />
Annexe 1________________________________________________________________ 249<br />
Annexe 2________________________________________________________________ 251<br />
248
Annexes<br />
Annexe 1<br />
Liste et présence des espèces dans les sites B, C et D en situation thermiques et nivales. Relevé réalisé durant<br />
le mois de juillet 2007.<br />
Situation nivale Situation thermique<br />
Sites B C D B C D<br />
Alchemilla pentaphyllea L.<br />
4<br />
Carex foetida All.<br />
2<br />
Alopecurus alpinus Vill.<br />
1<br />
Salix herbacea L.<br />
4<br />
Plantago alpina L.<br />
1<br />
Sibbaldia procumbens L.<br />
1<br />
Nardus stricta L.<br />
1<br />
Omalotheca supina (L.) DC.<br />
2<br />
Potentilla aurea L.<br />
0<br />
Geum montanum L.<br />
0<br />
Ranunculus kuepferi Greuter & Burdet<br />
0<br />
Ranunculus montanus Willd.<br />
0<br />
Taraxacum alpinum Weber<br />
1<br />
Cardamine bellidifolia L. subsp. alpina (Willd.) B.M.G. Jones 0<br />
Cirsium acaule Scop.<br />
0<br />
Cirsium spinosissimum (L.) Scop.<br />
0<br />
Festuca violacea Gaudin<br />
0<br />
Pedicularis rostratospicata Crantz<br />
0<br />
Veronica alpina L.<br />
0<br />
Dryas octopetala L.<br />
0<br />
Kobresia myosuroides (Vill.) Fiori<br />
0<br />
Carex curvula All. subsp. rosae Gilomen<br />
0<br />
Festuca halleri All.<br />
0<br />
Minuartia verna (L.) Hiern<br />
0<br />
Androsace vitaliana (L.) Lapeyr.<br />
0<br />
Avenula versicolor (Vill.) Laínz<br />
0<br />
Myosotis alpestris F.W. Schmidt<br />
0<br />
Pachypleurum mutellinoides (Crantz) Vill.<br />
0<br />
Polygonum viviparum L.<br />
0<br />
Pulsatilla vernalis (L.) Miller<br />
0<br />
Sempervivum montanum L.<br />
0<br />
Alchemilla flabellata Buser<br />
0<br />
Antennaria carpatica (Wahlenb.) Bluff & Fingerh.<br />
0<br />
Bartsia alpina L.<br />
0<br />
Campanula scheuchzeri Vill.<br />
0<br />
Carex rupestris All.<br />
0<br />
Draba aizoides L.<br />
0<br />
Festuca rubra L.<br />
0<br />
Hieracium glaciale Reyn.<br />
0<br />
Hieracium piliferum Hoppe gr.<br />
0<br />
Leucanthemopsis alpina (L.) Heywood<br />
0<br />
Lotus alpinus (DC.) Schleicher ex Ramond<br />
0<br />
Minuartia sedoides (L.) Hiern<br />
0<br />
Oxytropis campestris (L.) DC.<br />
0<br />
Saxifraga exarata Vill.<br />
0<br />
Sempervivum arachnoideum L.<br />
0<br />
Veronica bellidioides L.<br />
0<br />
Achillea nana L.<br />
0<br />
Agrostis alpina Scop.<br />
0<br />
Antennaria dioica (L.) Gaertner<br />
0<br />
Anthyllis vulneraria L. subsp. alpestris (Kit.) Ascherson & Graebner 0<br />
Aster alpinus L.<br />
0<br />
Cerastium arvense L. subsp. strictum (Koch) Gremli<br />
0<br />
Homogyne alpina (L.) Cass.<br />
0<br />
Lloydia serotina (L.) Reichenb.<br />
0<br />
Luzula lutea (All.) DC.<br />
0<br />
Oxytropis helvetica Scheele<br />
0<br />
Salix reticulata L.<br />
0<br />
Saxifraga bryoides L.<br />
0<br />
Saxifraga paniculata Miller<br />
0<br />
Trifolium pratense L. subsp. nivale (Koch) Cesati [1844]<br />
0<br />
Leontodon pyrenaicus Gouan subsp. helveticus (Mérat) Finch & P.D. Sell 0<br />
Gentiana verna L.<br />
0<br />
Poa alpina L.<br />
0<br />
Species richness<br />
9<br />
2<br />
3<br />
3<br />
0<br />
3<br />
1<br />
0<br />
0<br />
3<br />
1<br />
2<br />
2<br />
1<br />
1<br />
0<br />
1<br />
1<br />
1<br />
1<br />
0<br />
0<br />
0<br />
0<br />
0<br />
0<br />
0<br />
0<br />
0<br />
0<br />
0<br />
0<br />
0<br />
0<br />
0<br />
0<br />
0<br />
0<br />
0<br />
0<br />
0<br />
0<br />
0<br />
0<br />
0<br />
0<br />
0<br />
0<br />
0<br />
0<br />
0<br />
0<br />
0<br />
0<br />
0<br />
0<br />
0<br />
0<br />
0<br />
0<br />
0<br />
0<br />
0<br />
1<br />
1<br />
11<br />
5<br />
2<br />
2<br />
2<br />
1<br />
2<br />
2<br />
1<br />
0<br />
1<br />
0<br />
0<br />
0<br />
0<br />
1<br />
0<br />
0<br />
0<br />
0<br />
0<br />
0<br />
0<br />
0<br />
0<br />
0<br />
0<br />
0<br />
0<br />
0<br />
0<br />
0<br />
0<br />
0<br />
0<br />
0<br />
0<br />
0<br />
0<br />
0<br />
0<br />
0<br />
0<br />
0<br />
0<br />
0<br />
0<br />
0<br />
0<br />
0<br />
0<br />
0<br />
0<br />
0<br />
0<br />
0<br />
0<br />
0<br />
0<br />
0<br />
0<br />
0<br />
0<br />
1<br />
0<br />
17<br />
0<br />
0<br />
0<br />
0<br />
0<br />
0<br />
0<br />
0<br />
0<br />
0<br />
0<br />
0<br />
0<br />
0<br />
0<br />
0<br />
0<br />
0<br />
0<br />
4<br />
2<br />
2<br />
1<br />
1<br />
1<br />
1<br />
1<br />
1<br />
1<br />
1<br />
1<br />
0<br />
1<br />
1<br />
1<br />
2<br />
1<br />
0<br />
1<br />
1<br />
1<br />
2<br />
0<br />
0<br />
1<br />
1<br />
0<br />
1<br />
0<br />
0<br />
0<br />
0<br />
0<br />
0<br />
0<br />
1<br />
0<br />
0<br />
0<br />
0<br />
0<br />
0<br />
1<br />
1<br />
27<br />
0<br />
0<br />
0<br />
0<br />
0<br />
0<br />
0<br />
0<br />
0<br />
0<br />
0<br />
0<br />
0<br />
0<br />
0<br />
0<br />
0<br />
0<br />
0<br />
3<br />
3<br />
0<br />
1<br />
2<br />
1<br />
1<br />
1<br />
1<br />
1<br />
1<br />
1<br />
2<br />
0<br />
0<br />
0<br />
0<br />
1<br />
1<br />
0<br />
1<br />
1<br />
0<br />
1<br />
1<br />
0<br />
1<br />
1<br />
0<br />
1<br />
1<br />
1<br />
0<br />
1<br />
1<br />
0<br />
0<br />
0<br />
0<br />
1<br />
0<br />
1<br />
0<br />
0<br />
1<br />
28<br />
0<br />
0<br />
0<br />
0<br />
0<br />
0<br />
0<br />
0<br />
0<br />
0<br />
0<br />
0<br />
0<br />
0<br />
0<br />
0<br />
0<br />
0<br />
0<br />
4<br />
3<br />
2<br />
2<br />
1<br />
1<br />
1<br />
1<br />
1<br />
1<br />
1<br />
1<br />
0<br />
1<br />
1<br />
1<br />
0<br />
0<br />
1<br />
1<br />
0<br />
0<br />
0<br />
1<br />
1<br />
1<br />
0<br />
1<br />
0<br />
0<br />
0<br />
0<br />
1<br />
0<br />
0<br />
1<br />
0<br />
1<br />
1<br />
0<br />
1<br />
0<br />
0<br />
1<br />
1<br />
28<br />
249
Annexes<br />
250
Annexes<br />
Annexe 2<br />
<strong>Alpine</strong> dandelions originated in the native and introduced range<br />
differ in their responses to environmental constraints<br />
Quiroz, C., P. Choler, F. Baptist, M. Gonzalez-Teuber, M. A.<br />
Molina-Montenegro, et al.<br />
(2008) Ecological Research DOI 10.1007/s11284-008-0498-9.<br />
Projet ECOS-Sud avec le Chili ‘Facilitation<br />
et invasion biologique en zone alpine’.<br />
Photo prise au col Agnel (2644 m) le<br />
16/07/05. Au premier plan, coussin de Silene<br />
acaulis.<br />
251
Annexes<br />
252
Ecol Res<br />
DOI 10.1007/s11284-008-0498-9<br />
ORIGINAL ARTICLE<br />
Constanza L. Quiroz Æ Philippe Choler<br />
Florence Baptist Æ Marcia Gonza´lez-Teuber<br />
Marco A. Molina-Montenegro Æ Lohengrin A. Cavieres<br />
<strong>Alpine</strong> dandelions originated in the native and introduced range<br />
differ in their responses to environmental constraints<br />
Received: 9 July 2007 / Accepted: 12 March 2008<br />
Ó The Ecological Society of Japan 2008<br />
Abstract Few studies have compared the response of<br />
native and invasive populations under stressful conditions.<br />
Furthermore, there is little consensus as to whether<br />
a plastic response is related to invasiveness in<br />
stressful environments. Exotic species have recently been<br />
reported in the high Andes of central Chile, where<br />
individuals have to cope with drought and poor soils, in<br />
addition to extreme temperatures. We explored if the<br />
exotic species Taraxacum officinale (dandelion) has<br />
plastic responses to soil moisture and nutrient availability,<br />
and whether two sets of alpine populations derived<br />
from native and introduced populations can<br />
converge to similar plastic responses to environmental<br />
constraints. Using a common garden approach, we<br />
compared plants grown from seeds collected in alpine<br />
populations of its native range (Alps, France) and in<br />
alpine populations of its introduced range (Andes,<br />
Chile) under a drought experiment, a potassium gradient,<br />
and a nitrogen gradient. Plasticity was only found as<br />
a response to drought. Moreover, different responses<br />
were found between both origins. Andean individuals<br />
are drought-resistant, while individuals from the Alps<br />
were drought-sensitive. According to the nutrient<br />
experiments, Andean dandelions behave as a nitrogen<br />
demanding-potassium avoiding species, whereas indi-<br />
C. L. Quiroz (&) Æ M. A. Molina-Montenegro Æ L. A. Cavieres<br />
ECOBIOSIS, Departamento de Bota´nica,<br />
Universidad de Concepcio´n, Casilla 160-C,<br />
Concepcio´n, Chile<br />
E-mail: cquiroz@udec.cl<br />
Tel.: +56-41-2203846<br />
Fax: +56-41-220600<br />
C. L. Quiroz Æ M. A. Molina-Montenegro Æ L. A. Cavieres<br />
Instituto de Ecología y Biodiversidad (IEB), Santiago, Chile<br />
P. Choler Æ F. Baptist<br />
Laboratoire d’Ecologie <strong>Alpine</strong> (LECA),<br />
Universite´ <strong>Joseph</strong> <strong>Fourier</strong>, Grenoble, France<br />
M. González-Teuber<br />
Department of General Botany,<br />
University Duisburg-Essen, Duisburg, Germany<br />
viduals from the Alps did not show any particular<br />
dependency or repulsion tendency to either of these two<br />
nutrients. Results suggest that differences in life history<br />
traits of both derived sets of populations may have an<br />
important role in determining the response of dandelions<br />
under the evaluated conditions. However, the relative<br />
importance of genetic adaptation in these responses<br />
is still unclear. Although T. officinale is a cosmopolite<br />
weed, this is the first study that compares individuals<br />
coming from its native and invaded range under stressful<br />
conditions.<br />
Keywords Biological invasions Æ Common garden Æ<br />
Exotic species Æ Asteraceae Æ Environmental stress<br />
Introduction<br />
The physical environment plays a pivotal role as a filter<br />
for successful plant invasions (Chaneton et al. 2002;<br />
Dybdahl and Kane 2005; Lake and Leishman 2004;<br />
Suding et al. 2004). It has been suggested that stressful<br />
abiotic conditions constrain plant invasions (e.g., Richardson<br />
et al. 2000; Williamson and Fitter 1996). Hence,<br />
the overcome of the barrier imposed by the physical<br />
environment is a key step for the invasion success in an<br />
extreme environment. Although scarce, there are examples<br />
of successful invasions in stressful habitats (e.g.,<br />
alpine habitats: Dullinger et al. 2003; semiarid habitats:<br />
Eggemeyer et al. 2006; salt-marshes: Dethier and Hacker<br />
2005). In these cases, the possession of attributes that<br />
enable exotic species to overcome the stressful abiotic<br />
conditions of the invaded habitat should be important<br />
for explaining the invasion success.<br />
Plasticity has been defined as the ability of an<br />
organism to adjust its performance by altering its morphology<br />
and/or physiology in response to varying environmental<br />
conditions (Sultan 1995). It has been<br />
suggested that plasticity could play an important role in<br />
explaining successful biological invasions (Sexton et al.<br />
2002; Richards et al. 2006). According to Richards et al.
(2006), pre-existing plasticity in ecologically important<br />
traits would promote invasiveness after arrival to a new<br />
habitat because it allows the exotic species to cope with<br />
the environmental heterogeneity of the invaded habitat.<br />
Alternatively, plasticity of these ecologically important<br />
traits may evolve rapidly in introduced habitats and<br />
thereby contribute to invasion success after a lag time<br />
(e.g., Williams et al. 1995; Sakai et al. 2001; Lee 2002).<br />
Once naturalized, introduced populations will experience<br />
new local selection pressures. Then, recombination<br />
of genetic variation among introduced individuals can<br />
provide a range of heritable phenotypes to respond to<br />
local selection pressures and produce offspring with<br />
higher fitness (Ellstrand and Schierenbeck 2000). However,<br />
few studies have compared the behavior of exotic<br />
and native populations of invasive species under stressful<br />
conditions, and whether differences in plasticity<br />
could be responsible for the success of the species in the<br />
invaded range (Kaufman and Smouse 2001; DeWalt<br />
et al. 2004; see review of Bossdorf et al. 2005). The scarce<br />
available evidence for differences in plasticity between<br />
native and introduced individuals under stressful conditions<br />
is still contradictory.<br />
<strong>Alpine</strong> habitats are well known for their severe<br />
environmental conditions (Chambers 1995; Nilsson<br />
et al. 2002; Ko¨ rner 2003). In temperate zones, alpine<br />
habitats have strong winds, short growing seasons, high<br />
solar radiation, low temperatures and low nutrient<br />
availability, especially nitrogen (Billings 1974; Ko¨ rner<br />
2003). In addition, alpine species could undergo drought<br />
stress, which is an important mortality factor for seedlings<br />
(Ehleringer and Miller 1975; Bliss 1985). Despite<br />
these extreme conditions, some studies have begun to<br />
report exotic species establishing in alpine environments<br />
(Are´valo et al. 2005; Becker et al. 2005; Cavieres et al.<br />
2005; Daehler 2005; Mc Dougall et al. 2005; Parks et al.<br />
2005; Andersen and Baker 2006). Invasive species of<br />
alpine habitats are expected to have high germination<br />
and high growth rates to cope with the short growing<br />
season, as well as the ability to tolerate drought and very<br />
low soil nutrient levels.<br />
<strong>Alpine</strong> populations are derived from larger source<br />
populations occurring at lower altitudes. Therefore,<br />
attributes of alpine individuals (such as plasticity) depend<br />
on the attributes that are already present in individuals<br />
from lower altitudes. Considering that<br />
introduced species usually undergo major genetic bottlenecks<br />
following their introduction (Sakai et al. 2001),<br />
it is expected that such genetic changes will be reflected<br />
in derived alpine individuals. Hence, it is expected that<br />
Table 1 Matric potential (Wm),<br />
nitrogen (N), phosphorous (P)<br />
and potassium (K) found in<br />
Andean soils, matric potential<br />
obtained in the drought<br />
treatment and nutrient amounts<br />
used in gradients of N and K<br />
used in greenhouse experiments<br />
Andean<br />
soils<br />
alpine individuals from the introduced range show different<br />
responses in front of diverse abiotic conditions<br />
than alpine individuals from the native range.<br />
Taraxacum officinale Weber (dandelion) is an invasive<br />
weed that was introduced to Chile from Europe ca.<br />
150 years ago (Matthei 1995). In its native range, T.<br />
officinale is present in alpine environments, although it is<br />
mostly restricted to disturbed sites (data not shown) that<br />
are expected to be more fertile than adjacent undisturbed<br />
alpine soils (Vitousek et al. 1979; Chambers et al.<br />
1990). However, in central Chile, this exotic species has<br />
been found growing abundantly in alpine zones, either in<br />
disturbed sites or in undisturbed natural communities<br />
(Cavieres et al. 2005).<br />
Due to the influence of the Mediterranean-type<br />
climate, drought conditions in the Andes of central<br />
Chile are more accentuated than in the majority of the<br />
mountains in the Alps (Cavieres et al. 2006). In<br />
addition, due to its intrusive volcanic origin, soils in<br />
the high-alpine zone of central Chile have very high<br />
amounts of phosphorous and potassium (Table 1).<br />
Therefore, it can be expected that Taraxacum officinale<br />
individuals invading the Andes should be able to cope<br />
with low amounts of nitrogen (as occur in most of the<br />
alpine environments), and high amounts of potassium<br />
and phosphorous, as well as drought.<br />
The aim of this study was to explore if Taraxacum<br />
officinale has plastic responses to soil moisture and soil<br />
nutrient availability (Nitrogen and Potassium), and<br />
whether two sets of derived alpine populations from native<br />
and introduced populations show similar responses to<br />
environmental constraints. Using a common garden approach,<br />
we compared the performance of plants grown<br />
from seeds collected in an alpine environment from its<br />
native range, the Alps (France), and an alpine environment<br />
from its introduced range, the Andes (Chile).<br />
Methods<br />
Target species<br />
Taraxacum officinale (Asteraceae) (dandelion) is native<br />
to Europe, but is now found in most countries of the<br />
world (Holm et al. 1997), where it is considered as a<br />
noxious weed in several countries (Holm et al. 1997). It<br />
is a stemless, deeply rooted perennial herb having a thick<br />
taproot and leaves in rosettes at the soil level. Each plant<br />
has one or more 2–5 cm diameter capitula or flower<br />
heads terminally positioned on 5–45 cm long, hollow,<br />
Drought<br />
treatment<br />
Nitrogen<br />
gradient<br />
Potassium<br />
gradient<br />
Wm (KPa) 31 + 1.98 30 + 1.01<br />
N-NO3 (mg/kg) 12.90 ± 1.63 4 – 17– 30 13<br />
P (mg/kg) 13.63 ± 1.29 14 14<br />
K (mg/kg) 321.37 ± 32.59 320 130 – 415 – 700
cylindrical peduncles. Each capitulum has a composite<br />
of 50–250 small bright yellow ligulate or ray florets<br />
(Holm et al. 1997). Propagules are mainly dispersed by<br />
wind. T. officinale is generally apomictic, although sexually<br />
reproducing biotypes have been described. Asexual<br />
T. officinale plants are mostly triploids (Richards 1973).<br />
Genetic variation existing among asexually reproducing<br />
dandelions is likely to have come exclusively from either<br />
mutations or multiple origins of the clones detected<br />
(Ellstrand and Roose 1987). However, some traces of<br />
sexual recombination have been found in some triploid<br />
asexual populations, contributing to the genetic variation<br />
of those populations (Van der Hulst et al. 2000).<br />
Although this species is widespread in Europe, the<br />
first collection of this species in Chile corresponds to<br />
1870, in the city of Santiago. From that date, multiple<br />
introductions have probably toke place (Matthei 1995).<br />
Since our study area is about 50 km away from this city,<br />
it seems unlikely that this species has been present for<br />
more than 100 years in our sampling area or the Andes.<br />
Seed collection<br />
Bulk seed collections of >50 Taraxacum officinale<br />
individuals were made in the Queyras Mountains at<br />
>2,000 m elevation, in the South Western French Alps<br />
(native range), and in the Molina River valley at<br />
>2,500 m elevation in the central Chilean Andes<br />
(introduced range). We sampled more than two highaltitude<br />
populations in both localities. Seeds from the<br />
Alps were collected from individuals found in anthropically<br />
disturbed areas (Alps), whereas seeds from the<br />
Andes corresponded to individuals located in undisturbed<br />
habitats or anthropically disturbed areas.<br />
Although we cannot demonstrate that individuals<br />
generated in disturbed and undisturbed sites are similar,<br />
Rogstad et al. (2001) showed in clonal populations of T.<br />
officinale present in North America that seed dispersal is<br />
able to maintain the same ‘‘clonal families’’ at short distances<br />
and at distances as high as hundreds of km. Based<br />
on this evidence, we assume that similar clonal lineages are<br />
present in disturbed and undisturbed sites in the sampling<br />
area located in the Andes. Since Rogstad et al. (2001) also<br />
showed that genetic diversity is similar both at small scales<br />
(few meters) and at large scales (hundreds of km), we are<br />
confident that possible differences in the area from which<br />
seeds were collected will not influence the genetic diversity<br />
that was included in all treatments.<br />
Taraxacum officinale individuals found in the study area<br />
of the Andes have been found to be triploid (L. San Martin,<br />
unpublished data). Hence, we can expect that they reproduce<br />
asexually. On the other hand, it has been described<br />
that T. officinale individuals occurring in the study area of<br />
the Alps can be sexual or asexual (Verduijn et al. 2004).<br />
Unfortunately, there is no information about the ploidy<br />
levels of the high-altitude populations sampled for this<br />
study. Nevertheless, in areas where the ranges of sexual<br />
and asexual individuals overlap, the range of asexually<br />
reproducing individuals usually extends to higher altitudes<br />
where abiotic conditions are more severe (Bierzychudek<br />
1985). Thus, it seems likely that for both origins we are in<br />
presence of asexually originated individuals.<br />
Seedling preparation<br />
Seeds were carried to the laboratory in Chile where<br />
random samples of seeds were germinated in Petri dishes<br />
at 20°C and a photoperiod of 12 h light. Emerged<br />
seedlings from the two origins of T. officinale were<br />
planted into one-liter plastic pots and randomly assigned<br />
to the different experiments explained below. These<br />
experiments were carried out in the greenhouse located<br />
in Universidad de Concepcio´n, Concepcio´n, Chile (36°S,<br />
73°W), where the mean maximum and minimum temperatures<br />
during the experiments were 24 and 12°C,<br />
respectively.<br />
Drought tolerance<br />
To compare the response of Taraxacum officinale from<br />
both origins to drought, individuals from both origins<br />
were exposed to two soil moisture levels, drought and<br />
control. The drought treatment mimicked the soil matric<br />
potential that is found in the Andes of central Chile<br />
during the driest period of the growing season (Table 1).<br />
Forty-one-month-old seedlings of each origin were<br />
planted in one-liter pots filled with a mixture of commercial<br />
soil and sand (50:50). Twenty seedlings were<br />
assigned to one of the two following irrigation treatments:<br />
(a) addition of 100 ml of water every 2 days<br />
(hereafter control) and (b) addition of 100 ml of water<br />
every 5 days (hereafter drought). This design resulted in<br />
20 replicates · 2 moisture levels · 2 origins = 80 pots<br />
in total. Pots were placed in the greenhouse, where their<br />
final position was randomly assigned. The experiment<br />
was maintained during 2 months, and at the end of this<br />
period we recorded survival and flower production.<br />
After 2 months, surviving individuals were collected and<br />
their final biomass was measured. The root:shoot ratio<br />
of surviving plants was also calculated.<br />
Nutrient gradient<br />
To compare the response of Taraxacum officinale from<br />
both origins to varying levels of soil nutrients, we used<br />
levels of N, P and K that are commonly found in alpine<br />
soils of the Andes of central Chile (Table 1). Individuals<br />
from both origins were grown at three levels of potassium<br />
and three levels of nitrogen, whereas P level was<br />
maintained constant in both gradients. Ninety-six<br />
1-month-old seedlings of each origin were planted in<br />
one-liter pots filled with commercial vermiculite. We<br />
randomly selected groups of 16 seedlings that were<br />
assigned to each of the following treatments. The three
levels of potassium treatment consisted of a weekly<br />
addition of (a) 170 ml of a mineral solution with a low<br />
level of potassium (0.004602 mol K 2SO 4/l, hereafter K1,<br />
dissolved in 0.00095 mol Ca(NO 3) 2/l, 0.002 mol MgSO 4/<br />
l, 0.0006 mol NaNO 3/l, 0.00128 mol NaH 2PO 4/l and Fe-<br />
EDTA chelated trace metals), (b) 170 ml of a mineral<br />
solution with an intermediate level of potassium<br />
(0.01472 mol K 2SO 4/l, hereafter K2, dissolved in the<br />
same solution mentioned above), or (c) 170 ml of a<br />
mineral solution with a high level of potassium<br />
(0.02502 mol K 2SO 4/l, hereafter K3, dissolved in the<br />
same solution mentioned above). The three levels of<br />
nitrogen treatment consisted of a weekly addition of (a)<br />
170 ml of a mineral solution with a low level of nitrogen<br />
(0.0004 mol urea, hereafter N1, dissolved in 0.002 mol<br />
MgSO 4/l, 0.00128 mol NaH 2PO 4/l, 0.005 mol CaCl 2/l,<br />
0.023 mol KCl/l, Fe-EDTA chelated trace metals, and),<br />
(b) 170 ml of a mineral solution with an intermediate<br />
level of nitrogen (0.0017 mol urea, hereafter N2, dissolved<br />
in the same solution mentioned above), or (c)<br />
170 ml of a mineral solution with a high level of nitrogen<br />
(0.003 mol urea, hereafter N3, dissolved in the same<br />
solution mentioned above). Pots were watered two times<br />
per week with 170 ml of distilled water, and once a week<br />
with the nutrient solutions.<br />
This design resulted in 16 replicates · 3 nutrient levels<br />
· 2 nutrient gradient · 2 origins = 192 pots in total.<br />
Pots were placed in the greenhouse, where their positions<br />
were randomized. Treatments were applied during 2<br />
months, and at the end of this period we recorded survival,<br />
final biomass and root:shoot ratio of surviving plants.<br />
Statistical analyses<br />
In both experiments, survival was analyzed with a twotailed<br />
proportions test. In the drought experiment, morphological<br />
and reproduction data did not fit the<br />
assumptions for parametric statistics. Thus, final<br />
biomass, root:shoot ratio and the number of capitula<br />
produced per plant were analyzed with Mann-Whitney<br />
non-parametric paired tests. Comparisons were made<br />
among every origin and treatment. Since non-parametric<br />
tests do not allow to explore interactions between two<br />
predictor variables, we used the following procedure for<br />
comparing the change in some attributes (final biomass,<br />
root:shoot ratio, number of capitula) between the two<br />
origins along each gradient. First, for each attribute we<br />
calculated for each individual the quotient between the<br />
value obtained in the drought treatment and the mean<br />
value obtained in the control. After that, individuals of<br />
different origin (Andes vs. Alps) were compared with oneway<br />
ANOVAs (final biomass and root:shoot ratio), or a<br />
Mann-Whitney U test (number of capitula) when<br />
assumptions of normality were not met. Root:shoot values<br />
were log transformed to fit assumption of homogeneity<br />
of variance. In the nutrient gradient experiments,<br />
final biomass and root:shoot ratio were analyzed with<br />
two-way ANOVAs. Post-hoc comparisons were made by<br />
Tukey HSD for unequal sampling sizes, including both<br />
origins and the three levels of the gradient. All statistical<br />
analyses were performed with Statistica 6.0.<br />
Results<br />
Drought tolerance<br />
Individuals from the two origins differed in their responses<br />
to drought. Survival of individuals from the<br />
Andes was similar in both irrigation treatments (Fig. 1a,<br />
Table 2). In contrast, individuals from the Alps showed<br />
lower survival under drought compared to the control<br />
individuals (Fig. 1a, Table 2). Individuals from the Alps<br />
showed lower final biomass with drought (U = 9.5;<br />
P < 0.01), whereas Andean individuals did not differ in<br />
final biomass between the two irrigation treatments<br />
(U = 33.5; P = 0.21) (Fig. 1b, Table 3). Although<br />
individuals from both origins increased their root:shoot<br />
ratio in drought (U = 16; P < 0.05 and U =4;<br />
P < 0.001 for the Andes and the Alps, respectively),<br />
this increment was higher in individuals from the Alps<br />
(F 1,18 = 19.40; P < 0.01) (Fig. 1c, Table 3). With<br />
drought, both origins produced lower number of capitula<br />
compared to control (Fig. 1d), and the decrease in<br />
the number of capitula produced per plant did not differ<br />
between origins (U = 40.0; P = 0.450). Notice that<br />
plants from the Alps produced no capitula in the harshest<br />
conditions.<br />
Nutrient gradient<br />
Potassium gradient<br />
<strong>Alpine</strong> individuals showed higher survival along the two<br />
higher gradient potassium levels, compared to Andean<br />
individuals (Fig. 2a, Table 2). Individuals from the Alps<br />
showed the same survival along the three potassium<br />
levels, whereas individuals from the Andes decreased<br />
survival at the highest level of potassium (Fig. 2a,<br />
Table 2). Individuals from the Andes reached lower<br />
biomass than individuals from the Alps across the<br />
potassium gradient (F 1,64 = 5.70; P < 0.05) (Table 4),<br />
with no changes among the different potassium levels<br />
(F 2,64 = 0.71; P = 0.49) (Fig. 2b, Table 4). The root:shoot<br />
ratio of both genotypes did not change along this<br />
gradient (Fig. 2c, Table 4).<br />
Nitrogen gradient<br />
Although total survival was higher in <strong>Alpine</strong> individuals<br />
along the entire gradient compared to Andean individuals,<br />
this difference was only significant at the intermediate<br />
level (Fig. 3a, Table 2). The highest survival was found in<br />
the intermediate level of nitrogen for individuals from the<br />
Alps, while for individuals from the Andes it was found at
Survival (%)<br />
Dry biomass (g)<br />
Root:shoot<br />
Number of capitula<br />
100<br />
80<br />
60<br />
40<br />
20<br />
0<br />
12<br />
10<br />
8<br />
6<br />
4<br />
2<br />
0<br />
1,2<br />
0,9<br />
0,6<br />
0,3<br />
0,0<br />
2,5<br />
2,0<br />
1,5<br />
1,0<br />
0,5<br />
0,0<br />
A<br />
B<br />
C<br />
D<br />
a<br />
a<br />
a<br />
ab<br />
a a<br />
b<br />
a<br />
c<br />
CONTROL DROUGHT<br />
c<br />
b<br />
a<br />
b<br />
Andes<br />
Alps<br />
Fig. 1 Survival (%), total dry biomass, root:shoot and number of<br />
capitula produced by Taraxacum officinale individuals grown from<br />
seeds collected in the introduced range (Andes) and in the native<br />
range (Alpes), under watered (CONTROL) and drought conditions.<br />
Error bars indicate S.E. Different superscript letters indicate<br />
significant differences (Mann-Whitney U test)<br />
a<br />
b<br />
the two higher levels (Fig. 3a, Table 2). Individuals from<br />
the Andes reached lower biomass than individuals from<br />
the Alps (F 1,40 = 9.88; P < 0.01) across the entire<br />
nitrogen gradient (F 2,40 = 0.56; P = 0.58) (Fig. 3b,<br />
Table 5). Regarding the root:shoot ratio, Andean individuals<br />
allocated more resources to the roots than <strong>Alpine</strong><br />
individuals (F 1,40 = 11.69; P < 0.01) across the entire<br />
gradient (F 2,40 = 0.31; P = 0.73) (Fig. 3b, Table 5).<br />
Discussion<br />
The individuals of T. officinale used in this study come<br />
from two high-altitude origins, the Andes and the Alps.<br />
Although the <strong>Alpine</strong> dandelions belong to the native<br />
range and the Andean dandelions, to the introduced<br />
range, both can be considered as derived populations of<br />
lower-altitude populations, that had acted as a source of<br />
propagules dispersed by wind, cattle, and humans to<br />
higher elevations. Therefore, individuals originating in<br />
these habitats will not only reflect the genetic pool of the<br />
lower-altitude populations of origin, but also the results<br />
of new selective pressures that are present in high-altitude<br />
environments.<br />
Although there was no indication of plasticity in the<br />
two gradients of soil nutrients examined, individuals<br />
from both origins differed in their plasticity under<br />
drought. With drought, individuals from both origins<br />
showed plasticity in the root:shoot ratio, increasing<br />
allocation to below ground biomass. However, this<br />
change in biomass allocation was bigger in individuals<br />
coming from the Alps. This change in biomass allocation<br />
is a common strategy to drought that allows plants<br />
to increase their water absorption surface (Larcher<br />
2003). Nevertheless, despite the higher allocation to<br />
belowground biomass in individuals from the Alps, this<br />
was not translated into a higher fitness compared to<br />
individuals from the Andes. While individuals from the<br />
Alps showed lower survival and reached lower biomass<br />
with drought, individuals from the Andes maintained<br />
the same survival compared to the control. Indeed, they<br />
produced flowers under drought. Therefore, Andean<br />
individuals can be considered as drought-resistant, while<br />
<strong>Alpine</strong> individuals were drought-sensitive.<br />
In the context of an exotic species growing in a<br />
stressful environment, plasticity in a certain trait is unlikely<br />
to have any effect on invasiveness unless that<br />
plasticity contributes to fitness in that particular habitat<br />
(Richards et al. 2006). Our results suggest that the Andean<br />
population (introduced origin) does not show great<br />
plasticity under drought. Nevertheless, this lack of<br />
plasticity is not related to negative consequences in<br />
individual fitness, in terms of survival and reproduction.<br />
In the dry growing season occurring in central Chile, the<br />
ability to tolerate drought can make the difference<br />
between a successful establishment or not (Cavieres et al.<br />
2006). Therefore, differences observed in drought resistance<br />
between the two origins of T. officinale might be
Table 2 P-values of the<br />
comparison of the final survival<br />
of Taraxacum officinale<br />
individuals grown in a drought<br />
experiment, in a gradient of<br />
nitrogen (N), and in a gradient<br />
of potassium (K)<br />
Survival was compared among<br />
groups with a two-tailed proportion<br />
test<br />
And = Andean individuals;<br />
Alp = <strong>Alpine</strong> individuals<br />
influenced by differences in specific abiotic conditions<br />
between both environments. The ability to cope with<br />
drought found in the Andean dandelions may be part of<br />
the reason for their success in this part of the Andes.<br />
Nevertheless, this ability was accompanied by a high<br />
nutrient sensitivity in terms of survival. Survival of the<br />
Andes individuals was negatively affected towards<br />
increasing levels of potassium and lower levels of<br />
nitrogen, whereas survival in dandelions originated in<br />
the Alps was not negatively affected by the nutrients<br />
availability. Hence, Andean individuals behave as a<br />
nitrogen demanding-potassium avoiding species,<br />
whereas <strong>Alpine</strong> individuals did not show any particular<br />
dependency or repulsion tendency to either of these two<br />
nutrients. In the central Chilean Andes, T. officinale is<br />
very abundant in anthropically-disturbed sites (Cavieres<br />
et al. 2005), which are characterized by higher levels of<br />
nitrogen but lower levels of potassium compared to<br />
undisturbed soils (Quiroz CL, unpublished data). This<br />
last might explain the responses observed for the Andes<br />
origin under nutrient availability. Despite the fact that<br />
potassium is an essential nutrient for plant growth (Taiz<br />
and Zeiger 1998), high concentrations of this cation in<br />
the soil have been reported to have negative effects in<br />
plants (Russel and Russel 1959). According to this, we<br />
presume that T. officinale from the Andes is more<br />
damaged by higher levels of potassium than their<br />
counterparts from the Alps.<br />
Although T. officinale is distributed worldwide<br />
among a great diversity of environments, this is the first<br />
study that compares plastic responses of individuals<br />
occurring in the native and invaded ranges under<br />
stressful conditions. Actually, the ability of this species<br />
to tolerate stressful conditions has only been examined<br />
in presence of native co-occurring species in the introduced<br />
range and in the native range separately (Brock<br />
And-Control And-Drought Alp-Control Alp-Drought<br />
And-Control – 0.155 0.155
Survival (%)<br />
Dry biomass (g)<br />
Root:shoot<br />
100<br />
80<br />
60<br />
40<br />
20<br />
0<br />
0,25<br />
0,20<br />
0,15<br />
0,10<br />
0,05<br />
0,00<br />
2,5<br />
2,0<br />
1,5<br />
1,0<br />
0,5<br />
0,0<br />
A<br />
B<br />
C<br />
b<br />
a<br />
a<br />
a<br />
ab<br />
bc<br />
a<br />
b<br />
a<br />
K1 K2 K3<br />
a<br />
c<br />
ab<br />
ab<br />
ab<br />
a<br />
a<br />
Andes<br />
Alps<br />
Fig. 2 Survival (%), total dry biomass and root:shoot of Taraxacum<br />
officinale individuals grown from seeds collected in the<br />
introduced range (Andes) (solid bars) and in the native range<br />
(Alpes) (empty bars), under and increasing gradient of potassium.<br />
Error bars indicate S.E. Different superscript letters indicate<br />
significant differences (Tukey HSD for unequal sample sizes)<br />
Table 4 Two-way analysis of variance of final biomass and rootshoot<br />
ratio for Taraxacum officinale individuals grown in the<br />
potassium gradient experiment<br />
Final<br />
biomass (gr)<br />
Root:<br />
Shoot<br />
Origin (O) F 2.64 5.70* 2.56 ns<br />
Treatment (T) F 1.64 0.73 ns 0.39 ns<br />
O · T F 2.64 0.71 ns 0.43 ns<br />
F-values are shown<br />
ns P > 0.05, *P < 0.05<br />
Survival (%)<br />
Dry biomass (g)<br />
Root:shoot<br />
100<br />
80<br />
60<br />
40<br />
20<br />
0<br />
0,4<br />
0,3<br />
0,2<br />
0,1<br />
0,0<br />
3,0<br />
2,5<br />
2,0<br />
1,5<br />
1,0<br />
0,5<br />
A<br />
B<br />
C<br />
ab<br />
a<br />
a<br />
b<br />
ab<br />
b<br />
N1 N2 N3<br />
Andes<br />
Alps<br />
Fig. 3 Survival (%), total dry biomass and root:shoot of Taraxacum<br />
officinale individuals grown from seeds collected in the<br />
introduced range (Andes) (solid bars) and in the native range<br />
(Alpes) (empty bars), under and increasing gradient of nitrogen.<br />
Error bars indicate S.E. Different superscript letters indicate<br />
significant differences (Tukey HSD for unequal sample sizes)<br />
favorable conditions (Richards et al. 2006). Morrison and<br />
Molofsky (1998, 1999), and Lavergne et al. (2007) studied<br />
the performance of invasive Phalaris arundinacea genotypes<br />
under different biotic and abiotic conditions. They<br />
have found consistent evidence of low phenotypic plasticity<br />
among introduced genotypes, and dependence on<br />
multiple introductions to increase its geographical spread<br />
in the introduced region (Morrison and Molofsky 1998,<br />
1999; Lavergne et al. 2007). According to our results,<br />
native individuals of T. officinale originated in the Alps<br />
behaves like a ‘‘Jack-of-all-trades’’ under stressful conditions,<br />
whereas introduced T. officinale originated in the<br />
c<br />
ab<br />
ab<br />
b<br />
a<br />
b<br />
a<br />
b<br />
a<br />
b<br />
bc<br />
bc
Table 5 Two-way analysis of variance of final biomass and rootshoot<br />
ratio for Taraxacum officinale individuals grown in the<br />
nitrogen gradient experiment<br />
Andes resembles a ‘‘Master-of-some conditions’’ under<br />
the same environmental constraints. These conclusions<br />
open a window of opportunities for the control of the<br />
spread of T. officinale in these habitats, by creating the<br />
conditions that these individuals are not able to manage.<br />
Acknowledgments We thank L. Corcuera and A. Pauchard for<br />
providing helpful comments on earlier versions of the manuscript<br />
that improved its clarity and overall quality. This research was<br />
funded by the fellowship AT-24050159 and CONICYT Doctoral<br />
Fellowship to C.L. Quiroz, FONDECYT-1030821 to L.A. Cavieres,<br />
ECOS C03B05 to L.A. Cavieres and P. Choler, and P05-002-F<br />
ICM supporting the Instituto de Ecologı´a y Biodiversidad.<br />
References<br />
Final biomass (gr) Root:Shoot<br />
Origin (O) F 2.40 9.88** 11.69**<br />
Treatment (T) F 1.40 1.49 ns 1.05 ns<br />
O · T F 2.40 0.56 ns 0.31 ns<br />
F-values are shown<br />
ns P > 0.05, **P < 0.01<br />
Andersen MD, Baker WL (2006) Reconstructing landscape-scale<br />
tree invasion using survey notes in the Medicine Bow Mountains,<br />
Wyoming, USA. Landsc Ecol 21:243–258<br />
Are´valo JR, Delgado JD, Otto R, Naranjo A, Salas M, Ferna´ndez-<br />
Palacios JM (2005) Distribution of alien vs. native plant species<br />
in roadside communities along an altitudinal gradient in Tenerife<br />
and Gran Canaria (Canary Islands). Perspect Plant Ecol<br />
Evol Syst 7:185–202<br />
Becker T, Dietz H, Billeter R, Buchsmann H, Edwards PI (2005)<br />
Altitudinal distribution of alien species in the Swiss Alps. Perspect<br />
Plant Ecol Evol Syst 7:173–183<br />
Bierzychudek P (1985) Patterns in plant parthenogenesis. Experientia<br />
41:1255–1264<br />
Billings WD (1974) Adaptations and origins of alpine plants. Arct<br />
Alp Res 6:129–142<br />
Bliss LC (1985) <strong>Alpine</strong>. In: Billings WD, Mooney HA (eds) Physiological<br />
ecology of North American plant terrestrial communities.<br />
Chapman & Hall, New York, pp 41–65<br />
Bossdorf O, Auge H, Lafuma L, Rogers WE, Siemann E, Prati D<br />
(2005) Phenotypic and genetic differentiation between native<br />
and introduced plant populations. Oecologia 144:1–11<br />
Brock MT, Weining C, Galen C (2005) A comparison of phenotypic<br />
plasticity in the native dandelion Taraxacum ceratophorum<br />
and its invasive congener T. officinale. New Phytol<br />
166:173–183<br />
Cavieres LA, Quiroz CL, Molina-Montenegro MA, Mun˜ oz AA,<br />
Pauchard A (2005) Nurse effect of the native cushion plant<br />
Azorella monantha on the invasive non-native Taraxacum officinale<br />
in the high-Andes of central Chile. Perspect Plant Ecol<br />
Evol Syst 7:217–226<br />
Cavieres LA, Badano EI, Sierra-Almeyda A, Go´mez-González S,<br />
Molina-Montenegro MA (2006) Positive interactions between<br />
alpine plant species and the nurse cushion plant Laretia acaulis<br />
do not increase with elevation in the Andes of central Chile.<br />
New Phytol 169:59–69<br />
Chambers JC (1995) Disturbance, life history strategies, and seed<br />
fates in alpine herbfield communities. Am J Bot 82:421–433<br />
Chambers JC, MacMahon JA, Brown RW (1990) <strong>Alpine</strong> seedling<br />
establishment: the influence of disturbance type. Ecology<br />
71:1323–1341<br />
Chaneton EJ, Perelman SB, Omanici M, Leo´n RJC (2002) Grazing,<br />
environmental heterogeneity, and alien plant invasions in<br />
temperate Pampa grasslands. Biol Invasions 4:7–24<br />
Daehler CC (2005) Upper-montane plant invasions in the Hawaiian<br />
Islands: patterns and opportunities. Perspect Plant Ecol<br />
Evol Syst 7:203–216<br />
Dethier MN, Hacker SD (2005) Physical vs. biotic resistance in<br />
controlling the invasion of an estuarine marsh grass. Ecol Appl<br />
15:1273–1283<br />
DeWalt SJ, Denslow JS, Hamrick JL (2004) Biomass allocation,<br />
growth, and photosynthesis of genotypes from native and<br />
introduced ranges of the tropical shrub Clidemia hirta. Oecologia<br />
138:521–531<br />
Dullinger S, Dirnbo¨ ck T, Grabherr G (2003) Patterns of shrub<br />
invasion into high mountain grasslands of the Northern Calcareous<br />
Alps, Austria. Arct Antarct Alp Res 35:434–441<br />
Dybdahl MF, Kane S (2005) Adaptation vs. phenotypic plasticity<br />
in the success of a clonal invader. Ecology 86:1592–1601<br />
Eggemeyer KD, Awada T, Wedin DA, Harvey FE, Zhou XH<br />
(2006) Ecophysiology of two native invasive woody species and<br />
two dominant warm-season grasses in the semi-arid grasslands<br />
of the Nebraska Sandhills. Int J Plant Sci 167:991–999<br />
Ehleringer JR, Miller PC (1975) Water relations of selected plant<br />
species in the alpine tundra. Colorado. Ecology 56:370–380<br />
Ellstrand NC, Roose ML (1987) Patterns of genotypic diversity in<br />
clonal plant species. Am J Bot 74:123–131<br />
Ellstrand NC, Schierenbeck KA (2000) Hybridization as a stimulus<br />
for the evolution of invasiveness in plants? Proc Natl Acad Sci<br />
USA 97:7043–7050<br />
Holm L, Doll J, Holm E, Pancho J, Herberger J (1997) World<br />
weeds. Natural histories and distribution. Wiley, New York<br />
Kaufman SR, Smouse PE (2001) Comparing indigenous and<br />
introduced populations of Melaleuca quinquenervia (Cav.)<br />
Blake: response of seedlings to water and pH levels. Oecologia<br />
127:487–494<br />
Ko¨ rner CH (2003) <strong>Alpine</strong> plant life, 2nd edn. Springer, Berlin<br />
Heidelberg New York<br />
Lake JC, Leishman MR (2004) Invasion success of exotic plants in<br />
natural ecosystems: the role of disturbance, plant attributes and<br />
freedom from herbivores. Biol Conserv 117:215–226<br />
Larcher W (2003) Physiological plant ecology. Ecophysiology and<br />
stress physiology of functional groups, 4th edn. Springer, Berlin<br />
Heidelberg New York<br />
Lavergne S, Molofsky J (2007) Increased genetic variation and<br />
evolutionary potential drive the success of an invasive grass.<br />
Proc Natl Acad Sci 104:3883–3888<br />
Lee CE (2002) Evolutionary genetics of invasive species. Trends<br />
Ecol Evol 17:386–391<br />
Matthei OJ (1995) Manual de las malezas que crecen en Chile.<br />
Alfabeta, Santiago<br />
Mc Dougall KL, Morgan JW, Walsh NG, Williams RJ (2005)<br />
Plant invasions in treeless vegetation of the Australian Alps.<br />
Perspect Plant Ecol Evol Syst 7:159–171<br />
Morrison SL, Molofsky J (1998) Effects of genotypes, soil moisture,<br />
and competition on the growth of an invasive grass, Phalaris<br />
arundinacea (reed canary grass). Can J Bot 76:1939–1946<br />
Morrison SL, Molofsky J (1999) Environmental and genetic effects<br />
on the early survival and growth of the invasive grass, Phalaris<br />
arundinacea. Can J Bot 77:1447–1453<br />
Nilsson MC, Wardle DA, Zackrisson O, Ja¨ derlund A (2002) Effects<br />
of alleviation of ecological stresses on an alpine tundra community<br />
over an eight-year period. Oikos 97:3–17<br />
Parks CG, Radosevich SR, Endress BA, Naylor BJ, Anzinger D,<br />
Rew LJ, Maxwell BD, Dwire KA (2005) Natural and land-use<br />
history of the Northwest mountain ecoregions (USA) in relation<br />
to patterns of plant invasions. Perspect Plant Ecol Evol<br />
Syst 7:137–158<br />
Richards AJ (1973) The origin of Taraxacum agamospecies. Bot J<br />
Linn Soc 66:89–111<br />
Richards CL, Bossdorf O, Muth NZ, Gurevitch J, Pigliucci M<br />
(2006) Jack of all trades, master of some? On the role of phenotypic<br />
plasticity in plant invasions. Ecol Lett 9:981–993
Richardson DM, Pysek P, Rejma´nek M, Barbour MG, Panetta<br />
FD, West CJ (2000) Naturalization and invasion of alien plants:<br />
concepts and definitions. Divers Distr 6:93–107<br />
Rogstad SH, Keane B, Beresh J (2001) Genetic variation across<br />
VNTR loci in central North American Taraxacum surveyed at<br />
different spatial scales. Plant Ecol 161:111–121<br />
Russel EJ, Russel EW (1959) Las condiciones del suelo y el desarrollo<br />
de las plantas. 2nd edn. Aguilar, Madrid<br />
Sakai AK, Allendorf FW, Holt JS, Lodge DM, Molofsky J, With<br />
KA, Baughman S, Cabin RJ, Cohen JE, Ellstrand NC,<br />
McCauley DE, O’Neil P, Parker IM, Thompson JN, Weller SG<br />
(2001) The population biology of invasive species. Annu Rev<br />
Ecol Syst 32:305–332<br />
Sexton JP, McKay JK, Sala A (2002) Plasticity and genetic diversity<br />
may allow saltcedar to invade cold climates in North<br />
America. Ecol Appl 12:1652–1660<br />
Suding KN, Lejeune KD, Seastedt TR (2004) Competitive<br />
impacts and responses of an invasive weed: dependencies<br />
on nitrogen and phosphorus availability. Oecologia 141:526–<br />
535<br />
Sultan SE (1995) Phenotypic plasticity and plant adaptation. Acta<br />
Bot Neerlandica 44:363–83<br />
Taiz L, Zeiger E (1998) Plant physiology, 2nd edn. Sinauer, Sunderland<br />
Tsialtas JT, Pritsa TS, Veresoglou DS (2004) Leaf physiological<br />
traits and their importance for species success in a Mediterranean<br />
grassland. Photosynthetica 42:371–376<br />
Van der Hulst RGM, Mes THM, Den Nijs JCM, Bachmann K<br />
(2000) Amplified fragment length polymorphism (AFLP)<br />
markers reveal that population structure of triploid dandelions<br />
(Taraxacum officinale) exhibits both clonality and recombination.<br />
Mol Ecol 9:1–8<br />
Verduijn MH, Van Dijk PJ, Van Damme JMM (2004) Distribution,<br />
phenology and demography of sympatric sexual and<br />
asexual dandelions (Taraxacum officinale s.l.): geographic parthenogenesis<br />
on a small scale. Biol J Linn Soc 82:205–218<br />
Vitousek PM, Gosz JR, Grier CC, Melillo JM, Reiners WA, Todd<br />
RL (1979) Nitrate losses from disturbed ecosystems. Science<br />
204:469–474<br />
Williamson M, Fitter A (1996) The varying success of invaders.<br />
Ecology 77:1661–1666<br />
Williams DG, Mack RN, Black RA (1995) Ecophysiology of<br />
introduced Pennicetum setaceum on Hawaii: the role of phenotypic<br />
plasticity. Ecology 76:1569–1580
262
Résumé<br />
Les écosystèmes alpins, au même titre que les écosystèmes arctiques, séquestrent des<br />
quantités importantes de carbone dans leurs sols. Dans ces écosystèmes, la topographie locale<br />
détermine la répartition de la neige; un facteur qui, sur le court terme, affecte les paramètres<br />
physiques de l’environnement (effets directs) et qui, sur le long terme, a sélectionné des<br />
communautés végétales et microbiennes très différentes aux deux extrêmes du gradient de<br />
mésotopographie (effets indirects). Au regard des modifications futures des régimes d’enneigement<br />
prédits par les différents modèles climatiques, cette étude vise à explorer les contrôles directs et<br />
indirects exercés par l’enneigement sur la fixation du CO2 et la minéralisation du carbone organique<br />
dans les écosystèmes alpins.<br />
Les paramètres physiques des sols (eau et température) ont été mesurés pendant plusieurs<br />
années révélant les effets directs. Afin de quantifier les effets indirects de l’enneigement sur les flux<br />
biogéochimiques, nous avons utilisé les caractéristiques fonctionnelles des végétaux (leurs traits).<br />
Différentes approches (mesures in situ, manipulations expérimentales et modélisation) ont été<br />
employées.<br />
Cette étude démontre que la fixation du carbone le long des gradients de mésotopographie<br />
est à la fois déterminée par les traits fonctionnels végétaux, les propriétés des canopées et la<br />
longueur de la saison de végétation. Un allongement de la saison de végétation devrait entraîner une<br />
augmentation marquée de la production primaire si les événements de gel en début de saison de<br />
végétation demeurent limités. La minéralisation du carbone est au contraire largement dépendante de<br />
la qualité de la matière organique contenue dans les sols. Des changements de composition en traits<br />
fonctionnels de la végétation, notamment ceux affectant les concentrations en lignine des litières,<br />
devraient avoir un impact déterminant sur les vitesses de minéralisation de la matière organique.<br />
Enfin, l’étude des flux de carbone et d’azote dans les plantes dominantes et à l’interface plante – sol<br />
révèle un couplage temporel et spatial essentiel chez les espèces dont la croissance est limitée par la<br />
longueur de la saison de végétation. Ce couplage apparaît plus limité dans les communautés<br />
végétales bénéficiant d’une plus longue saison de végétation. L’évolution des flux et stocks de<br />
carbone au sein des écosystèmes alpins dans un contexte de changement climatique est discutée.<br />
Abstract<br />
<strong>Alpine</strong> tundra store large carbon stocks in their soils. In these ecosystems, the local<br />
mesotopography determines snow cover distribution, a key variable, which affect the edapho-climatic<br />
conditions on the short term (direct effects) and, in the longer-term, select for contrasting plant and<br />
microbial communities at both ends of the topographical gradient (indirect effects). In the context of<br />
global change, where large changes in snow precipitations are projected, this study explores the<br />
controls exerted by snow cover on carbon fixation and carbon mineralization in alpine tundra.<br />
Edapho-climatic variables (water and temperature) were measured during several years and<br />
we used vegetation functional characteristics (using plant functional traits) to quantify the indirect<br />
effects of snow cover on biogeochemical cycles. Various approaches (in situ measurements,<br />
experimental manipulations and modeling) were used.<br />
This study demonstrates that carbon fixation along mesotopographical gradients is determined<br />
by plant functional traits, canopy properties and growing season length. A longer growing season may<br />
lead to a marked increase in primary production, if freezing events at snowmelt remain infrequent. In<br />
contrast, carbon mineralization is mainly dependant over soil organic matter quality. Shifts in plant<br />
functional traits, in particular those related to litter lignin content, will strongly impact the degradation<br />
process. Finally, the quantification of carbon and nitrogen fluxes in plants and at the plant-soil<br />
interface reveals a tight spatial and temporal coupling which is essential for species whose growth is<br />
limited by growing vegetation length. This coupling is reduced in plant communities which benefit from<br />
a longer growing season. The evolution of carbon fluxes and stocks in alpine ecosystems is discussed<br />
in the context of climatic changes.