THÈSE - Station Alpine Joseph Fourier - Université Joseph Fourier
THÈSE - Station Alpine Joseph Fourier - Université Joseph Fourier
THÈSE - Station Alpine Joseph Fourier - Université Joseph Fourier

Create successful ePaper yourself
Turn your PDF publications into a flip-book with our unique Google optimized e-Paper software.
Chapitre II Article 2A<br />
decay (yr -1 ). Decay constants were determined for each species in each topographical location<br />
by fitting a linear-regression of the (LN-transformed) litter remaining against time. An<br />
ANCOVA was applied within topographical location to test the significance of the Mass<br />
remaining × Species interaction.<br />
Finally, an ANCOVA was applied to test the regression between (1) yearly mass loss of each<br />
substrate against mean wintertime soil temperature and (2) litter N content (proportion of<br />
initial N content) of each species against mass loss. Analysed data were the mean of each<br />
harvest, in each topographical location. Species were considered as the qualitative factor<br />
whereas mean wintertime soil temperature (1) or mass loss (2) were the continuous factors.<br />
In Experiment II, we estimated decomposition rate for each period, each species and for each<br />
topographical situation by applying the following formula :<br />
1<br />
T<br />
[ remaining mass − remaining mass ]<br />
Decomposition rate ( mg / d)<br />
= ⋅<br />
t<br />
t−1<br />
where T is the period between t-1 and t (in days). We did not estimate the exponential decay<br />
constant (as done in experiment I) as the aims of this experiment were to precise for each<br />
period the decomposition rate of each substrate rather than the mean decomposition rate over<br />
all the period of the experiment. We used a two-way analysis of variance (ANOVA) to<br />
compare period and site effects for each species separately and to test differences in litter N<br />
content for each species (proportion of initial N content) after the first winter, summer and<br />
second winter. Finally, a Student’s t-test was used to assess the initial value (=1) litter N<br />
content (in proportion to initial) and that after winter I, summer and winter II. Statistical<br />
analyses were performed using R software (R Development Core Team 2006).<br />
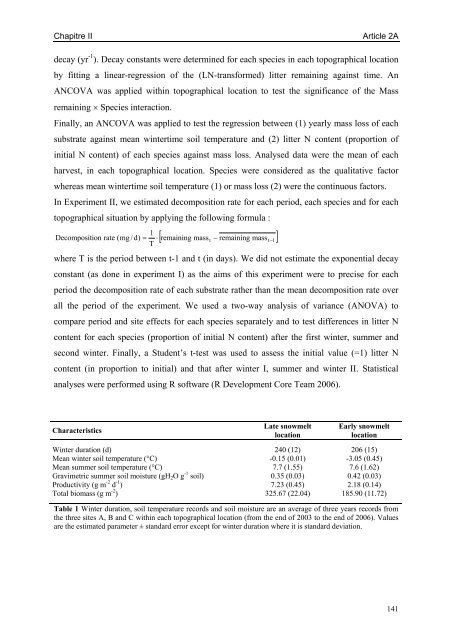
Characteristics<br />
Winter duration (d)<br />
Mean winter soil temperature (°C)<br />
Mean summer soil temperature (°C)<br />
Gravimetric summer soil moisture (gH2O g -1 soil)<br />
Productivity (g m -2 d -1 )<br />
Total biomass (g m -2 )<br />
Late snowmelt<br />
location<br />
240 (12)<br />
-0.15 (0.01)<br />
7.7 (1.55)<br />
0.35 (0.03)<br />
7.23 (0.45)<br />
325.67 (22.04)<br />
Early snowmelt<br />
location<br />
206 (15)<br />
-3.05 (0.45)<br />
7.6 (1.62)<br />
0.42 (0.03)<br />
2.18 (0.14)<br />
185.90 (11.72)<br />
Table 1 Winter duration, soil temperature records and soil moisture are an average of three years records from<br />
the three sites A, B and C within each topographical location (from the end of 2003 to the end of 2006). Values<br />
are the estimated parameter ± standard error except for winter duration where it is standard deviation.<br />
141