Calcination characteristics of laterite ores from the central - saimm
Calcination characteristics of laterite ores from the central - saimm
Calcination characteristics of laterite ores from the central - saimm

You also want an ePaper? Increase the reach of your titles
YUMPU automatically turns print PDFs into web optimized ePapers that Google loves.
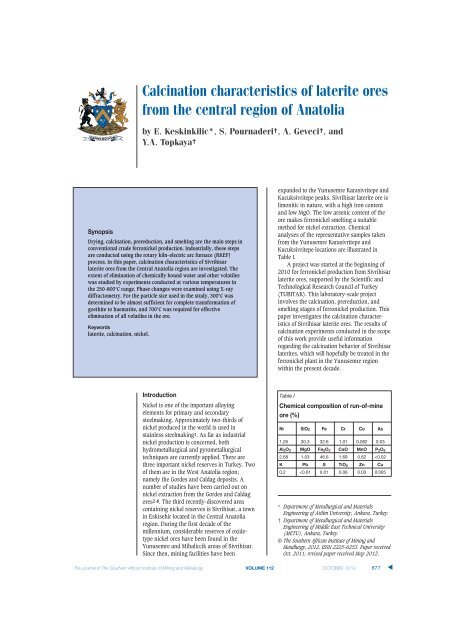
Synopsis<br />
<strong>Calcination</strong> <strong>characteristics</strong> <strong>of</strong> <strong>laterite</strong> <strong>ores</strong><br />
<strong>from</strong> <strong>the</strong> <strong>central</strong> region <strong>of</strong> Anatolia<br />
by E. Keskinkilic*, S. Pournaderi†, A. Geveci†, and<br />
Y.A. Topkaya†<br />
Drying, calcination, prereduction, and smelting are <strong>the</strong> main steps in<br />
conventional crude ferronickel production. Industrially, <strong>the</strong>se steps<br />
are conducted using <strong>the</strong> rotary kiln–electric arc furnace (RKEF)<br />
process. In this paper, calcination <strong>characteristics</strong> <strong>of</strong> Sivrihisar<br />
<strong>laterite</strong> <strong>ores</strong> <strong>from</strong> <strong>the</strong> Central Anatolia region are investigated. The<br />
extent <strong>of</strong> elimination <strong>of</strong> chemically bound water and o<strong>the</strong>r volatiles<br />
was studied by experiments conducted at various temperatures in<br />
<strong>the</strong> 250–800°C range. Phase changes were examined using X-ray<br />
diffractometry. For <strong>the</strong> particle size used in <strong>the</strong> study, 300°C was<br />
determined to be almost sufficient for complete transformation <strong>of</strong><br />
goethite to haematite, and 700°C was required for effective<br />
elimination <strong>of</strong> all volatiles in <strong>the</strong> ore.<br />
Keywords<br />
<strong>laterite</strong>, calcination, nickel.<br />
Introduction<br />
Nickel is one <strong>of</strong> <strong>the</strong> important alloying<br />
elements for primary and secondary<br />
steelmaking. Approximately two-thirds <strong>of</strong><br />
nickel produced in <strong>the</strong> world is used in<br />
stainless steelmaking1. As far as industrial<br />
nickel production is concerned, both<br />
hydrometallurgical and pyrometallurgical<br />
techniques are currently applied. There are<br />
three important nickel reserves in Turkey. Two<br />
<strong>of</strong> <strong>the</strong>m are in <strong>the</strong> West Anatolia region;<br />
namely <strong>the</strong> Gordes and Caldag deposits. A<br />
number <strong>of</strong> studies have been carried out on<br />
nickel extraction <strong>from</strong> <strong>the</strong> Gordes and Caldag<br />
<strong>ores</strong>2-8. The third recently-discovered area<br />
containing nickel reserves is Sivrihisar, a town<br />
in Eskisehir located in <strong>the</strong> Central Anatolia<br />
region. During <strong>the</strong> first decade <strong>of</strong> <strong>the</strong><br />
millennium, considerable reserves <strong>of</strong> oxidetype<br />
nickel <strong>ores</strong> have been found in <strong>the</strong><br />
Yunusemre and Mihaliccik areas <strong>of</strong> Sivrihisar.<br />
Since <strong>the</strong>n, mining facilities have been<br />
expanded to <strong>the</strong> Yunusemre Karasivritepe and<br />
Kucuksivritepe peaks. Sivrihisar <strong>laterite</strong> ore is<br />
limonitic in nature, with a high iron content<br />
and low MgO. The low arsenic content <strong>of</strong> <strong>the</strong><br />
ore makes ferronickel smelting a suitable<br />
method for nickel extraction. Chemical<br />
analyses <strong>of</strong> <strong>the</strong> representative samples taken<br />
<strong>from</strong> <strong>the</strong> Yunusemre Karasivritepe and<br />
Kucuksivritepe locations are illustrated in<br />
Table I.<br />
A project was started at <strong>the</strong> beginning <strong>of</strong><br />
2010 for ferronickel production <strong>from</strong> Sivrihisar<br />
<strong>laterite</strong> <strong>ores</strong>, supported by <strong>the</strong> Scientific and<br />
Technological Research Council <strong>of</strong> Turkey<br />
(TUBITAK). This laboratory-scale project<br />
involves <strong>the</strong> calcination, prereduction, and<br />
smelting stages <strong>of</strong> ferronickel production. This<br />
paper investigates <strong>the</strong> calcination <strong>characteristics</strong><br />
<strong>of</strong> Sivrihisar <strong>laterite</strong> <strong>ores</strong>. The results <strong>of</strong><br />
calcination experiments conducted in <strong>the</strong> scope<br />
<strong>of</strong> this work provide useful information<br />
regarding <strong>the</strong> calcination behavior <strong>of</strong> Sivrihisar<br />
<strong>laterite</strong>s, which will hopefully be treated in <strong>the</strong><br />
ferronickel plant in <strong>the</strong> Yunusemre region<br />
within <strong>the</strong> present decade.<br />
* Department <strong>of</strong> Metallurgical and Materials<br />
Engineering <strong>of</strong> Atilim University, Ankara, Turkey.<br />
† Department <strong>of</strong> Metallurgical and Materials<br />
Engineering <strong>of</strong> Middle East Technical University<br />
(METU), Ankara, Turkey.<br />
© The Sou<strong>the</strong>rn African Institute <strong>of</strong> Mining and<br />
Metallurgy, 2012. ISSN 2225-6253. Paper received<br />
Oct. 2011; revised paper received May 2012.<br />
The Journal <strong>of</strong> The Sou<strong>the</strong>rn African Institute <strong>of</strong> Mining and Metallurgy VOLUME 112 OCTOBER 2012 877 ▲<br />
Table I<br />
Chemical composition <strong>of</strong> run-<strong>of</strong>-mine<br />
ore (%)<br />
Ni SiO2 Fe Cr Co As<br />
1.26 30.3 32.6 1.01 0.082 0.03<br />
Al2O3 MgO Fe2O3 CaO MnO P2O5<br />
2.68 1.03 46.6 1.69 0.62
<strong>Calcination</strong> <strong>characteristics</strong> <strong>of</strong> <strong>laterite</strong> <strong>ores</strong> <strong>from</strong> <strong>the</strong> <strong>central</strong> region <strong>of</strong> Anatolia<br />
Experimental<br />
Sivrihisar limonitic <strong>laterite</strong> ore <strong>from</strong> <strong>the</strong> Yunusemre<br />
Karasivritepe and Kucuksivritepe peaks was used in <strong>the</strong><br />
experiments. Four ore samples were taken <strong>from</strong> specific<br />
regions <strong>of</strong> <strong>the</strong> mine and were thoroughly mixed to form a<br />
representative sample for <strong>the</strong> experiments. The mixed sample<br />
was <strong>the</strong>n divided into four almost equal weights <strong>of</strong> approximately<br />
100 kg by <strong>the</strong> coning and quartering method. One<br />
quarter was taken for ore characterization and <strong>the</strong> o<strong>the</strong>rs<br />
were stocked in barrels. The complete procedure for obtaining<br />
a representative sample <strong>from</strong> a run <strong>of</strong> mine ore for X-ray<br />
diffractometry (XRD) and chemical analysis is shown in<br />
Figure 1.<br />
The XRD pattern <strong>of</strong> <strong>the</strong> run-<strong>of</strong>-mine ore is shown in<br />
Figure 2. XRD was carried out using a Rigaku SA-HF3<br />
diffractometer with Cu Kα (λ = 1.54 Å) radiation (40 kV and<br />
40 mA). The ore consists mainly <strong>of</strong> quartz (SiO2) with<br />
characteristic peaks at d101 = 3.33 Å, d100 = 4.24 Å, and d112<br />
= 1.82 Å; and goethite (FeO[OH]) with characteristic peaks at<br />
d110 = 4.17 Å, d111 = 2.45 Å, and d130 = 2.69 Å. There are<br />
considerable amounts <strong>of</strong> calcite (CaCO3) with a characteristic<br />
peak at d104 = 3.01 Å and haematite (Fe2O3), indicated by <strong>the</strong><br />
characteristic peaks at d104 = 2.69 Å, d110 = 2.51 Å, and d116<br />
= 1.69 Å. Moreover, two low-intensity peaks were recorded at<br />
a low degree region (2θ < 15° ): it was suggested that <strong>the</strong><br />
peak at d = 16.59 Å (2θ = 5.32° ) is associated with<br />
nontronite, while <strong>the</strong> peak at d = 7.07 Å (2θ = 12.50° ) is <strong>the</strong><br />
characteristic peak <strong>of</strong> kaolinite (Al2Si2O5 (OH)4).<br />
In <strong>the</strong> calcination experiments, it was determined that a<br />
particle size finer than 50 mm was to be used. Therefore, one<br />
<strong>of</strong> <strong>the</strong> three subsamples stocked in <strong>the</strong> barrels was screened<br />
at 50 mm. The oversize lumpy materials containing chiefly<br />
gangue minerals were rejected, and <strong>the</strong> particles passing<br />
50 mm were labelled as ’–50 mm ore’. A procedure similar to<br />
<strong>the</strong> one given in Figure 1 was applied for <strong>the</strong> –50 mm ore,<br />
and <strong>the</strong> particle size was reduced to below 1 mm by<br />
successive crushing and grinding steps. Samples were<br />
prepared for XRD analysis and chemical composition determination<br />
using a disc grinder. The chemical analysis <strong>of</strong> –50 mm<br />
ore is illustrated in Table II. The chemical analysis was<br />
conducted by ICP-OES.<br />
An externally controlled muffle furnace was used in <strong>the</strong><br />
calcination experiments. In each run, 100 g <strong>of</strong> <strong>laterite</strong> ore<br />
(–1 mm size) were placed in a chamotte tray and charged to<br />
<strong>the</strong> furnace (kept at <strong>the</strong> experimental temperature). Runs<br />
were carried out with temperature and time as <strong>the</strong> experimental<br />
variables. Two different approaches were used. In <strong>the</strong><br />
Figure 2—XRD results for run-<strong>of</strong>-mine ore<br />
▲<br />
Figure 1—Flow sheet <strong>of</strong> sample preparation for run-<strong>of</strong>-mine ore<br />
Table II<br />
Chemical composition <strong>of</strong> –50 mm ore (%)<br />
Ni SiO2 Fe Cr Co As<br />
1.41 25.8 33.7 1.26 0.093 0.04<br />
Al2O3 MgO Fe2O3 CaO MnO P2O5<br />
3.23 1.29 48.2 1.65 0.74 0.04<br />
K Pb S TiO2 Zn Cu<br />
0.2 0.01 0.03 0.08 0.03 0.006<br />
878 OCTOBER 2012 VOLUME 112 The Journal <strong>of</strong> The Sou<strong>the</strong>rn African Institute <strong>of</strong> Mining and Metallurgy
<strong>Calcination</strong> <strong>characteristics</strong> <strong>of</strong> <strong>laterite</strong> <strong>ores</strong> <strong>from</strong> <strong>the</strong> <strong>central</strong> region <strong>of</strong> Anatolia<br />
first, calcination was continued until <strong>the</strong> charge weight<br />
became constant—<strong>the</strong>se runs are termed ’continuous to<br />
constant weight’. In <strong>the</strong> second, calcination was carried out<br />
for a specified time in order to evaluate <strong>the</strong> difference in <strong>the</strong><br />
weight in a noncontinuous way. In <strong>the</strong> continuous to<br />
constant weight runs, <strong>the</strong> tray was removed <strong>from</strong> <strong>the</strong> furnace<br />
periodically to record <strong>the</strong> weight, and was recharged<br />
immediately after weighing. In <strong>the</strong> second set <strong>of</strong> experiments,<br />
<strong>the</strong> tray was left in <strong>the</strong> furnace for a predetermined period. In<br />
both approaches, <strong>the</strong> furnace wall was opened at specified<br />
times to mix <strong>the</strong> charge.<br />
With <strong>the</strong> first approach, experiments were conducted at<br />
250°C, 300°C, 350°C, 400°C, 500 °C, 600°C, 650°C, 675°C,<br />
700°C, and 800°C until <strong>the</strong> weight became constant. In <strong>the</strong><br />
experiments conducted by <strong>the</strong> second approach, which can be<br />
regarded as <strong>the</strong> reproduction <strong>of</strong> <strong>the</strong> first approach, <strong>the</strong> weight<br />
loss at <strong>the</strong> end <strong>of</strong> specific times was determined.<br />
Results and discussion<br />
Thermogravimetric (TG) measurements were conducted in a<br />
<strong>the</strong>rmobalance with DTA (differential <strong>the</strong>rmal analysis)<br />
capability in <strong>the</strong> Central Laboratory <strong>of</strong> <strong>the</strong> Middle East<br />
Technical University. DTA–TG curves were obtained by<br />
heating approximately 20 mg <strong>of</strong> ground sample (< 74 μm)<br />
<strong>from</strong> 25°C to 1000°C with a heating rate <strong>of</strong> 10°C per minute.<br />
The DTA and TG behaviour <strong>of</strong> <strong>the</strong> –50 mm ore are illustrated<br />
in Figure 3.<br />
Five main endo<strong>the</strong>rmic peaks were observed at around<br />
60°C, 110°C, 290°C, 500°C, and 700°C with a mass loss <strong>of</strong><br />
about 1 per cent, 1.3 per cent, 5.3 per cent, 0.8 per cent, and<br />
0.9 per cent respectively. Peaks at 60°C and 110°C<br />
correspond to evaporation <strong>of</strong> free moisture or physically<br />
bound water. The endo<strong>the</strong>rmic peak at about 290°C<br />
corresponds to <strong>the</strong> dehydroxylation <strong>of</strong> goethite, i.e. <strong>the</strong><br />
transformation <strong>of</strong> goethite to haematite. As stated in <strong>the</strong><br />
literature, this transformation has been subjected to a<br />
number <strong>of</strong> investigations and <strong>the</strong>re has been no general<br />
agreement on <strong>the</strong> mechanism9. According to <strong>the</strong> studies<br />
carried out by Walter et al.10 and Watari et al.11, <strong>the</strong> transformation<br />
is suggested to take place directly according to<br />
reaction [1]:<br />
Figure 3—DTA–TG Curves <strong>of</strong> <strong>the</strong> –50 mm ore sample<br />
[1]<br />
On <strong>the</strong> o<strong>the</strong>r hand, some researchers12-13 propose that an<br />
intermediate phase, known as proto-haematite or hydro<br />
haematite, forms before <strong>the</strong> final formation <strong>of</strong> haematite . In<br />
Figure 3, <strong>the</strong> peaks around 500°C and 700°C most likely<br />
correspond to <strong>the</strong> last stages <strong>of</strong> elimination <strong>of</strong> chemically<br />
bound water and carbon dioxide <strong>from</strong> <strong>the</strong> ore.<br />
Considering <strong>the</strong> results <strong>of</strong> <strong>the</strong> TG measurements, it was<br />
decided to conduct <strong>the</strong> first experiment at 250°C. The run<br />
conducted at this temperature resulted in a weight loss <strong>of</strong> 5.9<br />
per cent, while <strong>the</strong> time elapsed to reach constant weight was<br />
120 minutes. The variation <strong>of</strong> weight loss values with time is<br />
illustrated in Figure 4. The experiment carried out at 300°C<br />
reached steady state at <strong>the</strong> end <strong>of</strong> 65 minutes, which was<br />
substantially less than <strong>the</strong> period necessitated at 250°C. The<br />
weight loss due to dehydroxylation was found to be 6.6 per<br />
cent. Therefore, it was concluded that 250°C was not<br />
sufficient to perform effective dehydroxylation for <strong>the</strong> particle<br />
size used in this work.<br />
Figure 4–Weight loss (%) as a function <strong>of</strong> time at various temperatures<br />
The Journal <strong>of</strong> The Sou<strong>the</strong>rn African Institute <strong>of</strong> Mining and Metallurgy VOLUME 112 OCTOBER 2012 879 ▲
<strong>Calcination</strong> <strong>characteristics</strong> <strong>of</strong> <strong>laterite</strong> <strong>ores</strong> <strong>from</strong> <strong>the</strong> <strong>central</strong> region <strong>of</strong> Anatolia<br />
An increased weight loss was noted when <strong>the</strong><br />
temperature was raised to 400°C. The run conducted at this<br />
temperature resulted in a weight loss value <strong>of</strong> 7.2 per cent.<br />
The fur<strong>the</strong>r experiment at 500°C produced a weight loss <strong>of</strong><br />
8.0 per cent. In both runs, <strong>the</strong> charges reached constant<br />
weight at <strong>the</strong> end <strong>of</strong> 40–45 minutes. These findings<br />
obviously show that certain reaction(s) was/were taking<br />
place after <strong>the</strong> dehydroxylation <strong>of</strong> goethite, confirming <strong>the</strong><br />
data obtained <strong>from</strong> <strong>the</strong> DTA–TG curves.<br />
In order to continue investigating <strong>the</strong> extent <strong>of</strong> change in<br />
weight loss and <strong>the</strong> time required to reach constant weight, it<br />
was decided that experiments should be conducted at higher<br />
temperatures. The run carried out at 600°C gave rise to a<br />
weight loss <strong>of</strong> 8.6 per cent. The time elapsed to reach steady<br />
state was 40 minutes at this temperature. A higher weight<br />
loss value was reported at 700°C, at 10.0 per cent, as<br />
expected. On <strong>the</strong> o<strong>the</strong>r hand, <strong>the</strong> time needed for complete<br />
calcination was found to be 60 minutes, which was 50 per<br />
cent longer than that obtained at 600°C. This increase in<br />
calcination time was attributed to certain new reaction(s)<br />
taking place in <strong>the</strong> 600–700°C interval.<br />
The experiment conducted at 800°C resulted in a weight<br />
loss <strong>of</strong> 10.0 per cent, which was almost <strong>the</strong> same value<br />
obtained at 700°C. Therefore, it was inferred that 700°C is<br />
sufficient for calcination and that chemically bound water and<br />
o<strong>the</strong>r volatiles in <strong>the</strong> ore are completely eliminated at a<br />
temperature less than or equal to 700°C. At 800°C, <strong>the</strong> time<br />
to reach constant weight was found to be 45 minutes, which<br />
was approximately 25 per cent shorter than <strong>the</strong> period at<br />
700°C. This result was in accordance with expectations, since<br />
an increase in temperature is effective in increasing <strong>the</strong> rate<br />
<strong>of</strong> <strong>the</strong> calcination process.<br />
To determine precisely <strong>the</strong> temperature at which <strong>the</strong><br />
goethite-to-haematite transformation is completed, it was<br />
decided that a fur<strong>the</strong>r experiment should be carried out at <strong>the</strong><br />
mid-point <strong>of</strong> <strong>the</strong> 300–400°C interval. The run conducted at<br />
350°C produced a weight loss <strong>of</strong> 6.7 per cent, which was<br />
nearly <strong>the</strong> same as that obtained at 300°C. This finding<br />
revealed that for <strong>the</strong> particle size <strong>of</strong> <strong>the</strong> ore used in <strong>the</strong><br />
present study, 300°C was almost sufficient to achieve<br />
dehydroxylation. The time to reach steady state was 60<br />
minutes, which is slightly shorter than that <strong>of</strong> <strong>the</strong> run<br />
conducted at 300°C, as expected.<br />
As mentioned previously, approximately <strong>the</strong> same weight<br />
loss values were obtained at <strong>the</strong> end <strong>of</strong> <strong>the</strong> runs carried out at<br />
700°C and 800°C. This result clearly indicates that removal <strong>of</strong><br />
chemically bound water and o<strong>the</strong>r volatiles is completed at a<br />
temperature less than or equal to 700°C. In order to<br />
determine precisely this minimum temperature, an<br />
experiment was conducted at <strong>the</strong> mid-point <strong>of</strong> <strong>the</strong> 600–700°C<br />
range. The run carried out at 650°C resulted in a weight loss<br />
value <strong>of</strong> 9.6 per cent. This value is less than that obtained at<br />
700°C, indicating that 650°C is not sufficient to remove all<br />
volatiles. The time to reach constant weight was 95 minutes,<br />
substantially longer than <strong>the</strong> period required at 700°C. To<br />
verify <strong>the</strong> results, <strong>the</strong> experiment was repeated and <strong>the</strong> same<br />
results were obtained. This ra<strong>the</strong>r long time is probably an<br />
indication <strong>of</strong> certain reversible reaction(s) at <strong>the</strong>se temperatures,<br />
which increase <strong>the</strong> time necessary for <strong>the</strong> process to<br />
reach steady state. A fur<strong>the</strong>r experiment at <strong>the</strong> mid-point <strong>of</strong><br />
650–700°C was carried out. At <strong>the</strong> end <strong>of</strong> <strong>the</strong> run conducted<br />
▲<br />
at 675°C, a weight loss <strong>of</strong> 10.0 per cent was recorded. This<br />
value is almost <strong>the</strong> same as <strong>the</strong> one obtained at 700°C. The<br />
time elapsed to reach constant weight was recorded as 75<br />
minutes, which is slightly lower than <strong>the</strong> time required at<br />
700°C. Therefore, it was concluded that 675°C is nearly high<br />
enough to conduct <strong>the</strong> calcination <strong>of</strong> –50 mm Sivrihisar<br />
<strong>laterite</strong> if sufficient time is allocated.<br />
In summary, <strong>the</strong>rmal experiments carried out in <strong>the</strong> range<br />
<strong>of</strong> 250–800°C showed that <strong>the</strong> amount <strong>of</strong> chemically bound<br />
water and o<strong>the</strong>r volatiles in <strong>the</strong> ore is approximately 10 per<br />
cent by weight. Roughly speaking, two-thirds <strong>of</strong> <strong>the</strong> weight<br />
loss is associated with <strong>the</strong> removal <strong>of</strong> chemically bound water<br />
during <strong>the</strong> goethite–haematite transformation, and <strong>the</strong><br />
remaining one-third is related to <strong>the</strong> elimination <strong>of</strong> volatiles<br />
in <strong>the</strong> 350–700°C interval. The change in weight loss (%)<br />
with temperature is illustrated in Figure 5. In this figure, <strong>the</strong><br />
time to reach constant weight is also shown for each<br />
temperature. Toge<strong>the</strong>r with <strong>the</strong> findings described in <strong>the</strong><br />
preceding paragraphs, <strong>the</strong> total process can be divided into<br />
three steps:<br />
1. Removal <strong>of</strong> chemically bound water in <strong>the</strong> 0–350°C<br />
range<br />
2. Reaction(s) in <strong>the</strong> 350–600°C interval: <strong>the</strong> shortest<br />
time was obtained at 600°C, indicating that this could<br />
be regarded as <strong>the</strong> termination point <strong>of</strong> <strong>the</strong> second<br />
step<br />
3. Reaction(s) taking place above 600°C: for <strong>the</strong><br />
completion <strong>of</strong> reaction(s) in this step, considerably<br />
longer periods, even approaching 100 minutes, were<br />
needed.<br />
Experiments conducted with <strong>the</strong> second approach<br />
revealed similar results. The weight losses obtained <strong>from</strong> <strong>the</strong><br />
second approach were found to be nearly <strong>the</strong> same as those<br />
recorded in <strong>the</strong> first approach. However, slightly higher<br />
weight loss values were found at <strong>the</strong> end <strong>of</strong> <strong>the</strong> runs<br />
conducted with <strong>the</strong> second approach. This tendency was more<br />
pronounced in <strong>the</strong> lower temperature experiments. The<br />
weight loss values converged as <strong>the</strong> temperature increased.<br />
The weight loss difference was most prominent at <strong>the</strong> lowest<br />
experimental temperature <strong>of</strong> 250°C. At <strong>the</strong> end <strong>of</strong> 40 minutes,<br />
<strong>the</strong> continuous-to-constant-weight experiment led to a<br />
weight loss <strong>of</strong> 4.8 per cent, whereas <strong>the</strong> experiment<br />
Figure 5—Variations <strong>of</strong> final weight loss (%) and time to reach constant<br />
weight with temperature<br />
880 OCTOBER 2012 VOLUME 112 The Journal <strong>of</strong> The Sou<strong>the</strong>rn African Institute <strong>of</strong> Mining and Metallurgy
<strong>Calcination</strong> <strong>characteristics</strong> <strong>of</strong> <strong>laterite</strong> <strong>ores</strong> <strong>from</strong> <strong>the</strong> <strong>central</strong> region <strong>of</strong> Anatolia<br />
conducted with <strong>the</strong> second approach yielded 5.3 per cent. The<br />
difference between <strong>the</strong> results is 11.5 per cent. For <strong>the</strong> same<br />
time period, <strong>the</strong> difference was 2.2 per cent for 300°C and 4.3<br />
per cent for 350°C. At higher temperatures, <strong>the</strong> difference<br />
was found to stay in <strong>the</strong> ± 2 per cent band. The considerable<br />
difference between <strong>the</strong> weight loss values at 250°C was<br />
attributed to differences in experimental procedure as well as<br />
<strong>the</strong> reversible behaviour <strong>of</strong> <strong>the</strong> goethite–haematite transformation<br />
reaction. In <strong>the</strong> first approach, as indicated<br />
previously, <strong>the</strong> sample was removed <strong>from</strong> <strong>the</strong> furnace periodically<br />
for weighing. This did not result in a significant<br />
temperature drop, because <strong>of</strong> <strong>the</strong> short time involved. On <strong>the</strong><br />
o<strong>the</strong>r hand, <strong>the</strong> interaction <strong>of</strong> <strong>the</strong> sample with <strong>the</strong><br />
atmosphere, and <strong>the</strong>refore humidity, is longer in <strong>the</strong> first<br />
approach. Under <strong>the</strong>se circumstances, it was inferred that<br />
some reverse reaction(s) takes place, and <strong>the</strong> chemically<br />
bound water that was eliminated partially integrates back<br />
into <strong>the</strong> sample, causing a lower weight loss value in <strong>the</strong><br />
experiments conducted to constant weight. As indicated in<br />
<strong>the</strong> following paragraph, an experiment conducted to<br />
evaluate <strong>the</strong> extent <strong>of</strong> reversibility showed that <strong>the</strong> weight <strong>of</strong><br />
<strong>the</strong> calcined sample increased by a few grams when it was<br />
exposed to <strong>the</strong> atmosphere for couple <strong>of</strong> hours. A change in<br />
<strong>the</strong> physical appearance <strong>of</strong> <strong>the</strong> ore was also observed. At all<br />
temperatures, <strong>the</strong> fawn-colored original ore became dark<br />
brown in appearance after calcination. In all runs, it was<br />
observed that <strong>the</strong> surface <strong>of</strong> <strong>the</strong> calcined sample removed<br />
<strong>from</strong> <strong>the</strong> furnace reverted to a lighter color in a short time,<br />
which could be observed easily with <strong>the</strong> naked eye. The final<br />
appearance was not <strong>the</strong> same as <strong>the</strong> original one, but <strong>the</strong><br />
colour change is a probable indication <strong>of</strong> certain reverse<br />
reaction(s).<br />
In order to determine which transformation(s) is (are)<br />
reversible and to quantify <strong>the</strong> degree <strong>of</strong> reversibility, an<br />
experiment was conducted as follows. A 100 g sample <strong>of</strong><br />
dried raw ore was heated at 300°C for 2 hours and weighed.<br />
The sample was cooled to ambient temperature and was left<br />
in air for one day. It was <strong>the</strong>n dried at 105°C to totally<br />
eliminate absorbed moisture. The dried sample was weighed<br />
again and <strong>the</strong> weight difference with respect to that recorded<br />
just after calcinations was determined. Similar cycles were<br />
carried out at 500°C and 800°C. The process is schematically<br />
illustrated in Figure 6.<br />
The results showed that approximately 1 per cent <strong>of</strong> <strong>the</strong><br />
raw ore mass (i.e. approximately 10 per cent <strong>of</strong> <strong>the</strong> weight<br />
loss) was regained after cooling. This amount was constant<br />
Figure 6—Schematical diagram <strong>of</strong> <strong>the</strong> experiment conducted to<br />
determine degree <strong>of</strong> reversibility<br />
for all temperatures. If one <strong>of</strong> <strong>the</strong> transformations occurring<br />
above 300°C was reversible, <strong>the</strong> regained mass would be<br />
greater at higher temperatures. It was <strong>the</strong>refore deduced that<br />
during <strong>the</strong>rmal treatment <strong>of</strong> Sivrihisar <strong>laterite</strong>s, partially<br />
reversible transformation(s) takes place below 300°C on<br />
cooling. This experiment, <strong>of</strong> course, does not yield much<br />
information about <strong>the</strong> nature and types <strong>of</strong> reaction(s)<br />
occurring below 300°C, but <strong>the</strong> regained mass can be<br />
attributed mostly to <strong>the</strong> reverse reaction <strong>of</strong> goethitehaematite<br />
transformation.<br />
In summary, it was found that complete removal <strong>of</strong><br />
chemically bound water and o<strong>the</strong>r volatiles necessitates 75<br />
minutes at 675°C, 60 minutes at 700°C, and 45 minutes at<br />
800°C. Under <strong>the</strong>se circumstances, 700°C is recommended for<br />
effective calcination. The results <strong>of</strong> <strong>the</strong> experiments and <strong>the</strong><br />
curves revealed that 98–99 per cent <strong>of</strong> <strong>the</strong> chemically bound<br />
water and o<strong>the</strong>r volatiles were removed in 40 minutes at<br />
700°C. This degree <strong>of</strong> elimination required 25 minutes at<br />
800°C. These periods are approximately 33 per cent and 45<br />
per cent shorter than those required for complete elimination<br />
at 700°C and 800°C, respectively. Considering <strong>the</strong> furnace<br />
heat requirements and <strong>the</strong> power costs, 700°C and 40<br />
minutes were determined as <strong>the</strong> optimum calcination<br />
conditions. If <strong>the</strong> calcination process was to be conducted at<br />
800°C, <strong>the</strong> recommended period would be 25 minutes. As<br />
indicated previously, <strong>the</strong> findings <strong>of</strong> this laboratory-scale<br />
study reflect <strong>the</strong> results obtained with ’–50 mm ore’ and ore<br />
ground to –1 mm particle size. The effect <strong>of</strong> particle size on<br />
calcination was not investigated in <strong>the</strong> present work.<br />
XRD analysis <strong>of</strong> calcined ore samples<br />
Calcined ore samples were characterized by X-ray diffractometry.<br />
For this purpose, –50 mm ore samples calcined at<br />
different temperatures for a 40-minute period were stocked in<br />
small closed tubes in a desiccator. XRD analysis was carried<br />
out on samples calcined at 250°C, 300°C, 400°C, 500°C,<br />
600°C, 700°C, and 800°C. Diffraction patterns <strong>of</strong> <strong>the</strong>se<br />
samples are illustrated in Figure 7, toge<strong>the</strong>r with a pattern<br />
<strong>from</strong> uncalcined –50 mm ore.<br />
XRD analysis results showed that <strong>the</strong> uncalcined –50 mm<br />
ore consists mainly <strong>of</strong> quartz and goethite. It can be seen that<br />
a considerable amount <strong>of</strong> goethite alters to haematite at<br />
250°C, and that this transformation is almost complete at<br />
300°C. Although <strong>the</strong> XRD patterns did not reveal any<br />
transformation between 300°C and 500°C, TG analysis and<br />
calcination experiments recorded a mass loss in this range.<br />
This mass loss most probably corresponds to <strong>the</strong> dehydroxylation<br />
<strong>of</strong> clay minerals. However, this is not recorded by XRD<br />
analysis <strong>of</strong> calcined ore, since <strong>the</strong> percentage <strong>of</strong> clay minerals<br />
is below <strong>the</strong> detection threshold <strong>of</strong> standard XRD.<br />
Characterization <strong>of</strong> clay minerals present in <strong>the</strong> ore will be<br />
examined in a future paper.<br />
At 600°C, a distinct peak at 2θ = 43.96 (d = 2.05 Å) was<br />
observed, <strong>the</strong> intensity <strong>of</strong> which decreased at higher temperatures.<br />
The nature <strong>of</strong> <strong>the</strong> reaction taking place and <strong>the</strong> phase<br />
that exists within <strong>the</strong> 600–800°C interval has not yet been<br />
identified. Comparison <strong>of</strong> XRD diagrams <strong>of</strong> calcined <strong>ores</strong> in<br />
<strong>the</strong> 600–800°C interval showed that calcite does not appear at<br />
temperatures above 700°C, because it decomposes. Normally,<br />
calcite decomposes into CaO and CO2. On <strong>the</strong> o<strong>the</strong>r hand, no<br />
peak related to CaO was detected. Instead, a low-intensity<br />
The Journal <strong>of</strong> The Sou<strong>the</strong>rn African Institute <strong>of</strong> Mining and Metallurgy VOLUME 112 OCTOBER 2012 881 ▲
<strong>Calcination</strong> <strong>characteristics</strong> <strong>of</strong> <strong>laterite</strong> <strong>ores</strong> <strong>from</strong> <strong>the</strong> <strong>central</strong> region <strong>of</strong> Anatolia<br />
Figure 7—XRD Pattern <strong>of</strong> –50 mm ore after calcination at different<br />
temperatures for 40 minutes. All <strong>the</strong> analyses were conducted at room<br />
temperature<br />
peak <strong>of</strong> Ca was found to appear at 2θ = 28.28. Despite <strong>the</strong><br />
preceding discussion, <strong>the</strong> nature <strong>of</strong> <strong>the</strong> reactions between<br />
350° C and 800° C is still under examination.<br />
Conclusions<br />
➤ The complete calcination process resulted in a weight<br />
loss <strong>of</strong> approximately 10 per cent <strong>of</strong> <strong>the</strong> weight <strong>of</strong> <strong>the</strong><br />
ore. Roughly speaking, two-thirds <strong>of</strong> <strong>the</strong> weight loss is<br />
associated with <strong>the</strong> removal <strong>of</strong> chemically bound water<br />
during <strong>the</strong> goethite–haematite transformation, and <strong>the</strong><br />
remaining one-third is related to <strong>the</strong> elimination <strong>of</strong><br />
volatiles in <strong>the</strong> 350–700°C interval. For effective<br />
elimination <strong>of</strong> chemically bound water and all volatiles,<br />
700°C should be selected as <strong>the</strong> calcination<br />
temperature. Forty minutes was determined as <strong>the</strong><br />
optimum time for <strong>the</strong> particle size used in <strong>the</strong> present<br />
work. If 800°C were decided on as <strong>the</strong> calcination<br />
temperature, <strong>the</strong>n a time <strong>of</strong> 25 minutes would be<br />
selected<br />
➤ During <strong>the</strong>rmal treatment <strong>of</strong> Sivrihisar <strong>laterite</strong>s,<br />
partially reversible transformation(s) takes place below<br />
300°C on cooling<br />
➤ X-ray diffractometry revealed that <strong>the</strong> Sivrihisar<br />
<strong>laterite</strong>s contain mainly quartz and goethite. Some<br />
haematite and calcite were also encountered in <strong>the</strong> ore.<br />
The clay minerals kaolinite and nontronite were also<br />
observed. <strong>Calcination</strong> experiments showed that 300°C<br />
▲<br />
was almost sufficient for <strong>the</strong> effective transformation <strong>of</strong><br />
goethite to haematite. Calcite was reported to<br />
decompose within <strong>the</strong> 600–700°C interval.<br />
Characterization <strong>of</strong> clay minerals in <strong>the</strong> ore and phase<br />
changes between 350 and 800°C will be investigated in<br />
detail in future papers.<br />
Acknowledgements<br />
The authors would like to thank <strong>the</strong> Scientific and<br />
Technological Research Council <strong>of</strong> Turkey (TUBITAK) for <strong>the</strong><br />
financial support given under Project No: 109M068, and<br />
META Nickel Cobalt Co. for supplying <strong>the</strong> lateritic ore<br />
samples <strong>from</strong> Sivrihisar.<br />
References<br />
1. General Mining and Metallurgical Company – LARCO. Nickel.<br />
http://www.larco.gr/nickel.php [accessed 5 Oct. 2011].<br />
2. YUKSEL, M. Recovery <strong>of</strong> nickel <strong>from</strong> lateritic Caldag deposit. MS <strong>the</strong>sis,<br />
Middle East Technical University, Ankara, Turkey, 1985.<br />
3. TOPKAYA, Y.A. Nickel Extraction <strong>from</strong> Lateritic Nickel Ores Project no.<br />
106M079. Scientific and Technological Research Council <strong>of</strong> Turkey<br />
(TUBITAK) Ankara, Turkey, 2009.<br />
4. BUYUKAKINCI, E. Extraction <strong>of</strong> nickel <strong>from</strong> lateritic <strong>ores</strong>. MS <strong>the</strong>sis, Middle<br />
East Technical University, Ankara, Turkey, 2008.<br />
5. BUYUKAKINCI, E. and TOPKAYA, Y.A. Extraction <strong>of</strong> nickel <strong>from</strong> Gordes lateritic<br />
ore with atmospheric leaching. ALTA 2008 Nickel/Cobalt/Conference,<br />
Perth, Western Australia, 2008.<br />
6. BUYUKAKINCI, E. and TOPKAYA, Y.A. Extraction <strong>of</strong> nickel <strong>from</strong> lateritic <strong>ores</strong> at<br />
atmospheric pressure with agitation leaching. Hydrometallurgy, vol. 97,<br />
2009. pp. 33–38.<br />
7. OZDEMIR, V. Ferronickel Production <strong>from</strong> Manisa Caldag Lateritic Ore.<br />
Report, General Directorate <strong>of</strong> Mineral Research and Exploration, Ankara,<br />
Turkey, 2008.<br />
8. COLAKOGLU, C., DERIN, B., and YUCEL, O. A study on nickel containing iron<br />
alloy production <strong>from</strong> West Anatolian region lateritic <strong>ores</strong>. EPD Congress,<br />
TMS, 2009. pp. 719–723.<br />
9. PRASAD, P.S.R., PRASAD, K.S., CHAITANYA, V.K., BABU, E.V.S.S.K., SREEDHAR,<br />
B., and MURTHY, S.R. In-situ FTIR study on <strong>the</strong> dehydration <strong>of</strong> natural<br />
goethite. Journal <strong>of</strong> Asian Earth Sciences, vol. 27, 2006. pp. 503–511.<br />
10. WALTER, D., BUXBAUM, G., and LAQUA, W. The mechanism <strong>of</strong> <strong>the</strong> <strong>the</strong>rmal<br />
transformation <strong>from</strong> goethite to hematite. Journal <strong>of</strong> Thermal Analytical<br />
and Calorimetry, vol. 63, 2001. pp. 733–748.<br />
11. WATARI, F., DELAVIGNETTE, P., and AMELINCKX, S. Electron microscopic study<br />
<strong>of</strong> dehydration transformation. II. The formation <strong>of</strong> superstructure on <strong>the</strong><br />
dehydration <strong>of</strong> goethite and diaspora. Journal <strong>of</strong> Solid State Chemistry,<br />
vol. 29, 1979. pp. 417–427.<br />
12. GUALTIERI, A.F. and VENTURELLI, P. In-situ study <strong>of</strong> <strong>the</strong> goethite-hematite<br />
phase transformation by real time synchrotron powder diffraction.<br />
American Mineralogist, vol. 84, 1999. pp. 895–904.<br />
13. OZDEMIR, O. and DUNLOP, J.D. Intermediate magnetite formation during<br />
dehydration <strong>of</strong> goethite. Earth and Planetary Science Letters, vol. 177,<br />
2000. pp. 59–67. ◆<br />
882 OCTOBER 2012 VOLUME 112 The Journal <strong>of</strong> The Sou<strong>the</strong>rn African Institute <strong>of</strong> Mining and Metallurgy