Agenda Reports - Port of Oakland
Agenda Reports - Port of Oakland
Agenda Reports - Port of Oakland

Create successful ePaper yourself
Turn your PDF publications into a flip-book with our unique Google optimized e-Paper software.
Blair30<br />
OMAR BENJAMIN<br />
Executive Director<br />
DAVID L. ALEXANDER<br />
<strong>Port</strong> Attorney<br />
ARNEL ATIENZA<br />
<strong>Port</strong> Auditor<br />
JOHN T. BETTERTON<br />
Secretary <strong>of</strong> the Board<br />
ROLL CALL<br />
PORT OF OAKLAND<br />
BOARD OF PORT COMMISSIONERS<br />
530 Water Street <strong>Oakland</strong>, California 94607<br />
Telephone: (510) 627-1100<br />
Facsimile: (510) 451-5914<br />
TDD/TTY – Dial 711<br />
E-Mail: board@portoakland.com<br />
Website: www.port<strong>of</strong>oakland.com<br />
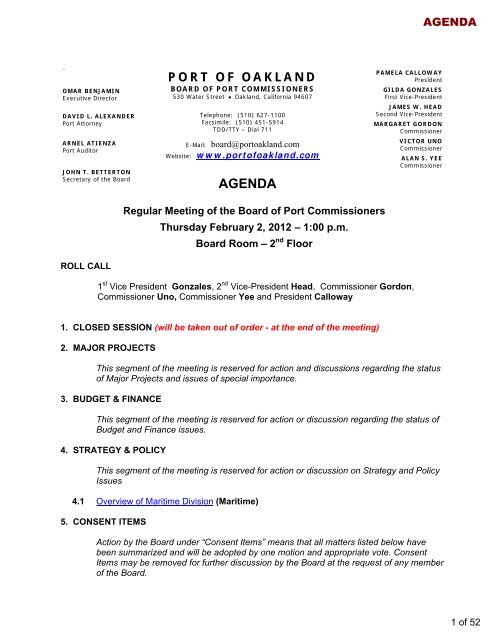
AGENDA<br />
Regular Meeting <strong>of</strong> the Board <strong>of</strong> <strong>Port</strong> Commissioners<br />
Thursday February 2, 2012 – 1:00 p.m.<br />
Board Room – 2 nd Floor<br />
PAMELA CALLOWAY<br />
President<br />
GILDA GONZALES<br />
First Vice-President<br />
JAMES W. HEAD<br />
Second Vice-President<br />
MARGARET GORDON<br />
Commissioner<br />
1 st Vice President Gonzales, 2 nd Vice-President Head, Commissioner Gordon,<br />
Commissioner Uno, Commissioner Yee and President Calloway<br />
1. CLOSED SESSION (will be taken out <strong>of</strong> order - at the end <strong>of</strong> the meeting)<br />
2. MAJOR PROJECTS<br />
VICTOR UNO<br />
Commissioner<br />
ALAN S. YEE<br />
Commissioner<br />
This segment <strong>of</strong> the meeting is reserved for action and discussions regarding the status<br />
<strong>of</strong> Major Projects and issues <strong>of</strong> special importance.<br />
3. BUDGET & FINANCE<br />
This segment <strong>of</strong> the meeting is reserved for action or discussion regarding the status <strong>of</strong><br />
Budget and Finance issues.<br />
4. STRATEGY & POLICY<br />
This segment <strong>of</strong> the meeting is reserved for action or discussion on Strategy and Policy<br />
Issues<br />
4.1 Overview <strong>of</strong> Maritime Division (Maritime)<br />
5. CONSENT ITEMS<br />
Action by the Board under “Consent Items” means that all matters listed below have<br />
been summarized and will be adopted by one motion and appropriate vote. Consent<br />
Items may be removed for further discussion by the Board at the request <strong>of</strong> any member<br />
<strong>of</strong> the Board.<br />
AGENDA<br />
1 <strong>of</strong> 52
6. REMAINING ACTION ITEMS<br />
Remaining Action Items are items not previously addressed in this <strong>Agenda</strong> that may<br />
require staff presentation and/or discussion and information prior to action by the Board.<br />
7. UPDATES/ANNOUNCEMENTS<br />
The President and/ or Executive Director will report on noteworthy events occurring since<br />
the last Board Meeting.<br />
8. SCHEDULING<br />
OPEN FORUM<br />
This segment <strong>of</strong> the meeting is reserved for scheduling items for future <strong>Agenda</strong>s and/or<br />
scheduling Special Meetings<br />
The Board will receive public comment on non-agenda items during this time. Please fill<br />
out a speaker card and present it to the Secretary <strong>of</strong> the Board.<br />
1. CLOSED SESSION (approximately 2:30)<br />
1.1 CONFERENCE WITH REAL PROPERTY NEGOTIATOR - As provided under California<br />
Government Code Section 54956.8:<br />
Property: Former <strong>Oakland</strong> Army Base and Adjacent Properties<br />
Negotiating Parties: <strong>Port</strong> <strong>of</strong> <strong>Oakland</strong>, Prologis and California Capital Group<br />
Agency Negotiator: Director <strong>of</strong> Maritime, James Kwon<br />
Under Negotiation: Price and Terms <strong>of</strong> Payment<br />
Property: Berths 20-26 Outer Harbor Terminal Facilities<br />
Negotiating Parties: <strong>Port</strong> <strong>of</strong> <strong>Oakland</strong> and <strong>Port</strong>s America Outer Harbor Terminals<br />
Agency Negotiator: Director <strong>of</strong> Maritime, James Kwon<br />
Under Negotiation: Price and Terms <strong>of</strong> Payment<br />
Property: Berths 30-33<br />
Negotiating Parties: <strong>Port</strong> <strong>of</strong> <strong>Oakland</strong> and TransPacific Container Service (TraPac)<br />
Agency Negotiator: Director <strong>of</strong> Maritime, James Kwon<br />
Under Negotiation: Price and Terms <strong>of</strong> Payment<br />
Property: Berths 33-37<br />
Negotiating Parties: <strong>Port</strong> <strong>of</strong> <strong>Oakland</strong> and Evergreen Marine Corporation (Taiwan)<br />
Ltd<br />
Agency Negotiator: Director <strong>of</strong> Maritime, James Kwon<br />
Under Negotiation: Price and Terms <strong>of</strong> Payment<br />
Property: Berths 55-56<br />
Negotiating Parties: <strong>Port</strong> <strong>of</strong> <strong>Oakland</strong> and Total Terminals, Inc, LLC (TTI)<br />
2<br />
AGENDA<br />
2 <strong>of</strong> 52
Agency Negotiator: Director <strong>of</strong> Maritime, James Kwon<br />
Under Negotiation: Price and Terms <strong>of</strong> Payment<br />
Property: Berths: 57-59<br />
Negotiating Parties: <strong>Port</strong> <strong>of</strong> <strong>Oakland</strong> and SSA Terminals, LLC (SSAT)<br />
Agency Negotiator: Director <strong>of</strong> Maritime, James Kwon<br />
Under Negotiation: Price and Terms <strong>of</strong> Payment<br />
Property: Berths 60-63<br />
Negotiating Parties: <strong>Port</strong> <strong>of</strong> <strong>Oakland</strong> and Eagle Marine Services (APL Terminal)<br />
Agency Negotiator: Director <strong>of</strong> Maritime, James Kwon<br />
Under Negotiation: Price and Terms <strong>of</strong> Payment<br />
Property: Berths 67-68<br />
Negotiating Parties: <strong>Port</strong> <strong>of</strong> <strong>Oakland</strong> and SSA Terminals, LLC (SSAT) (Howard<br />
Terminal)<br />
Agency Negotiator: Director <strong>of</strong> Maritime, James Kwon<br />
Under Negotiation: Price and Terms <strong>of</strong> Payment<br />
Property: Joint Intermodal Terminals<br />
Negotiating Parties: <strong>Port</strong> <strong>of</strong> <strong>Oakland</strong> and Burlington Northern Santa Fe<br />
Agency Negotiator: Director <strong>of</strong> Maritime, James Kwon<br />
Under Negotiation: Price and Terms <strong>of</strong> Payment<br />
1.2 THREAT TO PUBLIC SERVICES OR FACILITIES<br />
Consultation with: <strong>Port</strong> Security Officer<br />
CLOSED SESSION REPORT<br />
The <strong>Port</strong> Attorney or Board Secretary will report on any final actions taken in Closed<br />
Session.<br />
ADJOURNMENT<br />
The next Regular Meeting <strong>of</strong> the Board will be held on February 16, 2012 at 1:00 p.m. in<br />
the Board Room.<br />
3<br />
AGENDA<br />
3 <strong>of</strong> 52
PUBLIC PARTICIPATION<br />
Disability Related Modifications<br />
Any person who requires a disability-related modification or accommodation, including auxiliary aids or<br />
services, in order to participate in the meeting, may submit a written request, electronic request, or telephone<br />
request [via the California Relay Service (telephone) for the hearing impaired at (800) 735-2922], to the<br />
Secretary <strong>of</strong> the Board no later than five working days prior to the scheduled meeting date.<br />
John Betterton, Secretary <strong>of</strong> the Board<br />
530 Water Street, <strong>Oakland</strong>, CA 94607<br />
jbetterton@portoakland.com<br />
(510) 627-1696<br />
Language & Interpretive Services<br />
As a grantee <strong>of</strong> federal aid grant funds from the US Department <strong>of</strong> Transportation, the <strong>Port</strong> is responsible for<br />
ensuring equal access to its programs, services, and benefits. To request bilingual interpreters or materials in<br />
alternate formats, please contact the Assistant Secretary <strong>of</strong> the Board no later than five working days prior to<br />
the scheduled meeting date.<br />
Daria Edgerly, Assistant Secretary <strong>of</strong> the Board<br />
530 Water Street, <strong>Oakland</strong>, CA 94607<br />
dedgerly@portoakland.com<br />
(510) 627-1337<br />
Scented Products<br />
Please refrain from wearing scented products to this meeting so attendees who experience chemical sensitivities<br />
may attend.<br />
To Speak on an <strong>Agenda</strong> Item<br />
You may speak on any item appearing on the <strong>Agenda</strong>. Please fill out a Speaker’s Card and give it to the Board<br />
Secretary before the start <strong>of</strong> the meeting or immediately after conclusion <strong>of</strong> Closed Session. Cards received<br />
after the start <strong>of</strong> the meeting will be treated as a single request to speak in Open Forum. All speakers will be<br />
allotted a minimum <strong>of</strong> one minute.<br />
<strong>Agenda</strong> & Related Materials<br />
Should you have questions or concerns regarding this <strong>Agenda</strong>, or wish to review any <strong>of</strong> the <strong>Agenda</strong> Related<br />
Materials, please contact the Board Secretary, John Betterton, at (510) 627-1696, or visit our web page at<br />
www.port<strong>of</strong>oakland.com<br />
To receive <strong>Port</strong> <strong>Agenda</strong>s and <strong>Agenda</strong> Related Materials by email, please email your request to<br />
jbetterton@portoakland.com<br />
4<br />
AGENDA<br />
4 <strong>of</strong> 52
MAJOR PROJECTS<br />
MAJOR PROJECTS Tab 2<br />
This segment <strong>of</strong> the meeting is reserved for action and<br />
discussions regarding the status <strong>of</strong> Major Projects and<br />
issues <strong>of</strong> special importance.<br />
5 <strong>of</strong> 52
BUDGET & FINANCE<br />
BUDGET & FINANCE Tab 3<br />
This segment <strong>of</strong> the meeting is reserved for action or<br />
discussion regarding the status <strong>of</strong> Budget and Finance<br />
issues.<br />
6 <strong>of</strong> 52
STRATEGY & POLICY<br />
STRATEGY & POLICY Tab 4<br />
This segment <strong>of</strong> the meeting is reserved for action or<br />
discussion on Strategy and Policy Issues.<br />
7 <strong>of</strong> 52
Maritime Division<br />
STRATEGY & POLICY Tab 4.1<br />
1<br />
8 <strong>of</strong> 52
Today’s Presentation<br />
Division Overview<br />
Structure <strong>of</strong> Organization and Tenants<br />
Revenue and Expenses<br />
Business Overview<br />
Industry and <strong>Port</strong> Performance<br />
Market Dynamics<br />
Customer and Commodity Pr<strong>of</strong>ile<br />
Strategic Initiatives<br />
STRATEGY & POLICY Tab 4.1<br />
2<br />
9 <strong>of</strong> 52
Maritime Division Organization Chart<br />
Total FTE Count = 68<br />
December 2011<br />
Manager, Finance and<br />
Administration<br />
Jean Banker<br />
Executive Assistant<br />
Brenda James<br />
Manager, Marketing<br />
and Business<br />
Development<br />
Lawrence Dunnigan<br />
Maritime Director<br />
James Kwon<br />
Chief Wharfinger<br />
Chris Peterson<br />
STRATEGY & POLICY Tab 4.1<br />
Manager, Harbor<br />
Facilities<br />
Bill Morrison<br />
Staff <strong>of</strong> 5 FTE’s Staff <strong>of</strong> 3 FTE’s<br />
Staff <strong>of</strong> 4 wharfinger<br />
FTE's and 2 security<br />
FTE's<br />
Staff <strong>of</strong> 48 FTE’s<br />
3<br />
10 <strong>of</strong> 52
Maritime Revenue And Expenses<br />
FY 03 – FY14<br />
(in 000's)<br />
$156,000<br />
$143,000<br />
$130,000<br />
$117,000<br />
$104,000<br />
$91,000<br />
$78,000<br />
$65,000<br />
$52,000<br />
$39,000<br />
$26,000<br />
$13,000<br />
$0<br />
Source: <strong>Port</strong> data<br />
FY '03 FY '04 FY '05 FY '06 FY '07 FY '08 FY '09 FY '10 FY '11 FY '12<br />
Bdgt<br />
STRATEGY & POLICY Tab 4.1<br />
FY '13<br />
Proj.<br />
FY '14<br />
Proj.<br />
Revenue<br />
Expense<br />
4<br />
11 <strong>of</strong> 52
Berth 20-26 <strong>Port</strong>s America Terminal<br />
Berth 30-32 TraPac Terminal<br />
Berth 35-38 Ben E. Nutter Terminal<br />
Berth 55-56 Hanjin Terminal<br />
Berth 57-59 <strong>Oakland</strong> Int’l Container Terminal<br />
Berth 60-63 APL Terminal<br />
Berth 67-68 Charles P. Howard Terminal<br />
2018<br />
2024<br />
2013<br />
2016 2017<br />
STRATEGY & POLICY Tab 4.1<br />
12 <strong>of</strong> 52
U.S. Container Volume – at major U.S. container ports<br />
Note: East Coast and Gulf Coast 2011 figures are projected based on January 2011 through November 2011 volume<br />
Source: American Association <strong>of</strong> <strong>Port</strong> Authorities (AAPA)<br />
STRATEGY & POLICY Tab 4.1<br />
6<br />
13 <strong>of</strong> 52
<strong>Oakland</strong> Performance on the West Coast<br />
2005 2006 2007 2008 2009 2010 2011<br />
Source: American Association <strong>of</strong> <strong>Port</strong> Authorities (AAPA)<br />
STRATEGY & POLICY Tab 4.1<br />
14 <strong>of</strong> 52
2011 Container Volumes<br />
SEA/TAC<br />
3.5m TEU<br />
OAK<br />
2.3m TEU<br />
LA/LB<br />
14m TEU<br />
* Figures are projected based on January 2011 through November 2011 volume<br />
Source: <strong>Port</strong> authority websites<br />
HOU<br />
1.9m TEU*<br />
STRATEGY & POLICY Tab 4.1<br />
SAV<br />
2.9m TEU*<br />
CHS<br />
1.4m TEU*<br />
NY/NJ<br />
5.5m TEU*<br />
NOR<br />
1.9m TEU*<br />
8<br />
15 <strong>of</strong> 52
Approx. USWC Intermodal Volume<br />
SEA/TAC<br />
65% IPI*<br />
2.3m TEU<br />
LA/LB<br />
45% IPI*<br />
6.3m TEU<br />
* Estimated<br />
OAK<br />
20% IPI<br />
500k TEU<br />
STRATEGY & POLICY Tab 4.1<br />
9<br />
16 <strong>of</strong> 52
Megaregion Population<br />
8.4 million<br />
14 million 2025 CAGR<br />
16.4m 1.06%<br />
24.3 million<br />
5.7 million<br />
5.5 million<br />
Source: America 2050 / Regional Plan Association<br />
19.7 million<br />
55.5 million<br />
STRATEGY & POLICY Tab 4.1<br />
10<br />
17 <strong>of</strong> 52
Expected Rail Growth through 2035<br />
Source: IHS Global Insight<br />
STRATEGY & POLICY Tab 4.1<br />
18 <strong>of</strong> 52
MARITIME PROMOTIONAL VIDEO<br />
Link: http://youtu.be/y7skbc4HKs0<br />
STRATEGY & POLICY Tab 4.1<br />
19 <strong>of</strong> 52
<strong>Oakland</strong>’s Trading Partners<br />
Source: <strong>Port</strong> data<br />
STRATEGY & POLICY Tab 4.1<br />
20 <strong>of</strong> 52
<strong>Oakland</strong> Imports<br />
USWC Import Market Share<br />
2011 <strong>Port</strong> Cargo Throughput Loaded TEU<br />
Source: <strong>Port</strong> data<br />
STRATEGY & POLICY Tab 4.1<br />
<strong>Oakland</strong><br />
Seattle<br />
Tacoma<br />
Los Angeles<br />
Long Beach<br />
21 <strong>of</strong> 52
Major Imports by Value, 2010<br />
Total value <strong>of</strong> all imports—$21.3 Billion<br />
Commodity $ Millions<br />
1 Machinery 4,505<br />
2 Electrical Equipment 2,312<br />
3 Furniture and Bedding 1,158<br />
4 Beverages 1,098<br />
5 Knit Apparel 965<br />
6 Woven Apparel 873<br />
7 Vehicles 791<br />
8 Toys and Sports Equipment 671<br />
9 Plastic 595<br />
10 C<strong>of</strong>fee 506<br />
Source: Bureau <strong>of</strong> Census, U.S. Department <strong>of</strong> Commerce<br />
STRATEGY & POLICY Tab 4.1<br />
22 <strong>of</strong> 52
High Volume Importers through <strong>Oakland</strong><br />
1 Canon USA/HP (Electronics)<br />
2 Target (General Dept. Store Merchandise)<br />
3 Cost Plus (Home Furnishings)<br />
4 Gap Inc. (Apparel)<br />
5 JC Penney (General Dept. Store Merchandise)<br />
6 Crate & Barrel (Home Furnishings)<br />
7 Dynacraft (Bicycles)<br />
8 Walgreens (General Dept. Store Merchandise)<br />
9 Diablo Valley Packaging (Wine bottles)<br />
10 Southern Wine & Spirits (Beverages)<br />
Source: PIERS<br />
STRATEGY & POLICY Tab 4.1<br />
23 <strong>of</strong> 52
<strong>Oakland</strong> Exports<br />
USWC Export Market Share<br />
2011 <strong>Port</strong> Cargo Throughput Loaded TEU<br />
Source: <strong>Port</strong> data<br />
STRATEGY & POLICY Tab 4.1<br />
<strong>Oakland</strong><br />
Seattle<br />
Tacoma<br />
Los Angeles<br />
Long Beach<br />
24 <strong>of</strong> 52
Major Exports by Value, 2010<br />
Total value <strong>of</strong> all exports—$14.8 Billion<br />
Commodity $ Millions<br />
1 Edible Fruit and Nuts 1,802<br />
2 Meat 1,064<br />
3 Machinery 652<br />
4 Beverages 546<br />
5 Inorganic Chemicals/Rare Earth 521<br />
6 Vehicles 472<br />
7 Cereals 420<br />
8 Electrical Machinery 408<br />
9 Optical/Medical Instruments 363<br />
10 Misc Chemical Products 275<br />
Source: Bureau <strong>of</strong> Census, U.S. Department <strong>of</strong> Commerce<br />
STRATEGY & POLICY Tab 4.1<br />
25 <strong>of</strong> 52
High Volume Exporters through <strong>Oakland</strong><br />
1 American Chung Nam (Wastepaper)<br />
2 Globerunners (Ag products)<br />
3 E & J Gallo<br />
4 C G Roxane (Bottled water)<br />
5 Tyson Fresh Meats<br />
6 Olympic Industries (Lumber)<br />
7 ADM Rice<br />
8 Seaboard Foods (Frozen meat)<br />
9 JC Horizon (Wastepaper)<br />
10 EP Minerals (Diatomaceous earth)<br />
Source: PIERS<br />
STRATEGY & POLICY Tab 4.1<br />
26 <strong>of</strong> 52
Top Ocean Carriers Serving <strong>Oakland</strong><br />
Total 2011 volume<br />
TEU<br />
(thousands) Carrier<br />
Source: <strong>Port</strong> data<br />
% Growth over<br />
same period 2010<br />
180 APL -3%<br />
172 Evergreen -4%<br />
139 MSC 18%<br />
135 Hanjin 10%<br />
129 Yang Ming 16%<br />
101 Hapag-Lloyd 1%<br />
100 Maersk -24%<br />
95 Horizon 15%<br />
91 Matson 5%<br />
79 Mitsui 10%<br />
STRATEGY & POLICY Tab 4.1<br />
27 <strong>of</strong> 52
Major changes in carrier alliances and services<br />
Asia/Europe trade lane…<br />
9/12/2011<br />
Maersk Line (1) announces<br />
daily guaranteed service<br />
between Asia and<br />
Europe<br />
15.9% <strong>of</strong> global fleet<br />
12/1/2011<br />
MSC (2) and CMA CGM (3)<br />
announce operating<br />
partnership<br />
21.6% <strong>of</strong> global fleet<br />
(N) global ranking in terms <strong>of</strong> fleet size<br />
Note: All subsidiaries are consolidated.<br />
Source: AXS-Alphaliner, www.alphaliner.com/top100/index.php<br />
STRATEGY & POLICY Tab 4.1<br />
12/20/2011<br />
New World and Grand Alliances<br />
announce partnership<br />
APL (7) Hapag Lloyd (5)<br />
MOL (10) OOCL (11)<br />
Hyundai (18) NYK (12)<br />
12/27/2011<br />
17.3% <strong>of</strong> global fleet CKYH Alliance and Evergreen (6)<br />
announce partnership<br />
COSCO (4) K Line (16)<br />
Yang Ming (15) Hanjin (9)<br />
15.4% <strong>of</strong> global fleet<br />
21<br />
28 <strong>of</strong> 52
Strategic Initiatives<br />
• Export Promotion Program<br />
• Incentive for new intermodal rail cargo<br />
• Facilities<br />
• Rail improvements<br />
• Transloading<br />
• Shore power<br />
STRATEGY & POLICY Tab 4.1<br />
22<br />
29 <strong>of</strong> 52
Export Promotion Program<br />
Connecting U.S. Exporters to the Global Marketplace….<br />
• Commission study to target export opportunities<br />
• Engage with key trade associations and government agencies<br />
and programs to align export promotion strategies<br />
• Educational events and seminars<br />
• Regional focus events<br />
• Strategic Counsel<br />
STRATEGY & POLICY Tab 4.1<br />
23<br />
30 <strong>of</strong> 52
Uncertainty and Opportunity<br />
STRATEGY & POLICY Tab 4.1<br />
February 2, 2012<br />
Walter Kemmsies, Anne Landstrom<br />
M<strong>of</strong>fatt & Nichol<br />
31 <strong>of</strong> 52
Main Points<br />
• Global rebalancing has begun but the recovery hasn’t<br />
• Excesses such as US and Asian trade imbalances are beginning to<br />
reverse<br />
• US is no longer able to prosper without competitive exports<br />
• US share <strong>of</strong> GDP has declined from 50% in 1980 to 22% in 2011<br />
• Comparative advantage in agriculture, energy and high-end capital<br />
goods<br />
• <strong>Oakland</strong> is an export gateway to fast growing economies<br />
• Growth will depend on proper planning and execution<br />
STRATEGY & POLICY Tab 4.1<br />
32 <strong>of</strong> 52
Why The US Economy Has Been Struggling<br />
Millions <strong>of</strong> People<br />
30<br />
25<br />
20<br />
15<br />
10<br />
5<br />
0<br />
1991<br />
1992<br />
Manufacturing Employment and Goods Trade Deficit<br />
1993<br />
1994<br />
1995<br />
1996<br />
1997<br />
1998<br />
1999<br />
2000<br />
2001<br />
2002<br />
• Outsourced jobs were not replaced by export-oriented industries<br />
• Income-constrained households resorted to borrowing to buy homes, cars and<br />
goods<br />
2003<br />
2004<br />
2005<br />
2006<br />
2007<br />
2008<br />
2009<br />
2010<br />
Recession Manufacturing Employment Goods Trade balance (ex-Oil)<br />
STRATEGY & POLICY Tab 4.1<br />
2011<br />
$0<br />
-$10<br />
-$20<br />
-$30<br />
-$40<br />
-$50<br />
-$60<br />
Billiosn <strong>of</strong> Dollars<br />
33 <strong>of</strong> 52
16%<br />
14%<br />
12%<br />
10%<br />
8%<br />
6%<br />
4%<br />
2%<br />
0%<br />
-2%<br />
-4%<br />
-6%<br />
Emerging Markets Have “Driven” The Global Recovery<br />
2000<br />
Developed Economies Are Struggling… … Emerging Markets Are Leading<br />
2001<br />
2002<br />
2003<br />
2004<br />
2005<br />
2006<br />
2007<br />
2008<br />
2009<br />
2010<br />
2011<br />
2012<br />
World<br />
Canada<br />
US<br />
Japan<br />
Eurozone<br />
• Emerging markets have helped the global economy recover<br />
16%<br />
14%<br />
12%<br />
10%<br />
8%<br />
6%<br />
4%<br />
2%<br />
0%<br />
-2%<br />
-4%<br />
-6%<br />
2000<br />
2001<br />
2002<br />
2003<br />
2004<br />
2005<br />
STRATEGY & POLICY Tab 4.1<br />
2006<br />
2007<br />
2008<br />
2009<br />
2010<br />
2011<br />
2012<br />
China<br />
India<br />
Brazil<br />
World<br />
34 <strong>of</strong> 52
60<br />
50<br />
40<br />
30<br />
20<br />
10<br />
0<br />
Growth Has Not Been Driven By Consumers<br />
%<br />
1990<br />
1992<br />
1994<br />
Investment Spending Share <strong>of</strong> GDP<br />
1996<br />
1998<br />
2000<br />
2002<br />
2004<br />
2006<br />
2008<br />
2010<br />
2012<br />
2014<br />
2016<br />
STRATEGY & POLICY Tab 4.1<br />
China<br />
India<br />
Mexico<br />
Saudi Arabia<br />
World<br />
Japan<br />
Brazil<br />
United States<br />
Germany<br />
35 <strong>of</strong> 52
World Economy StrainsTo Recover Without The US<br />
7%<br />
6%<br />
5%<br />
4%<br />
3%<br />
2%<br />
1%<br />
0%<br />
-1%<br />
-2%<br />
-3%<br />
1981<br />
US Consumer Spending and Global Real GDP Growth<br />
1983<br />
1985<br />
• The US accounts for 22% <strong>of</strong> World GDP<br />
1987<br />
1989<br />
1991<br />
1993<br />
1995<br />
US Consumer<br />
World GDP<br />
• US consumers account for 70% <strong>of</strong> US GDP, or 15% <strong>of</strong> World GDP<br />
1997<br />
1999<br />
2001<br />
2003<br />
2005<br />
2007<br />
2009<br />
STRATEGY & POLICY Tab 4.1<br />
2011<br />
2013<br />
2015<br />
36 <strong>of</strong> 52
150%<br />
140%<br />
130%<br />
120%<br />
110%<br />
100%<br />
90%<br />
80%<br />
70%<br />
60%<br />
50%<br />
40%<br />
30%<br />
20%<br />
10%<br />
0%<br />
-10%<br />
US Consumers Are Deleveraging<br />
Consumer Debt-To-Income Ratio and Debt Growth Rate<br />
1953<br />
1956<br />
1959<br />
1962<br />
1965<br />
1968<br />
1971<br />
1974<br />
1977<br />
1980<br />
1983<br />
1986<br />
1989<br />
1992<br />
1995<br />
1998<br />
2001<br />
2004<br />
Recession Growth <strong>of</strong> Debt Debt-to-Income<br />
STRATEGY & POLICY Tab 4.1<br />
2007<br />
2010<br />
2013<br />
2016<br />
• It will take some time for the debt-to-income ratio to become sustainable<br />
37 <strong>of</strong> 52
160<br />
140<br />
120<br />
100<br />
80<br />
60<br />
40<br />
20<br />
0<br />
1970<br />
1972<br />
18 Mos<br />
1974<br />
1976<br />
15 Mos<br />
1978<br />
Employment Recovery Trends<br />
Non-farm Employment Since 1970<br />
1980<br />
26 Mos<br />
10 Mos<br />
1982<br />
1984<br />
1986<br />
1988<br />
1990<br />
30 Mos<br />
46 Mos<br />
95 Mos?<br />
• Since 1980 recovery in employment to pre-recession levels has lengthened<br />
1992<br />
1994<br />
1996<br />
1998<br />
2000<br />
2002<br />
Recession Employment (millions)<br />
2004<br />
2006<br />
STRATEGY & POLICY Tab 4.1<br />
2008<br />
2010<br />
2012<br />
2014<br />
2016<br />
38 <strong>of</strong> 52
60%<br />
50%<br />
40%<br />
30%<br />
20%<br />
10%<br />
0%<br />
The World’s Population Is Aging<br />
Proportion <strong>of</strong> Population Above 55 Years <strong>of</strong> Age<br />
1990 2000 2010 2020 2030 2040 2050<br />
• These trends underlie major global and US trends<br />
STRATEGY & POLICY Tab 4.1<br />
Japan<br />
Europe<br />
China<br />
Canada<br />
US<br />
Brazil<br />
Mexico<br />
India<br />
39 <strong>of</strong> 52
$20<br />
$0<br />
-$20<br />
-$40<br />
-$60<br />
-$80<br />
1992<br />
Billions<br />
1993<br />
1994<br />
1995<br />
1996<br />
1997<br />
1998<br />
1999<br />
2000<br />
2001<br />
Unsustainable Trade Deficit<br />
US Trade Balance Components: 1992 -2010<br />
2002<br />
2003<br />
2004<br />
2005<br />
2006<br />
2007<br />
Goods Balance Services Balance Oil Balance<br />
2008<br />
2009<br />
STRATEGY & POLICY Tab 4.1<br />
2010<br />
2011<br />
2012<br />
45% <strong>of</strong> the<br />
trade<br />
deficit is<br />
due to<br />
petroleum<br />
imports<br />
• Including oil, the goods deficit is 4.8x the services surplus, 2.8x excluding oil<br />
• Increased import dependency is unavoidable – the US needs to export more<br />
40 <strong>of</strong> 52
US Export Candidates<br />
• Bulk commodities and specialized capital goods (project cargo) fit the<br />
pr<strong>of</strong>ile <strong>of</strong> US comparative advantages<br />
• Relative to faster growing Emerging Markets, the US has<br />
• A lower cost <strong>of</strong> capital, but a higher cost <strong>of</strong> labor<br />
• Relative abundance <strong>of</strong> scare resources such as water<br />
• More advanced biotechnology<br />
• More reliable quality control and surveillance <strong>of</strong> compliance<br />
STRATEGY & POLICY Tab 4.1<br />
• Strong Emerging Market demand for bulk is expected to continue as these<br />
economies continue to grow and migrate from rural areas to industrializing<br />
urban areas<br />
• Grains and oilseeds<br />
• Meat<br />
• Bi<strong>of</strong>uels – wood pellets<br />
• Gas and Coal<br />
• Strong bulk demand also means strong demand for capital equipment –<br />
energy, construction, agricultural<br />
• US has to develop infrastructure to compete in the global market place<br />
41 <strong>of</strong> 52
Soy Yield trends In Large Producer Economies<br />
35,000<br />
30,000<br />
25,000<br />
20,000<br />
15,000<br />
10,000<br />
5,000<br />
0<br />
Soy Hectogram Yields Per Hectare<br />
1982<br />
1983<br />
1984<br />
1985<br />
1986<br />
1987<br />
1988<br />
1989<br />
1990<br />
1991<br />
1992<br />
1993<br />
1994<br />
1995<br />
1996<br />
1997<br />
1998<br />
1999<br />
2000<br />
2001<br />
2002<br />
2003<br />
2004<br />
2005<br />
2006<br />
2007<br />
2008<br />
2009<br />
• US has the highest rate <strong>of</strong> agricultural productivity in the world<br />
USA<br />
Brazil<br />
Argentina<br />
Canada<br />
World<br />
China<br />
Indonesia<br />
• Nations with fastest growing consumption have lowest productivity<br />
STRATEGY & POLICY Tab 4.1<br />
India<br />
42 <strong>of</strong> 52
<strong>Oakland</strong>’s Share <strong>of</strong> Food Product Exports<br />
(Including Meats, Fresh & Frozen)<br />
• <strong>Oakland</strong> share <strong>of</strong><br />
Nevada, Utah, Colorado<br />
and Idaho meat product<br />
exports is significant<br />
• Good opportunities exist<br />
for increased market<br />
share in key meat<br />
producing states <strong>of</strong><br />
Nebraska, Iowa and<br />
Kansas<br />
• Export flows are<br />
consistent with rail and<br />
road transportation<br />
coverage<br />
STRATEGY & POLICY Tab 4.1<br />
43 <strong>of</strong> 52
Food Manufacturing Production Areas by County<br />
• California’s central<br />
valley is key<br />
producer <strong>of</strong> high<br />
value, specialty crops<br />
which are ideal for<br />
export<br />
• Part <strong>of</strong> the process<br />
we are going through<br />
involves identifying<br />
<strong>Oakland</strong>’s immediate<br />
hinterland as well as<br />
their opportunity<br />
areas<br />
STRATEGY & POLICY Tab 4.1<br />
44 <strong>of</strong> 52
STRATEGY & POLICY Tab 4.1<br />
<strong>Oakland</strong>’s Share <strong>of</strong> Certain Food and Beverage Export<br />
Commodities is Very High (Tree Nuts, Wine)- Opportunities<br />
to Increase in Other Commodities (Citrus, Soybeans)<br />
CALIFORNIA COLORADO IDAHO NEVADA UTAH WYOMING At <strong>Oakland</strong> Tonnage<br />
Export Food and Beverages 38% 39% 7% 64% 80% 39% 1,249,483<br />
WINES 96% 98% 97% 11% 100% 0% 532,463<br />
BERRIES (EXCEPT STRAWBERRIES) 67% 46% 6% 100% 95% 0% 1,138<br />
CITRUS FRUITS (EXCEPT ORANGES) 29% 43% 5% 71% 51% 0% 12,230<br />
CORN 12% 49% 46% 0% 41% 0% 13,687<br />
COTTON 11% 12% 6% 9% 41% 0% 62,263<br />
DRY PEAS AND BEANS 27% 19% 0% 16% 49% 0% 12,075<br />
GRAPES 33% 64% 24% 87% 91% 0% 21,344<br />
HAY, ALFALFA HAY, AND CLOVER 6% 28% 15% 100% 85% 0% 57,623<br />
NURSERY PRODUCTS AND TREES 68% 44% 1% 79% 65% 0% 1,631<br />
OILSEEDS (EXCEPT SOYBEAN) 50% 40% 2% 70% 83% 0% 9,003<br />
ORANGES 50% 82% 45% 100% 96% 0% 91,276<br />
OTHER GRAINS 35% 88% 47% 0% 93% 0% 1,392<br />
OTHER MISCELLANEOUS AGRICULTURAL PROCUCTS 20% 6% 0% 26% 86% 12% 8,131<br />
OTHER NONCITRUS FRUITS 66% 74% 4% 64% 92% 1% 70,378<br />
OTHER VEGETABLES (EXCEPT POTATOES) AND<br />
MELONS 68% 78% 5% 84% 93% 0% 77,818<br />
SOYBEANS 20% 33% 7% 66% 53% 0% 103,355<br />
STRAWBERRIES 100% 99% 86% 100% 99% 0% 1,707<br />
TREE NUTS 87% 88% 23% 76% 97% 77% 701,555<br />
45 <strong>of</strong> 52
STRATEGY & POLICY Tab 4.1<br />
There are more Opportunities to Increase <strong>Oakland</strong><br />
Imports and More Leakage to Southern California<br />
At <strong>Oakland</strong><br />
Tonnage<br />
WINES CALIFORNIA COLORADO IDAHO NEVADA UTAH WYOMING 208,100<br />
OTHER COMPUTER EQUIPMENT 13% 23% 3% 39% 49% 0% 13,741<br />
OTHER ELECTRONIC COMPONENTS 10% 17% 2% 31% 40% 0% 11,727<br />
OTHER MEASURING AND CONTROLLING DEVICES 27% 46% 72% 37% 75% 0% 10,556<br />
SEMICONDUCTORS AND RELATED DEVICES 39% 62% 28% 71% 79% 0% 14,647<br />
DRIED AND DEHYDRATED FOODS 50% 90% 0% 82% 100% 6% 83,459<br />
FROZEN FRUITS, JUICES AND VEGETABLES 24% 2% 14% 4% 31% 34% 29,482<br />
FRUITS AND VEGETABLES PRESERVED 19% 2% 11% 4% 21% 65% 118,635<br />
MEAT PRODUCTS (EXCEPT POULTRY) 19% 5% 27% 15% 43% 0% 52,049<br />
MILLED RICE AND BY-PRODUCTS 30% 50% 0% 5% 77% 0% 59,326<br />
OTHER HOUSEHOLD TEXTILE PRODUCTS 17% 47% 12% 51% 62% 20% 147,431<br />
MOTOR VEHICLE PARTS, NESOI 4% 14% 6% 16% 15% 4% 109,432<br />
MOTORCYCLES, BICYCLES, AND PARTS 39% 66% 42% 52% 67% 0% 72,954<br />
46 <strong>of</strong> 52
Main Points<br />
• Global rebalancing has begun but the recovery hasn’t<br />
• Excesses such as US and Asian trade imbalances are beginning to<br />
reverse<br />
• US is no longer able to prosper without competitive exports<br />
• US share <strong>of</strong> GDP has declined from 50% in 1980 to 22% in 2011<br />
• Comparative advantage in agriculture, energy and high-end capital<br />
goods<br />
• <strong>Oakland</strong> is an export gateway to fast growing economies<br />
• Growth will depend on proper planning and execution<br />
STRATEGY & POLICY Tab 4.1<br />
47 <strong>of</strong> 52
STRATEGY & POLICY Tab 4.1<br />
Summary<br />
• <strong>Oakland</strong> has significant opportunities to increase exports<br />
provided there are enough imports to provide empty<br />
equipment<br />
• Exports from the Midwest are a key target area and planned<br />
infrastructure development adjacent to the port on the<br />
<strong>Oakland</strong> Army Base could play a big part in attracting some <strong>of</strong><br />
these commodities<br />
• As we go through the next steps <strong>of</strong> the project, additional<br />
opportunities will surface and that will help in moving towards<br />
the next phase <strong>of</strong> building the strategic plan<br />
48 <strong>of</strong> 52
CONSENT ITEMS<br />
CONSENT ITEMS Tab 5<br />
Action by the Board under “Consent Items” means that all<br />
matters listed below have been summarized, and are<br />
considered to be perfunctory in nature, and will be adopted<br />
by one motion and appropriate vote. Consent Items may be<br />
removed for further discussion by the Board at the request <strong>of</strong><br />
any member <strong>of</strong> the Board.<br />
49 <strong>of</strong> 52
REMAINING ACTION ITEMS<br />
REMAINING ACTION ITEMS Tab 6<br />
Remaining Action Items are items not previously addressed<br />
in this <strong>Agenda</strong> that may require staff presentation and/or<br />
discussion and information prior to action by the Board.<br />
50 <strong>of</strong> 52
UPDATES & ANNOUNCEMENTS Tab 7<br />
UPDATES & ANNOUNCEMENTS<br />
The President and / or Executive Director will report on<br />
noteworthy events occurring since the last Board Meeting.<br />
51 <strong>of</strong> 52
SCHEDULING<br />
SCHEDULING Tab 8<br />
This segment <strong>of</strong> the meeting is reserved for scheduling<br />
items for future <strong>Agenda</strong>s and/or scheduling Special<br />
Meetings.<br />
52 <strong>of</strong> 52