The amount of sales of industrial products grew 9.3% in 2006 ...
The amount of sales of industrial products grew 9.3% in 2006 ...
The amount of sales of industrial products grew 9.3% in 2006 ...

You also want an ePaper? Increase the reach of your titles
YUMPU automatically turns print PDFs into web optimized ePapers that Google loves.
Annual Industrial Products Survey. Year <strong>2006</strong><br />
26 June 2007<br />
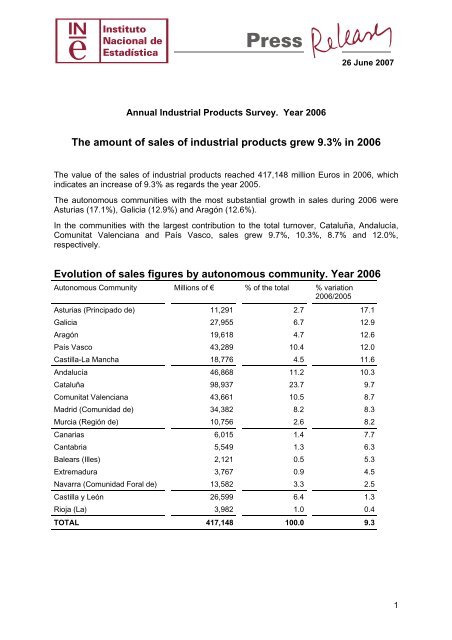
<strong>The</strong> <strong>amount</strong> <strong>of</strong> <strong>sales</strong> <strong>of</strong> <strong><strong>in</strong>dustrial</strong> <strong>products</strong> <strong>grew</strong> <strong>9.3%</strong> <strong>in</strong> <strong>2006</strong><br />
<strong>The</strong> value <strong>of</strong> the <strong>sales</strong> <strong>of</strong> <strong><strong>in</strong>dustrial</strong> <strong>products</strong> reached 417,148 million Euros <strong>in</strong> <strong>2006</strong>, which<br />
<strong>in</strong>dicates an <strong>in</strong>crease <strong>of</strong> <strong>9.3%</strong> as regards the year 2005.<br />
<strong>The</strong> autonomous communities with the most substantial growth <strong>in</strong> <strong>sales</strong> dur<strong>in</strong>g <strong>2006</strong> were<br />
Asturias (17.1%), Galicia (12.9%) and Aragón (12.6%).<br />
In the communities with the largest contribution to the total turnover, Cataluña, Andalucía,<br />
Comunitat Valenciana and País Vasco, <strong>sales</strong> <strong>grew</strong> 9.7%, 10.3%, 8.7% and 12.0%,<br />
respectively.<br />
Evolution <strong>of</strong> <strong>sales</strong> figures by autonomous community. Year <strong>2006</strong><br />
Autonomous Community Millions <strong>of</strong> € % <strong>of</strong> the total % variation<br />
<strong>2006</strong>/2005<br />
Asturias (Pr<strong>in</strong>cipado de) 11,291 2.7 17.1<br />
Galicia 27,955 6.7 12.9<br />
Aragón 19,618 4.7 12.6<br />
País Vasco 43,289 10.4 12.0<br />
Castilla-La Mancha 18,776 4.5 11.6<br />
Andalucía 46,868 11.2 10.3<br />
Cataluña 98,937 23.7 9.7<br />
Comunitat Valenciana 43,661 10.5 8.7<br />
Madrid (Comunidad de) 34,382 8.2 8.3<br />
Murcia (Región de) 10,756 2.6 8.2<br />
Canarias 6,015 1.4 7.7<br />
Cantabria 5,549 1.3 6.3<br />
Balears (Illes) 2,121 0.5 5.3<br />
Extremadura 3,767 0.9 4.5<br />
Navarra (Comunidad Foral de) 13,582 3.3 2.5<br />
Castilla y León 26,599 6.4 1.3<br />
Rioja (La) 3,982 1.0 0.4<br />
TOTAL 417,148 100.0 9.3<br />
1
Sales figures by sector<br />
<strong>The</strong> sector <strong>of</strong> Manufacture, first transformation and cast<strong>in</strong>g <strong>of</strong> metals registered the largest<br />
growth (24.4%), followed by Electrical and electronic material (18.3%) and Metallic <strong>products</strong><br />
(13.6%).<br />
In contrast, the sectors <strong>of</strong> Electrical energy, gas and steam, Textile and cloth<strong>in</strong>g and Leather<br />
and footwear registered negative growth <strong>in</strong> their <strong>sales</strong> figures.<br />
Evolution <strong>of</strong> <strong>sales</strong> figures by sector. Year <strong>2006</strong><br />
NCEA-93<br />
code<br />
Sector Millions <strong>of</strong> € % <strong>of</strong> the total % variation<br />
<strong>2006</strong>/2005<br />
27 Manufacture, first transformation<br />
and cast<strong>in</strong>g <strong>of</strong> metals 30,672<br />
7.4<br />
24.4<br />
31-32 Electrical and electronic material 19,402 4.7 18.3<br />
28 Metallic <strong>products</strong> 32,032 7.7 13.6<br />
26 Non-metallic m<strong>in</strong>eral <strong>products</strong> 27,267 6.5 13.3<br />
23-24 Manufacture <strong>of</strong> coke oven <strong>products</strong>,<br />
petroleum and chemical ref<strong>in</strong>ement 62,788<br />
15.1<br />
12.5<br />
20 Wood and cork 7,126 1.7 8.8<br />
29-30-33 Optical mach<strong>in</strong>ery and equipment<br />
and similar 28,928<br />
6.9<br />
8.7<br />
25 Manufacture <strong>of</strong> rubber and plastic<br />
<strong>products</strong><br />
16,583 4.0 8.0<br />
36 Other manufactur<strong>in</strong>g <strong>in</strong>dustries 11,779 2.8 6.6<br />
34-35 Transport equipment 56,235 13.5 6.0<br />
21-22 Paper, graphic arts and publish<strong>in</strong>g 21,922 5.3 5.6<br />
15-16 Food, beverages and tobacco 71,147 17.1 5.0<br />
40 Electrical energy, gas and steam 16,919 4.1 -0.4<br />
17-18 Textile and cloth<strong>in</strong>g 11,268 2.7 -0.9<br />
19 Leather and footwear 3,080 0.7 -1.7<br />
TOTAL 417,148 100.0 9.3<br />
2
Sales figures by manufactured <strong>products</strong><br />
Among the manufactured <strong>products</strong> with the highest <strong>sales</strong> figures were diesel vehicles (with<br />
more than 13,153 million Euros) and petrol vehicles with more than 1000 cc 3 (with more than<br />
9,333 million Euros), <strong>in</strong> both cases for the transport <strong>of</strong> fewer than 10 persons.<br />
Sales figures by manufactured <strong>products</strong>. Year <strong>2006</strong><br />
Description Unit Quantity Value<br />
(million<br />
Euros)<br />
Diesel vehicles for the transport <strong>of</strong> fewer than<br />
10 persons<br />
Units 1,111,729<br />
13,154<br />
% variation<br />
<strong>of</strong> value<br />
<strong>2006</strong>/2005<br />
Petrol vehicles for the transport <strong>of</strong> fewer than 10<br />
persons and with more than 1000 cc 3<br />
Units 1,108,147 9,333<br />
-6.5<br />
Non-refractory concrete and mortars Tonnes 224,543,285 6,339 17.9<br />
Non-alcoholic beverages (except fruit or<br />
vegetable juices)<br />
Thousand<br />
litres<br />
5,867,243<br />
Portland Cement Tonnes 50,784,249 3,860 20.0<br />
Malt beer (except with alcohol content