ij - Fapesp
ij - Fapesp
ij - Fapesp
You also want an ePaper? Increase the reach of your titles
YUMPU automatically turns print PDFs into web optimized ePapers that Google loves.
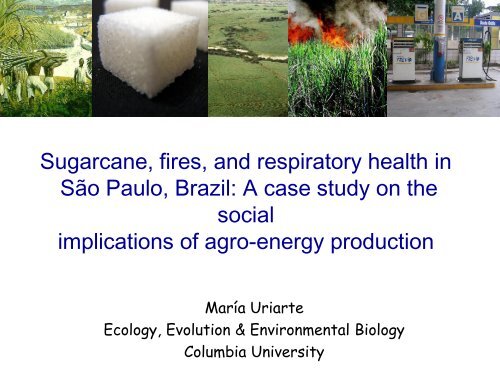
Sugarcane, fires, and respiratory health in<br />
São Paulo, Brazil: A case study on the<br />
social<br />
implications of agro-energy production<br />
María Uriarte<br />
Ecology, Evolution & Environmental Biology<br />
Columbia University
1000 55000<br />
800 50000<br />
600 45000<br />
400 40000<br />
200 35000<br />
30000<br />
USD Hectograms<br />
(inf. adj.) per Hectare<br />
Figure 2: Global Trends over Time in Yield, Cultivated Area, and Prices for Ten<br />
Major Crops<br />
1970 1975 1980 1985 1990 1995 2000 2005<br />
Year<br />
Yield Cultivated Area Prices<br />
750000<br />
690000<br />
640000<br />
590000<br />
540000<br />
Hectares<br />
(thousands)<br />
Rudel et al. In review
Figure 3: The Geographic Distribution of Land Sparing Nations<br />
Rudel et al. In review
VARIABLE COEFFICIENT<br />
Intercept .151 (.025) ***<br />
Annual urban growth rate 2000-05 .125 (.036) **<br />
Total annual growth rate (2000-05) -.065 (.035) #<br />
% of agric. produc exported (2001-03) .111 (.027) ***<br />
R 2 .40<br />
Adjusted R 2 .35***<br />
***p
Raw sugarpaste ($/ton).<br />
700<br />
600<br />
500<br />
400<br />
300<br />
200<br />
100<br />
0<br />
Yom Kippur war<br />
Oil Embargo Iran-Iraq war<br />
Gulf war<br />
Sugarcane<br />
1960 1965 1970 1975 1980 1985 1990 1995 2000 2005<br />
Oil<br />
9/11<br />
$50<br />
$45<br />
$40<br />
$35<br />
$30<br />
$25<br />
$20<br />
$15<br />
$10<br />
$5<br />
$0<br />
$/barrel
Social and environmental effects of<br />
sugarcane production in São Paulo<br />
1. Air pollution and respiratory morbidity (Arbex et al.<br />
2000, Lara et al. 2005, Martinelli et al. 2002,<br />
Cançado et al. 2006, Almeida 2006).<br />
2. Degradation of aquatic ecosystems (Martinelli et<br />
al. 2002).<br />
3. Exploitation of cane-cutters (Rodrigues 2006,<br />
Alves 2006).<br />
4. Increased vulnerability to weather and market<br />
fluctuations?
Sugarcane, fires & respiratory health<br />
1. What are the spatial links between<br />
sugarcane cultivation, occurrence of<br />
fires, and respiratory health at the state<br />
scale?<br />
2. How can we ameliorate the effects of<br />
recent expansion in cane cultivation on<br />
respiratory health?
Sugarcane production by state (2005)<br />
Pernambuco<br />
Alagoas<br />
Minas<br />
Others<br />
Parana<br />
Sao Paulo
1990 2006<br />
Area in sugarcane<br />
São Paulo
Planted area (ha)<br />
400,000<br />
350,000<br />
300,000<br />
250,000<br />
200,000<br />
150,000<br />
100,000<br />
50,000<br />
0<br />
1990<br />
1991<br />
1992<br />
1993<br />
1994<br />
1995<br />
1996<br />
1997<br />
1998<br />
1999<br />
2000<br />
2001<br />
2002<br />
Planted Area (ha)<br />
Cotton<br />
Rice<br />
Beans<br />
Wheat<br />
6,000,000<br />
5,000,000<br />
4,000,000<br />
3,000,000<br />
2,000,000<br />
1,000,000<br />
2003<br />
2004<br />
2005<br />
2006<br />
0<br />
1990<br />
1991<br />
Sugarcane<br />
Corn<br />
Soy<br />
Total<br />
1992<br />
1993<br />
Expansion of sugarcane in<br />
the state of Sao Paulo<br />
1994<br />
1995<br />
1996<br />
1997<br />
1998<br />
1999<br />
2000<br />
2001<br />
2002<br />
2003<br />
2004<br />
2005<br />
2006
Percent (sugarcane)<br />
Value of sugarcane production in SP<br />
80<br />
70<br />
60<br />
50<br />
40<br />
30<br />
20<br />
10<br />
0<br />
1990<br />
1991<br />
1992<br />
1993<br />
1994<br />
1995<br />
1996<br />
1997<br />
1998<br />
1999<br />
2000<br />
2001<br />
2002<br />
2003<br />
2004<br />
2005<br />
2006<br />
25<br />
20<br />
15<br />
10<br />
5<br />
0<br />
Percent (others)<br />
Sugarcane<br />
Corn<br />
Soy
Standardized monthly salaries (R$2001)<br />
800<br />
600<br />
400<br />
200<br />
2002<br />
MONTHLY<br />
WORKER<br />
ADMINISTRATOR<br />
2003<br />
2004<br />
2005<br />
2006<br />
2007<br />
2002<br />
2003<br />
2004<br />
TRACTOR<br />
DRIVER<br />
CREW LEADER<br />
2005<br />
2006<br />
2007<br />
2002<br />
MIGRANT<br />
WORKER<br />
JOURNEYMAN<br />
2003<br />
2004<br />
2005<br />
2006<br />
2007<br />
800<br />
600<br />
400<br />
200
R 2 = 0.42<br />
Data: INPE (NOAA-12)
Legal objectives to eliminate pre-harvest<br />
burning in Sao Paulo
April December
6000<br />
5000<br />
4000<br />
3000<br />
2000<br />
1000<br />
0<br />
Fires/month (1999-2005)<br />
Sugarcane burning season<br />
JAN FEB MAR APRIL MAY JUNE JULY AUG SEPT OCT NOV DEC<br />
Data: INPE, NOAA-12
Where there’s fire….<br />
Smoke PM 2.5<br />
TSP SO2 SO2 Data: CETESB, Brasil
14000<br />
12000<br />
10000<br />
8000<br />
6000<br />
4000<br />
2000<br />
0<br />
Respiratory disease counts<br />
Sugarcane burning season<br />
JAN FEB MAR APRIL MAY JUNE JULY AUG SEPT OCT NOV DEC<br />
Data: DATASUS, Brasilia
Mean Temperature (deg C)<br />
35<br />
30<br />
25<br />
20<br />
15<br />
10<br />
5<br />
0<br />
J F M A M J J A S O N D<br />
500<br />
400<br />
300<br />
200<br />
100<br />
0<br />
-100<br />
Total precipitation (mm)<br />
MaxTemp<br />
MinTemp<br />
Precip<br />
Data: CIIAGRO, SP, Brasil
w <strong>ij</strong><br />
p<br />
Statistical Model: Respiratory<br />
~<br />
w s<br />
logit<br />
Binomial (s<br />
<strong>ij</strong><br />
s<br />
M<br />
12<br />
i 1 i<br />
<strong>ij</strong><br />
p<br />
1<br />
)<br />
Binomial<br />
X<br />
<strong>ij</strong><br />
disease<br />
w<br />
<strong>ij</strong><br />
|<br />
s<br />
<strong>ij</strong><br />
X<br />
<strong>ij</strong><br />
Fires/<br />
ha<br />
PPT<br />
MaxTemp<br />
% Rural<br />
Sugarcanein<br />
1995<br />
Muni ( Random)
(A)CHILDREN (|z|)<br />
Intercept -8.97 0.05 -185.6 < 2e-16<br />
Fires/km 2 0.19 0.03 7.65 2.0e-14<br />
Max. Temp -0.02 0.03 -0.69 0.49<br />
Precipitation (PPT) -0.07 0.02 -3.03 0.0025<br />
Per. Rural -0.72 0.11 -5.80 6.6e-09<br />
PPT x Max Temp -0.56 0.05 -10.49 < 2e-16<br />
Max. Temp x PPT x Fires/km 2 -0.83 0.14 -5.86 4.7e-09<br />
Sugarcane in 1995 (km 2 ) 0.23 0.08 2.76 0.0057<br />
(B) ELDERLY (>60 YEARS OF AGE<br />
Parameter Estimate Std. Err. z value Pr(>|z|)<br />
Intercept -10.15 0.07 -131.6 < 2e-16<br />
Fires/km 2 0.29 0.05 5.4 6.2e-08<br />
Max. Temp -0.19 0.06 -3.1 0.0017<br />
Precipitation -0.31 0.05 -6.6 4.7e-11<br />
Per. Rural -0.88 0.18 -5.0 5.4e-07<br />
PPT x Max Temp -1.09 0.11 -9.5 < 2e-16<br />
Max. Temp x PPT x Fires/km 2 -0.99 0.32 -3.1 0.0020
ELDERLY PREDICTED /YR<br />
CASES/1,000 INDIVIDUALS<br />
ELDERLY OBSERVED<br />
CHILDREN PREDICTED CHILDREN OBSERVED
Cases per 1,000 individuals/yr<br />
associated with sugarcane burning<br />
ELDERLY<br />
CURRENT FIRE<br />
CHILDREN<br />
CURRENT FIRE<br />
CHILDREN<br />
CHRONIC FIRE
Current:<br />
12%<br />
Current & chronic:<br />
38%<br />
(State 5.4%)<br />
Current:<br />
16%<br />
(State 1.8%)
w <strong>ij</strong><br />
p<br />
Statistical Model: Lung cancer<br />
deaths and hospital admissions<br />
~<br />
w s<br />
logit<br />
Binomial (s<br />
<strong>ij</strong><br />
s<br />
M<br />
12<br />
i 1 i<br />
<strong>ij</strong><br />
p<br />
1<br />
)<br />
Binomial<br />
X<br />
<strong>ij</strong><br />
w<br />
<strong>ij</strong><br />
|<br />
s<br />
X<br />
<strong>ij</strong><br />
<strong>ij</strong><br />
% sugarcanein1993<br />
% Urban<br />
Muni ( Random)
Respiratory cancer deaths and admissions<br />
(1996-2007)<br />
NUMBER OF DEATHS > 40 YRS OLD/10,000 IND./YR<br />
Parameter Estimate Std. Error z value Pr(>|z|)<br />
Intercept -9.9645 0.0787 -126.7 < 2e-16 ***<br />
% sugar 1993 0.2419 0.0641 3.8 0.00016 ***<br />
% urban 2000 0.3069 0.0817 3.8 0.00017 ***<br />
NUMBER OF ADMISSIONS > 40 YRS OLD/10,000 IND./YR<br />
Parameter Estimate Std. Error z value Pr(>|z|)<br />
Intercept -8.1909 0.0991 -82.7 < 2e-16 ***<br />
% sugar 1993 0.1880 0.0489 3.8 0.00012 ***<br />
% urban 2000 0.3338 0.0552 6.0 1.5e-09 ***
% land surface in sugarcane (1993)<br />
Number of deaths per 10,0000/yr<br />
from respiratory cancer<br />
(1997-2007)<br />
% population urban (2000)
Number of deaths > 40 yrs old/yr from<br />
respiratory cancer<br />
per 10,0000 indiv<br />
associated with sugarcane burning<br />
(1997-2007)<br />
35 deaths/yr<br />
153 admissions/yr<br />
Number of deaths > 40 yrs old/yr from<br />
respiratory cancer<br />
per 10,0000 indiv<br />
associated with urban centers<br />
(1997-2007)<br />
448 deaths/yr<br />
2389 admissions/yr
Socio-environmental effects of sugarcane<br />
production<br />
1. What are the spatial links between<br />
sugarcane cultivation, occurrence of<br />
fires, and respiratory health?<br />
2. How can we ameliorate the effects of<br />
sugarcane cultivation on respiratory<br />
health?<br />
• Identify most vulnerable areas<br />
• Identity non-suitable areas
INCREASE IN SUGAR 2003-2007 (KM 2 ) PREDICTED % INCREASE IN FIRES/KM 2<br />
PRED. % INCREASE IN ELDERLY ATTRIB. TO FIRE<br />
PRED. % INCREASE YOUNG CASES ATTRIB. FIRE
Effect of increase in sugarcane from 2003-2007<br />
550 more fires<br />
140-180 more<br />
elderly cases<br />
200-250 more<br />
children cases
Identify areas non-suitable for cultivation<br />
• Identify areas that are not mechanizable (fields<br />
are >12% slope or < 150 ha).<br />
• Exclude areas within 50-500 meter buffer of<br />
rivers & streams.
Hectares of sugarcane to abandon<br />
0 - 700<br />
700.1 - 1,800<br />
1,800.1 - 3,500<br />
3,500.1 - 7,000<br />
7,000.1 - 16,500<br />
0 37.5 75 150 225<br />
Kilometers<br />
300
Summary<br />
• Link between sugarcane, fire, and<br />
respiratory health of children & elderly.<br />
• Identified municipalities that have the<br />
highest incidence of cases attributable to<br />
fire.<br />
• Identified areas that are not suitable for<br />
sugarcane cultivation.<br />
• Overlap & tradeoffs
Other considerations<br />
• Effects on biodiversity.<br />
• Mechanization may reduce the number of<br />
fires but at the expense of jobs.<br />
• Effects of sugarcane processing on water<br />
resources.<br />
• Effects of increased demand for sugar.


