Aggregate versus Disaggregate Data in Measuring School Quality
Aggregate versus Disaggregate Data in Measuring School Quality
Aggregate versus Disaggregate Data in Measuring School Quality

You also want an ePaper? Increase the reach of your titles
YUMPU automatically turns print PDFs into web optimized ePapers that Google loves.
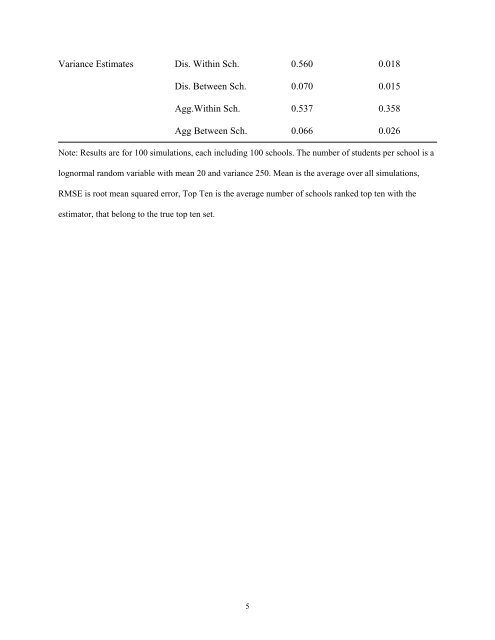
Variance Estimates Dis. With<strong>in</strong> Sch. 0.560 0.018<br />
Dis. Between Sch. 0.070 0.015<br />
Agg.With<strong>in</strong> Sch. 0.537 0.358<br />
Agg Between Sch. 0.066 0.026<br />
Note: Results are for 100 simulations, each <strong>in</strong>clud<strong>in</strong>g 100 schools. The number of students per school is a<br />
lognormal random variable with mean 20 and variance 250. Mean is the average over all simulations,<br />
RMSE is root mean squared error, Top Ten is the average number of schools ranked top ten with the<br />
estimator, that belong to the true top ten set.<br />
5