Synthesis of CdSe nanoparticles by solvothermal route: Structural ...
Synthesis of CdSe nanoparticles by solvothermal route: Structural ...
Synthesis of CdSe nanoparticles by solvothermal route: Structural ...

You also want an ePaper? Increase the reach of your titles
YUMPU automatically turns print PDFs into web optimized ePapers that Google loves.
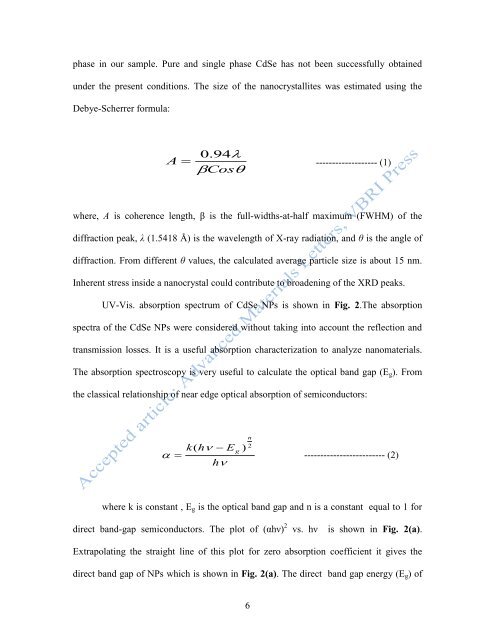
phase in our sample. Pure and single phase <strong>CdSe</strong> has not been successfully obtained<br />
under the present conditions. The size <strong>of</strong> the nanocrystallites was estimated using the<br />
De<strong>by</strong>e-Scherrer formula:<br />
0.<br />
94<br />
A ------------------- (1)<br />
Cos<br />
where, A is coherence length, β is the full-widths-at-half maximum (FWHM) <strong>of</strong> the<br />
diffraction peak, λ (1.5418 Å) is the wavelength <strong>of</strong> X-ray radiation, and θ is the angle <strong>of</strong><br />
diffraction. From different θ values, the calculated average particle size is about 15 nm.<br />
Inherent stress inside a nanocrystal could contribute to broadening <strong>of</strong> the XRD peaks.<br />
UV-Vis. absorption spectrum <strong>of</strong> <strong>CdSe</strong> NPs is shown in Fig. 2.The absorption<br />
spectra <strong>of</strong> the <strong>CdSe</strong> NPs were considered without taking into account the reflection and<br />
transmission losses. It is a useful absorption characterization to analyze nanomaterials.<br />
The absorption spectroscopy is very useful to calculate the optical band gap (Eg). From<br />
the classical relationship <strong>of</strong> near edge optical absorption <strong>of</strong> semiconductors:<br />
n<br />
2 k(<br />
h<br />
Eg<br />
)<br />
------------------------- (2)<br />
h<br />
where k is constant , Eg is the optical band gap and n is a constant equal to 1 for<br />
direct band-gap semiconductors. The plot <strong>of</strong> (αhν) 2 vs. hν is shown in Fig. 2(a).<br />
Extrapolating the straight line <strong>of</strong> this plot for zero absorption coefficient it gives the<br />
direct band gap <strong>of</strong> NPs which is shown in Fig. 2(a). The direct band gap energy (Eg) <strong>of</strong><br />
6