Depec-Bradesco Economic Highlights - Economia em Dia
Depec-Bradesco Economic Highlights - Economia em Dia
Depec-Bradesco Economic Highlights - Economia em Dia

You also want an ePaper? Increase the reach of your titles
YUMPU automatically turns print PDFs into web optimized ePapers that Google loves.
<strong>Depec</strong>-Bradeso <strong>Economic</strong> <strong>Highlights</strong><br />
the projected infl ation in their model. Hypothetically,<br />
let’s imagine a situation where infl ation is in the center<br />
of the target at the start of a year and that, solely<br />
on account of an external shock, both infl ation and<br />
infl ation expectations point to a higher-than-target<br />
value. In this case, it makes no sense to assume<br />
that there are two vectors pushing infl ation up: one<br />
from the external shock which leads to an increase<br />
in current infl ation and another from an “exogenous”<br />
deterioration in expectations. Expectations have<br />
worsened fundamentally because of the shock and<br />
not on account of any other factor. Therefore, to say<br />
8,5%<br />
6,5%<br />
4,5%<br />
2,5%<br />
5,2%<br />
7,2%<br />
8,1%<br />
5,5%<br />
4,4%<br />
3,0%<br />
mar/04<br />
mai/04<br />
jul/04<br />
set/04<br />
nov/04<br />
jan/05<br />
mar/05<br />
mai/05<br />
jul/05<br />
set/05<br />
nov/05<br />
jan/06<br />
mar/06<br />
mai/06<br />
jul/06<br />
set/06<br />
nov/06<br />
jan/07<br />
mar/07<br />
mai/07<br />
jul/07<br />
set/07<br />
nov/07<br />
jan/08<br />
mar/08<br />
mai/08<br />
jul/08<br />
set/08<br />
nov/08<br />
jan/09<br />
mar/09<br />
mai/09<br />
jul/09<br />
set/09<br />
nov/09<br />
jan/10<br />
mar/10<br />
mai/10<br />
jul/10<br />
set/10<br />
nov/10<br />
jan/11<br />
With regard to the infl ation cores, our diagnosis is that<br />
the acceleration seen over the last few months is the<br />
lagged refl ex of last year’s growth in economic activity,<br />
particularly in the labor market. It’s like taking a look in<br />
the rear-view mirror: the infl ation that we are experiencing<br />
right now is the result of the marked level of economic<br />
activity that was registered in previous quarters. As<br />
5,6%<br />
5,1%<br />
that the deterioration in infl ation expectations would<br />
be an additional risk factor is wrong, and is the same<br />
as counting the same shock twice. As a result, in our<br />
opinion, the deterioration in the infl ation expectations<br />
for 2011 is suffering to a marked degree from this<br />
“double counting” effect due to the pronounced<br />
correlation between infl ation expectations and current<br />
infl ation, infl uenced by the commodities shock. In<br />
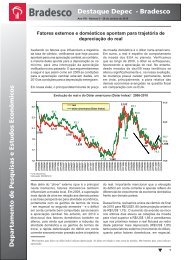
addition to this pronounced correlation with current<br />
infl ation, as can be observed in the following graph,<br />
the predictive power of infl ation expectations at times<br />
of external shocks se<strong>em</strong>s even smaller.<br />
6,4%<br />
IPCA<br />
Expectations 12 months forward<br />
4,0%<br />
5,3%<br />
4,5%<br />
5,9%<br />
5,5%<br />
IPCA infl ation<br />
and infl ation<br />
expectations 12<br />
months ahead,<br />
synchronized 2004<br />
- 2011<br />
Source: IBGE, BC<br />
Produced by: BRADESCO<br />
can be noted in the following table, among the main<br />
determinants of the underlying infl ation, the it<strong>em</strong>s that<br />
most draw attention are the earnings of households and<br />
the labor market. What is expected regarding this aspect<br />
is that the Central Bank will adjust its instruments in order<br />
to bring economic growth to below potential, and in our<br />
opinion, this is what is currently being done.<br />
July 2008 February 2011<br />
Expectation for the current year 6.50% 5.79%<br />
Change in 6 months (bps) 213 88<br />
Expectation for the next year 4.98% 4.78%<br />
Change in 6 months (bps) 94 28<br />
Infl ation for the previous year 4.46% 5.91%<br />
Gap (6 month average) 2.14% 0.52%<br />
Commodities in reais (variation over 6 months) 17.68% 16.29%<br />
Un<strong>em</strong>ployment Rate (6 month average) 7.93% 6.46%<br />
Real Earnings (annualized 6 month variation) 4.42% 8.19%<br />
Domestic Absorption (annualized 2 quarters variation) 9.93% 7.35%<br />
Even before the start of the monetary tightening cycle<br />
that is currently in progress, economic activity had<br />
already been giving signs that growth, in the margin, is<br />
below potential and the fi gures for the labor market point<br />
unmistakably in this direction, as can be observed in the<br />
graphs below. Growth in engag<strong>em</strong>ent and in earnings<br />
dropped from a fi gure close to 1.0% at the end of last<br />
Comparison between<br />
indicators which are<br />
signifi cant for infl ation<br />
during monetary tightening<br />
cycles<br />
2008 - 2011<br />
Source: IBGE, BC<br />
Produced by: BRADESCO<br />
year to a slightly negative fi gure at the start of this<br />
year, while engag<strong>em</strong>ent recently slowed down from a<br />
monthly rate of slightly more than 1.0% to a fi gure of<br />
less than 0.5%. Brazilian industrial production has been<br />
showing stability since the second last quarter of last<br />
year, retail sector sales are showing the fi rst signs of<br />
deceleration and apparent consumption of machinery<br />
DEPEC<br />
2