TESTING INTERNATIONAL PRICE TRANSMISSION UNDER ...
TESTING INTERNATIONAL PRICE TRANSMISSION UNDER ...
TESTING INTERNATIONAL PRICE TRANSMISSION UNDER ...

Create successful ePaper yourself
Turn your PDF publications into a flip-book with our unique Google optimized e-Paper software.
<strong>TESTING</strong> <strong>INTERNATIONAL</strong> <strong>PRICE</strong><br />
<strong>TRANSMISSION</strong> <strong>UNDER</strong> POLICY<br />
INTERVENTION. AN APPLICATION<br />
TO THE SOFT WHEAT MARKET<br />
AgriPoliS is a spatially explicit multi-agent model framework, developed in C++ language<br />
and suitable for long-term simulations of agricultural policies.<br />
The main feature of models developed with AgriPoliS is their ability to simulate the<br />
interaction among a large set of heterogeneous farmers and between them and the<br />
environment in which they operate.<br />
This dissertation describes an extension of the framework that allows AgriPoliS models to<br />
deal with typical characters of the Mediterranean agriculturliS::Med).<br />
It can be divided in two parts: while the first one (chapters 2 and 3) provides a generic<br />
background of the multi-agent methodology and details AgriPoliS::Med, the second part<br />
(chapters 4 and 5) describes its implementation over alternative policy scenarios and the<br />
results obtained with reference to two regions located in Central and Southern Italy.<br />
Results suggest that the effects of decoupling policies in the Mediterranean agriculture, as<br />
implemented in the 2003 reform, are often dominated by effects of structural trends and<br />
only a "bond scheme" would change the regional farm structures substantially. In no<br />
scenario remarkable agricultural land abandonment is observed.<br />
Further development of this subject from the author can be found on the RegMAS.org<br />
project.<br />
Giulia Listorti<br />
associazioneAlessandroBartola<br />
studi e ricerche di economia e di politica agraria<br />
Antonello Lobianco is a Ph.D. in Agricultural Policies currently working at the Department<br />
PhD of Economics Studies of the Marche Polytechnic University.<br />
6
associazioneAlessandroBartola<br />
<strong>TESTING</strong> <strong>INTERNATIONAL</strong> <strong>PRICE</strong><br />
<strong>TRANSMISSION</strong> <strong>UNDER</strong> POLICY<br />
INTERVENTION. AN APPLICATION<br />
TO THE SOFT WHEAT MARKET<br />
Giulia Listorti<br />
Università Politecnica delle Marche<br />
Dipartimento di Economia<br />
PhD Studies 6
Associazione “Alessandro Bartola”<br />
Studi e ricerche di economia e di politica agraria<br />
Department of Economics<br />
Università Politecnica delle Marche<br />
Piazzale Martelli, 8<br />
60121 Ancona, Italy<br />
PhD Studies Series: Volume 6, 2009
This work wouldn’t have been possible without the support of many people I<br />
have met in these years. Apart from their suggestions and advice, which I’m sure<br />
were essential for its continuous improvement, I would say that probably the<br />
biggest gift of this thesis was the possibility of meeting them, and of being<br />
honoured of their friendship.<br />
I would then thank Julian Binfield, William Meyers, Wyatt Thompson and<br />
Patrick Westhoff of the Food and Agricultural Policy Research Institute (FAPRI),<br />
University of Missouri-Columbia, for rendering my stay in the US a fruitful and<br />
unique experience.<br />
My acknowledgements also go to Frederic Chantreuil and to the whole<br />
AGMEMOD partnership for their interesting comments throughout the whole<br />
writing of this work; to Soeren Kissmeyer-Nielsen and Yves Plees for having<br />
assisted me during my internship at the EU Commission; to Rupert Somerscales<br />
of the International Grains Council for kindly (and timely) providing the data.<br />
I am also grateful to Riccardo (Jack) Lucchetti for having introduced an<br />
Agricultural Sciences graduate student to the study of Econometrics, and on the<br />
other side to Angelo Frascarelli, for having suggested me to apply for a PhD<br />
programme in Economics.<br />
Last, but not least, I would like to thank Roberto Esposti and Franco Sotte for<br />
their continuous assistance and advice. Working with them has been an<br />
extraordinary opportunity, human and scientific, and in both respects they really<br />
taught me more than I could either have imagined or write here.<br />
And, finally, the biggest acknowledgments go to my boyfriend, to my family<br />
and to my friends, for their love and support.
Index<br />
1 INTRODUCTION .................................................................................................................. 7<br />
2 <strong>PRICE</strong> <strong>TRANSMISSION</strong> AND THE LAW OF ONE <strong>PRICE</strong> ......................................... 13<br />
2.1 INTRODUCTION ........................................................................................................... 13<br />
2.2 SOME BASIC CONCEPTS ............................................................................................... 14<br />
2.3 A THEORETICAL PROBLEM: WHY SHOULD THE LOP HOLD? ........................................ 18<br />
2.4 CONCLUDING REMARKS .............................................................................................. 21<br />
3 EMPIRICAL TESTS FOR SPATIAL <strong>PRICE</strong> ANALYSIS ............................................. 23<br />
3.1 INTRODUCTION ........................................................................................................... 23<br />
3.2 EMPIRICAL TESTS: A GENERAL FRAMEWORK ............................................................... 24<br />
3.2.1 Simple regression and correlation analysis ..................................................... 24<br />
3.2.2 Dynamic regression models based on a point location model ......................... 27<br />
3.2.2.1 Granger causality and lead-lag relationships ............................................................ 28<br />
3.2.2.2 Ravallion and Timmer market integration criteria ................................................... 29<br />
3.2.2.3 Impulse response analysis ........................................................................................ 31<br />
3.2.2.4 Cointegration analysis .............................................................................................. 32<br />
3.2.3 Switching regime models ................................................................................. 32<br />
3.2.4 Rational expectations models .......................................................................... 35<br />
3.3 THE USE OF COINTEGRATION TECHNIQUES IN SPATIAL <strong>PRICE</strong> <strong>TRANSMISSION</strong> .............. 35<br />
3.3.1 Unit root tests applied to price series .............................................................. 41<br />
3.3.2 Different cointegration techniques................................................................... 42<br />
3.3.2.1 Threshold models ..................................................................................................... 43<br />
3.3.2.2 Asymmetric adjustment models ............................................................................... 45<br />
3.3.2.3 Models with structural breaks .................................................................................. 46<br />
3.3.3 Cointegration models and price transmission: empirical evidence ................. 48<br />
3.4 PROBLEMS IN EMPIRICAL MODELS RELYING ON <strong>PRICE</strong> DATA ....................................... 49<br />
3.5 CONCLUDING REMARKS .............................................................................................. 51<br />
4 <strong>INTERNATIONAL</strong> SOFT WHEAT MARKETS <strong>UNDER</strong> POLICY<br />
INTERVENTION ................................................................................................................... 53<br />
4.1 INTRODUCTION ........................................................................................................... 53<br />
4.2 TRADE FLOWS AND POLICIES IN <strong>INTERNATIONAL</strong> WHEAT MARKETS ............................ 54<br />
4.2.1 International soft wheat markets: an overview ................................................ 54<br />
4.2.2 European and international trade policies for soft wheat ............................... 59<br />
4.3 POLICY VARIABLES AND <strong>PRICE</strong> <strong>TRANSMISSION</strong>: A THEORETICAL FRAMEWORK ........... 64<br />
4.4 THE DATA ................................................................................................................... 68
4.5 CONCLUDING REMARKS .............................................................................................. 73<br />
5 EMPIRICAL ANALYSIS: COINTEGRATION MODELS ACCOUNTING FOR<br />
POLICY REGIME CHANGES ............................................................................................. 75<br />
5.1 INTRODUCTION ........................................................................................................... 75<br />
5.2 THE EMPIRICAL MODELS DEVELOPED .......................................................................... 76<br />
5.2.1 Model 1: the use of a composite variable ........................................................ 77<br />
5.2.2 Cointegration models accounting for policy regime changes .......................... 86<br />
5.2.2.1 Model 2: a threshold model allowing for policy regime changes ............................. 86<br />
5.2.2.2 Model 3: a changing cointegration vector ................................................................ 88<br />
5.2.2.3 Model 4: both adjustment coefficients and cointegration parameters can vary ........ 90<br />
5.3 CONCLUDING REMARKS .............................................................................................. 91<br />
6 EMPIRICAL ANALYSIS: COINTEGRATION MODELS, STRUCTURAL BREAKS<br />
AND POLICY REFORM ....................................................................................................... 95<br />
6.1 INTRODUCTION ........................................................................................................... 95<br />
6.2 POLICY REGIMES, STRUCTURAL BREAKS AND <strong>PRICE</strong> <strong>TRANSMISSION</strong> ........................... 96<br />
6.3 UNIT ROOT TESTS AND STRUCTURAL BREAKS ............................................................. 97<br />
6.4 A COINTEGRATION MODEL ALLOWING FOR STRUCTURAL BREAKS ............................ 100<br />
6.4.1 Assessing the robustness of the cointegration vector ..................................... 106<br />
6.5 CONCLUDING REMARKS ............................................................................................ 108<br />
7 CONCLUDING REMARKS ............................................................................................. 111<br />
REFERENCES ...................................................................................................................... 115<br />
ANNEXES .............................................................................................................................. 123<br />
ANNEX A – EMPIRICAL ANALYSIS ON <strong>PRICE</strong> <strong>TRANSMISSION</strong> : A REVIEW ............................. 124<br />
ANNEX B – UNIT ROOT TESTS ............................................................................................. 138<br />
ANNEX C – COINTEGRATION TESTS .................................................................................... 143<br />
ANNEX D – UNIT ROOT TESTS ON THE <strong>PRICE</strong> SPREAD .......................................................... 145<br />
ANNEX E – UNIT ROOT TESTS ON DE-SEASONALIZED TIME SERIES ...................................... 148
1 INTRODUCTION<br />
The notion of “price transmission” refers to the co-movement shown by prices<br />
of the same good in different locations. In the early literature already, spatial price<br />
analysis was devoted to defining markets (Fackler and Goodwin 2001, p.973): an<br />
economic market is the spatial area “within which the price of a good tends<br />
toward uniformity, allowance being made for transportation costs” (Stigler 1966<br />
cited Fackler and Goodwin 2001, p.974).<br />
When spatially separated markets are considered, price transmission analyses<br />
play a crucial role in trying to assess how efficiently integrated they are, i.e. to<br />
which extent rational arbitrage operates. Most works essentially aim at verifying<br />
whether the Law of One Price (LOP) holds between different markets; this Law<br />
simply states that homogeneous goods in spatially separated locations will have a<br />
unique price, when expressed in the same currency, net of transport costs.<br />
International price transmission is an issue which has received considerable<br />
attention, and different econometric techniques have been used in this respect. In<br />
particular, cointegration models have shown to have an “intuitive appeal”, as they<br />
consent to disentangle short and long run dynamics. Prices are assumed to be<br />
linked in the long run despite being allowed to diverge from each other in the<br />
short term.<br />
Nonetheless, despite the use of increasingly sophisticated techniques, evidence<br />
supporting the LOP is weak, and empirical findings are extremely mixed.<br />
This is not surprising, given that there is wide acknowledgment that the<br />
hypothesis of the LOP are quite unlikely to hold in practice: the LOP is simply<br />
expected to regulate spatial price relations in a “frictionless undistorted world”<br />
(Conforti 2004, p.1), while, in fact, a number of factors are expected to prevent<br />
prices from convergence.<br />
This work, in particular, will focus on how domestic and border policies affect<br />
international price transmission.<br />
In this respect, (often) highly policy-regulated agricultural commodities<br />
markets are extremely interesting for the analysis. Indeed, traditionally,<br />
agricultural commodities’ markets, especially in developed countries, have been
Introduction<br />
characterized by a high degree of policy intervention, whose motivations deeply<br />
hinge on some inherent characters of agricultural production.<br />
First of all, agriculture produces food, which is of strategic importance.<br />
Moreover, the agricultural production is characterized by a high degree of<br />
uncertainty, being dependant on natural production factors.<br />
Secondly, agricultural enterprises are small if compared to the size of the<br />
market, and their structural adjustment process is normally slow and constrained<br />
by the rigid supply of some of the production factors.<br />
Thirdly, agricultural markets are often characterized by a high degree of<br />
competition, and both market demand and supply are typically inelastic, rendering<br />
both producers’ yields and consumers’ expenditures extremely volatile (Hallett<br />
1968).<br />
In addition to these, and principally in developed countries, other reasons have<br />
been added to justify the presence of policy subsidies, concerning the specific<br />
functions agriculture performs in the rural environment (the so called<br />
“multifunctional” character of agriculture 1 ).<br />
However, in the past months, it has been the dramatic increase that<br />
commodities prices have experienced on international markets that drew the<br />
attention of both the media and of economic analysts on the agricultural sector.<br />
The rise in food commodity prices is due to a number of factors. The<br />
increasing demand of the emerging economies, especially for livestock products,<br />
the rising biofuels demand, and, on the supply side, the steady increase in energy<br />
prices can be classified as structural factors, whereas, as short term factors, we can<br />
mention the adverse meteorological conditions occurring during last year.<br />
The sudden increase in agricultural prices, together with the high levels of<br />
volatility they experienced, brought, if possible, an even more renewed interest in<br />
the policy debate about the reform agricultural policies should undergo to tackle<br />
an evolving global context, in which supply and demand forces are characterized<br />
by major interdependences.<br />
In this context, the analysis of how prices are transmitted, and of how<br />
intervention policies are likely to affect such mechanisms, is crucial.<br />
Understanding how price shocks are transmitted between different countries, and<br />
how such transmission has been affected, in the past, by policy regimes, is a<br />
prerequisite for policy analysis and future intervention. For the European Union<br />
(EU), this basically means analyzing to which extent, provided the presence of its<br />
regulatory framework, the world price has affected and has interacted with the<br />
domestic one.<br />
1 “Beyond its primary function of supplying food and fibre, agricultural activity can also shape the landscape,<br />
provide environmental benefits such as land conservation, the sustainable management of renewable natural<br />
resources and the preservation of biodiversity, and contribute to the socio-economic viability of many rural<br />
areas” (OECD 2001).<br />
8
Introduction<br />
These recent phenomena occurring on world markets, together with the<br />
controversial empirical evidence mentioned before, make the analysis of the<br />
effects of policy intervention on price transmission a challenging issue.<br />
However, in economic analyses, while policy variables are explicitly<br />
considered in econometric models, this is often not the case in empirical works.<br />
In fact, in literature, even if price transmission mechanisms for agricultural<br />
commodities have received considerable attention, analyses often use commodity<br />
prices only. This has implicated the use of increasingly sophisticated econometric<br />
techniques, and frequently not appropriate concern for policy factors. In<br />
econometric models, on the other side, explicit use of policy variables is made,<br />
but some of them disregard the time series properties of the data and rely on<br />
simplistic assumptions (which is basically due to their dimension and inherent<br />
complexity), like the exogeneity of the world prices for the EU in the<br />
AGMEMOD model (AGMEMOD Partnership 2007a; 2007b).<br />
The objective of this work is to bridge this gap, that is, to include policy<br />
considerations in a consistent theoretical framework and to provide empirical<br />
applications.<br />
This work studies price transmission mechanisms between EU an international<br />
soft wheat markets in the years 1978-2003. While the domestic French price is<br />
assumed to represent the European one, the Unites States’ (US) price is taken as<br />
representative of the world one. This commodity is the most traded grain,<br />
internationally. Domestic and border policies of the major producer and consumer<br />
countries are expected to have a deep influence on world markets (Ghoshray et al.<br />
2000, p.3).<br />
Empirical evidence concerning the existence and the evolution of price<br />
transmission for soft wheat between the US and the EU is extremely mixed. Either<br />
no evidence of co-movement is found, or it turns out to be low, and in this case<br />
being either affected or not by international trade policy reform.<br />
The object of this analysis is then twofold: on the one side, developing a<br />
consistent theoretical framework which allows to understand under which<br />
conditions co-movement between commodity prices in international markets is<br />
expected, after considering the presence of domestic and border policies: namely,<br />
the European Common Agricultural Policy (CAP) and the implementation of the<br />
Uruguay Round Agreement on Agriculture (URAA). The first is expected to have<br />
lowered the distance between EU and world prices, whereas the latter to have<br />
increased price transmission elasticities by ensuring a higher degree of<br />
liberalization.<br />
On the other, from this framework different econometric models, all making<br />
use of cointegration techniques, are subsequently derived, in order to test whether<br />
such a co-movement exists, and to which extent it has been affected by policy<br />
reforms.<br />
9
Introduction<br />
This work is organized as follows. Chapter 2 provides a general introduction to<br />
the study of price transmission. The basic concepts and definitions are presented,<br />
followed by some general considerations concerning all factors that affect the<br />
possibility of the LOP to hold in practice.<br />
In chapter 3, the econometric techniques used for the study of price<br />
transmission are revised. Cointegration models are explained in detail, as these<br />
will be used in the empirical sections of this work. Some observations about the<br />
properties of the models relying on price data only conclude the chapter.<br />
Chapter 4 aims at providing a general overview of international soft wheat<br />
markets. The institutional framework is presented, and the relevant international<br />
and EU policies for soft wheat are described.<br />
This allows to develop a theoretical framework which aims at understanding<br />
under which policy regime conditions co-movement between EU and world prices<br />
is actually expected, provided the presence of the CAP measures regulating the<br />
EU market, and of international trade regulations. Once the various combinations<br />
of market prices and policy regimes are analyzed, it is argued that it is the relative<br />
position of the intervention price, which is the basic EU instrument to regulate<br />
markets, and of the world price that allows to distinguish between the different<br />
policy regimes in place.<br />
The description of the dataset concludes chapter 4, together with considerations<br />
on issues related to the price leadership on world wheat markets, product<br />
homogeneity, transport costs assumptions.<br />
Subsequently, the models presented in chapters 5 and 6 allow to test through<br />
empirical applications the theoretical framework developed.<br />
All models presented in chapter 5 share the common characteristic of the use of<br />
a policy variable, the intervention price, together with monthly EU and US prices,<br />
to account for policy regime changes. The models presented represent an original<br />
attempt of combining policy and price data, and all yield consistent results: the<br />
EU and the US price interaction can be adequately assessed only when policy<br />
regimes are explicitly considered.<br />
However, some interpretative problems remain. For this reason, in chapter 6,<br />
which concludes this work, a final model is presented to explore the relation<br />
between just the EU and the US price. This time, policy regime changes are<br />
modelled by using cointegration techniques allowing for structural breaks, which<br />
have only recently been applied to agricultural commodities markets (the<br />
underlying assumption being that the two prices have always been linked despite<br />
domestic and border policies, which are on the other side assumed to have<br />
affected this relation).<br />
Once again, empirical evidence confirms the presence of co-movement<br />
between the two prices only when policy regimes are appropriately considered.<br />
10
Introduction<br />
Whereas the Common Agricultural Policy reforms have reduced the distance<br />
between domestic and international prices, liberalization reforms appear to have<br />
positively influenced price transmission.<br />
11
2 <strong>PRICE</strong> <strong>TRANSMISSION</strong> AND THE LAW OF<br />
ONE <strong>PRICE</strong><br />
2.1 Introduction<br />
This chapter aims at providing a general overview of the theoretical framework<br />
for the study of price transmission for a certain good between spatial separate<br />
locations 2 . This topic has received considerable attention, and this is true<br />
especially for agricultural commodities. These are characterized by being<br />
produced over an extensive spatial area, and costly to transport relative to their<br />
total value.<br />
Spatial price analysis allows to gain insights into the working of markets and to<br />
evaluate their performances (Fackler and Goodwin 2001, p.973). Indeed, market<br />
integration affects economic growth, induces structural change and alters the<br />
location of economic activities (Vollrath and Hallahan 2006, p.56). Potential<br />
losses and benefits crucially depend upon markets receiving price signals; this is<br />
why the topic has attracted so much empirical work (Conforti 2004, p.1). In<br />
addition to this, this issue gains probably nowadays particular relevance<br />
considering the dramatic increase, due to both contingent (adverse meteorological<br />
conditions, speculations) and structural factors (the increase of the demand<br />
originating from emerging economies, the biofuels demand), that food commodity<br />
prices have experienced since 2007. Understanding how prices are transmitted<br />
between different countries is a challenging issue, and a prerequisite for policy<br />
intervention.<br />
This chapter has the objective of providing the basic theoretical concepts<br />
relevant to the study of price transmission, in order to fully understand how<br />
empirical models have been developed in the existing literature, and to evaluate<br />
the innovations that will be introduced and tested in the remainder of this work.<br />
2 This work then focuses on “horizontal” price transmission, whereas “vertical” price transmission refers to<br />
the transmission of prices between producers, intermediaries and consumers (see for example Meyer and von<br />
Cramon-Taubadel 2004).
Price Transmission and the Law of One Price<br />
The fundamental definitions are given (paragraph 2.2), underlying the relations<br />
existing between them, and the appropriateness of their use in the analysis. In<br />
paragraph 2.3, some major problems due to the reliability of the hypothesis at the<br />
basis of the LOP to hold in practice are described, which is strongly interlinked<br />
with a first assessment of the problems inherent to empirical models relying only<br />
on price data (which will be extensively dealt with in chapter 3). Paragraph 2.4<br />
concludes.<br />
2.2 Some basic concepts<br />
The study of price transmission mechanisms implies referring to a number of<br />
economic concepts for which, unfortunately, no common definitions exist in<br />
literature (Fackler and Goodwin 2001, p.976). The most important ones will here<br />
be briefly revised.<br />
The basic notion is the spatial arbitrage condition, which can be formalized as<br />
in equation (2.1),<br />
14<br />
Pj - Pi ≤ Rij<br />
(2.1)<br />
where P indicates the prices in the two spatially separated locations i and j, and Rij<br />
is the cost of moving the good considered from i to j. The spatial arbitrage<br />
condition implies that the difference between prices in different locations will<br />
never exceed transport costs 3 , or otherwise the profiting opportunities would be<br />
immediately exploited by arbitrageurs: they would buy the goods in the market in<br />
which the price is lower, and sell them in the one where it is higher. Other things<br />
equal, the price would then go up in the first market due to the increased demand,<br />
and go down in the second one because of the increase of supply, towards<br />
equilibrium. In the short run, actual prices may diverge from the spatial arbitrage<br />
condition, but the actions of the arbitrageurs are expected to make it valid in the<br />
long run, moving the price spread toward the transport cost 4 . More realistically,<br />
explicit arbitrage for nowadays markets is the outcome of the actions of a number<br />
of dispersed producers who evaluate the market conditions existing in several<br />
terminal markets and sell in the market with the highest price. Net returns and<br />
prices are equalized across markets; prices are expected to differ by no more than<br />
the difference in the costs of selling in one market versus another (Goodwin and<br />
Piggott 2001, p.302).<br />
3 In this paragraph, for the sake of simplicity, the term transport cost is meant to include all costs of arranging<br />
transactions between spatially different locations. See paragraph 2.3 for a more detailed explanation.<br />
4 In this respect, Stigler defines the market as the spatial area “within which the price of a good tends toward<br />
uniformity, allowance being made for transportation costs” (1966 cited Fackler and Goodwin 2001, p.974).
Price Transmission and the Law of One Price<br />
The Law of One Price (LOP) directly follows from the spatial arbitrage<br />
condition: in markets linked by trade and arbitrage, prices expressed in the same<br />
currency will be equalized, net of transport costs. The LOP is based on<br />
international commodity arbitrage, implying that “in the assumed absence of<br />
transport costs and trade restrictions, perfect commodity arbitrage insures that<br />
each good is uniformly priced (in common currency units) throughout the world ”<br />
(Isard 1977, p.942) 5 . Some Authors distinguish between a weak and a strong<br />
version of the LOP: the former is the same as the arbitrage condition, while the<br />
latter is the relation (2.1) taken with an equality sign. Goodwin et al. (1999,<br />
p.192) provide a comprehensive definition of the LOP. The economic agent is<br />
assumed to have the opportunity to sell in two different markets 6 , and to aim at<br />
maximizing his profit, V, which is given by:<br />
t<br />
∑{<br />
[ P1<br />
t+<br />
kq1<br />
t + P2<br />
t jq<br />
2t<br />
− C(<br />
Qt<br />
) −τ<br />
1q1t<br />
− 2q<br />
t ] }<br />
V ( q1<br />
t , q2t<br />
) = +<br />
τ 2<br />
t<br />
δ (2.2)<br />
where qit is the quantity sold in market i (i = 1,2) at time t, Pi,t+k is the price<br />
received upon delivery in market i (at k and j periods after t), C(·) is a general<br />
arbitrage cost function, Qt is the total traded quantity (Qt= q1t + q2t), δ is the real<br />
discount factor, and τit is the per unit transaction cost. For all s > t, the first order<br />
conditions are given by:<br />
s k { δ [ δ P − C ( Q ) − ] } = 0<br />
E τ<br />
t+<br />
s = 1 t+<br />
k+<br />
s ' t+<br />
s 1t+<br />
s<br />
s j { [ δ P − C ( Q ) − ] } = 0<br />
t+<br />
s = 2 t+<br />
j+<br />
s ' t+<br />
s 2t+<br />
s<br />
(2.3)<br />
E δ τ<br />
(2.4)<br />
that can be arranged to yield<br />
k<br />
j<br />
{ P −τ<br />
−δ<br />
P + } = 0<br />
E δ τ<br />
(2.5)<br />
t = 1 t+<br />
k 1t<br />
2t+<br />
j 2t<br />
Supposing there are no delivery lags (i.e. k = j = 0 ), this relation implies:<br />
)<br />
P P τ −τ<br />
+ = (2.6)<br />
1t 2t<br />
( 1t<br />
2t<br />
5 Asche et al. (1999), note that the LOP is closely related to the Composite Commodity theorem of Hicks and<br />
Leontief. For both conditions to hold, in fact, prices must move proportionally over time.<br />
6 Storage is not explicitly considered, but may be added to the model without loss of generality; additional<br />
arbitrage conditions would exist among expected prices, storage costs, and transportation costs.<br />
15
Price Transmission and the Law of One Price<br />
7; 8<br />
i.e., the LOP.<br />
The LOP is at the basis of the Purchasing Power Parity (PPP), which can be<br />
considered as its aggregate version stated in terms of price indices, and whose<br />
assumptions are thus far more restrictive.<br />
The LOP, whose the very “law” designation reflects the faith placed in its<br />
adherence (Fackler and Goodwin 2001, p.977) has a very long tradition in<br />
economics which dates back to Marshall (1890 cited Fackler and Goodwin 2001,<br />
p.977) but, nevertheless, most of the empirical tests are against it. Miljkovic<br />
(1999, p.126), asserts that “although called a law, it has probably been violated<br />
probably more than any other economic laws (on the basis of the results of<br />
numerous empirical studies)”. A detailed description of why this might be the<br />
case will be given in paragraphs 2.3 and 3.4, as it might depend both on the strong<br />
assumptions underpinning it and on the inherent features of the empirical models<br />
used.<br />
Another basic concepts is the one of competitive market equilibrium, that is a<br />
condition in which extraordinary profits are exhausted by competitive pressures,<br />
regardless of whether this results in physical trade flows between markets (Barrett<br />
and Li 2002, p.394) 9 . Analogously, the spatial market efficiency can be taken as a<br />
synonymous of the spatial arbitrage condition. Regional or interregional markets<br />
characterised by arbitrage opportunities can be considered as inefficient, since<br />
markets should produce prices that accurately reflect all available information<br />
about demand and supply conditions as well as transaction costs. Market<br />
efficiency implies that, in a competitive market with perfect information, arbitrage<br />
will ensure that price differentials in related spatial and temporal markets will<br />
reflect all marketing costs. In spatially related markets, price differentials will<br />
reflect transportation costs; in temporally related markets, the cost of storage<br />
(Hui-Shung and Griffith 1998, p.369). However, in developing countries, the<br />
concept of spatial market efficiency may also encompass an assessment of the size<br />
of the transaction costs (Fackler and Goodwin 2001, p. 980).<br />
For the concept of spatial market integration, instead, Barrett and Li (2002,<br />
p.292) explicitly make clear that it just reflects the tradability of products between<br />
spatially distinct markets, irrespective of the presence or absence of spatial market<br />
equilibrium and efficiency. In other words, market integration is a quantity based<br />
indicator of tradability, while, as explained, efficiency is a price-based indicator,<br />
7 If transaction costs are a constant proportion of prices (τ1t = λ 1tP 1t), then the first order conditions imply P 1t<br />
=(1- λ 2 )/(1-λ 1 ) P 2t = β 0P 2t, which, as explained in the following paragraph, is a multiplicative version of the<br />
LOP which can be put in a linear form by taking the logarithms of the prices.<br />
8 If delivery lags are different, for example k = 0 and j > 0, it becomes P1t = β 0E t{P 2t+j}; see paragraph 3.2.4.<br />
9 Markets may maintain spatial linkages even when direct trade doesn’t occur between them. This happens if<br />
selling agents from both markets compete in a third one and perfect competition holds in all three markets.<br />
Even in the absence of trade, spatial market linkages might be disciplined under the threat of competition;<br />
prices differences are kept between the cost band (Goodwin et al. 1999, p.160).<br />
16
Price Transmission and the Law of One Price<br />
based on economics concepts of equilibrium (Thompson and Bohl 2002, p.1042).<br />
Nevertheless, Fackler and Goodwin (2001, p.978) report that for the concept of<br />
spatial market integration no satisfactory definition exists: this has lead to some<br />
inconsistencies and confusions. Indeed, the term has been used loosely in the<br />
existing literature: to indicate, in general, the degree of co-movement shown by<br />
prices in different locations, and, also, the degree at which price shocks are<br />
transmitted among spatially separated markets (Goodwin and Piggott 2001,<br />
p.302). In this respect, Fackler and Goodwin (2001, p.978) propose the following<br />
indicator:<br />
RA<br />
AB<br />
δPB<br />
=<br />
δε<br />
A<br />
δPA<br />
δε<br />
A<br />
(2.7)<br />
where εA is a shock occurring on market A, and RAAB is the price transmission ratio<br />
between region A and region B. If the two markets are perfectly integrated, it<br />
should show a value of 1. This ratio, which could also not be symmetric between<br />
the two regions, allows to study how shocks are transmitted from one market to<br />
the other. The underlying idea is that if price shocks are transmitted, then trade<br />
exists, and the markets are integrated. Anyway, a number of objections can be<br />
raised, underlying the confusion arising when market integration is measured<br />
without using trade flows data. Indeed, also if two regions are not part of a<br />
common trading network, there could be price co-movement because of factors<br />
that have nothing to do with commercial integration: prices can share the same<br />
evolving pattern because of seasonality, common macroeconomic shocks,<br />
collusive behaviour and so on 10 . Indeed, it should be noticed that the indicator<br />
proposed by Fackler and Goodwin still relies on the use of price data only, which<br />
is the case for the overwhelming majority of the models which will be revised in<br />
the next chapter. Instead, market integration can be adequately assessed only if<br />
trade data are available (Barrett and Li 2002).<br />
A final observation concerns the fact that, since the LOP can hold even if the<br />
price transmission ratio between two regions is less than one 11 , the following<br />
hierarchy holds for the concepts defined so far (Fackler and Goodwin 2001,<br />
p.979; where the notion of “market integration” refers to equation 2.7):<br />
Perfect market integration ⇒ LOP strong ⇒ LOP weak (2.8)<br />
10 This might happen also for unrelated commodities. Pindyck and Rotemberg (1990 cited Tomek and Myers<br />
1993, p.89) note that the co-movement of prices has three main explanations: supply and demand shocks in<br />
one market may spill over into other markets; macroeconomic shocks can affect all prices together;<br />
speculators overreact to new information, and this causes spillovers between commodity markets.<br />
11 Shocks have generally a bigger effect in the originating region than in the other one (Fackler and Goodwin<br />
2001, p. 988).<br />
17
Price Transmission and the Law of One Price<br />
2.3 A theoretical problem: why should the LOP hold?<br />
The previous paragraph provides a general outline of the fundamental<br />
theoretical concepts relative to price transmission analysis. As it will be clearer in<br />
chapter 3, where the empirical models which have been used for the study of price<br />
transmission are presented, what emerges is a controversial picture. Indeed, not<br />
only are even the basic definitions not fully agreed upon researchers, but<br />
empirical analysis has brought a very mixed evidence (see annex A for a review).<br />
In this paragraph, some concluding remarks concerning the reliability of the<br />
LOP hypothesis to hold in practice will be given, which might be the cause of the<br />
absence of empirical evidence supporting it. This issue is nonetheless strictly<br />
entangled, as we will see in chapter 3, to the underlying hypothesis and properties<br />
of the models used, and this is particularly true if they rely only on price data<br />
(paragraph 3.4).<br />
It is well recognized that, though denoting this concept a “law” reflects the<br />
considerable faith in its adherence (Fackler and Goodwin 2001, p.977), the<br />
simplicity of the LOP can be easily questioned, as its assumptions prove to be<br />
quite restrictive and unlikely to hold in practice. Williamson (1986 cited Fackler<br />
and Goodwin 2001, p.975) and Miljkovic (1999, p.126) note that the LOP has<br />
been violated by empirical tests probably more than any other economic laws.<br />
The LOP is expected to regulate spatial price relations in a frictionless<br />
undistorted world; the premises of full price transmission and market integration<br />
correspond to those of the standard competition model (Conforti 2004, p.1).<br />
Following Miljkovic (1999) and Conforti (2004), some major groups of factors<br />
that prevent prices from convergence can be identified 12 .<br />
Transaction costs play a crucial role while investigating market efficiency, and<br />
this is particularly important in agriculture, since they are relevant if compared to<br />
the value of the commodities considered (Fackler and Goodwin 2001, p.973;<br />
Barrett 2001, p.27). Unless certain assumptions are made, their treatment is not<br />
easy; and, even if the LOP is satisfied, if transaction costs are large and volatile,<br />
prices don’t move together. Transaction costs have many components. In addition<br />
to the very transport costs (normally, freight rates, i.e. per unit transportation<br />
costs), we also have variable transport costs (insurance, financing, hedging,<br />
contracting, technical barriers to trade), exogenous costs components<br />
(underwriting fees, testing charges), unit average duties, and other immeasurable<br />
transaction costs (such as search costs and exchange rate variability; Barrett 2001,<br />
p.23); in other words, all other information, negotiation, monitoring and<br />
enforcement costs (Williamson cited Conforti 2004, p.2). Linnemann (1996 cited<br />
12 In general, the conditions necessary for adherence to factor price equalization are even stronger than those<br />
required for output markets; evidence supporting factor market integration is weak (Fackler and Goodwin<br />
2001, p. 976).<br />
18
Price Transmission and the Law of One Price<br />
Miljkovic 1999, p.135), concludes that the effect of distance on trade consists of<br />
three components: transportation costs, time element (perishability, adaptability to<br />
market conditions, irregularities in supply in addition to interest costs), and<br />
“psychic” distance, i.e. familiarity with laws, institutions and habits. Both<br />
“distance” and “border” matter: some studies have shown that price differentials<br />
across countries for very similar goods are usually more volatile than price<br />
differentials within a country for very dissimilar goods (Engle and Rogers 1996,<br />
McCallum 1995, Mussa 1986, all cited Miljkovic 1999, p.128-129). This could be<br />
explained by the nominal stickiness of prices when expressed in national<br />
currencies, and by the relatively high volatility of nominal exchange rates (crossborder<br />
prices would fluctuate along with the exchange rate, but within country<br />
prices would be fairly stable), but also by the homogeneity of productivity shocks<br />
in the non-tradable factors of productions and differences in the demand<br />
elasticities between different countries (Milikovic 1999, p.129).<br />
Border and domestic policies play a role. Policies aimed at insulating internal<br />
commodity prices will not allow changes in the world ones to be transmitted to<br />
the internal prices (Bredahl et al. 1979). Variable levies, export subsidies, non<br />
tariff barriers, tariff rate quotas, prohibitive tariffs, technical barriers to trade are<br />
expected to prevent prices from convergence, whereas ad valorem and fixed<br />
tariffs should behave as proportional and fixed transaction costs 13 . Even the very<br />
existence of specific trade agreements that create different trading blocks with<br />
different degrees of market integration can prevent domestic prices from<br />
convergence in different countries. According to Miljkovic (1999, p.136), art.<br />
XXIV of the General Agreement of Tariffs and Trade (GATT), which allows the<br />
existence of non multilateral Free Trade Agreements, sets the institutional support<br />
for violating the very existence of the LOP. The importance of domestic and<br />
border policies in affecting price transmission will be further discussed in chapters<br />
3 and 4.<br />
Market power can exist along production chains: depending on the degree of<br />
concentration of each industry, some agents may behave as price makers while<br />
some others as price takers. The presence of increased returns to scale in<br />
production might be at the origin of market power. Miljkovic (1999, p.134)<br />
underlines that export demand elasticities vary by country, and this provides the<br />
impetus for the differential pricing of exports as opposed to price taking (we have<br />
pricing to market behaviour, i.e., the ability of exporting firms to discriminate<br />
prices across destinations).<br />
Prices are not expected to converge also if product homogeneity and<br />
differentiation influence the substitutability in consumption.<br />
13 Mundlak and Larson (1992, p. 405) propose the explicit inclusion of stabilization policies in a linear model<br />
of the LOP. They are expected to lower the price transmission coefficient.<br />
19
Price Transmission and the Law of One Price<br />
Exchange rates “pass-through” on output prices, which has been studied in<br />
relation to pricing to market behaviour, and exchange rate risks do have an effect<br />
on export prices (Miljkovic 1999, p.134-135).<br />
Finally, imperfect flows of information can rise the cost of arbitraging.<br />
Moreover, price transmission might also be characterized by asymmetry, i.e. it<br />
differs according to whether prices are increasing or decreasing (in magnitude,<br />
speed or both). Price transmission asymmetry implies a different distribution of<br />
welfare than what we would have under symmetry and might be a manifestation<br />
of market failure (for a survey see Meyer and von Craumon-Taubadel 2004).<br />
Asymmetric adjustment costs, asymmetric information and, of course, market<br />
power might be at the origin of horizontal price transmission asymmetry (see<br />
paragraph 3.3.2.2 14 ).<br />
At this point, it should be clear that distance and transportation costs, after<br />
adjusting for exchange rates, don’t account for international price variability.<br />
Miljkovic (1999, p.130) notes that this is implicitly recognized in Stigler and<br />
Sherwin (1985) already: when claiming that a product’s prices “tend” to move<br />
together, they are aware of the existence of multiple prices for a good in the same<br />
market. “Because it is recognized that international markets are (generally) far<br />
from perfect, it is not clear why imposing the LOP in international agricultural<br />
trade modelling is so critical” (Miljkovic 1999, p.130). Moreover, a number of<br />
the studies aiming at testing the LOP have national or at most interregional<br />
dimension (Baulch 1997; Sexton et al. 1991).<br />
In most empirical models (see chapter 3), all sources of deviations from the<br />
LOP not explicitly considered amongst the regressors turn out to be included in<br />
the error term. This, in turn, implies strong assumptions on their behaviour. For<br />
example, we can anticipate that, in cointegration models, which will be<br />
extensively dealt with in the remainder of this work, they are assumed to be<br />
stationary (if the model is expressed in logarithms, stationary around a constant<br />
proportion of prices).<br />
An important consequence is that, being the hypothesis at the basis of the LOP<br />
very strict, a transmission parameter will summarize the overall effect of a set of<br />
factors affecting price signals (transaction costs, the existence of market power<br />
and so on). The fact that some of this elements change proportionally with the<br />
prices while some others directly impact on price spreads, and that their effects<br />
are likely to interact with each other, further complicate the analysis.<br />
Nevertheless, still the value of the parameters and their significance level provides<br />
information about the extent to which markets share the same price shocks<br />
(Conforti 2004, p.5). At the same time, knowledge of the institutions and<br />
14 In agricultural economics, asymmetric price transmission is an issue extensively dealt with in vertical price<br />
transmission analyses (see for example Meyer and von Craumon-Taubadel 2004).<br />
20
Price Transmission and the Law of One Price<br />
conditions pertinent to the markets in question will be necessary to properly<br />
interpret the results of empirical evaluations (Fackler and Goodwin 2001, p.1017).<br />
2.4 Concluding remarks<br />
Perhaps, the most surprising observation that emerges from a general outline of<br />
the concepts necessary to study price transmission mechanisms is that,<br />
unfortunately, sometimes no common definitions exist. In particular, only the<br />
most recent literature has shed light on the distinction between market integration<br />
and efficiency (Barrett and Li 2002, p.292), whereas various inconsistencies in<br />
some of the previous works remain.<br />
However, when the theoretical definitions presented are translated into<br />
empirical models, most analyses basically aim at verifying the validity of the LOP<br />
between spatially separated markets by using price data only (as it will be<br />
extensively explained in chapter 3).<br />
However, despite an abundant literature (see annex A for a review), the<br />
empirical evidence is nonetheless mixed. While, on the one side, when empirical<br />
tests rely only on price data, as it is often the case, it is just not possible to test<br />
separately the efficiency hypothesis and the strong assumptions underpinning the<br />
model specifications (Barrett 2001, p.29; see chapter 3), on the other, as a matter<br />
of fact the hypothesis needed for the LOP to hold are quite restrictive and unlikely<br />
to hold in practice, since many factors can prevent prices from convergence.<br />
These factors have been here shortly enlisted and described.<br />
Clearly, domestic and border regulation policies play a fundamental role in<br />
influencing price transmission and market integration (Conforti 2004, p.2). In this<br />
respect, (often) highly policy-regulated agricultural commodities markets are a<br />
case in point: the political intervention to which agriculture is subject creates a<br />
gap between world and domestic prices, which generates cross-country variations<br />
in agricultural prices (Mundlak and Larson 1992, p.399).<br />
The aim of this work is then to provide a consistent theoretical framework to<br />
consider policy regimes while testing for price transmission.<br />
21
3 EMPIRICAL TESTS FOR SPATIAL <strong>PRICE</strong><br />
ANALYSIS<br />
3.1 Introduction<br />
While chapter 2 provides a general outline of the fundamental theoretical<br />
framework underlying price transmission analysis, this chapter will focus instead<br />
on the econometric techniques which have been used so far in empirical<br />
applications (a review of the economic models of price determination, also<br />
surveyed in Fackler and Goodwin, 2001, is on the other side beyond the<br />
objectives of this work) 15 .<br />
A fundamental important premise is that, as we will see, prices are often the<br />
only data available to examine spatial relationships. Accordingly, increasingly<br />
sophisticated econometric devices have been developed. Barrett (1996, p.825)<br />
notes that “agricultural economists’ toolkits have changed nearly as rapidly and<br />
dramatically as have developing economy markets, but these methodological<br />
refinements have not been accompanied by conceptual advance”. In much of the<br />
existing literature, indeed, the analysis typically relies on price data only, and<br />
focus on the special case of “perfect integration, when two markets are both<br />
integrated and in competitive equilibrium. Yet actual market relationships are<br />
messy” (Barrett and Li 2002, p.294). Clearly, in order to be informative, market<br />
(price) analysis will also have to be accompanied by a thorough study of the<br />
conditions in which trade takes place.<br />
Amongst all empirical models used, time series analysis and in particular<br />
cointegration techniques have been considered as very appealing, as they allow to<br />
disentangle short and long run market dynamics and to remove the exogeneity<br />
hypothesis of one of the prices.<br />
15 Also, a parallel literature has emerged in “pricing to market” (PTM) models. The canonical PTM model<br />
compares fob prices from a single source country to multiple destination markets (Barrett 2001, p.25).
Empirical Tests for Spatial Price Analysis<br />
However, despite all the different models developed, empirical evidence is<br />
extremely mixed.<br />
This chapter is structured as follows. In paragraph 3.2, the most important<br />
econometrical approaches used hitherto to investigate price transmission<br />
mechanisms are revised: simple regression and cointegration models, dynamic<br />
regression models, switching regime models and rational expectation models.<br />
Paragraph 3.3 is entirely devoted to cointegration techniques, as these will be used<br />
in the empirical section of this work: issues related to unit root testing when<br />
applied to price series, the various cointegration techniques developed so far and<br />
the empirical evidence are presented. Finally, in paragraph 3.4, the common<br />
drawbacks of all empirical models relying only on price data are explicated. This<br />
is in a certain way complementary to paragraph 2.3, since, concerning the<br />
recurrent violations of the LOP found by empirical works, problems related to its<br />
strict assumptions are strictly intertwined with the characteristics of the model<br />
specifications. Paragraph 3.5 concludes.<br />
3.2 Empirical tests: a general framework<br />
In this section, following Fackler and Goodwin (2001), the existing literature<br />
concerning price transmission mechanisms will be reviewed according to the<br />
various econometric tools used:<br />
− simple regression and correlation analysis;<br />
− dynamic regression models based on a point location model;<br />
− switching regime models;<br />
− rational expectations models.<br />
As soon as the corresponding econometric techniques were developed, they<br />
were used for the study of price transmission mechanisms. For each of them, a<br />
brief description of the approach used is given, underlying its main advantages<br />
and drawbacks.<br />
3.2.1 Simple regression and correlation analysis<br />
The one relying on simple regression and correlation analysis is the oldest<br />
approach used for the study of price transmission. Correlation and regressionbased<br />
spatial market integration 16 analysis are nearly identical in terms of the<br />
16 As explained in paragraph 2.2, especially the early literature did not effectively distinguish amongst<br />
efficiency and integration (Barrett and Li 2001, p. 292). For this reason, in the remainder of the discussion,<br />
the word “integration” is used following Fackler and Goodwin (2001), and refers to the transmission of price<br />
shocks between markets rather than to the actual presence of trade.<br />
24
Empirical Tests for Spatial Price Analysis<br />
mechanisms used to develop empirical tests, though the interpretation of the<br />
results is different 17 .<br />
The basic model is the following:<br />
P ε<br />
t = β + β P t + β Tt<br />
+<br />
(3.1)<br />
1 0 1 2 2 t<br />
where Pt are the prices in locations 1 and 2 at time t, T represents transaction costs<br />
and ε is the error term. Arbitrage conditions are assumed to hold instantaneously<br />
(as no lags are included in the model). Markets are taken to be perfectly integrated<br />
if<br />
β = β = 1<br />
1<br />
2<br />
(3.2)<br />
and 0 0 = β (3.3)<br />
These models can be evaluated both in levels or in logarithmic form. In the<br />
first case, the coefficient of the price term represents the marginal effect of the<br />
change of one price to the other; in the second one, this coefficient represents the<br />
price transmission elasticity. In both cases, a value of 1 is assumed for perfectly<br />
integrated markets 18 . In most of the revised literature price transmission equations<br />
are normally written in logarithmic form, i.e.<br />
t = β + β p t + β tt<br />
+<br />
(3.4)<br />
1 0 1 2 2 t<br />
p ε<br />
the underlying equation in levels being<br />
0 β1<br />
P1 t e P2<br />
t Tt<br />
=<br />
β β2<br />
e<br />
ε<br />
t<br />
where p = log P and t = log T. β1 is the elasticity of price transmission.<br />
(3.5)<br />
17 Given two prices, P1 and P 2, the correlation coefficient is given by ρ 12 = σ 12/(σ 1σ 2), where σ 12 is the<br />
covariance between the two prices and σ i is the standard deviation of price i. In a regression written in the<br />
general form P 1= α +β P 2, the least square estimate of β is σ 12/σ 22, where σ 22 is the variance of P 2. Since β =<br />
ρ 12(σ 1/σ 2), β and ρ 12 are proportional and of the same sign.<br />
18 Sharma (2002) notes that, despite the complete pass-through of prices in absolute terms (what he calls<br />
“absolute price transmission”), the price transmission in proportional terms (or “proportional” price<br />
transmission, i.e. the percentage change in domestic -1- price divided by percentage change in world -2-<br />
price) is smaller than one in the import case and higher than one in the export case. This effect is larger the<br />
bigger the constant term; only if the constant is zero, the absolute and the proportional price transmission will<br />
be equal. In this work, following Fackler and Goodwin (2001), when talking about price elasticities we will<br />
refer to absolute price transmission.<br />
25
Empirical Tests for Spatial Price Analysis<br />
Usually, it is assumed that β2 = 0 and the assumption that β0 = 0 is, in turn,<br />
relaxed, so that this term becomes a crude mean to represent transaction costs (or,<br />
generally, all other factors contributing to price differentials which are not<br />
included amongst the regressors; see paragraph 2.3, and, for an example,<br />
Thompson et al. 2002a, p.1043). In this way, the strong assumption which is<br />
implicitly made in all linear regression models is that all factors possibly<br />
contributing to price differentials but not taken into account in the model are fixed<br />
(if a linear specification is used; or a constant proportion of prices, when variables<br />
are expressed in logarithms 19 ).<br />
Moreover, in linear regression models, it is clear that either one of the two<br />
prices must be assumed to be exogenous (Richardson 1978), or otherwise<br />
simultaneity problems can be addressed with Instrumental Variables techniques<br />
(Goodwin et al. 1990).<br />
Numerous different versions of the regression model can be developed. For<br />
example, Stigler and Sherwin (1985) use simple price correlation analysis<br />
amongst prices to establish their belonging to the same market. In Richardson<br />
(1978), log differenced prices are employed in a linear regression model. If the<br />
role of the exchange rate, e (defined as the ratio of the domestic -country 1- versus<br />
foreign -country 2- currency) is made explicit in the logarithmic form of the LOP,<br />
we have:<br />
26<br />
p ε<br />
t = β + β p t + β tt<br />
+ β et<br />
+<br />
(3.6)<br />
1 0 1 2 2 3 t<br />
where e is expected to have a positive sign 20 . The underlying assumption is that<br />
the level of disaggregation allows the exchange rate to be taken as exogenous.<br />
Anyway, most commonly, commodity prices are directly expressed in the same<br />
currency 21 .<br />
A first shortcoming of this approach, that, as we will see, is common to all<br />
models relying on price information only, is that unknown common components<br />
could explain price co-movement regardless of the extent to which markets are<br />
linked. Moreover, in theory, any value of the correlation coefficient is consistent<br />
with integrated markets, depending on the size of transaction costs. A final,<br />
fundamental flaw is that what is here tested is the strong form of the LOP, and not<br />
the validity of the arbitrage condition (which, differently from the first, would also<br />
19 This hypothesis would seem to be quite reliable for the data used in this analysis; see figure 4.11.<br />
20 Equation (3.6) can be interpreted as an export pricing equation for the home country: a lower e<br />
(appreciation of the home country currency) reduces foreign sales unless the exporter lowers its price (p 1<br />
decreases). Alternatively, viewing it as an import pricing equation for the home country, a higher e<br />
(depreciation of the home country) makes imports more expensive, allowing domestic producers to raise their<br />
prices (p 1 increases) (Vollrath and Hallahan 2006, p.61).<br />
21 When not, results are generally not altered (Thompson 1999; Bukenya and Labys 2005).
Empirical Tests for Spatial Price Analysis<br />
hold with an inequality sign). The importance of this flaw can be assessed only<br />
verifying the frequency at which price differences are within the band of the<br />
transport costs or exceed it.<br />
3.2.2 Dynamic regression models based on a point location model<br />
Dynamic models gained attention because price linkages might be of a noncontemporaneous<br />
nature. All dynamic regression models basically refer to the<br />
dynamic time-series properties of the data, using some version of a Vector<br />
Autoregression (VAR) model:<br />
n<br />
A 0 Pt<br />
= ∑ A k Pt<br />
−k<br />
+ DX t<br />
k = 1<br />
+ e<br />
t<br />
(3.7)<br />
where Pt is a (n X 1) vector of prices, Xt is a (n X 1) vector of exogenous factors,<br />
the Ak are the (n X n) matrixes of coefficients of the k-th included lagged prices,<br />
and et is a (n X 1) vector of unobservable serially independent market shocks.<br />
A common template comprising all dynamic regression models is provided by<br />
Fackler and Goodwin (2001, p.996). Their economic model, a point location<br />
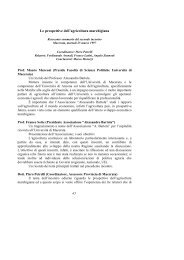
model 22 , is based on the following linear excess demand functions (see figure 3.1)<br />
qit = bi<br />
( ait<br />
− Pit<br />
)<br />
(3.8)<br />
where q are the net exports in country i, a is a shock that causes parallel shifts in<br />
the excess demand (for example, a change in the autarchy price), P is the i–th<br />
price and b a coefficient.<br />
Indicating with rt the transport cost from location 1 to location 2, the<br />
equilibrium conditions for the two-location model in which 1 always exports to 2<br />
can be written as:<br />
⎡<br />
⎢<br />
⎣<br />
b2<br />
⎤⎡<br />
P1<br />
t ⎤ ⎡ b1a1t<br />
+ b2a<br />
⎥⎢<br />
⎥ =<br />
1<br />
⎢<br />
⎦⎣P2<br />
t ⎦ ⎣ r<br />
b1 2t<br />
−1 t<br />
⎤<br />
⎥<br />
⎦<br />
(3.9)<br />
where both net exports and prices, net of transport costs, are equalized.<br />
22 In point location models the network structure links serve only for commodity transportation flows. On the<br />
contrary, in agents-on-links models, markets or firms are located at network nodes and consumers or<br />
commodity producers are located continuously along the network links. These models are used to represent<br />
spatial oligopoly situations. The differences in behaviour attributed to this model and the point location model<br />
have then more to do with the competitive structure of the market than with the spatial one (Mc New and<br />
Fackler 1997).<br />
27
Empirical Tests for Spatial Price Analysis<br />
prices<br />
28<br />
Figure 3.1 Linear excess demand function for country i at time t<br />
From (3.9), defining x1t = b1 a1t<br />
+ b2a2t<br />
and x2t = rt, supposing the three variables<br />
( a 1 t , a2t<br />
, rt<br />
) can be written as a VAR, we have<br />
x<br />
n<br />
t = ∑<br />
k=<br />
1<br />
B<br />
k<br />
x<br />
t−<br />
k<br />
+ v<br />
t<br />
(3.10)<br />
eliminating the forcing variables results in the VAR in prices already described in<br />
equation (3.7):<br />
⎡ b1<br />
⎢<br />
⎣−1<br />
b2<br />
⎤<br />
1<br />
⎥<br />
⎦<br />
⎡B<br />
B<br />
⎤⎡<br />
b<br />
m<br />
11k<br />
12k<br />
1 2<br />
Pt = ∑ ⎢<br />
Pt<br />
k<br />
k B k B<br />
⎥⎢<br />
⎥ −<br />
= 1 21 22k<br />
−1<br />
1<br />
⎣<br />
quantities<br />
Domestic World<br />
⎦⎣<br />
b<br />
⎤<br />
⎦<br />
+ v<br />
t<br />
(3.11)<br />
Though, normally, it is the reduced form of the VAR presented in equation<br />
(3.7) which is analysed, at issue is what restrictions spatial equilibrium imposes<br />
on the coefficients of equation 3.11. Granger causality and lead-lag relationships,<br />
the so-called Ravallion market integration criteria, impulse response analysis and<br />
cointegration analysis all must be interpreted within the framework proposed.<br />
3.2.2.1 Granger causality and lead-lag relationships<br />
The Granger Causality (GC) concept refers to the notion of causality in terms<br />
of lead and lag relationships: significant coefficients of the lagged prices imply<br />
that shocks to prices in one market evoke significant responses in another after<br />
some lags.<br />
pit<br />
qit=bi(ait-pit)<br />
qit
Empirical Tests for Spatial Price Analysis<br />
Unidirectional causality between two prices can be seen as informational<br />
inefficiency, since the second price is not incorporating the information coming<br />
from the first one, and its values could be predicted on the basis of those of the<br />
second one (see, for example, Gupta and Mueller 1982, p.303). Nonetheless, as<br />
Fackler and Goodwin point out (2001, p.998), the dynamics in the price<br />
adjustments, owing for example to delivery lags, could make this assumption<br />
questionable.<br />
GC analysis, together with IRFs (see paragraph 3.2.2.3) often accompanies<br />
dynamic model studies in empirical works.<br />
3.2.2.2 Ravallion and Timmer market integration criteria<br />
Ravallion’s model, as presented in his original article (Ravallion 1986), builds<br />
up a radial structure with a central market and other satellites ones. Together with<br />
the Timmer model (which, as explained further in this paragraph, directly stems<br />
from Ravallion’s one), it can be interpreted as a VAR model with tests of<br />
restrictions on the reduced-form parameters of the model (Fackler and Goodwin<br />
2001, p.1000). Ravallion’s model is described in equations (3.12) and (3.13). The<br />
price in market 1 is influenced by contemporary and lagged prices in all other<br />
markets and its own lags, while the price in any of the other i markets is<br />
influenced by the contemporary and lagged values of the price in market 1 and its<br />
own lagged values, only. Two equations describe the price transmission<br />
mechanisms, but, due to under-identification problems, only the second one is<br />
used in practice:<br />
n<br />
P 1 , t = ∑ a1,<br />
jP1<br />
, t−<br />
j<br />
m n<br />
k<br />
+ ∑ ∑ β i,<br />
jPk<br />
, t−<br />
j + X1,<br />
tc1<br />
+ e1,<br />
t<br />
j=<br />
1<br />
k=<br />
2 j=<br />
0<br />
n<br />
n<br />
P i,<br />
t = ∑ ai,<br />
jPi<br />
, t−<br />
j + ∑ β i,<br />
jP1<br />
, t−<br />
j + X i,<br />
tci<br />
+ ei,<br />
t<br />
j=<br />
1<br />
j=<br />
0<br />
(3.12)<br />
(3.13)<br />
where Xi is a vector of other influences on local markets. Normally, it is equation<br />
(3.13) which is used; if βi,j = 0, we have market segmentation, since the market 1<br />
doesn’t influence the market i. On the other side, if βi,0 = 1, immediate<br />
transmission is present. We have “strong” short run integration if βi,0 = 1 and αi,j =<br />
βi,j = 0 for any j > 0 (the lagged prices have no influence), while we can talk about<br />
a “weaker” short run market integration if<br />
29
Empirical Tests for Spatial Price Analysis<br />
30<br />
n<br />
∑<br />
j=<br />
1<br />
a + β = 0<br />
ij<br />
ij<br />
(3.14)<br />
i.e., the effects of the lagged central price and of the lagged price itself cancel, on<br />
average, each other out. To have long run integration, the equivalence<br />
n<br />
∑<br />
j=<br />
1<br />
n<br />
ai, j + ∑ β<br />
j=<br />
0<br />
i,<br />
j<br />
= 1<br />
must hold; under long run integration, the second equation can be re-written as:<br />
ΔP<br />
+<br />
i,<br />
t<br />
n−1<br />
= ( a<br />
i,<br />
1<br />
−1)(<br />
P<br />
∑( βi,<br />
o −1+<br />
∑<br />
j=<br />
1 k = 1<br />
j<br />
i,<br />
t−1<br />
a<br />
i,<br />
k<br />
− P<br />
1,<br />
t−1<br />
) +<br />
∑<br />
j=<br />
2<br />
+ β ) ΔP<br />
i,<br />
k<br />
n<br />
a<br />
1,<br />
t−<br />
j<br />
i,<br />
j<br />
( P<br />
+ X<br />
i,<br />
t−<br />
j<br />
i,<br />
t i<br />
− P<br />
c + e<br />
1,<br />
t−<br />
j<br />
i,<br />
t<br />
) + β ΔP<br />
i,<br />
0<br />
1,<br />
t<br />
+<br />
(3.15)<br />
(3.16)<br />
where changes in local prices are attributed both to past spatial price differentials<br />
and to changes in central prices; the latter variables allow for the possibility that<br />
the markets are not observed in an integrated equilibrium at a given point in time,<br />
and so there are feedbacks from prior disequilibria. Fackler and Goodwin (2001,<br />
p.1001) derive an interpretation of Ravallion’s model based on the structural VAR<br />
model they propose. The “strong” and the “weak” criterion are found not to refer<br />
to weaker equilibrium conditions but rather to weaker identification assumptions<br />
concerning the driving forces. They assert that the strong form of the short run<br />
integration implies transport rates to exhibit no persistence, which is a rather<br />
strong assumption, whereas in the weak form excess demand shocks are implicitly<br />
assumed not to have long run effects on the transport rate, which could be more<br />
reasonable.<br />
The so-called Timmer’s criterion is based on Ravallion’s model, but assumes<br />
that central market prices are predetermined relative to hinterland prices and that a<br />
first-order model is sufficient to capture price dynamics. After some algebraic<br />
manipulations the following expression is derived (Alderman 1992, p.9):<br />
P ( + cX + μ<br />
(3.17)<br />
where<br />
it = 1 + b1<br />
) Pit<br />
−1 + b2<br />
( P1<br />
t − P1<br />
t−1<br />
) + ( b3<br />
− b1<br />
) P1<br />
t−1<br />
b α (3.18)<br />
1 = i−1<br />
t<br />
it
= β<br />
2 i0<br />
Empirical Tests for Spatial Price Analysis<br />
(3.19)<br />
b α + β + β −1<br />
(3.20)<br />
3 = i i0<br />
i1<br />
An Index of Market Connectiveness (IMC) is thus obtained, being<br />
IMC i<br />
( 1+<br />
b1<br />
)<br />
=<br />
( b − b )<br />
3<br />
1<br />
(3.21)<br />
Since long run equilibrium conditions bring ( P 1t − P1<br />
t−1)<br />
= 0, the numerator and<br />
the denominator are, respectively, the contributions of local and central market<br />
price history to current prices. If markets are integrated, the IMC index should be<br />
close to zero, since the lagged effects of regional market shocks are small relative<br />
to the central reference market ones.<br />
Fackler and Goodwin (2001, p.1003) also in this case provide an interpretation<br />
of the model based on the structural VAR model they elaborate. They find out that<br />
a large value of the IMC may indicate that the locations are not integrated but may<br />
also indicate that they are integrated and that transport rates exhibit a high degree<br />
of persistence; a low IMC suggests instead that markets are not isolated but is<br />
unclear how connected they are. They conclude that both Ravallion’s strong form<br />
criterion and Timmer’s IMC index are helpful only if one has the confirmation<br />
that transport costs are white noise processes.<br />
3.2.2.3 Impulse response analysis<br />
In the moving average representation of a VAR system, Impulse Response<br />
Functions (IRFs) represent the effects of exogenous shocks to the variables, and<br />
allow to study their path of response. For a system of n prices, the set of impulse<br />
responses is given by<br />
∞<br />
Pt = ∑ M ket<br />
−k<br />
k = 0<br />
(3.22)<br />
The most important aspect of the analysis of IRFs is the possibility of checking<br />
whether the price series converge quickly after an isolate, exogenous shock to one<br />
of them (Goodwin and Piggot 2001, p.315). If two markets are integrated, an<br />
exogenous shock to prices in one market should indeed evoke an equilibrating<br />
response in the other one (Goodwin et al. 1999, p. 168). IRFs provide a more<br />
general view of market integration than the standard “all or nothing” tests, since<br />
31
Empirical Tests for Spatial Price Analysis<br />
the price response to disequilibria may take several periods to be complete<br />
(Goodwin et al. 1999, p.177), as delivery lags and other impediments to arbitrage<br />
and trade exist.<br />
IRFs have been interpreted as both dynamic disequilibrium adjustments (which<br />
is justified only if shocks are serially uncorrelated) and equilibrium adjustments to<br />
ongoing changes in the economic fundamentals. If price data alone are available,<br />
due to identification problems it is difficult to decide which interpretation is<br />
correct (Fackler and Goodwin 2001, p.1004). In either case, shocks must be given<br />
an economic interpretation: a standard practice is to assume that the shocks are<br />
uncorrelated and that, in equation (3.7), A0 is triangular, implying that prices form<br />
a causally recursive system; this means that shocks on some prices have no effect<br />
on the others. Unfortunately, not only is this assumption untestable and rather<br />
strong, but it is like imposing a priori inefficiency on the market, while wanting to<br />
study it. Finally, for agricultural commodities, it must be noticed that seasonal<br />
differences (like those originating form different harvesting times in the two<br />
hemispheres of the world) may lie behind different pattern of responses<br />
(Margarido et al., 2004).<br />
3.2.2.4 Cointegration analysis<br />
Starting from the seminal work of Ardeni (1989), cointegration techniques<br />
soon had an intuitive appeal for the study of price transmission mechanisms.<br />
Indeed, commodity price time series are often I(1) (integrated of order 1), which<br />
need to be differentiated before becoming stationary. Cointegration models<br />
presuppose that variables exhibiting nonstationary behaviour will nonetheless be<br />
linked by a long run relation, whose residuals are stationary. In this case, the latter<br />
is nothing but the LOP, which is expected to hold in the long-run despite short-run<br />
price variations.<br />
As it is this methodology which will be adopted for the empirical estimates of<br />
this work, cointegration techniques will be extensively dealt with in paragraph<br />
3.3.<br />
3.2.3 Switching regime models<br />
Switching regime models provide estimates of being in one of different trade<br />
regimes, determined on the basis of information on prices and transport costs.<br />
Indeed, conventional tests that rely on price data alone normally fail to recognize<br />
the role played by transport costs (see paragraph 3.4). Sexton et al. (1991), by<br />
using information on trade flows, study a market which is linked by unidirectional<br />
trade and develop a switching regime model in which arbitrage conditions may be<br />
violated; transport costs are estimated endogenously. The three regimes are<br />
32
Empirical Tests for Spatial Price Analysis<br />
defined as the situation within, at or outside the arbitrage condition. Market<br />
efficiency is equivalent to the probability of the regime which satisfies the<br />
arbitrage condition to be one and the others to be zero. Baulch (1997) extends this<br />
model by adding explicit information on transaction costs and allowing trade flow<br />
reversals to take place. The use of this approach (called the Parity Bound Model)<br />
allows markets to be integrated in some periods but not in others (trade flows<br />
discontinuity), transfer costs to vary between periods, and prices to be<br />
contemporaneously determined.<br />
Indicating with P1 t − P2<br />
t the price differential, with C 12 the transfer cost, and<br />
with u It and u Ot the additional error terms inside and outside the parity bounds<br />
(assumed to be independently and half normally distributed), three regimes are<br />
derived according to the size of price spreads and of transfer costs:<br />
− P = C . Regime 1 – efficient arbitrage: the price differential is<br />
− P1 t 2t<br />
12<br />
exactly at the parity bound; transfer costs equal the market price differential<br />
and there are no impediments to trade between markets. Trade will cause<br />
prices to move on a one-to one basis and the arbitrage conditions are<br />
binding.<br />
P P = C − u . Regime 2 – the price differential is inside the parity<br />
− 1 t − 2t<br />
12 It<br />
bound. In this case, the interpretations of Baulch and Sexton et al. are<br />
slightly different. For Baulch, when the price differential is inside the parity<br />
bound, it is because transfer costs exceed the inter-market spread: trade will<br />
not occur and the arbitrage conditions will not be binding (no profitable<br />
trade flows). For Sexton et al., that assume unidirectional trade, if the price<br />
spread is within the arbitrage band it is because too much trade has occurred<br />
(“relative glut”).<br />
P P = C + u . Regime 3 – the price differential is outside the parity<br />
− 1 t − 2t<br />
12 Ot<br />
bound. In Baulch’s model, if spreads exceed transfer costs, the spatial<br />
arbitrage conditions are violated whether or not trade occurs (non exploited<br />
profitable trade opportunity). In the interpretation of Sexton et al., too little<br />
trade occurs (“relative shortage” case).<br />
In the switching regime models presented, the probability distribution<br />
associated with the price spread is a mixture of three distributions, corresponding<br />
to the three regimes. The logarithm of the likelihood function of the sample is<br />
minimized and gives probability estimates for each of the three regimes 23 : the<br />
extent of market integration is expressed in terms of a continuous frequency of<br />
23 If transfer costs were known, testing for the efficiency of spatial arbitrage would reduce to arithmetically<br />
calculate whether trade occurred or not whenever the inter-market price differential exceeded or not transfer<br />
costs. But time series data on transfer costs are rarely available: either they must be estimated and inserted in<br />
the model, or be an endogenous parameter (Sexton et al. 1991).<br />
33
Empirical Tests for Spatial Price Analysis<br />
each of the possible three regimes. The higher the incidence of regime 3, the<br />
lower the extent of market integration 24 .<br />
However, both regime models presented still rely on prices, only, and not on<br />
trade flows. Indeed, Sexton et al. (1991) only consider price data, and Baulch<br />
(1997) adds information on transactions costs.<br />
The Barrett-Li (2001) method, instead, also makes use of trade flows data.<br />
Indeed, as mentioned in paragraph 2.2 already, Barrett (2001, p.20) and Barrett<br />
and Li (2002, p.292) claim that the measurement of integration should rely on<br />
flow-based indicators of tradability, whereas the estimation of efficiency should<br />
rely on price-based tests for market equilibrium, the most famous of which is the<br />
Enke-Samuelson-Takayama-Judge spatial equilibrium condition (ESTJ).<br />
According to the ESTJ equilibrium condition (Barrett 2001, p.21), the dispersion<br />
of prices in two locations for an otherwise identical good is bounded from above<br />
by the cost of arbitrage between the two markets and from below when trade<br />
volumes reach some ceiling value 25 . Trade is neither necessary nor sufficient for<br />
the attainment of the equilibrium in the ESTJ sense. This equilibrium condition<br />
uses four variables: prices, transaction costs, trade volumes, and trade volume<br />
quotas, “yet economists too commonly (and falsely) claim an ability to evaluate<br />
market efficiency on the basis of only one variable: prices” (Barrett 2001, p.21).<br />
So, Barrett and Li (2002, p.293), propose a new approach based on the maximum<br />
likelihood estimation of a mixture distribution model incorporating price, transfer<br />
cost, trade flow data, and a corroborating non parametric test. The combination of<br />
the various conditions of trade, T, and of the marginal returns, R, allows the<br />
definition of different regimes. In fact, price transmission might occur in absence<br />
of trade (segmented equilibrium), and trade might take place in absence of price<br />
transmission (imperfect market integration). They estimate different regimes that<br />
together define the four possible market conditions for any given pairs of markets:<br />
− perfect integration: R = 0 andT ≥ 0<br />
34<br />
− segmented equilibrium: R < 0 andT = 0<br />
− imperfect integration: R ≠ 0 andT > 0<br />
− segmented disequilibrium: R > 0 andT = 0<br />
jit<br />
jit<br />
jit<br />
jit<br />
jit<br />
Barrett and Li (2002, p.294) point out that most econometric applications are in<br />
fact aimed at testing the most restrictive condition (i.e., the presence of perfect<br />
24 When production and consumption are not specialized (i.e., both occur in both places), both regime 1 and 2<br />
are consistent with market integration (Baulch 1997, p. 480).<br />
25 Indicating with p the prices in locations 1 and 2, with τ the arbitrage costs, and with q trade values, we<br />
have that<br />
p ≤ p + τ<br />
1<br />
1<br />
1<br />
2<br />
p = p + τ<br />
2<br />
p ≥ p + τ<br />
2<br />
12<br />
12<br />
12<br />
if<br />
if<br />
if<br />
q<br />
q<br />
q<br />
12<br />
12<br />
12<br />
= 0<br />
= q<br />
jit<br />
∈ ( 0,<br />
q<br />
12<br />
jit<br />
12<br />
jit<br />
) .
Empirical Tests for Spatial Price Analysis<br />
integration), in which both market integration and a competitive equilibrium are<br />
verified, and are not capable of fully capturing the “messy” character of market<br />
relationships.<br />
Nevertheless, also “these methodological enhancements are no panacea”<br />
(Barrett 2001, p. 25). In fact, switching regime models have some common<br />
drawbacks. They are not dynamic, i.e. only offer static comparisons between the<br />
prices, and do not contain information about the speed of adjustment of prices; in<br />
addition to this, when trade data are not considered, violations of the spatial<br />
arbitrage conditions indicate lack of market integration irrespective of its causes.<br />
But a fundamental problem associated with switching regime models is that the<br />
believability of regime interpretation rests on “very strong and rather unrealistic”<br />
underlying distributional assumptions about which the economic theory has little<br />
to say (Barrett 2001 p.25; Fackler and Goodwin 2001, p.1012; Dercon 1999,<br />
p.2) 26 .<br />
3.2.4 Rational expectations models<br />
The hypothesis behind the use of rational expectations models is that, since<br />
price linkages are not contemporaneous and may involve lags, agents have<br />
expectations that they must formulate about prices at the time of delivery.<br />
Goodwin et al. (1990) develop a rational expectation version of the LOP.<br />
Recalling equation 2.6 (see also note 7 of chapter 2), if we admit that delivery lags<br />
are different, such as in the case where k = 0 and j > 0, we will have<br />
{ P }<br />
P +<br />
1t = β E<br />
(3.23)<br />
0 t 2t<br />
j<br />
That is simply the LOP holding when rational expectations are considered.<br />
3.3 The use of cointegration techniques in spatial price transmission<br />
Cointegration models presuppose that observable variables exhibiting<br />
nonstationary behaviour will nonetheless maintain long-run relationships. The<br />
residuals from such long run relationships are stationary. In our case, the long-run<br />
relationship is nothing but the LOP, which is assumed to be valid in the long run<br />
despite prices being allowed to diverge from it in the short run. In fact,<br />
26 For example, in Sexton’s interpretation, the assumption of independent errors is difficult to understand,<br />
since it implies that there is no process of adjustment to the arbitrage errors. In the Baulch one, the same can<br />
be said for the assumption of a half-normal distribution inside the parity bounds, since it implies a higher<br />
density near the parity bound, even though the markets are not connected at that moment in time; an identical<br />
distribution of the error inside the parity bound would be more realistic (Dercon and Campenhout 1999, p.4).<br />
35
Empirical Tests for Spatial Price Analysis<br />
commodity price time series are often found to be I(1) (integrated of order 1)<br />
processes, which need to be differentiated to become stationary.<br />
It is easy to understand why cointegration models soon had an “intuitive<br />
appeal” for being used for price transmission analysis: they allow to disentangle<br />
short and long run dynamics. In addition to this, notably, and differently from<br />
linear regression models, none of the prices is required to be assumed as<br />
exogenous.<br />
Starting from a from a standard VAR model with lag length p, or VAR(p), a<br />
Vector Error Correction Model (VECM) implying cointegration between the<br />
variables can easily be derived (see Enders 1995). Rewriting the general VAR(k)<br />
presented in equation (3.7) as<br />
36<br />
t = A0<br />
+ A1pt<br />
1 + ... + Akp<br />
t k ε<br />
t 1,...,<br />
T<br />
− − t<br />
p +<br />
= (3.24)<br />
where k is the lag length, pt (n X 1) is a vector of endogenous prices (where the<br />
lower cases indicate the use of logarithms); At (n X n) are matrices of unknown<br />
parameters; pt-k (n X 1) is a vector of the k-th lagged value of pt and εt (n X 1) are<br />
white noise disturbance terms which may be contemporaneously correlated. A<br />
VECM with lag length k, VECM(k), can be obtained by simple reparametrization:<br />
∆pt = Π 0 + Π1∆p<br />
t 1 + ... + Πk<br />
1∆pt<br />
(k 1) + Π pt<br />
k + ε<br />
(3.25)<br />
− − − −<br />
− t<br />
that is equal to<br />
k−1<br />
∆pt = Π0<br />
+ Π ∆p Π pt<br />
k ε<br />
i 1 i t i + − +<br />
(3.26)<br />
∑ =<br />
−<br />
t<br />
where<br />
0 0 A<br />
⎛ i ⎞<br />
Π = , Π ⎜ ⎟<br />
i = −<br />
⎜<br />
I − ∑ A j ⎟<br />
, j = 1, 2,...<br />
p −1<br />
⎝ j=<br />
1 ⎠<br />
Π<br />
⎛<br />
−⎜I<br />
−<br />
⎝<br />
k<br />
= ∑ Ai<br />
i=<br />
1<br />
⎞<br />
⎟<br />
⎠<br />
(3.27)<br />
(3.28)<br />
and ∆pt-j is a vector of pt-j in first differences, j =1,2,…k-1 (see Enders 1995,<br />
pages 389-390). The rank of Π provides the basis for determining the presence of<br />
cointegration between the variables: if rank(Π) = 0, the variables are not
Empirical Tests for Spatial Price Analysis<br />
cointegrated and the model is equivalent to a VAR in first differences; if rank(Π)<br />
= n, the variables are stationary and the model is equivalent to a VAR in levels; if<br />
0 < rank(Π) = r < n, the variables are cointegrated. Π can be decomposed as<br />
Π = αβ' , where α is the (n X r) matrix of the speed of adjustment coefficients and<br />
β is the (n X r) matrix of the cointegration vectors. The basic assumption is that<br />
β′pt = zt, representing the long run disequilibrium error, is stationary. All variables<br />
of an error correction model (ECM) exhibit the property of stationarity under the<br />
conditions that the levels of the individual variables are integrated of order one<br />
and a cointegration relationship between the variables exists. Statistical<br />
significance of the error correction parameter implies in turn the existence of a<br />
cointegrating relationship (Thompson et al. 2002, p.1044).<br />
There is also an alternative way to derive an ECM model which includes<br />
responses from a one-lagged long run disequilibrium term (Lucchetti 2008).<br />
Starting from the general VAR<br />
p = A p − + ε<br />
(3.29)<br />
t<br />
1<br />
t 1<br />
t<br />
subtracting pt-1 on both sides, we have that<br />
∆p = Πp − + ε<br />
(3.30)<br />
t<br />
t 1<br />
t<br />
where Π = A1-I = αβ′, whose rank allows to determine the presence of<br />
cointegration amongst the variables (see above). An autoregressive term can be<br />
added to remove the short run persistence in the error tem; like in equation 3.26,<br />
in the following VECM<br />
'<br />
t = αβ pt<br />
1 + ∑ Γ<br />
− k 1<br />
− i=<br />
1 i<br />
∆p ∆p + ε<br />
t−i<br />
t<br />
(3.31)<br />
where pt is a vector containing the prices, β is the cointegration matrix which<br />
contains the long-run coefficients (the degree of price transmission, Prakash 1999<br />
cited Conforti 2004, p.3), α is the loading matrix which contains the adjustments<br />
parameters (a measure of the speed of price transmission, Prakash 1999 cited<br />
Conforti 2004, p.3), Γi are matrixes containing coefficients that account for shortrun<br />
relations, and εt are white noise errors. Since the long run relation is the LOP,<br />
and being prices written in logarithmic form, the assumption is that price spreads<br />
(that is, all components which account for price spreads) are a stationary<br />
proportion of prices.<br />
When prices are expressed in logs, the coefficients included in β can be read as<br />
price transmission elasticities. In fact, if pt contains only two log-prices, say p1t,<br />
37
Empirical Tests for Spatial Price Analysis<br />
the domestic price, and p2t, the world price, we will have the following long-run<br />
relation between them:<br />
38<br />
'<br />
β p<br />
⎡ 1<br />
⎢<br />
⎢<br />
⎢⎣<br />
p<br />
[ β0<br />
β1<br />
β2<br />
] p1t −1<br />
= β0<br />
+ β1<br />
p1t<br />
−1<br />
+ β2<br />
p2t−1<br />
= z −1<br />
t−<br />
1 = t<br />
2t−1<br />
⎤<br />
⎥<br />
⎥<br />
⎥⎦<br />
where zt ≈ I(<br />
0)<br />
. Normalizing with respect to β1 and rearranging terms, we have<br />
p<br />
β<br />
β<br />
0 2<br />
1t− 1 = − − p2t−1<br />
+ zt−1<br />
β1<br />
β1<br />
(3.32)<br />
(3.33)<br />
where β2 / β1 is the long-run price transmission elasticity: it indicates the<br />
percentage change in the domestic price in response to a one-percent change in<br />
the world price.<br />
In international markets, price transmission elasticities show the extent to<br />
which changes in world prices are transmitted back to country prices; Thompson<br />
and Bohl (1999, p.2) argue that they can indeed be interpreted as a measure of the<br />
degree of market insulation, or the extent to which border policies are transmitted<br />
to domestic market. Price transmission is affected by trade liberalization and by<br />
trade policies: in general, trade liberalization will contribute to greater price<br />
transmission elasticities.<br />
The point estimates of adjustment coefficients, which measure how much a<br />
price responds to the disequilibrium from the previous period (in other words, the<br />
larger the absolute value of the adjustment coefficient, the faster the convergence<br />
toward the LOP), have important economic content (Thompson et al. 2002,<br />
p.1044). The stationarity of price spreads requires α1 < 0 and α2 > 0. Moreover, the<br />
weak exogeneity of one price with respect to the long run parameters requires its<br />
adjustment coefficient to be zero 27 . Finally, the adjustment coefficient is a proxy<br />
for the short run transmission elasticity.<br />
The existence of a stable relations between two prices, i.e. bivariate<br />
cointegration, has been deemed to be a necessary condition for integrated markets<br />
since the seminal work of Ardeni (1989). Others claim that the strongest condition<br />
that prices differences are stationary is needed, and thus impose instead of<br />
estimating the cointegration vector (Baffes 1991). Cointegration tests are run pair<br />
wise (Engle-Granger procedure) or with multivariate systems (Johansenn’s<br />
27 In a VECM, weak exogeneity does not imply GC since GC involves statistical tests of significance also of<br />
the lagged terms in addition to the parameters of the error correction terms.
Empirical Tests for Spatial Price Analysis<br />
procedure) 28 . In a system with n prices, the number of the cointegration relations<br />
has been considered as an index of the degree of integration of the markets.<br />
Cointegration versions of Ravallion’s model have been proposed, as well<br />
(Alderman 1992; Dercon and Campenhout 1999).<br />
Despite their intuitive appeal, the use of cointegration techniques presents a<br />
number of shortcomings (see Barrett 1996; Miljkovic 1999, pp.132-133).<br />
First of all, it is evident that cointegration is not a necessary condition for<br />
markets to be efficiently integrated, since transaction costs (as well as other<br />
elements not explicitly included in the LOP equation, and then contributing to<br />
price spreads; see paragraph 2.3) could be nonstationary processes 29; 30; 31 . So,<br />
price diverging far from each other could not imply any arbitrage possibility at all:<br />
if transaction costs are non stationary, cointegration is then an unnecessary<br />
condition for market efficiency (Barrett 1996; Mc New and Fackler 1997).<br />
Secondly, if the transaction cost band is large but the price spread remains<br />
within the band, prices could result cointegrated even if markets are actually not<br />
linked, since the difference between the prices would not justify any shipment of<br />
the commodities. This means that, in order to use the cointegration approach,<br />
transaction costs should be small if compared to prices, which is often not the case<br />
for agricultural goods. Barrett (1996, p.827), points out that market segmentation<br />
can arise because of inter-market margins larger than transfer costs (absence of<br />
rational arbitrage) or of margins less than transfer costs (rational absence of<br />
28 Both the Engle-Granger and the Johansen procedure have been extensively used in the empirical literature<br />
(Miljkovic 1999, p. 132). Bivariate Engle Granger cointegration tests only allow pair wise comparisons, and<br />
require one of the two prices to be designated as exogenous. Also, Banejeree et al. (1986 cited Goodwin<br />
1999, p. 118) raise concerns about the potential for small sample biases in parameter estimates obtained from<br />
such two-steps procedure, and the fact that Engle-Granger testing procedures do not have well-defined<br />
limiting distributions. Hall (1989 cited Goodwin 1999, p. 118) notices that Johansen’s multivariate testing<br />
procedure, on the other side, suggests a maximum likelihood estimation procedure that provides estimates of<br />
all the cointegrating vectors existing among a group of variables. This approach uses test statistics that have<br />
an exact limiting distribution that is function of a single parameter.<br />
29 Baffes (1991), in those cases were cointegration between prices doesn’t apply, finds out that the non<br />
stationarity of freight rates could be a possible explanation for the non stationarity of price differentials.<br />
30 Fackler and Goodwin (2001) note that in some alternative models (such as the switching regime model)<br />
price spreads depend on all the shocks; this means that, in order to ensure cointegration, transport rate<br />
stationarity is not sufficient, but also stationarity in excess demand shock differences is needed.<br />
31 By using a simple point location model, Mc New and Fackler (1997) show that neither efficiency nor<br />
market integration necessarily lead to linearly related prices. They demonstrate that, even when transport<br />
rates are assumed to be stationary, in the case where prices in two regions are not cointegrated (and the<br />
underlying forces affecting supply and demand are not as well) arbitrage alone doesn’t guarantee that prices<br />
exhibit cointegration, even if the LOP holds, especially as transport rates increase in size and volatility. This<br />
means that the arbitrage condition is not strong enough to ensure cointegration. As transport rates increase,<br />
and markets are thus less likely to be integrated, price spreads tend not to be stationary and price<br />
cointegration tends to be lower. They conclude that if we want to test the LOP, we need to know which the<br />
cointegration properties of the autarky prices are, that markets are well integrated and that transport rates are<br />
stationary before we can have faith in cointegration tests.<br />
39
Empirical Tests for Spatial Price Analysis<br />
arbitrage): in both cases there is no efficient exchange between markets, but<br />
cointegration tests identify only the former kind.<br />
Thirdly, Barrett (1996, p.827) notices that cointegration could be consistent<br />
with a negative relationship between prices, whereas market integration suggests a<br />
positive correlation between them. He furthermore notices that many reported<br />
coefficients have magnitudes implausibly far from unity. Moreover, when prices<br />
are expressed in levels, the relation between market prices is of exactly unit slope<br />
if costs are purely additive; if some component is proportional, it might differ<br />
from one (Miljkovic 1999, p.133; the same consideration holds when prices are<br />
expressed in logarithms and transaction costs are instead expected to be a<br />
proportion of them).<br />
Fourthly, trade flow discontinuity could also represent a problem: at the break<br />
points, the relation between prices is indeed zero. And, if demand and supply<br />
forces are themselves cointegrated, prices in two regions could be cointegrated<br />
even in the absence of trade flows. Cointegration models then require continuous<br />
trade and no trade flow reversals. Moreover, since cointegration implies GC in at<br />
least one direction, fully efficient markets should not be cointegrated, or otherwise<br />
there would exist at least one GC relationship between the markets, implying that<br />
profits could be made from using information on past prices to predict present<br />
prices; cointegration is consistent with an interconnected market, but not with a<br />
fully efficient one (Engle and Granger 1987, Granger and Escribano 1987 cited<br />
Dercon and Campenhout 1999, p.7).<br />
A final consideration is that a stable long run margin between markets could be<br />
consistent with monopolistic pricing and other causes of inefficiencies (Faminow<br />
and Benson cited Dercon and Campenhout 1999, p.2).<br />
Despite these shortcomings, to date cointegration has been the most widely<br />
used technique to study market efficiency: tests for cointegration became very<br />
popular methods in LOP studies since Ardeni (1989) argued that “conventional”<br />
LOP tests had disregarded the time series properties of the data, and results were<br />
flawed because of nonstationarity in the data, spurious regressions, erroneous use<br />
of first differences. The cointegration approach has been used so far on a huge<br />
number of empirical works (Goodwin and Fackler 2001); for a table summarizing<br />
the methods and the data used and the results obtained, see annex A. Miljkovic<br />
(1999), presents an interesting critical review.<br />
In the next paragraphs, some issues related to the use of cointegration<br />
techniques for the study of price transmission will be further explored. Paragraph<br />
3.3.1 will deal with unit root tests when used with price series. Then, in paragraph<br />
3.3.2, the different kinds of cointegration models which have been proposed to the<br />
study of price transmission will be briefly presented. Finally, in paragraph 3.3.3,<br />
the empirical evidence will be commented.<br />
40
Empirical Tests for Spatial Price Analysis<br />
3.3.1 Unit root tests applied to price series<br />
Understanding the time series properties of the data is a prerequisite for any<br />
cointegration analysis which, as explained in the previous paragraph, normally<br />
requires the time series to be I(1).<br />
Empirical tests, motivated by a vast literature on unit roots and error correction<br />
models, often find evidence of unit roots in commodity prices, though according<br />
to price theory price series need not have unit roots. Indeed, price theory states<br />
that commodity prices will be auto correlated convergent series, which arises from<br />
the biological nature of commodity production and the storage and arbitrage costs<br />
over time (Wang and Tomek 2007, p.873).<br />
Moreover, the outcome of unit root tests is likely to be affected by a number of<br />
factors, first of all alternate test specifications (Wang and Tomek 2007, p.875).<br />
Augmented Dickey-Fuller (ADF) and Phillips-Perron (PP) unit root tests have low<br />
power against the alternative that the series is stationary; for this reason,<br />
Kwiatkowski, Phillips, Schmidt e Shin (KPPS) tests, having the null hypothesis of<br />
stationarity, can be used as a consistency check, though, often, neither test will<br />
reject (Tomek and Myers 1993, p.189). Wang and Tomek (2007) find that unit<br />
root tests results are sensitive to the test equation specification, and that evidence<br />
favouring unit roots in commodity prices is not strong. Data transformations<br />
(using the series in nominal or in real terms, or in logs) should strictly depend<br />
upon the research questions which are asked. Data frequency also plays a role 32 .<br />
Finally, if the number of lags used for the unit root tests is too small, then the<br />
inference about the existence of a unit root is biased; if is too large, the finite<br />
sample properties of unit root tests are likely to deteriorate, and an inefficient<br />
estimate is obtained.<br />
Structural breaks also represent an important object of analysis. It is well<br />
known that failure to allow for an existing structural break while testing for unit<br />
roots leads to a bias that reduces the ability to reject a (false) unit root null<br />
hypothesis. If a structural break has occurred, but is not modelled in the test<br />
equation, then standard ADF tests will be biased towards non-rejection of the null<br />
hypothesis. For this reason, Perron and Vogelsang (1992) have extended the ADF<br />
specification to allow for possible structural breaks in the time series. They<br />
propose two tests which allow for the existence of one endogenous structural<br />
break both under the null hypothesis of non-stationarity and under the alternative<br />
hypothesis of stationarity. The Additive Outlier (AO) test, by using a dummy<br />
32 Defining the total number of observations as T, which is given by the product between span of the sample S<br />
and the frequency f , the consistency and the power of the tests as f increases depend upon the assumptions on<br />
S. If S is fixed, as f increases the power of tests increases but ultimately levels off. If the assumption of a<br />
fixed S is relaxed, it appears that the frequency of the sample is more important than the number of<br />
observations in determining the power of the test, but this of course assumes a constant structure of the data<br />
generating process, which might not be the case as S increases (Wang and Tomek 2007, p.877).<br />
41
Empirical Tests for Spatial Price Analysis<br />
variable to account for a shift in the mean, assumes that the structural change<br />
occurs at a specific point in time. The Innovational Outlier (IO) model assumes<br />
instead that the change affects the level of the series gradually. The time of the<br />
break is chosen by minimizing the t-statistic associated with the change in mean.<br />
Clemente et al. (1998) extend these tests by allowing for two endogenous changes<br />
in the mean. Zivot and Andrews (1992), on the other side, build a test in which the<br />
break date is selected where the t-statistic of the ADF test for unit root is at<br />
minimum (most negative); consequently, a break date will be chosen were the<br />
evidence is least favourable for the unit root null hypothesis. In this test, on the<br />
other side, the presence of a structural break is not considered under the null<br />
hypothesis; this might lead to the erroneous conclusion that the time series is trend<br />
stationary when in fact it is non-stationary with breaks. Other tests have also been<br />
developed for the case of more than one structural break in the series (for a<br />
review, see Glynn et al. 2007). A concern is that empirical approaches to find<br />
structural changes will result in the unit root hypothesis being falsely rejected, or,<br />
in other words, in finding a spurious structural change. Wang and Tomek (2007,<br />
p.877) suggest that in order to identify structural changes it is advisable to rely on<br />
logic, known causes and timing of the change; a simple inspection of graphs can<br />
then confirm it. As we will see in the next chapters, in the case study presented<br />
here there is clear evidence that at least some policy regime changes did indeed<br />
constitute structural breaks.<br />
3.3.2 Different cointegration techniques<br />
Over the past years, different cointegration models have been developed<br />
towards several directions for the study of price transmission. For example,<br />
threshold cointegration models have been used to represent the fact that prices<br />
show a tendency to return to their long run equilibrium only when price<br />
differentials exceeds a certain threshold, constituted by transaction costs<br />
(Goodwin and Piggott 2001, p.303). In asymmetric cointegration models 33<br />
(Ghoshray 2002), instead, the speed of adjustment to the long run equilibrium is<br />
allowed to vary according to the sign and the magnitude of the variations of the<br />
error correction term. In the next paragraphs (3.3.2.1 and 3.3.2.2), threshold and<br />
asymmetric models will be briefly revised. Cointegration models allowing for<br />
structural breaks affecting the parameters of the cointegration vector have been<br />
developed, too; because they represent an interesting possibility of introducing<br />
policy regime changes in the model, they will be used for the empirical estimates<br />
presented in chapter 6, and are described in detail in paragraph 3.3.2.3.<br />
33 For a survey of asymmetric price transmission models see Meyer and von Craumon-Taubadel, 2004. Also<br />
in this respect, however, cointegration models have gained a prominent place.<br />
42
Empirical Tests for Spatial Price Analysis<br />
3.3.2.1 Threshold models<br />
In threshold cointegration models, the basic assumption is that prices show a<br />
tendency to return to their long run equilibrium only when price differentials<br />
exceed a certain threshold 34 . In other words, when deviations in prices exceed this<br />
“neutral band”, which accounts for transaction costs, a sort of regime switching is<br />
triggered (Goodwin and Piggot 2001, p.303).<br />
Some basic threshold cointegration models used in agricultural commodity<br />
markets studies are the Eq-TAR representation and the Band-TAR representation<br />
(see Balke and Fomby 1997; Brooks et al. 2005; Balcombe et al. 2007).<br />
In the Eq-TAR representation (equation 3.34, where only the error correction<br />
I<br />
term, zt-1, and its adjustment coefficients, α z ) , are presented), when<br />
i<br />
( t−1<br />
deviations from the long run equilibrium, zt, exceed the threshold’s width, λ,<br />
prices are attracted towards the centre of the threshold interval. The subscripts I<br />
and O denote the within and without π adjustment speed.<br />
α (<br />
I<br />
z<br />
i<br />
−1<br />
) t<br />
= π<br />
i,<br />
O<br />
i,<br />
I<br />
z<br />
= π z<br />
t−1<br />
t−1<br />
if<br />
if<br />
z<br />
z<br />
t−1<br />
t−1<br />
> λ<br />
< λ<br />
(3.34)<br />
In general, the speed of adjustment is allowed to differ depending on prices to<br />
be inside or outside the interval; if πi,I collapses to zero, this means that, inside the<br />
band, the price spread will follow a random walk. In other words, this implies that<br />
if the price differential is smaller than the transport costs the arbitrage<br />
mechanisms will not be active and the two series will not be cointegrated; a price<br />
differential smaller than the transport costs will not justify any shipment of the<br />
commodities.<br />
Differently from the Eq-TAR model, in the Band TAR model when prices are<br />
outside the threshold they are attracted to the edge of the threshold band, rather<br />
than to the middle of it. So, the Band -TAR representation is given by equation<br />
(3.35):<br />
34 Threshold models show the difference existing between cointegration and efficient arbitrage: if efficient<br />
arbitrage takes place, unit root behaviour in price margins should be observed (this happens up to and right at<br />
the parity bound); only when imperfect arbitrage takes place we should observe cointegration between the<br />
prices (since cointegration implies GC in at least one direction, profits could be made predicting one with the<br />
past values of the other; Dercon 1999, p.6; see also paragraph 3.3).<br />
43
Empirical Tests for Spatial Price Analysis<br />
44<br />
α<br />
II<br />
i<br />
( z<br />
t−1<br />
)<br />
= π<br />
= π<br />
i,<br />
O<br />
i,<br />
O<br />
= π ( z<br />
i,<br />
I<br />
( z<br />
( z<br />
t−1<br />
t−1<br />
t−1<br />
− λ)<br />
+ λ)<br />
)<br />
if<br />
if<br />
if<br />
z<br />
t−1<br />
z<br />
z<br />
t−1<br />
t−1<br />
< λ<br />
> λ<br />
< −λ<br />
(3.35)<br />
The Eq-TAR and the Band TAR models can be easily put together (Balcombe<br />
2007, p.312),<br />
α<br />
II<br />
i<br />
( z<br />
t−1<br />
)<br />
= π<br />
= π<br />
i,<br />
O<br />
i,<br />
O<br />
= π ( z<br />
i,<br />
I<br />
( z<br />
( z<br />
t−1<br />
t−1<br />
t−1<br />
−ϑλ<br />
)<br />
+ ϑλ)<br />
)<br />
if<br />
z<br />
if<br />
if<br />
t−1<br />
z<br />
z<br />
t−1<br />
t−1<br />
< λ<br />
where ϑ is a constant such that ∈[<br />
0;<br />
1]<br />
> λ<br />
< −λ<br />
(3.36)<br />
ϑ .<br />
Dercon and Campenhout note that threshold error correction models “nest” a<br />
switching regime model and standard cointegration analysis (1999, p.19). In their<br />
work, they link the cointegration version of Ravallion’s model with the switching<br />
regression approach of Baulch’s Parity Bound Model. In an attempt to remove<br />
some of the unrealistic assumptions of both approaches, they note that the Band<br />
Threshold-Autoregression (Band-TAR) model allows for dynamic analysis as<br />
well as for trade discontinuities (and reversing trade flows), and explicitly models<br />
transaction costs.<br />
Testing for threshold effects presents a number of challenges; normally, grid<br />
searches are used to determine the threshold level (both maximizing a likelihood<br />
function or minimizing a sum of squared errors are methodologies which can be<br />
used; Goodwin and Piggott 2001, p. 325).<br />
Empirical evidence confirms that models that explicitly recognize the presence<br />
of thresholds effects imply faster adjustments to deviations from equilibrium than<br />
when threshold behaviour is ignored. Thresholds turn out to be bigger when there<br />
is a bigger distance between markets. Goodwin and Piggott (2001) also estimate a<br />
richer threshold model accounting for asymmetric effects 35 . A shortcoming of<br />
threshold models is that they are not capable of discriminating between<br />
transactions costs and other possible causes of threshold effects, such as structural<br />
breaks and policy shifts.<br />
35 Thresholds could be asymmetric. Positive and negative price shocks will in turn determine an asymmetric<br />
response, since shipment in one direction might be more costly than shipping in the other direction between<br />
two markets if, for example, one is normally importer and the other normally exporter (Goodwin and Piggot<br />
2001, p.309).
Empirical Tests for Spatial Price Analysis<br />
3.3.2.2 Asymmetric adjustment models<br />
The concept of “asymmetry” refers to the fact that adjustment coefficients are<br />
allowed to vary depending on the sign of price differentials. A very intuitive<br />
explanation of why this might be the case is that agents holding market power will<br />
pass-through only (or mostly) positive input changes (Ghoshray 2002).<br />
In dynamic applications, the short-run adjustment term is then substituted by<br />
two separate coefficients indicating the response, respectively, to negative and<br />
positive deviations from the long run equilibrium.<br />
Prakash et al. (2001 cited Conforti 2004, p.9), look at the significance of a<br />
dummy variable accounting for positive residuals in the static regression between<br />
the two price series involved. If this variable is significantly different from zero,<br />
and has a positive sign, transmission is asymmetric, since positive shocks are<br />
passed through faster than the negative ones (Conforti 2004, p.9).<br />
In more sophisticated models, the speed of adjustment is expected to vary<br />
according to either the sign or the variations of price differentials. We start from<br />
the autoregressive model of the VECM error correction term, which we have<br />
indicated as zt. In equation 3.37, rejecting the null hypothesis of no cointegration<br />
(H0: γ = 0) implies that the residuals ωt, are stationary (Ghoshray 2002, p. 304),<br />
Δz = γ z −1 + ω<br />
(3.37)<br />
t<br />
t<br />
t<br />
The Threshold Autoregressive Model (TAR model) can be represented as<br />
Δ t = I t 1 zt<br />
−1 + 1−<br />
I t ) γ 2 zt<br />
−1<br />
z γ ( + ω<br />
(3.38)<br />
where I is the Heaviside indicator, which takes the following form:<br />
I<br />
t<br />
1<br />
=<br />
0<br />
if<br />
if<br />
z<br />
z<br />
t−1<br />
t−1<br />
≥ 0<br />
< 0<br />
t<br />
(3.39)<br />
In this model, the adjustment coefficients are then allowed to vary according to<br />
the sign of the long-term residuals of the cointegration relationship. If the<br />
residuals are positive, the adjustment coefficient will be γ1; if they are negative, it<br />
will be γ2.<br />
The sufficient conditions for the stationarity of zt are γ1 , γ2 < 0.<br />
If for example, -1 < γ1 < γ2 < 0, this means that the negative phase of zt will<br />
tend to be more persistent than the positive phase.<br />
In the Momentum Threshold Autoregressive Model (M-TAR model), the<br />
adjustment coefficients can vary according to the sign of the variations of price<br />
45
Empirical Tests for Spatial Price Analysis<br />
differentials. The Momentum Heaviside indicator function appearing in the 3.38 is<br />
here defined as<br />
46<br />
I<br />
t<br />
1<br />
=<br />
0<br />
if<br />
if<br />
Δz<br />
Δz<br />
t−1<br />
t−1<br />
≥ 0<br />
< 0<br />
(3.40)<br />
If, for example, γ1 < γ2 , then the M-TAR model exhibits little adjustments for<br />
positive variations of the error term, i.e., increases tend to persist but decreases<br />
tend to revert quickly to the attractor.<br />
3.3.2.3 Models with structural breaks<br />
In analogy with unit root testing (see paragraph 3.3.1), disregarding the<br />
presence of structural breaks in the cointegration relation between the series might<br />
lead to erroneously accept the null hypothesis of nonstationarity in their linear<br />
combinations, concluding that they are non cointegrated. Indeed, what happens is<br />
that the cointegration residuals are incorrectly defined as non-stationary, while<br />
instead they are stationary around a broken level or trend.<br />
In some approaches, here mentioned for the sake of completeness and not used<br />
in the remainder of this work, it is instead assumed that the structural break affects<br />
the cointegration rank, r. Barassi and Ghoshray (2007) do this by analyzing<br />
sequences of recursive and rolling likelihood based trace tests allowing for kregime<br />
changes. They test the null hypothesis ( ) r r H o = against the alternative<br />
: 0<br />
H 1 : ( r > r0<br />
) in some. H 1 : ( r > r0<br />
) The time of the break is then unknown.<br />
In other approaches, the structural breaks are instead assumed to affect the<br />
cointegration parameters. In fact, if structural breaks within the individual series<br />
occur, and they do not cancel each other out, cointegration must then be analyzed<br />
in a framework where breaks in the deterministic components are admitted<br />
(Dawson et al. 2006).<br />
Johansen et al. (2000) generalize the standard Johansen cointegration test by<br />
admitting up to two predetermined breaks, and propose a model where breaks in<br />
the deterministic terms are allowed at known points in time. In the so-called<br />
“Johansen, Mosconi and Nielsen” procedure, the sample is divided in q periods,<br />
separated by the occurrence of the structural breaks, where j denotes each period.<br />
The general VECM model, considering only two prices, is:
∆p<br />
+<br />
t<br />
∑<br />
⎡β⎤<br />
' ⎡ p t<br />
= α⎢<br />
µ<br />
⎥ ⎢<br />
⎣ ⎦ ⎣tE<br />
d<br />
m=<br />
1<br />
Θ<br />
m<br />
w<br />
m, t<br />
−1<br />
t−1<br />
+ ε<br />
⎤<br />
⎥ + γE<br />
⎦<br />
t<br />
t<br />
+<br />
∑<br />
k−1<br />
i=<br />
1<br />
Γ ∆p<br />
i<br />
t−i<br />
Empirical Tests for Spatial Price Analysis<br />
+<br />
∑<br />
k<br />
i=<br />
1<br />
∑<br />
q<br />
j=<br />
2<br />
k<br />
i, j<br />
D<br />
j, t+<br />
k −i<br />
+<br />
(3.41)<br />
where k is the lag length of the underlying VAR. Et is a vector of q dummy<br />
variables that take the value 1, i.e E = 1.,<br />
if the observation belongs to the j th<br />
jt<br />
36<br />
period (j = 1, … q), and 0 otherwise; that is, E t = [ E1t<br />
E2t<br />
... Eqt<br />
]' . Dt is an<br />
impulse dummy (with its lagged values) that equals unity if the observation t is<br />
the i th of the j th period, and is included to allow the conditional likelihood function<br />
to be derived given the initial values in each period (for example, if k = 3, impulse<br />
dummies will thereby have the value 1 at t+2, t+1, t, where t is the first<br />
observation of each period); wt are intervention dummies (up to d) included in<br />
order to render the residuals well behaved. The short run parameters are γ (2 X q),<br />
Γ (2 X 2), k (2 X 1) for each j and i, and Θ (2 X 2). εt are assumed to be i.i.d. with<br />
zero mean and symmetric and positive definite variance, Ω.<br />
µ = [ μ1t<br />
μ2t<br />
... μqt<br />
]' is the vector containing the long run drift parameters and<br />
β are the long run coefficients in the cointegrating vector. The cointegration<br />
⎡β⎤<br />
'<br />
hypothesis is formulated by testing the rank of π = α⎢<br />
⎥ ; its asymptotic<br />
⎣µ<br />
⎦<br />
distribution depends on the number of non-stationary relations, the location of<br />
breakpoints and the trend specification.<br />
It should be noticed that this framework includes two models: a first one is<br />
where there are no linear trends in the levels of the endogenous variables and the<br />
first differenced series have a zero mean; the broken level is restricted to the<br />
cointegration space (i.e., γ = 0, and the regime dummies are not multiplied by any<br />
trend in the cointegration vector). In the second case, a broken linear trend is<br />
accounted for in the cointegration vector but any long run linear growth is not<br />
accounted for by the model (i.e., γ ≠0 and t ≠ 0 in the cointegration vector).<br />
An application of the Johansen, Mosconi and Nielsen procedure to agricultural<br />
future and export prices is presented in Dawson et al. (2006) and Dawson and<br />
Sanjuan (2006), and will be used for the empirical analysis in chapter 6 since, as it<br />
will be clear, structural breaks can be a mean of representing the changes in policy<br />
regimes while testing for price transmission.<br />
36 '<br />
For example, if q = 3, i.e. there are two structural breaks, we have t [ E E E ] = [ 1 0 0]<br />
the observations of time t belong to the first period, '<br />
t = [ 0 1 0]<br />
' and E t = [ 0 0 1]<br />
otherwise.<br />
E if<br />
= 1 , t 2,<br />
t 3,<br />
t<br />
E if they belong to the second one,<br />
47
Empirical Tests for Spatial Price Analysis<br />
3.3.3 Cointegration models and price transmission: empirical evidence<br />
As explained before, cointegration techniques soon had an intuitive appeal for<br />
the study of price transmission, since they allow to disentangle short and long run<br />
market dynamics. The LOP is assumed to be valid in the long run despite prices<br />
diverging from it in the short run. For this reason, to date, cointegration has been<br />
one of the most widely used techniques for studying price transmission<br />
mechanisms.<br />
Nevertheless, the empirical evidence is controversial, as the articles reviewed<br />
in annex A show. Here we will just mention a single example, that can be<br />
revealing. In his seminal work, Ardeni (1989) applied for the first time a<br />
cointegration methodology to test if the LOP holds, at least in the long run, for a<br />
number of commodities. He found that, quite uniformly, the LOP fails. But<br />
however, his results were overturned already by Baffes (1991) who, using the<br />
same dataset but a different model specification, found that the LOP was indeed<br />
holding in the markets considered.<br />
There are countless applications of cointegration techniques to the study of<br />
price transmission. Miljkovic (1999, p.131) provides an interesting critical review<br />
of them (see annex A). Also amongst those who investigate soft wheat<br />
international markets, which are relevant to the analysis which will be carried out<br />
in this study, there is mixed empirical evidence.<br />
Ghoshray et al. (2000) investigate 13 export wheat prices, different for origin<br />
and quality, and find that the wheats for human consumption embody a common<br />
price trend, while feed wheats share another one. Thompson and Bohl (1999) find<br />
that domestic German soft wheat prices and US Gulf Dark Northern Spring wheat<br />
prices are indeed cointegrated. Thompson et al. (2002a) use a Seemingly<br />
Unrelated Error Correction Model (SURECM) methodology and find evidence<br />
supporting the validity of the LOP amongst domestic EU prices (France, Germany<br />
and United Kingdom) and US export prices. They also find that price transmission<br />
is positively affected by market liberalization reforms. Verga and Zuppiroli<br />
(2003), on the other side, find that European (Italian and French) soft wheat<br />
markets are strongly cointegrated amongst themselves but not with the US one.<br />
Barassi and Ghoshray (2007) test cointegration with structural change to analyze<br />
the nature of the long-run relationship between US (Soft Red Winter wheat and<br />
Hard Red Winter wheat) and EU wheat export prices. After the breakpoint,<br />
occurred after the Mac Sharry reform of the European Common Agricultural<br />
Policy, the EU price is cointegrated with the US Soft Red Winter wheat price.<br />
Although the differences in the data and methodologies used render this works<br />
not directly comparable to each other, what emerges is a complex picture in which<br />
results are controversial. While soft wheat export prices seem to share a common<br />
trend, this is not the case when European domestic prices are used: the<br />
transmission elasticity with world prices is either zero, or positive, or changing in<br />
48
Empirical Tests for Spatial Price Analysis<br />
time. What we argue is that the presence of border and domestic regulation<br />
policies for the commodity considered (which makes export and domestic prices<br />
for the European Union intrinsically different, as we will see in chapter 4), when<br />
not adequately and explicitly modelled, increases the difficulties in comparing and<br />
assessing the results.<br />
3.4 Problems in empirical models relying on price data<br />
As explained in paragraph 2.3, any study of price transmission ultimately refers<br />
to verifying the validity of the LOP. Empirical evidence is controversial and, in<br />
most cases, the LOP fails. This can be due to the scarce probability for its<br />
hypothesis to hold in practice (paragraph 2.3), but this issue is also strictly<br />
entangled to the underlying hypothesis and properties of the models used, and this<br />
is particularly true if they rely only on price data.<br />
Despite the use, over the past decades, of increasingly sophisticated techniques<br />
(amongst which, the very development of cointegration models represented a<br />
turning point), it is well recognized that none of the approaches described in this<br />
chapter is preferable in all cases, and that inferences should not be based upon a<br />
single test but, if possible, on a variety of inferential techniques. Models’<br />
misspecifications and, more generally, their inherent characteristics, have indeed<br />
been added as an explanation for not finding empirical evidence supporting the<br />
LOP.<br />
What is common to all the empirical approaches which have been revised is<br />
that they basically rely on the use of price data, only, and of transport costs<br />
(normally freight rates) when available. Most of the literature normally uses<br />
traded prices (cost insurance freight, cif, or freight on board, fob) already<br />
converted in US dollars. Price series are usually nominal 37 . As far as exchange<br />
rates are concerned, they are likely to be endogenous only if highly aggregated<br />
data are used, so it is claimed that the appropriate level of disaggregation allows<br />
to treat them as exogenous variables (Richardson 1978; Goodwin et al. 1990;<br />
Mohanty and Langley 2003). Vollrath and Hallahan (2006) propose a “detailed”<br />
LOP model that explicitly accounts for changes in prices due to the exchange rate<br />
(see paragraph 3.2.1). Nevertheless, some attempts of separating prices and<br />
exchange rates have been criticised as too restrictive (Crouhy-Verac et al. 1982<br />
cited Goodwin et al. 1990, p.686).<br />
In all inferential techniques relying only on price data a critical problem is<br />
constituted by transaction costs, which are composed by a variety of elements<br />
which, as seen in the previous paragraph, hardly ever can be exactly addressed.<br />
When tests rely on prices only it is just not possible to separately test the<br />
37 Aldermann (1992), Goodwin et al. (1999) (both, for regional markets of the same country) and Thompson<br />
et al. (2000), use real prices; Thompson and Bohl (1999), and Thompson et al. (2002a), also use deflated<br />
prices but report no differences from the results obtained with the nominal ones.<br />
49
Empirical Tests for Spatial Price Analysis<br />
efficiency hypothesis and the strong assumptions underpinning the model<br />
specifications (Barrett 2001, p.29). Inadequate treatment of these costs becomes<br />
crucial as they increase in size and volatility. Most commonly, quite strong<br />
assumptions are imposed: transaction costs are taken equal to zero, or constant<br />
(when, in linear models, prices are expressed in levels), or as a fixed proportion of<br />
prices (when prices are expressed in logs), and as serially uncorrelated, or, in<br />
cointegration models, stationary. Moreover, some variable costs depend on prices;<br />
so, there is always the problem of correlation between the unmeasured component<br />
of transaction costs, which is included in the error term, and prices (Barrett 2001,<br />
p.23). While it’s worth noting that transport and transaction costs are a problem of<br />
all inferences, we will have to assess their magnitude relative to that of the prices<br />
to see which kind of distortion any assumption on them is likely to cause,<br />
remembering that they can be of a considerable size for agricultural commodities.<br />
Moreover, in models that do not make use of trade data, the LOP should be<br />
interpreted as a test conditional on assumptions regarding trade linkages, since<br />
prices could move together for other reasons than market integration (Fackler and<br />
Goodwin 2001, p.992). Ability to test the null hypothesis of market efficiency is<br />
then severely constrained by data insufficiency (Barrett 2001, p.29).<br />
Barrett (1996, p.825) proposes a hierarchy of all market analysis methods:<br />
those who use only price data (that cannot permit normative inference, Barrett<br />
1996, p.828); those who combine transaction costs and price data; those who<br />
combine trade flows and price data. In fact, trade reveals the expected relative<br />
profitability of market arbitrage; by definition, the observation of trade implies<br />
integration (Barrett 1996, p.827). For linear models relying on price data, only, to<br />
be consistent with efficient arbitrage, trade is assumed to be continuous and<br />
unidirectional 38 .<br />
As reported in paragraph 2.2 (see also paragraph 3.2.3) Barrett (2001, p.19-20)<br />
and Barrett and Li (2002, p.292) claim that traditional analysis typically confuses<br />
two concepts: market integration, which reflects the tradability of products<br />
between spatially distinct markets, irrespective of spatial market equilibrium, and<br />
competitive market equilibrium, in which extraordinary profits are exhausted by<br />
competitive pressures, regardless of physical trade flows. The simple point<br />
location model presented in Fackler and Goodwin (2002), which is highly<br />
stylized, can generate any of the tests proposed by literature; but in interpreting<br />
the results of these so called “market integration” tests (the term “integration”<br />
here refers to the transmission of shocks between prices), the null hypothesis is<br />
that they are both efficient and perfectly integrated. Rejections of the tests are<br />
38 For many products trade is not only discontinuous but reverses direction, often seasonally, or is<br />
contemporaneously bidirectional due to intra-industry trade (in which case the products are not truly<br />
homogeneous and aggregation becomes an issue; Barrett 2001, p. 23). In markets in which transport links<br />
break down in some periods, a linear dynamic regression specification is probably not the most appropriate.<br />
50
Empirical Tests for Spatial Price Analysis<br />
inherently incapable of determining if it is because of inefficiency in an integrated<br />
market or lack of perfect integration (Fackler and Goodwin 2001, p.1008;<br />
p.1016).<br />
Conforti (2004, p.3) notices that the prevailing approach in many papers is<br />
non-structural, and just aims at testing the consistency of the empirical evidence<br />
with the competitive framework, without proposing an explicit behavioural<br />
model; many econometric applications have analyzed mostly the dynamics of<br />
price transmission, while elaborating less from a theoretical point of view. A<br />
structural approach is on the other side more frequent in the analysis of vertical<br />
price transmission.<br />
A final consideration concerns issues related to how policy intervention is dealt<br />
with. Indeed, for agricultural commodities, border and domestic policies are in<br />
many cases expected to play a strong role. But, even if price transmission in<br />
agricultural commodities markets is an issue which has received considerable<br />
attention (Fackler and Goodwin 2001), despite the use of increasingly<br />
sophisticated econometric techniques appropriate concern for policy factors is still<br />
missing.<br />
Some modelling approaches, on the other side, while making explicit use of<br />
policy variables in price transmission equations, still rely on some simplistic<br />
assumptions, like the “small country hypothesis” for the EU in the AGMEMOD<br />
model: the EU is assumed not to have an influence on world prices, which enter<br />
the model exogenously (AGMEMOD Partnership 2007a; 2007b).<br />
Appropriate concern for policy factors seems to be of crucial importance for<br />
some agricultural commodities, as will be clear in chapter 4. The objective of this<br />
work is to develop a consistent theoretical framework explicitly considering<br />
policy variables and policy regimes (chapter 4), while empirical applications will<br />
be provided in chapters 5 and 6.<br />
3.5 Concluding remarks<br />
To test for price co-movement, a variety of empirical methods have been used<br />
as soon as new econometric techniques were developed: simple regression and<br />
correlation analysis, dynamic regression models, switching regime models and<br />
rational expectation models. In particular, amongst the dynamic models,<br />
cointegration techniques soon had an intuitive appeal for the study of price<br />
transmission, as they allow to disentangle short and long run dynamics. These<br />
models have been extensively used and developed towards several directions<br />
(such as the introduction of thresholds, the possibility of asymmetric adjustment,<br />
the introduction of structural breaks).<br />
For agricultural commodities, price transmission mechanisms have been<br />
extensively studied: most works basically aim at verifying whether the LOP holds<br />
51
Empirical Tests for Spatial Price Analysis<br />
between different markets, analyzing the existence of co-movement between<br />
prices in different locations.<br />
However, despite an abundant literature, empirical evidence is nonetheless<br />
mixed. While, on the one side (see paragraph 2.3), the hypothesis needed for the<br />
Law of One Price to hold are quite restrictive and unlikely to hold in practice,<br />
since many factors can prevent prices from convergence, on the other, when<br />
empirical tests rely on prices only, as it is often the case, it is just not possible to<br />
test separately the efficiency hypothesis and the strong assumptions underpinning<br />
the model specifications (Barrett 2001, p.29).<br />
Moreover, for many agricultural commodities, policy intervention strongly<br />
affects international price transmission.<br />
This aspect has not been adequately assessed in most empirical applications;<br />
the introduction of policy variables and policy regimes has often been considered<br />
only marginally. Empirical simulation models, in turn, explicitly consider policy<br />
factors, but they often rely on simplistic assumptions, like the exogeneity of one<br />
of the prices.<br />
To bridge this gap, appropriate techniques should be used to remove these<br />
simplistic hypothesis, while, at the same time, including policy regimes in the<br />
model.<br />
In the remainder of this work, by using cointegration techniques (which allow<br />
to remove the exogeneity hypothesis and to separate short and long run<br />
dynamics), an explicit attempt will then be made at introducing policy regimes by<br />
developing a consistent theoretical framework. Accordingly, different empirical<br />
models will be derived.<br />
52
4 <strong>INTERNATIONAL</strong> SOFT WHEAT MARKETS<br />
<strong>UNDER</strong> POLICY INTERVENTION<br />
4.1 Introduction<br />
In this chapter, a description of what constitutes the case study of this work, i.e.<br />
the international markets for soft wheat, is given. Internationally, wheat is the<br />
most traded commodity; the US and the EU are amongst the major exporting<br />
countries.<br />
Agricultural markets are often subject to considerable policy intervention. For<br />
soft wheat, Ghoshray et al. (2000, p.3) point out that policy regimes play a<br />
significant role in production and export shares. The EU Common Agricultural<br />
Policy (CAP) is a case in point, since thanks to its measures during the 1980s the<br />
EU emerged as the second largest exporter of wheat, having previously been a net<br />
importer.<br />
At the multilateral level, the Uruguay Round Agreement on Agriculture of the<br />
World Trade Organization represents the first attempt of implementing a<br />
multilateral trade agreement specifically related to agriculture, setting common<br />
provisions for all the member countries.<br />
A detailed description of all these policy measures will make clear the need for<br />
taking in due account policy intervention when testing for price transmission. This<br />
has often not been the case, which might explain a very mixed empirical evidence.<br />
For this reason, a consistent theoretical framework will be developed, which<br />
stems from the one outlined in chapter 2, but tries to extend it towards the<br />
inclusion of policy regimes.<br />
It will be this framework which will be used to develop the empirical models<br />
presented in chapters 5 and 6.<br />
Chapter 4 then represents a connection between the first two ones, where,<br />
respectively, the basic concepts necessary for the study of price transmission and<br />
the empirical models used in the relevant literature have been revised, and the
International Soft Wheat Markets Under Policy Intervention<br />
following two, devoted to the results of the empirical analysis after an alternative<br />
theoretical framework has been proposed.<br />
The chapter is structured as follows. In paragraph 4.2, an introductory<br />
overview of the world wheat market is given, by describing international trade<br />
flows (paragraph 4.2.1), and by explaining the functioning of EU domestic and<br />
border policies for soft wheat, together with the implementation of the Uruguay<br />
Round Agreement on Agriculture of the World Trade Organization (paragraph<br />
4.2.2). In paragraph 4.3, a theoretical framework accounting for policy regimes is<br />
developed, in order to test for international price transmission by considering the<br />
relevant policy measures. In paragraph 4.4, the data for the empirical analysis are<br />
presented together with some considerations on product homogeneity, price<br />
leadership, assumptions concerning transport costs. Paragraph 4.5 concludes.<br />
4.2 Trade flows and policies in international wheat markets<br />
This work aims at introducing policy variables in cointegration models for the<br />
study of international price transmission. The case study is constituted by soft<br />
wheat markets in the years 1978-2003. We expect both domestic EU policies and<br />
the ones related to international trade agreements to have significantly affected<br />
price transmission. To explain why is this the case, a general overview of the<br />
functioning of international soft wheat markets, as well as of the relevant policy<br />
measures in place, will be given.<br />
In paragraph 4.2.1, the data concerning the world wheat trade over the past 50<br />
years are analyzed; in paragraph 4.2.2, EU and international policy measures are<br />
described. They are relevant both to the elaboration of a consistent theoretical<br />
framework introducing policy regimes while testing for price transmission (which<br />
is the object of paragraph 4.3) and to the empirical analysis which will be<br />
performed in chapters 5 and 6.<br />
4.2.1 International soft wheat markets: an overview<br />
Wheat is a food product which is produced and/or consumed in almost every<br />
country in the world. It is a temperate product, grown both in the Northern<br />
hemisphere, where the harvest occurs in June to October, and in the Southern<br />
Hemisphere, where it is November to January (Ghoshray 2002, p.301).<br />
Soft wheat is a heavily traded commodity; in fact, wheat dominates<br />
international cereals exports (Faostat 2004). The main exporting countries are<br />
Argentina, Australia, Canada, United States (US) and the European Union (EU);<br />
in most years, together they account for more than 80% of world wheat exports<br />
(Faostat 2007; see figure 4.1, 4.2 and 4.3). Algeria, Brazil, Egypt, Japan and the<br />
EU have been some of the biggest importers in the past years, although the import<br />
54
International Soft Wheat Markets Under Policy Intervention<br />
demand is much less concentrated than the export supply (USDA 2005, p.10; see<br />
figure 4.4).<br />
The EU is a major player, being amongst both the largest exporters and the<br />
largest importers; but to whom the “price leadership” on world wheat markets<br />
belongs is an open question, to which empirical works have given different<br />
answers. Amongst the five world major players (Argentina, Australia, Canada, the<br />
EU and the US), Mohanty et al. (1999) show that there is no distinct leader 39 .<br />
However, in this work, the US price will be assumed to be representative of the<br />
world one. This seems a reasonable assumption; since 1975-76, the US share of<br />
global exports has fluctuated between 25 and 45 percent of the world total (USDA<br />
2005, p.8; figure 4.2).<br />
50.000<br />
40.000<br />
30.000<br />
20.000<br />
10.000<br />
0<br />
1961<br />
1963<br />
1965<br />
1967<br />
Figure 4.1 World wheat exports (1000 tonnes)<br />
1969<br />
1971<br />
1973<br />
1975<br />
1977<br />
1979<br />
1981<br />
Source: Faostat 2007<br />
39 They find out that, while the US price is affected by the Canadian and the Australian prices only, the EU<br />
responds to US and Canadian changes but doesn’t have any influence on their prices. The EU responds to the<br />
US, but the reverse is not true. Previous studies (see Mohanty et al. 1999), some of which could be<br />
misspecified for not taking into account cointegration) get different results: some show that there is no<br />
significant leadership role between the US and Canada, while others find a strong leadership role for Canada<br />
for durum and Hard Red Spring markets. Goodwin and Schroeder (1991) find that both the US and Canada<br />
have a significant effect on the price of competing exporters but also that, while the US has an effect on<br />
Canada, the reverse is not true; they consider the US as a price leader in the international wheat market.<br />
Dawson and Sanjuan (2007) find that Canada is the price leader in the relation with the US price for hard<br />
wheats. In Ghoshray and Lyoid (2003) Canada is found to be the price leader in the North American market<br />
for hard wheat exports.<br />
1983<br />
1985<br />
Russian Federation Ukraine Argentina<br />
Australia Canada US<br />
EU<br />
1987<br />
1989<br />
1991<br />
1993<br />
1995<br />
1997<br />
1999<br />
2001<br />
2003<br />
2005<br />
55
International Soft Wheat Markets Under Policy Intervention<br />
100%<br />
80%<br />
60%<br />
40%<br />
20%<br />
56<br />
0%<br />
60%<br />
50%<br />
40%<br />
30%<br />
20%<br />
10%<br />
0%<br />
1961<br />
1961<br />
1963<br />
1963<br />
1965<br />
Figure 4.2 World wheat exports (share of the world total)<br />
1967<br />
1969<br />
1971<br />
1973<br />
1975<br />
Source: Faostat 2007<br />
1977<br />
1979<br />
1981<br />
Source: Faostat 2007<br />
Figure 4.3 World wheat exports (cumulated share of the world total)<br />
1965<br />
1967<br />
1969<br />
1971<br />
1983<br />
1985<br />
1987<br />
Source: Faostat 2007<br />
1989<br />
1991<br />
1993<br />
Argentina Australia Canada<br />
US EU<br />
1973<br />
1975<br />
1977<br />
1979<br />
1981<br />
1983<br />
1985<br />
1987<br />
1989<br />
1991<br />
1993<br />
Argentina Australia Canada<br />
US EU World = 100%<br />
1995<br />
1995<br />
1997<br />
1997<br />
1999<br />
1999<br />
2001<br />
2001<br />
2003<br />
2003<br />
2005<br />
2005
30.000<br />
20.000<br />
10.000<br />
0<br />
1961<br />
1963<br />
1965<br />
1967<br />
1969<br />
International Soft Wheat Markets Under Policy Intervention<br />
Figure 4.4 World wheat imports (1000 tonnes)<br />
1971<br />
1973<br />
1975<br />
1977<br />
1979<br />
1981<br />
Source: Faostat 2007<br />
In general, in the past century, we expect commodities’ price linkages to have<br />
improved for a number of reasons. Bukenya and Labys (2005, p. 302) mention the<br />
gains in information technology which have improved the dissemination of<br />
demand and supply conditions across markets; in some cases (e.g. metals), the<br />
centralization of the commodity markets; the increased coordination between<br />
central bank activities; the greater congruency between national and international<br />
business cycles; the improved liberalization.<br />
However, it is well known that agricultural markets are often subject to<br />
considerable policy intervention. This creates a gap between world and domestic<br />
prices, and generates cross-country variations (Mundlak and Larson 1992, p. 399).<br />
In the case of soft wheat, Ghoshray et al. (2000, p.3) point out that policy<br />
regimes play a significant role in production and export shares. To this respect,<br />
the EU Common Agricultural Policy is a case in point, since thanks to its<br />
measures, during the 1980s, the EU emerged as the second largest exporter of<br />
wheat, having previously been a net importer (as it is shown in figures 4.5 and<br />
4.6). In general, also other governments have a role in developing strategic<br />
responses 40 (Ghoshray 2002): for example, Canadian and Australian Wheat<br />
40 Due to product differentiation, market concentration (it is dominated by 5 major exporters) and government<br />
intervention, the world wheat market has also been considered as imperfectly competitive. For example,<br />
Ghoshray (2002) uses cointegration models allowing for asymmetric adjustments, assuming that prices will<br />
respond more quickly to others’ prices increases than decreases.<br />
1983<br />
1985<br />
1987<br />
1989<br />
1991<br />
1993<br />
Algeria Brazil Egypt<br />
Japan European Union 27<br />
1995<br />
1997<br />
1999<br />
2001<br />
2003<br />
2005<br />
57
International Soft Wheat Markets Under Policy Intervention<br />
Boards, the marketing institutions of these countries, are responsible for most of<br />
their exports; US and EU policy actions, which will be examined later on in this<br />
paragraph, are very likely to have an influence on each other’s agricultural<br />
policies as well as on world market prices (Barassi and Ghoshray 2007, p.79).<br />
40.000<br />
30.000<br />
20.000<br />
10.000<br />
58<br />
0<br />
6.000.000<br />
5.000.000<br />
4.000.000<br />
3.000.000<br />
2.000.000<br />
1.000.000<br />
1961<br />
0<br />
1961<br />
1966<br />
1966<br />
Figure 4.5 EU wheat imports and exports (.000 tonnes)<br />
1971<br />
1976<br />
1981<br />
1986<br />
Source: Faostat 2007<br />
Figure 4.6 EU wheat imports and exports (.000 dollars)<br />
1971<br />
1976<br />
1981<br />
1986<br />
1991<br />
1991<br />
Source: Faostat 2007<br />
1996<br />
1996<br />
2001<br />
2001<br />
Imports Quantity<br />
Exports Quantity<br />
Imports Value<br />
Exports Value
International Soft Wheat Markets Under Policy Intervention<br />
4.2.2 European and international trade policies for soft wheat<br />
In order to understand how the CAP is likely to have influenced international<br />
price transmission mechanisms, a short description of its main instruments, as<br />
well as an examination of the major changes it underwent in the past 30 years, are<br />
necessary. Indeed, the CAP has evolved considerably, moving from a heavy<br />
market regulation policy to the use of less distortive instruments, due to various<br />
forces which have contributed to make it go towards the direction most third<br />
countries desired (Anania 2007b, p. 1). These factors were concerns regarding its<br />
increasing financial costs and the competition with other sectors in the EU budget<br />
allocation, but also the growing exploitation of natural resources implied by<br />
supply-supporting policies, their inadequacy to the new needs of agricultural and<br />
rural areas (such as the protection of the environment), and the growing<br />
international pressure. All these reasons, over the years and especially in the past<br />
decade, caused an increasing share of the total expenditure to be removed from<br />
aids coupled to production, and from market intervention, and then allocated to<br />
decoupled aids, i.e. subsidies not requiring production but only eligible land,<br />
provided the respect of the environmental cross-compliance.<br />
In this reform process, which is still underway, some major periods can be<br />
identified (Thompson 1999, p.5):<br />
1971:01-1988:6 These years are characterized by the full functioning of the socalled<br />
Common Market Organizations (CMOs), that regulated the markets of<br />
various agricultural products. If necessary, to ensure that domestic prices never<br />
fell below the minimum guaranteed price on the domestic market (called<br />
“intervention price”), the European Commission, by means of private or public<br />
stockholding, would implement the withdrawal from the market of the excess<br />
supply. When not stocked, transformed, destroyed or even delivered through<br />
public nutrition programmes, the excess supply would be sold in international<br />
markets with “export refunds” paid to exporters, meant to cover at least the<br />
difference between the intervention and the world price 41 . To restrict imports<br />
(otherwise, intervention prices above the world price would result in large inflows<br />
of product and unsustainably high stocks levels), “variable levies” were set as the<br />
difference between the world price and the so called “entry price”. The price on<br />
the internal market was then bounded between the intervention price and the entry<br />
price (figure 4.7). Since intervention prices were constantly set above what would<br />
have been the market equilibrium prices this system caused, in the 1980s,<br />
41 Actually, export subsidies are calculated as the difference between a current domestic EU price and the<br />
world one. However, to be effective, in theory, export refunds have to cover at least the difference between<br />
the intervention price -the minimum guaranteed price on the EU market- and the world one. For the sake of<br />
simplicity, this is what is assumed henceforth.<br />
59
International Soft Wheat Markets Under Policy Intervention<br />
surpluses growth and budgetary costs escalation. On world markets, the EU<br />
emerged as a net exporter having previously been a net importer.<br />
1988:07-1993:06 First CMO reforms concerning arable crops were put in<br />
place. New measures aimed at reducing the production surpluses and the<br />
budgetary costs were introduced, such as co-responsibility levies (deductions from<br />
farmers to pay for the cost of surplus production), stabilizers (if production<br />
exceeded a maximum guaranteed quantity, co-responsibility would increase and<br />
intervention prices would be reduced the following year), and voluntary set-aside<br />
for cereals.<br />
1993:07-2000:06 Implemented in July, 1993, the MacSharry reform is the first<br />
structural change of the CAP. In fact, the small effects of the reforms already<br />
implemented made necessary the introduction of new policy measures with the<br />
objective of ensuring a progressive return to market mechanisms. The MacSharry<br />
reform represents the first move from a consumer financed (through high prices)<br />
to a taxpayers financed regime (through compensatory transfers; Thompson and<br />
Bohl 2002, p.7). The main concerns for EU policy makers concerning the grain<br />
sector included high growth in output relative to growth in demand, increase in<br />
export subsidies and stocks, and rising cost of the programmes (Mahe 1996, p.<br />
1316). It has been argued that the changes of the 1992 CAP reform essentially<br />
apply to the grain sector and, to a lesser extent, to the beef sector (Mahe 1996, p.<br />
1317); the reason lies in the pressure put by the US and other competitors in the<br />
Uruguay Round Agreement on Agriculture (URAA) on the EU in a sector<br />
characterized by major policy interdependencies.<br />
With the MacSharry reform, for grains, substantial cuts in intervention prices<br />
were implemented (-30% over a three year period) to re-align them with the world<br />
prices; compensations to farmers through direct subsidies per hectare were put in<br />
place. Set aside requirements were established for producers of more than 92<br />
tonnes 42 .<br />
Due to the decrease in intervention prices, which became closer to the world<br />
ones, both variable levies and export subsidies were reduced; however, this “old”<br />
system, on the other side, kept on insulating the EU market from the world one.<br />
2000:06- … The Agenda 2000 reform continued along the path undertaken in<br />
1992. Both a 15% reduction in two years of the intervention price for cereals and<br />
the introduction of decoupled payments were decided. The set-aside regime<br />
remained in force, too. In 2003, the Fischler reform, which was meant to be the<br />
“Mid Term Review” of Agenda 2000, turned out to be, instead, the most<br />
important single step 43 in the reform process of the CAP (Anania 2007b, p. 1). It<br />
42<br />
Those producers owning an agricultural area capable of producing more than 92 tonnes of product,<br />
according to local average yields.<br />
43<br />
Agenda 2000 and the Fischler Reform are put together despite the much bigger impact of the latter due to<br />
the lack of data in the most recent years.<br />
60
International Soft Wheat Markets Under Policy Intervention<br />
introduced “fully decoupled” support for most of the CAP payments (this is<br />
expected to have a bigger impact in terms of the reduction of the distortionary<br />
effects of the CAP than in terms of the reduction in farm support; Anania 2007, p.<br />
4). All sectors untouched by the reform have undergone, or are currently<br />
undergoing, similar changes. As far as market regulations for wheat are<br />
concerned, intervention prices were not further reduced, but the monthly seasonal<br />
adjustments applied to them were halved.<br />
Figure 4.7 The Common Market Organization for cereals<br />
Variable levy<br />
Export subsidy<br />
Export tax<br />
EU internal price<br />
World price<br />
Indicative price<br />
Entry price<br />
Intervention price<br />
EU trade policies for soft wheat did elicit responses from other countries. In<br />
1985, the US retaliated to the EU heavy use of export refunds with the Export<br />
Enhancement Program (EEP), a targeted export subsidy program for wheat. But<br />
the EEP didn’t alter substantially the EU-US price relationship, since, after its<br />
introduction, the EU might well have set its export subsidies in relation to US<br />
prices 44 (Mohanty et al. 1999, p.27). In practice, the EEP has not been used after<br />
August 1995. Tight world supplies and high world prices implied that the EU<br />
didn’t use export refunds than to a very limited extent, and the US didn’t reactivate<br />
the EEP (Barassi and Ghoshray 2007, p.79).<br />
Moving to agricultural trade agreements, the most relevant event in the period<br />
examined has been the institution of the World Trade Organization (WTO) in<br />
44 Brooks et al. (1990) show that also the impact of the EEP on other exporters’ wheat trade and importers’<br />
demand has been small relative to the magnitude of total EEP sales: over the period 1986-1989, the<br />
displacement of sales ranged from 87% to 92%, while additional exports were only 8% to 13% of the total.<br />
e<br />
tim<br />
61
International Soft Wheat Markets Under Policy Intervention<br />
1995, and the following implementation of the URAA, the first multilateral<br />
agreement explicitly referred to agriculture.<br />
The URAA regulates both domestic support and export subsidies. For the first,<br />
the EU always kept a safe margin with respect to the maximum ceilings allowed<br />
for distorsive support; for the latter, the limits established for wheat were never<br />
binding for the EU (Anania 2007b).<br />
As far as market access is concerned, the URAA abolished the possibility of<br />
keeping threshold prices and variable levies; with the “tariffication”, all border<br />
measures were converted into import duties to be lowered in the following six<br />
years 45 . The EU has then consolidated the duties for cereals under the General<br />
Agreement on Tariffs and Trade (GATT) agreement.<br />
However, some modifications were introduced in the so-called Blair House<br />
Agreement between the EU and the US. Due to the high levels of protections in<br />
the reference period chosen for the tariffication (the years 1986-1988), with regard<br />
to the main cereals, the tariff equivalents notified at the WTO were so high that a<br />
system for restricting duties was deemed necessary for the EU, in order to put a<br />
ceiling on the import entry price. The import entry price was then capped at 155%<br />
of the intervention price, if the sum of the duties would make it go above this<br />
threshold. The entry price turned out to be almost always capped, thus eliminating<br />
any real difference between the old variable levy system and the new one (see<br />
table 4.1)<br />
62<br />
Table 4.1 Elements for calculating the duty on cereals<br />
Import duty = 155% intervention price – cif reference price<br />
cif reference price = average US quotation for the reference variety during the receding two weeks<br />
+ Gulf premium or Great Lakes premium*<br />
+ Gulf Rotterdam or Great Lakes-Rotterdam freight premium*<br />
Intervention price = price in force including monthly increases at the time the duty is applied.<br />
There are five different wheat categories for which import duties are established. For all of these categories a<br />
US price is used to calculate the reference price. The duties are set every two weeks.<br />
*The first freight premium corresponds to the cost of freight across the United States to the Gulf (“Gulf<br />
premium”) if the commodity is quoted in Chicago or Kansas City, or to the Great Lakes (“Great Lakes”<br />
premium) if the commodity is quoted in Minneapolis. The second freight premium corresponds to freight<br />
from the United States (Gulf or Great Lakes) to the port of Rotterdam in the Netherlands. The day’s exchange<br />
rate is used for conversion.<br />
Source: Gallezot 2007, p.16<br />
45 The reduction agreed was 36%, with a minimum reduction of 15% for each “8 digit” product of the<br />
Harmonized System codification; for agriculture, customs duties are for the most part specific duties, i.e.,<br />
expressed in euro/t.
International Soft Wheat Markets Under Policy Intervention<br />
Both the changes in the CAP and those implied by the URAA implementation<br />
are likely to have deeply affected international price transmission for soft wheat.<br />
Summing up, it is fairly clear that in the past thirty years the EU price has<br />
somehow been “isolated” from world markets, bounded from below by the<br />
intervention price (export subsidies 46 are meant to cover the difference between<br />
domestic prices and the world ones) and from above by a variable levy and,<br />
afterwards, by the “155% rule” established during the URAA. The most relevant<br />
EU trade policies for cereals are then export refunds and variable levies, with the<br />
objective of ensuring the maintenance of high prices on domestic markets.<br />
In addition to the CAP reforms and the URAA, to the analysis that will follow,<br />
at least another event is worth of mention. Rather awkwardly, in 2002, unusual<br />
circumstances on world markets caused the EU price to be quite low despite the<br />
peak in US prices. This can be explained by the way EU import duties are<br />
calculated (Binfield 2002; Morgan 2003). In a nutshell, the shortages of milling<br />
quality wheat, due to poor harvests in US, Canada and Australia, had resulted in<br />
an increase of the US price for wheat. Since this price is used as the reference<br />
price to calculate EU import duties, the duties had fallen to zero. At the same<br />
time, large crops in Russia and the Ukraine increased the supply of feed quality<br />
wheat, that could enter the EU duty free. In practice, due to the lack of an import<br />
duty, and thanks to their proximity, Russian and Ukrainian wheat exports could<br />
enter into the EU at prices lower than domestic EU wheat prices, depressing them.<br />
The EU reckoned the situation as serious enough to change the EU protection<br />
system for cereals: on January 1, 2003, a Tariff Rate Quota (TRQ) of less than 3.0<br />
Mt 47 was introduced for medium and low quality grains that are not traditionally<br />
imported in the EU from the US or Canada (the EU’s major grain trading partners<br />
that are part of the WTO). The situation is then unlikely to occur again.<br />
In the very last years, commodity world markets have been characterized by<br />
soaring food prices because of both transitory (like adverse meteorological<br />
conditions) and structural factors (like the increasing food demand from emerging<br />
economies; the growing energy costs; the biofuels demand which creates a<br />
pressure on crops production; the reduction in stocks due to policy reforms in<br />
developed countries; FAO 2008).<br />
Even if their treatment goes beyond the scope of this work, it must be noticed<br />
that high food prices stimulated a renewed debate on the appropriateness of<br />
market intervention policies, already going on in the so-called CAP “Health<br />
Check” discussion in the EU (European Commission COM(207) 722, and<br />
COM(2008) 306/4), which should be concluded by the end of 2008 and will set<br />
the new rules to regulate the agricultural sector up to 2013. Substantial cutbacks<br />
46 For short periods of time, usually no more than a few months, when world prices were substantially higher<br />
than internal prices, export taxes have also been used.<br />
47 The in-quota tariff was set at euro 12/t; the after quota tariff was set at euro 95/t.<br />
63
International Soft Wheat Markets Under Policy Intervention<br />
of the intervention system are currently being considered, which the Commission<br />
basically propose to function only as a “safety net” and only for soft wheat.<br />
Within this debate, an analysis of the effects that EU intervention policies have<br />
had on international price transmission is crucial. It is clear that their appropriate<br />
assessment requires adequate instruments of analysis.<br />
At the same time, dramatic changes have occurred in international commercial<br />
policy: the World Bank and FAO estimates that almost 50 countries have put in<br />
place emergency measures to confront the rise in food prices 48 .<br />
For example, as a reaction to tight world markets and record high prices for<br />
cereals, the EU has decided to suspend import duties on cereals 49 for the whole<br />
2007/2008 marketing year (Reg CE 1/2008); to date, it has been decided that the<br />
suspension will hold up to the end of the 2008/2009 campaign (June 30, 2009)<br />
unless market conditions justify their reintroduction before its end.<br />
In turn, large exporters (such as Argentina, Russia, and Ukraine) have imposed<br />
taxes on wheat exports, with the same objective of controlling internal prices.<br />
The evaluation of the impact of such measures on price transmission makes<br />
clear the need of an appropriate theoretical framework for the analysis.<br />
However, how much of the rise in agricultural prices is due to short-run<br />
factors, or to speculative behaviour, or to a real structural break in their long-run<br />
downward trend, as well as which effect this is going to cause on international<br />
trade policies (whether a rise in protectionism, or, less likely, an increased<br />
liberalization), remain open questions.<br />
4.3 Policy variables and price transmission: a theoretical framework<br />
On the basis of the general overview given in paragraph 4.2.2, it is clear that,<br />
given that the policy actions have a significant role in the world soft wheat<br />
market, policy variables, and policy regimes, will need to be adequately<br />
considered while investigating price transmission.<br />
Despite the fact that the role played by policy barriers in influencing price<br />
transmission is well recognized by the existing literature, as anticipated in chapter<br />
3, in empirical estimates for agricultural commodities this is often not the case,<br />
whereas econometric models often make use of policy variables but, in turn,<br />
disregarding the time series properties of the data and making sometimes<br />
simplistic assumptions (AGMEMOD Partnership 2007a; 2007b).<br />
Here, within the theoretical framework for price transmission presented in<br />
chapter 2, the explicit introduction of policy variables is proposed. The<br />
development of a sound and consistent theoretical framework will then be<br />
48 See http://www.fao.org/giews/english/policy/index.htm for a scheme of the various measures in place.<br />
49 All cereals expect oats, buckwheat and millet. Due to modest harvests in 2007, and low stocks, in<br />
2007/2008 the EU has become a net importer.<br />
64
International Soft Wheat Markets Under Policy Intervention<br />
completed by the elaboration of various empirical models, all with specific<br />
reference to cointegration models (which have been dealt with in paragraph 3.3),<br />
that will be used in the analysis which will follow in chapters 5 and 6.<br />
Following the existing literature (for example, Thompson and Bohl 1999,<br />
Thompson et al. 2000, Thompson et al. 2002a and 2002b, Verga and Zuppiroli<br />
2003), we will assume that the LOP hypothesis do apply on international soft<br />
wheat markets, and on this basis we will try and focus on the effects of policy<br />
intervention. In a certain way, our main hypothesis is then that the LOP holds but<br />
for policy intervention.<br />
As explained in the previous paragraphs, analyzing how policy regimes affect<br />
international price transmission is a crucial issue. This analysis assumes particular<br />
relevance in light of the ongoing policy debate concerning the viability and the<br />
effectiveness of intervention policies on agricultural commodity markets.<br />
The fundamental problem to tackle is the following one. Despite the fact that<br />
EU domestic and border policies aimed at insulating domestic markets from the<br />
world ones have, in practice, always been in place, we nonetheless aim at building<br />
a sensible framework to test for co-movement between EU domestic prices and<br />
the world ones. Indeed, because of trade barriers (namely, import variable levies<br />
and export restitutions), we expect domestic EU prices to be isolated from the<br />
world ones 50 ; while, in turn, we suppose that EU export (i.e., freight on board,<br />
fob) prices are cointegrated with the world ones right because of the use of export<br />
restitutions (Barassi and Ghoshray 2007; Ghoshray 2002; Ghoshray et al. 2000).<br />
In fact, export subsidies are set with the objective of making EU exports<br />
competitive on world markets, bridging the gap between the internal (high) price<br />
and the world one.<br />
Basically, different price transmission mechanisms will be in place according<br />
to the various combinations of the domestic and border policies described in the<br />
previous paragraph. A simple scheme is reported in table 4.2.<br />
Intuitively, since in the period covered by the analysis the EU is a net<br />
exporter 51 (figures 4.5 ad 4.6) we expect that what occurs on the export side is<br />
more relevant to the analysis. We could think that the EU price will interact with<br />
the world one only if it is high enough to make export restitutions go to zero; i.e.,<br />
at least higher than the intervention price.<br />
50 Van Meijil and van Tongeren (2002, p. 457) model the European market price as a weighted average of the<br />
entry and the intervention price, depending on the entity of net exports. The more the net exports, the closer<br />
the market price to the intervention one, and the other way round.<br />
51 This is true also for France, whose price will be assumed to be the representative price for the EU. Its selfsufficiency<br />
rate for soft wheat, between 1978 and 2000, was on average 218%, with a minimum of 168% and<br />
a maximum of 277% (Eurostat).<br />
65
International Soft Wheat Markets Under Policy Intervention<br />
66<br />
Table 4.2 Summary of the relationships between domestic EU and world prices.<br />
Trade position<br />
Import side<br />
Relevant price for<br />
EU price formation<br />
Pre - URAA world price < entry price entry price<br />
world price > entry price world price<br />
Post - URAA world price plus tariff < 155% intervention price<br />
Export side<br />
world price < intervention price<br />
(export restitutions are paid)<br />
(almost never the case)<br />
world price plus tariff<br />
world price plus tariff > 155% intervention price 155% intervention price<br />
world price > 155% intervention price world price<br />
intervention price<br />
world price > intervention price world price<br />
Going back to table 4.2, on the import side, the domestic EU price will follow<br />
the world one only if the world price is high enough to make the variable levy go<br />
to zero, deactivating the border protection mechanism; otherwise, it will follow<br />
the entry price. After 1995, the functioning of the mechanisms is slightly more<br />
complicated, but analogous. If the world price plus tariff is below the 155% of the<br />
intervention price, then “pure tariffication” would apply, and the EU price would<br />
follow the world price plus tariff: but this was actually never the case (Gallezot<br />
2007, p.16). Instead, what normally happens is that the world price plus tariff<br />
exceeds 155% of the intervention price; according to the “155% rule”, the 155%<br />
of the intervention price acts as an entry price, and a variable levy covering the<br />
difference between the world price and the 155% of the intervention price is in<br />
place. We expect the EU price to be related to such an entry price. Should the<br />
world price be higher than 155% of the intervention price, then we would expect<br />
the variable levy to go to zero and the EU price to follow the world one.<br />
On the export side, thanks to export subsidies 52 , we can assume that the<br />
domestic EU price follows the highest between the intervention and the world<br />
price. The intervention price operates as a threshold below which the world price<br />
becomes inactive. If the world price is below the intervention price, indeed, export<br />
restitutions will prevent the EU price from falling; only if the world price is above<br />
the intervention price export restitutions will go to zero, and the EU price can be<br />
assumed to interact with the world market one.<br />
52 For the sake of simplicity, as they were never binding for the EU, we don’t consider WTO limits on export<br />
subsidies.
International Soft Wheat Markets Under Policy Intervention<br />
Summing up, on the import side the entry price is the threshold above which<br />
there is co-movement between the EU and the world price, while on the export<br />
side we might think that it is the intervention price that performs as such 53 . Since<br />
the first condition is more restrictive 54 , only if the world price is above both the<br />
intervention and the entry price we expect that it positively interact (or,<br />
analogously, is cointegrated) with the European one, because of the annulment of<br />
both export restitutions and import variable levies. Nevertheless, in this case we<br />
would end testing for the presence of co-movement between the EU price and the<br />
entry one, since, in practice, the world price was above the entry price only for a<br />
very short number of months 55 . In practice, the entry and the intervention price are<br />
very correlated, and proportional after 1995 because of the “155% rule”. Testing<br />
for cointegration between the European and the entry price would then be equal,<br />
but for a constant term, to testing for cointegration between the European and the<br />
intervention price.<br />
We might instead verify whether the EU price positively interact with the<br />
world one also when the latter is below the entry price but above the intervention<br />
one, a situation which occurred especially from the MacSharry reform onwards.<br />
The intervention price (which can be seen as the very basic instrument of EU<br />
agricultural market policy in the past 56 ) is a threshold under which the world price<br />
has no influence on the intervention price.<br />
In this way, we are implicitly identifying two regimes: if the world price is<br />
below the intervention one, then the intervention mechanism is in place, and we<br />
expect the EU price to follow the behaviour of the intervention one. If, in turn, the<br />
world price is above the intervention price, we might think that the EU price is<br />
free to follow the behaviour of the world one, provided export taxes will not<br />
eventually prevent him from rising too much.<br />
In chapter 5, within this simple theoretical framework, different analytical<br />
models will be developed. They still are cointegration models aimed at testing for<br />
price co-movement (basically, the LOP validity), but at the same time provide<br />
alternative schemes for the analysis of price transmission in international markets<br />
accounting for policy regime changes.<br />
53 Actually, if both “thresholds” are binding (the word price is below them), the price transmission elasticity<br />
of the world to the EU price is zero; but the one from the intervention price to the world one is negative. In<br />
fact, the entry price and the export restitutions prevent the world price from affecting the EU price, but if the<br />
intervention (and then, the entry) price goes up, it will lower the world price through an increased export<br />
supply (Thompson 2000, p.720). We won’t consider this case in this analysis, since our objective it to verify<br />
whether, under certain conditions, there is co-movement between the EU and the world price, or in other<br />
words, a positive price transmission elasticity exists.<br />
54 The entry price is by definition higher than the intervention price.<br />
55 In this analysis, 14 months over 25 years.<br />
56 In fact, it is basically from the intervention price that other domestic and commercial policy measures<br />
(export restitutions, entry prices and then import variable levies) are established.<br />
67
International Soft Wheat Markets Under Policy Intervention<br />
To the author’s knowledge, to date no such attempts have been made. Policy<br />
regimes have been accounted for in the revised literature by inserting dummy<br />
variables in linear regressions, which allow the intercept of the price equation or<br />
the transmission parameter to vary (Thompson et al. 2000; Thompson et al.<br />
2002b; Vollrath and Hallahan 2006). In cointegration models, either dummies<br />
accounting for structural breaks are put outside the cointegration vector (Hui-<br />
Shung and Griffith 1998) or, most commonly, the analysis is repeated on the<br />
sample split into sub-samples according to policy regime changes 57 (Barassi and<br />
Ghoshray 2007; Thompson and Bohl 1999; see annex A for further references).<br />
Cointegration models with structural breaks accounting for policy regime<br />
changes, which represent another method of considering policy regimes while<br />
testing for price transmission, (Dawson et al. 2006; Dawson and Sanjuan 2006)<br />
will instead be dealt with in chapter 6.<br />
4.4 The data<br />
Wheat monthly prices for the US and France for the period 1978:12 to 2003:12<br />
(i.e., from December 1978 to December 2003; 301 observations) are used (figure<br />
4.8). Soft wheat French prices (swfr) are available on-line from the Eurostat<br />
database; unfortunately, while the Eurostat database allows to go back in time, no<br />
more recent observations were accessible. Data concerning US Gulf fob Hard Red<br />
Winter (HRW) wheat prices and freight rates were obtained from the International<br />
Grains Council; the freight rates used in this study are those from US Gulf to<br />
ARAH (ARAH stands for Amsterdam/Rotterdam/Antwerp/Hamburg<br />
destinations), which were added to the US price in order to obtain European cif<br />
prices (hrw). The EU intervention price time series (pint) has been reconstructed<br />
by adding to the prices established annually by the European Commission<br />
monthly seasonal adjustments, the latter obtained from European Commission<br />
regulations 58; 59 . Eurostat monthly bilateral exchange rates have been used to<br />
convert in euro prices and freight rates expressed in US dollars 60 . Using prices<br />
already converted in the same currency and not introducing the exchange rate<br />
itself as a regressor is a widely used procedure; it follows that adjustments to the<br />
exchange rate are considered instantaneous (see paragraph 3.4).<br />
57<br />
Alternatively, Thompson et al. 2002 propose to include additional observations not to reduce the power of<br />
the tests.<br />
58<br />
The monthly adjustments for 1985 have been calculated as arithmetical average.<br />
59<br />
Eurostat price data are normally producer prices, net of transport costs to the storage centre. This is very<br />
likely to contribute to the fact that the French price is so often below the intervention one. In the analysis, we<br />
consider this together with the other transport costs.<br />
60<br />
Though the use of US dollars is more common in studying international agricultural markets, euro were<br />
preferred because of the analysis of EU policies which will be performed.<br />
68
250<br />
200<br />
150<br />
100<br />
50<br />
1978:12<br />
International Soft Wheat Markets Under Policy Intervention<br />
Figure 4.8 Soft wheat French price, US HRW price, intervention price (euro/t)<br />
1980:12<br />
1982:12<br />
1984:12<br />
1986:12<br />
1988:12<br />
1990:12<br />
Source: Eurostat, International Grains Council, European Commission regulations<br />
The three price series have quite a different behaviour. The US price presents a<br />
cyclical pattern, which is quite common for agricultural commodities, and is<br />
mostly due to the inherent characters of agricultural production (Hallett 1968).<br />
The French price appears to track closely the intervention one up to 1992,<br />
when its fluctuations seem to follow more the ones of the US price.<br />
What emerges even from this simple visual inspection, is that the MacSharry<br />
reform clearly marks a turning point in the behaviour of the series. The<br />
intervention price values were constantly set at higher levels during the 1980s and<br />
up to 1992 when, in correspondence to the implementation of the MacSharry<br />
reform, a 30% reduction of their level was agreed (we can notice their strong<br />
seasonality, as seasonal adjustments are established monthly to cover the increase<br />
in storage costs; figure 4.8). Indeed, intervention prices switch from being<br />
constantly above to constantly below the world ones.<br />
The French price is assumed to be the representative EU price, considering the<br />
fact that France is the biggest European wheat producer (Eurostat). In figure 4.9,<br />
moreover, we can see how the European prices from the four major agricultural<br />
producer countries move together over the past 30 years 61 ; once again, we can<br />
notice how, during the eighties, high intervention prices allowed to keep high the<br />
prices in the European markets.<br />
61 As far as Italy and France (amongst the most important EU countries in this respect) are concerned, Verga<br />
and Zuppiroli (2003, p.27) find out that the strong relationships existing between them are not affected by the<br />
MacSharry Reform, which would imply that, besides sharing the same political context, the two countries are<br />
tied by strong commercial linkages. It must be said that older studies (Zanias 1993; Gjolberg et al. 1996) find<br />
evidence of non-integrated wheat markets, unless prices are corrected by Monetary Compensatory Amounts,<br />
which operated as export subsidies/taxes in the intra-EU trade as the “green exchange rate” was fixed and<br />
might diverge from the actual market exchange rate.<br />
1992:12<br />
1994:12<br />
1996:12<br />
1998:12<br />
2000:12<br />
2002:12<br />
swfr<br />
hrw<br />
pint<br />
69
International Soft Wheat Markets Under Policy Intervention<br />
250<br />
200<br />
150<br />
100<br />
50<br />
70<br />
1971:01<br />
Figure 4.9 Soft wheat prices in Germany, Spain, France and Italy (euro/t)<br />
1973:01<br />
1975:01<br />
1977:01<br />
1979:01<br />
1981:01<br />
1983:01<br />
1985:01<br />
1987:01<br />
Source: Eurostat<br />
The selection of an appropriate “world” price for European markets is not<br />
straightforward.<br />
In this work, the US Hard Red Winter wheat is assumed to be the relevant<br />
representative world price for EU markets, as it is normally the case in<br />
econometric models (AGMEMOD 2007a, 2007b). Moreover, it is assumed as a<br />
reference price also in practice. Indeed, its quotations are used to determine the<br />
import duties by the European Commission for medium quality EU soft wheat<br />
(Gallezot 2007, p.18).<br />
However, it might be argued that wheat is a non homogeneous product. This is<br />
a well known issue (for a table of the various classes of wheat see Ghoshray 2000,<br />
p. 5; Ghoshray and Lyoid 2003, p.28; Ghoshray 2002, p.303): Larue already<br />
(1991), shows that wheat is differentiated by end use and by country of origin, and<br />
that wheat protein content has a significant influence on prices. Quality<br />
differences, namely protein content 62 , could influence international price linkages<br />
by making varieties of wheat imperfect substitutes of one another (Mohanty et al.<br />
1999, p. 113; Ghoshray and Lyoid 2003); nevertheless, wheat markets should be<br />
interrelated to the extent that individual wheat types are close substitutes in<br />
consumption and thus respond to global supply and demand conditions.<br />
62 Wheat type depends on hardness, a milling characteristic, (we have hard wheats, characterised by a high<br />
protein content, and soft wheats), and on dough strength, a baking quality (it determines the end use of wheat;<br />
strong wheats can produce bread with a large loaf volume and a good texture, differently from weak wheats).<br />
Canadian and Australian wheats are often considered to be of better quality than US wheats, which in turn are<br />
considered to be of higher quality than EU and Argentinean wheats; anyway, the substitution between the<br />
different classes of wheats has been made easier by technical innovations (Ghoshray 2002, p. 302).<br />
1989:01<br />
1991:01<br />
1993:01<br />
1995:01<br />
1997:01<br />
1999:01<br />
2001:01<br />
Germany<br />
Spain<br />
France<br />
Italy<br />
2003:01<br />
2005:01
International Soft Wheat Markets Under Policy Intervention<br />
While the EU soft wheat is a medium protein wheat, weak, the Hard Red<br />
Winter wheat has a higher protein content and is classified as medium strong. We<br />
mentioned already that the Hard Red Winter wheat has commonly been used to<br />
represent the world price, but it has also been argued that the Soft Red Winter<br />
wheat, which has a lower protein content, would indeed be a closer substitute for<br />
European soft wheat (Barassi and Ghoshray 2007; Verga and Zuppiroli 2003).<br />
However, remembering the considerations mentioned above, and noting that,<br />
when the behaviours of different US wheat prices are compared, they seem to be<br />
very close but for a constant term (figure 4.10; the Dark Northern spring, used for<br />
the analysis in Thompson and Bohl (1999) has an even higher protein content than<br />
the Hard Red Winter Wheat), the use of the Hard Red Winter wheat as world<br />
representative seems a reasonable assumption.<br />
300<br />
250<br />
200<br />
150<br />
100<br />
50<br />
1978:12<br />
1980:12<br />
1982:12<br />
Figure 4.10 Various US wheat prices (euro/t)<br />
1984:12<br />
1986:12<br />
1988:12<br />
1990:12<br />
Source: International Grains Council<br />
Quality differences to a higher level of detail are not explicitly considered and,<br />
together with transport costs for which data are not accessible, the strong<br />
assumption for them to be stationary around a constant proportion of prices is<br />
made (see paragraphs 2.3, 3.2.1 and 3.4). Although very strict, this assumption<br />
seems not to be too far from reality in the period considered in the analysis.<br />
Indeed, the ratio between freight rates and fob US prices oscillates in a quite<br />
limited range, before starting a dramatic increase in 2004 (figure 4.11). This could<br />
be taken as evidence of a substantial stability of the proportion of transportation<br />
costs on prices in the years considered in the analysis.<br />
1992:12<br />
1994:12<br />
1996:12<br />
1998:12<br />
Hard Red Winter wheat<br />
Soft Red Winter wheat<br />
Dark Northern Spring<br />
2000:12<br />
2002:12<br />
71
International Soft Wheat Markets Under Policy Intervention<br />
30<br />
20<br />
10<br />
0<br />
1978:12<br />
72<br />
1980:12<br />
Figure 4.11 Freight rates expressed as a percentage of fob prices<br />
1982:12<br />
1984:12<br />
1986:12<br />
1988:12<br />
1990:12<br />
1992:12<br />
Source: International Grains Council<br />
Policy regime changes will be taken into account through the various schemes<br />
which will be developed; all other components of possible market deviations from<br />
the LOP are not available, as it happens in most of the literature revised. As<br />
Thompson and Bohl (2002, p.1045) note, the analysis can be considered within<br />
what Barrett (1996, p. 825) defines as “level 2” of market analysis, which “more<br />
closely resembles spatial equilibrium theory”.<br />
Some descriptive statistics of the data, according to the major CAP changes<br />
and the URAA implementation, are provided in table 4.3.<br />
We can notice that both swfr and pint average values show a decrease in time.<br />
On the other side, hrw decreases in the second sub-period, and then increases in<br />
the other two to higher levels than those in the beginning of the sample. hrw’s<br />
variability decreases over time; swfr’s variability, which is always smaller than<br />
the hrw’s one, decreases, too, but only until 1993, to increase afterwards.<br />
Bale and Lutz (1979) demonstrate how policy measures and international trade<br />
distortions do affect the variability of prices: so, one might argue that swfr’s<br />
variability was kept low thanks to protectionist EU agricultural policies, and then<br />
rose after 1993, when substantial policy reforms were introduced (Thompson<br />
1999, p. 8). Verga and Zuppiroli (2003, p.28) on the other side, assert that the<br />
increased volatility for the EU prices realized after 1993 doesn’t depend on a<br />
major interaction with international prices, but only on the fact that, as the EU<br />
intervention price was reduced, prices could fluctuate more.<br />
1994:12<br />
1996:12<br />
1998:12<br />
2000:12<br />
freight rate/fob price %<br />
2002:12<br />
2004:12<br />
2006:12
International Soft Wheat Markets Under Policy Intervention<br />
The distributions tend to be skewed and platykurtic, which are common<br />
features of non-stationary price series (Ghoshray 2000, p. 10).<br />
Table 4.3 Descriptive statistics of the price time series (euro/t)<br />
Time Average Standard deviation Skewness Kurtosis<br />
Soft wheat French price 1978:12-2003:12 144.16 22.67 -0.29 -1.02<br />
1978:12- 1988:06 161.18 12.89 -0.23 -1.24<br />
1988:07-1993:06 158.41 8.64 0.14 -0.79<br />
1993:07- 2000:06 126.30 11.57 -0.17 -1.10<br />
2000:07- 2003:12 112.94 12.61 1.48 2.80<br />
1978:12-1995:06 156.51 15.16 -0.54 -0.17<br />
1995:07-2003:12 120.08 13.81 0.414 -0.68<br />
Intervention price 1978:12-2003:12 151.49 32.81 -0.13 -1.53<br />
1978:12- 1988:06 179.14 15.92 -0.34 -0.91<br />
1988:07-1993:06 174.23 6.58 0.28 -0.54<br />
1993:07- 2000:06 119.99 5.46 -0.96 0.47<br />
2000:07- 2003:12 106.31 5.07 0.74 -0.63<br />
1978:12-1995:06 169.82 24.40 0.50 -0.42<br />
1995:07-2003:12 115.74 8.85 -0.47 -1.24<br />
HRW US price 1978:12-2003:12 148.23 29.75 0.48 -0.13<br />
1978:12- 1988:06 157.51 36.16 0.13 -1.03<br />
1988:07-1993:06 133.30 24.32 -0.01 1<br />
1993:07- 2000:06 140.73 21.25 1.09 1.51<br />
2000:07- 2003:12 159.16 16.39 1.32 2.57<br />
1978:12-1995:06 147.59 32.77 0.50 0.89<br />
1995:07-2003:12 149.49 22.82 0.46 0.38<br />
4.5 Concluding remarks<br />
As anticipated, a general overview of trade flows and price data on<br />
international wheat markets, and of the main policies implemented by some of the<br />
biggest exporters and in multilateral trade agreements, makes clear that domestic<br />
and border policies play a relevant role in influencing price transmission on soft<br />
wheat markets.<br />
In this work, the French and the US prices will be studied over the years 1978-<br />
2003; they are assumed to represent, respectively, the EU and the US price.<br />
Though, after 1992, the CAP changed considerably, moving from more market<br />
oriented mechanisms towards the use of less distortive support, in practice, and<br />
although intervention prices were progressively reduced, the same scheme of<br />
protection, based on export subsidies and variable levies, kept being in place.<br />
73
International Soft Wheat Markets Under Policy Intervention<br />
Under certain conditions, this should hinder the world prices from influencing the<br />
domestic ones.<br />
In international trade policy, in 1995, the URAA of the WTO aimed at<br />
achieved an increased market liberalization; consequently, with an effective<br />
“tariffication”, international price transmission elasticities should have increased.<br />
However, also in this respect, the so-called “155% rule” might well have reduced<br />
its effects on soft wheat markets.<br />
In this chapter, all these policy changes have been described in detail, to assess<br />
their effects on price transmission in order to develop a consistent theoretical<br />
framework. This has the objective of understanding under which conditions the<br />
EU and the world prices are expected to interact, provided the presence of the EU<br />
domestic and border policies and of the implementation of the URAA of the<br />
WTO.<br />
A thorough examination of the various combinations of domestic and<br />
international market conditions, considering the various policy measures, suggests<br />
that the EU and the US price are expected to be positively correlated only if the<br />
latter is above both the entry and the intervention price.<br />
However, this has never been the case. What is argued is then that it is the<br />
intervention price which acts as a threshold under which the world price doesn’t<br />
affect the European one. The European price is expected to interact with the world<br />
one only when the latter is above the intervention price; otherwise, it will follow<br />
the intervention price.<br />
The relative position of the US and intervention prices allows the identification<br />
of different policy regimes, in which the price transmission relations are different<br />
depending on the effectiveness of policy intervention, represented through the<br />
position of the intervention price.<br />
This theoretical framework represents a development of the one presented in<br />
chapter 2 that explicitly addresses the need for taking policy regimes into account<br />
while investigating price transmission, and will be used for the development of<br />
different empirical models in the next chapters.<br />
The descriptive analysis of the dataset concludes the chapter. Some key facts<br />
that emerge are the higher volatility of the world price, if compared to the<br />
European one; and the fact EU prices show a constant decrease over time, while<br />
the world ones increase again after 1993.<br />
74
5 EMPIRICAL ANALYSIS: COINTEGRATION<br />
MODELS ACCOUNTING FOR POLICY<br />
REGIME CHANGES<br />
5.1 Introduction<br />
The aim of this chapter is to introduce policy regimes in the analysis of<br />
international price transmission mechanisms.<br />
The focus is on the soft wheat market between the EU and the US, in the years<br />
1978-2003. As explained in the previous chapter, the French price is assumed to<br />
be representative of the EU price, whereas the US one of the world price.<br />
Different econometric models will be derived on the basis of the considerations<br />
made in paragraph 4.3, where a theoretical framework has been developed with<br />
the objective of including policy regimes in the analysis, by combining policy and<br />
price data.<br />
It has been demonstrated that the EU domestic price is expected to follow the<br />
world one only if it is above the intervention price; otherwise, it is expected to<br />
follow the latter one. This claim will here be explored in different ways.<br />
The objective of the analysis is twofold: on the one side, suggesting different<br />
econometrical models accounting for policy regime changes, based on the<br />
theoretical framework elaborated. To the author’s knowledge, to date not such<br />
attempts have been made.<br />
On the other, shedding light on a controversial empirical evidence, the analysis<br />
aims at verifying if there is co-movement between the EU and the world prices,<br />
and how policy changes are likely to have affected this relation.<br />
In fact, in the existing literature either the EU and US prices are found not to<br />
interact (Verga and Zuppiroli 2003), or their price transmission elasticity to be<br />
positive, although rather small (Thompson and Bohl 1999; Thompson et al.<br />
2002a; 2002b), and in this case either influenced (Thompson et al. 2002a) or not<br />
by international policy regime changes (Thompson et al. 2002b). However, in
Empirical Analysis: Cointegration Models Accounting for Policy Regime Changes<br />
these works attempts to take policy regimes into account are limited to the<br />
inclusion of dummy variables, or the sub-division of the sample.<br />
The chapter is structured as follows. In paragraph 5.2, the empirical models are<br />
presented. They are classified in two groups: in paragraph 5.2.1, a composite<br />
variable is introduced; in paragraph 5.2.2, three different ad hoc “threshold”<br />
cointegration models are presented, in which adjustment coefficients and<br />
cointegration parameters are assumed to vary depending on the policy regime in<br />
place. Paragraph 5.3 concludes.<br />
5.2 The empirical models developed<br />
The objective of this paragraph is to find out innovative ways of considering<br />
policy regimes while testing for price transmission and, once this has been made,<br />
to determine whether a long-run relationship exists between the French soft wheat<br />
price (swfr) and the US cif price (hrw).<br />
In this paragraph, different cointegration models are developed. Indeed,<br />
cointegration models allow to explore both short and lung run dynamics. They all<br />
stem from the theoretical framework presented in paragraph 4.3: the basic idea is<br />
that the intervention price acts as a threshold above which the EU and the US<br />
price can interact.<br />
Different ways of modeling such a relation can be figured out.<br />
At first, a composite variable, equal to the maximum between the intervention<br />
and the US price, is introduced in a cointegration model and its relation with the<br />
EU price is studied. This is a straightforward representation of the simple<br />
assumption that “the EU price is expected to follow the maximum between the<br />
intervention and the US price”. The creation of this composite variable is a very<br />
simple way of modeling the policy regime switches: indeed, also in some<br />
econometric models, even if by means of Ordinary Least Squares (OLS)<br />
estimates, the relevant European price is assumed to depend on either the US or<br />
the intervention price depending on which of them is higher.<br />
In a second step, other models are estimated. This time, through the appropriate<br />
use of dummy variables, either the adjustment coefficients or the parameters of<br />
the cointegrating vector, or both, are allowed to vary according to the policy<br />
regime in place. In other words, these parameters are allowed to take different<br />
values if the US or the intervention price is the significant reference price for the<br />
EU.<br />
Firstly, a particular cointegration model is estimated, with different<br />
adjustments coefficients depending on the observable policy regimes in place; the<br />
LOP is imposed between the French price and the highest between the US and the<br />
intervention price. Secondly, the price transmission elasticity is allowed to change<br />
according to which price the French one is related to (always, the highest between<br />
76
Empirical Analysis: Cointegration Models Accounting for Policy Regime Changes<br />
the intervention and the US price). Finally, both adjustment coefficients and the<br />
cointegrating vector parameters are assumed to vary.<br />
The cointegration models presented, though over-simplified, represent an<br />
attempt of combining policy and price data. To the author’s knowledge, so far no<br />
such attempts have been made.<br />
The “composite variable” model, Model 1, is presented in paragraph 5.2.1;<br />
whereas the other empirical models, Model 2, Model 3 and Model 4, are presented<br />
in paragraph 5.2.2.<br />
5.2.1 Model 1: the use of a composite variable<br />
As anticipated, to take into account the role played by EU policies for soft<br />
wheat, some alternative schemes can be proposed.<br />
The first one is the creation of a composite variable, the “EU external reference<br />
price” (wreft). Indeed, assuming that the fundamental target of the EU price policy<br />
is to keep at least the intervention price level in the internal market, each month<br />
the “EU external reference price” is calculated as the maximum between the<br />
intervention price and the US (world) price; wreft = max (hrwt,pintt).<br />
What is argued is that the EU price follows the US price, when it is above the<br />
intervention price, and vice versa. The intervention price acts as an implicit<br />
downward threshold for the US price.<br />
In this paragraph, the empirical study will be carried out both on the whole<br />
sample (301 observations, 1978:12 to 2003:12), and on two sub-samples,<br />
determined on the basis of the policy considerations made in the previous chapter,<br />
as described in table 5.1 63 .<br />
Table 5.1 The two sub-samples used in the cointegration analysis<br />
1978:12- 1993:06 175 observations<br />
1993:07- 2003:12 126 observations<br />
Precedent to substantial CAP reform<br />
(Regular CMO functioning, first reforms of 1988)<br />
Following substantial CAP reform<br />
(Mac Sharry reform, Agenda 2000, Fischler reform)<br />
Indeed, the MacSharry reform of 1993 represents the first fundamental change<br />
in the CAP of the EU, since, for the first time, substantial cuts of the intervention<br />
prices (-30%) were implemented. In fact, as expected, the US price tends to be<br />
63 Considering the limited power of unit roots and cointegration tests, it was not deemed appropriate to split<br />
the whole sample into the four sub-samples described in paragraph 4.2.2. For this reason, and considering its<br />
political relevance, the MacSharry reform has been chosen as the fundamental break.<br />
77
Empirical Analysis: Cointegration Models Accounting for Policy Regime Changes<br />
higher than the intervention price from the MacSharry reform onwards (see also<br />
figure 4.8).<br />
Looking at the behaviour of the prices, we can also notice that the French price<br />
seems to follow more the intervention price before the implementation of the<br />
MacSharry reform, i.e. when it is normally higher than the US price, and the US<br />
price afterwards, when the reverse holds (figure 4.8, and 5.1).<br />
250<br />
200<br />
150<br />
100<br />
50<br />
78<br />
1978:12<br />
1980:12<br />
Figure 5.1 Soft wheat French price and world reference price (euro/t)<br />
1982:12<br />
1984:12<br />
1986:12<br />
1988:12<br />
1990:12<br />
Source: Eurostat; International Grains Council; European Commission regulations<br />
Throughout the whole analysis that will follow, prices are expressed in logs.<br />
Unit root tests have been repeated both in the whole period and in the two subperiods<br />
identified above 64 . Augmented Dickey Fuller (ADF) tests have been run<br />
by adding the last significant lag up to a maximum of 18, due to the monthly<br />
nature of the data. Phillips-Perron (PP) tests were run with a number of lags<br />
determined by minimizing the Schwartz's Bayesian Information Criterion (SBIC)<br />
in a number of autoregressive specifications up to a maximum of 18 lags. The<br />
choice of the lag length was generally unaffected by the deterministic trend.<br />
Considering the monthly nature of tha data, 24 lags were used for the<br />
Kwiatkowski, Phillips, Schmidt e Shin (KPSS) tests. Finally, it could be argued<br />
that the presence of seasonality in the monthly price series might undermine the<br />
ability of ADF tests to verify unit roots; for this reason, monthly dummies were<br />
introduced into the ADF tests estimations 65 .<br />
64<br />
Both STATA® and GRETL (www.gretl.sourceforge.net ) softwares were used for the econometric<br />
estimations.<br />
65<br />
With monthly data, both conventional and seasonal unit roots might be present; but the latter are less<br />
plausible in economic time series since they imply an evolving seasonal pattern (Dawson and Sanjuan 2006,<br />
p. 104). For this reason, we don’t take them into account.<br />
1992:12<br />
1994:12<br />
1996:12<br />
1998:12<br />
2000:12<br />
2002:12<br />
swfr<br />
wref
Empirical Analysis: Cointegration Models Accounting for Policy Regime Changes<br />
While on logarithms the null hypothesis of unit roots cannot be rejected, for<br />
log-differences it is possible to do so. This is generally true for all the series<br />
considered, both in the whole sample and in the two sub-samples identified as<br />
before and after the MacSharry reform. Results then overall confirm that the<br />
processes are I(1) (i.e., integrated of order 1, or difference-stationary), as it is the<br />
case in all the literature revised, despite the fact that they are nominal prices<br />
(Fanelli and Bacchiocchi 2005), and are reported in annex B.<br />
Provided that the prices are first-difference stationary, a cointegration analysis<br />
has been performed. The series have been analyzed in pairs. The optimum laglength<br />
for the VAR has been chosen according to the minimization of the Akaike<br />
Information Criterion (AIC) up to a maximum of 18 lags 66 . The Johansen and<br />
Juselius procedure has been used to estimate the rank of the cointegrating matrix<br />
(where not indicated differently, the null hypothesis has been rejected at 5%<br />
significance level) and the VECM in the “restricted constant case 67 .<br />
Autocorrelation was tested with a Lagrange Multiplier test with the null<br />
hypothesis of no autocorrelation up to the 18 th lag (the null hypothesis has been<br />
rejected at 5% significance level). Dummy variables have been introduced outside<br />
the cointegrating vector to take account of the months in which export taxes have<br />
been imposed by the EU with the objective of preventing prices from raising too<br />
much, and also of the Russian and Ukrainian grain inflow of 2001/2002.<br />
First of all, in the whole sample, the rank of the cointegrating matrix was<br />
estimated between swfr and hrw, to see whether the LOP holds between the EU<br />
and the US prices. As expected from visual inspection of the two time series and<br />
from policy considerations, the rank of the cointegration matrix is zero<br />
(Johansen’s tests are reported in annex C). However, by carrying out unit root<br />
tests on the French-US price spread in the overall sample and in different subsamples,<br />
some evidence of stationarity emerges, which seems to be stronger after<br />
1992 (see annex D).<br />
Although these results are partly contrasting, we could conclude that the each<br />
of the two prices follows its own pattern and that the influence of the market<br />
policies is so strong that they are not related to each other. In other words, if<br />
policy variables and policy regimes are simply ignored in the analysis, and if such<br />
a long period of time is considered, the two prices wander following each its own<br />
path.<br />
66<br />
The number of lags selected by the SBIC did not normally allow to remove autocorrelation in the<br />
equations.<br />
67<br />
Visual inspection of the data shows that there is no trend in the series (figure 4.8), and both theory and<br />
visual inspection of the data imply the presence of a constant in the long-run relationship, accounting for all<br />
elements contributing to price differentials not explicitly modelled in the price transmission equation. This<br />
means that, even if there are no linear time trends in the level of the data, the cointegrating relation has a<br />
constant mean.<br />
79
Empirical Analysis: Cointegration Models Accounting for Policy Regime Changes<br />
This should not come as a surprise, provided the very existence of the<br />
European border policies (namely, variable levies and export subsidies); this<br />
protection mechanisms, despite the decrease in the intervention price, has always<br />
been in place.<br />
Other studies (Ghoshray et al. 2000; Ghoshray 2002; Barassi and Ghoshray<br />
2007) show instead the presence of cointegration between the EU and the US<br />
prices. These different results can simply be explained by the fact that they use<br />
EU Rotterdam fob prices. These prices are indeed very close to the world ones,<br />
since it is on top of them that export subsidies are paid to European exporters: the<br />
very objective of export refunds is to cover the distance existing between the high<br />
domestic EU prices and the world ones, in order to allow the European excess<br />
supply to be sold in world markets at a competitive price. So, there should be no<br />
surprise also in their findings that the EU is a price follower in world markets,<br />
right because it applies export refunds on the basis of the world market prices<br />
(Ghoshray et al. 2000; Barassi and Ghoshray 2007). Instead, Thompson and Bohl<br />
(1999) use producer’s level German prices and US fob Dark Northern Spring<br />
prices and find that they are cointegrated. They use a threshold cointegrating<br />
technique, which could partly explain this difference in results. On the other side,<br />
the selection of the Dark Northern Spring price (which has a even higher protein<br />
content than the Hard Red Winter wheat) was not deemed appropriate for our<br />
analysis. Finally, Thompson et al. (2002a), do not estimate but impose the<br />
cointegration relationship and, with a Seemingly Unrelated Regression Error<br />
Correction Model in which prices of different EU countries are related to the US<br />
price, find that price differentials are stationary and that adjustment coefficients<br />
are significant.<br />
The cointegration analysis was repeated for swfr and wref, which contains 162<br />
times the intervention price over 301 months (54% of the total number of<br />
observations) and is I(1), as well. The rank of the cointegration matrix turned out<br />
to be one (Johansen tests are reported in annex C). The estimates of Model 1 are<br />
reported in table 5.2 68 .<br />
For all the tables that will follow, the symbol α indicates the adjustment<br />
coefficients, while, for the sake of simplicity, for the coefficients of the<br />
cointegration vector, cost is the constant term and βwref and βhrw are the price<br />
transmission elasticities between swfr and either wref or hrw. In order to test the<br />
restrictions imposed on the cointegration vectors a likelihood ratio test is used (χ 2<br />
distribution).<br />
68 The VECM was estimated with 13 lags (optimal number according to the AIC both with and without<br />
seasonal dummies). Monthly dummies for June, July and August only have been inserted (until 1985, the<br />
marketing campaign would begin in August and end in July the following year, since 1986/1987, it would<br />
begin in July and end in June); this model presented better information criteria that those estimated with all or<br />
no monthly dummies.<br />
80
α<br />
LM test<br />
ARCH(13)<br />
Empirical Analysis: Cointegration Models Accounting for Policy Regime Changes<br />
Table 5.2 Model 1 estimates for swfr and wref, 1978:12-2003:12<br />
∆swfr ∆wref Cointegration vector<br />
-0.093***<br />
(0.030)<br />
0.207<br />
(p-value 0.999)<br />
2.371<br />
(p-value 0.999)<br />
0.064**<br />
(0.030)<br />
0.201<br />
(p-value 0.999)<br />
3.402<br />
(p-value 0.996)<br />
swfr = − 0 . 397+<br />
1.<br />
054*<br />
* * wref<br />
t<br />
( 0.<br />
670)<br />
( 0.<br />
131)<br />
cost = 0 χ 2 = 0.333 (p-value 0.564)<br />
β wref = 1 χ 2 = 0.161 (p-value 0.688)<br />
β wref = 0 χ 2 = 18.886 (p-value 0)<br />
Standard errors are reported in parenthesis<br />
LM test: Lagrange Multiplier test with the null hypothesis of no-autocorrelation<br />
*significant at 10%; **significant at 5%; *** significant at 1% for the null hypothesis of zero coefficients (#, ##<br />
and ### respectively if for βwref the null hypothesis of equal to one is rejected)<br />
The cointegration relation is swfrt = -0.397 + 1.054 wreft. The imposition of a 1<br />
price transmission elasticity coefficient is not rejected (χ 2 = 0.161; p-value 0.688).<br />
The constant term is not significantly different from zero (χ 2 = 0.333; p-value<br />
0.564). Adjustment coefficients have the expected sign and are both significant.<br />
The residuals from the cointegration relationship show a stationary behaviour<br />
(figure 5.2). We can see that three major deviations from the long run relation,<br />
corresponding to major peaks of the error correction term, occurred in 1985, 1996<br />
and 2002; in these months the French price was low, as explained before, because<br />
of the use of export taxes or of the specific situation of 2001/2002, when large<br />
inflows of products depressed domestic EU prices. Since these are accounted for<br />
in the short-run dynamics of the system but not inside the cointegration vector 69 ,<br />
what we observe is an increase in the disequilibrium term. To this point, the<br />
empirical findings confirm our expectations: the French price is linked to a series<br />
constituted by the maximum between the intervention and the US price, and the<br />
price transmission elasticity is very close to one.<br />
To explore more in depth how this relation has possibly changed in time, the<br />
analysis has first been repeated in the sub sample 1978:12-1993:06. Here, wref is<br />
almost always constituted by the intervention price, which is higher than the US<br />
price 145 months over a total of 175 (83% of the total number of observations).<br />
Indeed, up to the MacSharry reform intervention price were normally set above<br />
the world price.<br />
swfr is cointegrated with hrw, but the price transmission elasticity coefficient in<br />
the cointegration vector is very low (see table 5.3, Model 1a, where “a” indicates<br />
that estimates refer to the first sub-sample) 70 .<br />
69 This could be done by cointegration techniques accounting for structural breaks (see chapter 6).<br />
70 The VECM was estimated with 5 lags (optimal number according to the AIC when monthly dummies were<br />
included) and with the monthly dummies for June, July, and August only, which allowed getting better<br />
t<br />
81
Empirical Analysis: Cointegration Models Accounting for Policy Regime Changes<br />
0,5<br />
-0,5<br />
α<br />
82<br />
Figure 5.2 Residuals from the cointegration relationship of Model 1 for swfr and wref<br />
1978:12-2003:12<br />
1 9 7 8 :1 2<br />
LM test<br />
ARCH(13)<br />
1 9 8 0 :1 2<br />
1 9 8 2 :1 2<br />
1 9 8 4 :1 2<br />
Table 5.3 Model 1a estimates for swfr and hrw, 1978:12-1993:06<br />
∆swfr ∆hrw Cointegration vector<br />
-0.172***<br />
(0.041)<br />
1.629<br />
(p-value 0.063)<br />
11.100<br />
(p-value 0.049)<br />
1 9 8 6 :1 2<br />
1 9 8 8 :1 2<br />
1 9 9 0 :1 2<br />
-0.007<br />
(0.059)<br />
0.750<br />
(p-value 0.753)<br />
4.463<br />
(p-value 0.485)<br />
swfr = 3 . 968*<br />
* + 0.<br />
226<br />
t<br />
( 0.<br />
341)<br />
# # # ;<br />
( 0.<br />
069)<br />
*<br />
* *<br />
hrw<br />
cost = 0 χ 2 = 5.940 (p-value 0.015)<br />
β hrw = 1 χ 2 = 6.901 (p-value 0.009)<br />
β hrw = 0 χ 2 = 7.008 (p-value 0.008)<br />
Standard errors are reported in parenthesis<br />
LM test: Lagrange Multiplier test with the null hypothesis of no-autocorrelation<br />
*significant at 10%; **significant at 5%; *** significant at 1% for the null hypothesis of zero coefficients (#, ##<br />
and ### respectively if for βhrw the null hypothesis of equal to one is rejected)<br />
In the cointegration model, the transmission elasticity is statistically different<br />
from one and the constant is very high and significantly different from zero. Only<br />
the French price adjusts to disequilibria, whereas the US adjustment coefficient<br />
has not even the expected sign and is very small.<br />
information criteria than when either all dummies were included or the model was estimated with 13 lags<br />
(optimal number when monthly dummies were not considered) and no dummies.<br />
1 9 9 2 :1 2<br />
1 9 9 4 :1 2<br />
1 9 9 6 :1 2<br />
1 9 9 8 :1 2<br />
2 0 0 0 :1 2<br />
2 0 0 2 :1 2 ce_1<br />
t
Empirical Analysis: Cointegration Models Accounting for Policy Regime Changes<br />
Model 1a was then estimated for swfr e wref, that are once again cointegrated:<br />
estimates are reported in table 5.4 71 .<br />
α<br />
LM test<br />
ARCH(13)<br />
Table 5.4 Model 1a estimates for swfr and wref , 1978:12-1993:06<br />
∆swfr ∆wref Cointegration vector<br />
-0.211***<br />
(0.074)<br />
0.430<br />
(p-value 0.978)<br />
34.030<br />
(p-value 0.001)<br />
0.210***<br />
(0.052)<br />
0.293<br />
(p-value 0.998)<br />
25.881<br />
(p-value 0.018)<br />
swfr = 0.<br />
679+<br />
0.<br />
848*<br />
* * wref<br />
t<br />
( 0.<br />
643)<br />
( 0.<br />
124)<br />
cost = 0 χ2 = 0.758 (p-value 0.384)<br />
βwref = 1 χ2 = 0.990 (p-value 0.320)<br />
βwref = 0 χ2 = 18.738 (p-value 0)<br />
Standard errors are reported in parenthesis<br />
LM test: Lagrange Multiplier test with the null hypothesis of no-autocorrelation<br />
*significant at 10%; **significant at 5%; *** significant at 1% for the null hypothesis of zero coefficients (#, ##<br />
and ### respectively if for βwref the null hypothesis of equal to one is rejected)<br />
The long run relationship is swfrt = 0.679 + 0.848 wreft. Like in the overall<br />
sample, both adjustment coefficients have the expected sign and are significant,<br />
though here they are higher in magnitude. Restrictions imposing both a perfect<br />
price transmission and a zero-constant are not rejected (respectively, χ 2 = 0.990;<br />
p-value 0.320; χ 2 = 0.758; p-value 0.384).<br />
In the first sub-sample, the relation between the French price and the<br />
combination between the US and the intervention price presents a stronger<br />
adherence to the LOP than when the US price enters the equation as such. This is<br />
somehow expected, provided the predominance of the intervention price in the<br />
wref series.<br />
Finally, the analysis was repeated in the sub-sample 1993:07-2003:12 (Model<br />
1b). Differently from the observations preceding the MacSharry reform, as<br />
expected wref is this time constituted almost exclusively by the US price, which is<br />
below the intervention price only 17 months over 126 (13% of the total number of<br />
observations). This basically happens because the MacSharry reform implemented<br />
a substantial reduction of the intervention prices.<br />
For the French and the US price, there is evidence of cointegration among the<br />
series 72 . The Model 1b estimates are reported in table 5.5.<br />
71 The optimal number of lags selected by the AIC was 13 lags; 1 if monthly dummies were considered. One<br />
lag only did not allow to remove autocorrelation; the VECM was then estimated with 13 lags.<br />
72 The cointegration rank was 1 when 23 lags and seasonal dummies were considered. Since 23 lags seems<br />
however an overestimated number, the cointegration rank was checked also with 13 lags. In this case, the<br />
series are cointegrated if the null hypothesis is rejected at 10% significance, always with the inclusion of all<br />
the monthly dummies; the latter estimates are reported. See annex C.<br />
t<br />
83
Empirical Analysis: Cointegration Models Accounting for Policy Regime Changes<br />
α<br />
LM test<br />
ARCH(13)<br />
84<br />
Table 5.5 Model 1b estimates for swfr and hrw, 1993:07-2003:12<br />
∆swfr ∆hrw Cointegration vector<br />
-0.078**<br />
(0.034)<br />
0.452<br />
(p-value 0.963)<br />
16.849<br />
(p-value 0.206)<br />
0.063<br />
(0.060)<br />
0.221<br />
(p-value 0.999)<br />
17.552<br />
(p-value 0.175)<br />
swfr = 0.<br />
664+<br />
0.<br />
842*<br />
* * hrw<br />
t<br />
( 1.<br />
505)<br />
( 0.<br />
305)<br />
cost = 0 χ 2 = 0.136 (p-value 0.712)<br />
β hwr = 1 χ 2 = 0. 180 (p-value 0.672)<br />
β hwr = 0 χ 2 = 8.549 (p-value 0.003)<br />
Standard errors are reported in parenthesis<br />
LM test: Lagrange Multiplier test with the null hypothesis of no-autocorrelation<br />
*significant at 10%; **significant at 5%; *** significant at 1% for the null hypothesis of zero coefficients (#, ##<br />
and ### respectively if for βhrw the null hypothesis of equal to one is rejected)<br />
In Model 1b, the hypothesis of perfect price transmission in the cointegration<br />
vector is not rejected. Adjustments coefficients have the right sign. The US price<br />
performs as weakly exogenous.<br />
wref and swfr are cointegrated, as well 73 ; the corresponding VECM is<br />
estimated (Model 1b, table 5.6).<br />
α<br />
LM test<br />
ARCH(13)<br />
Table 5.6 Model 1b estimates for swfr and wref, 1993:07-2003:12<br />
∆swfr ∆wref Cointegration vector<br />
-0.073**<br />
(0.032)<br />
0.346<br />
(p-value 0.991)<br />
13.086<br />
(p-value 0.441)<br />
0.063<br />
(0.052)<br />
0.155<br />
(p-value 0.999)<br />
10.644<br />
(p-value 0.641)<br />
swfr = 0.<br />
072+<br />
0.<br />
990*<br />
* * wref<br />
t<br />
( 1.<br />
624)<br />
( 0.<br />
328)<br />
cost = 0 χ 2 = 0.001 (p-value 0.970)<br />
β wref = 1 χ 2 = 0.0006 (p-value 0.981)<br />
β wref = 0 χ 2 = 9.201 (p-value 0.002)<br />
Standard errors are reported in parenthesis<br />
LM test: Lagrange Multiplier test with the null hypothesis of no-autocorrelation<br />
*significant at 10%; **significant at 5%; *** significant at 1% for the null hypothesis of zero coefficients (#, ##<br />
and ### respectively if for βwref the null hypothesis of equal to one is rejected)<br />
The long run relationship is swfrt = 0.072+ 0.990wreft. Adjustment<br />
coefficients, that are very close to the one presented in table 5.5, have the<br />
expected sign. The wref one is not significant, which could suggest that it is<br />
73 The two series are not cointegrated when 2 lags are included (which is the optimum number of lags in all<br />
cases). When, in analogy with the models estimated in the overall sample and in the first subsample, 13 lags<br />
are included, evidence of cointegration emerges if the null hypothesis is rejected at 10% significance. See<br />
annex C. The insertion of the 3 summer dummies allowed to get better information criteria.<br />
t<br />
t
Empirical Analysis: Cointegration Models Accounting for Policy Regime Changes<br />
weakly exogenous. Once again, restrictions imposing both a perfect price<br />
transmission and a zero-constant are not rejected (respectively, χ 2 = 0.0006, pvalue<br />
0.981; χ 2 = 0.001; p-value 0.970).<br />
Differently from what happens for the first sub-sample, this time the two<br />
relations estimated are much closer; the explanation lies of course in the<br />
predominance of the US price series in the composition of wref.<br />
In the second subsample, nonetheless, the evidence of cointegration for swfr<br />
and wref is weaker than in the first and in the overall ones (the null hypothesis of<br />
a zero cointegration rank is in many cases rejected only at 10% significance; see<br />
annex C). This might be due to the fact that what happened in 2002 (when the<br />
Ukrainian or Russian price, which was much lower than the US price, was<br />
probably the true “world price” for the EU), is not explicitly considered inside the<br />
cointegration vector. This would get more importance as the number of<br />
observations is reduced, which is what happens when moving from all the<br />
observations to the second sub-sample.<br />
Summing up, the composite variable used allows to consider in the<br />
cointegration model the presence of different policy regimes. When theoretical<br />
considerations are translated into empirical models, in general, the long run<br />
relation between swfr and wref is very close to the LOP both when all<br />
observations are considered, and in the two subsamples. This means that, basically<br />
after the MacSharry reform, the US price was above the intervention price and<br />
could interact with the EU price despite the same border policies scheme kept<br />
being in place. It was the reduction of the intervention price, and not the (non-)<br />
changes in the system of policy barriers 74 , which increased price interdependency.<br />
Nevertheless, this very simple model presents a number of shortcomings. If it<br />
has to be used for projections, unless the intervention price is considered as an<br />
exogenous, pre-determined and known threshold also for future months, we<br />
cannot actually identify what the wref series actually is constituted by, if the US<br />
or the intervention price. Moreover, whether the relation found is instead a linkage<br />
between the French and the intervention price, introduced as a threshold below<br />
which the US price has no influence on the EU one, poses some interpretative<br />
problems and requires further research 75 .<br />
74 As a consequence of the lowering of intervention prices, both export subsidies and variable levies were<br />
reduced, but the same protection system kept being in place.<br />
75 Verga and Zuppiroli (2003), by using weekly data, find that the US Soft Red Winter wheat Rotterdam cif<br />
price is never cointegrated with domestic European prices, and that the intervention price is cointegrated with<br />
them in the period 1990-2002 but not in the sub-period 1995-2002. This could be explained by the instability<br />
of the relation between intervention prices and EU internal prices. In 1995-2002, when both the intervention<br />
price and the US price are put together in the cointegrating relation, evidence of cointegration emerges. They<br />
suggest that EU quotations could be linked to an “average” of the two prices, but also that this is a spurious<br />
vector not appropriate for the analysis (Verga and Zuppiroli 2003 p. 19).<br />
85
Empirical Analysis: Cointegration Models Accounting for Policy Regime Changes<br />
5.2.2 Cointegration models accounting for policy regime changes<br />
Based on the theoretical framework outlined in paragraph 4.3, there are other<br />
ways, in addition to the use of a composite variable presented in the previous<br />
paragraph, to further develop it into empirical applications.<br />
Firstly, a particular cointegration model will be estimated, with different<br />
adjustments coefficients depending on the observable policy regimes (Model 2;<br />
paragraph 5.2.2.1). In this first model, the LOP will be imposed to hold between<br />
the French price and the highest between the US and the intervention price.<br />
Secondly, the price transmission elasticity will be allowed to change according to<br />
which price the French one is related to: always, the highest between the<br />
intervention and the US price (Model 3; paragraph 5.2.2.2). Finally, both<br />
adjustment coefficients and the cointegrating vector parameters will be assumed<br />
to vary (Model 4; paragraph 5.2.2.3).<br />
5.2.2.1 Model 2: a threshold model allowing for policy regime changes<br />
All models which follow still stem from the theoretical considerations outlined<br />
in the previous chapter: the French price is assumed to be linked to either the US<br />
or the intervention price depending on which of them is higher.<br />
These models are derived by introducing ad hoc modifications in a general<br />
VECM as presented in equation 3.31 in chapter 3, in order to consider the<br />
influence of policy regimes. If a simple VECM would hold between the US and<br />
the French price, then the LOP would be expected to be valid at least in the long<br />
run, despite prices being allowed to diverge from it in the short run. But such a<br />
straightforward model is clearly not appropriate, as the two variables turn out not<br />
to be cointegrated (see annex C and annex D). In paragraph 5.2.1, we anticipated<br />
that this might due to overlooking the policy regime issue.<br />
For this reason, in Model 2, we try and introduce appropriate modifications to<br />
take policy regimes in due account. We assume that the LOP holds between the<br />
French price and the US price only when the latter is above the intervention price;<br />
otherwise, the LOP will hold between the intervention and the French price 76 .<br />
This is the same as assuming that there are two distinct regimes; this model can be<br />
interpreted as a particular cointegration model in which the adjustment<br />
coefficients take different but non-zero values according to the observable policy<br />
regime the observations belong to.<br />
Technically, this requires the creation of a regime dummy variable, which we<br />
call henceforth regt; if hrwt > pintt, reg t = 1,<br />
and if hrwt < pintt , reg t = 0.<br />
We then estimate the following model:<br />
76 Price spread stationarity (i.e., the validity of the LOP in the long run) is here imposed rather than estimated.<br />
86
Empirical Analysis: Cointegration Models Accounting for Policy Regime Changes<br />
∆p α reg z + α ( 1−<br />
reg )z + Γ ∆p + ε<br />
t<br />
= ∑ −<br />
1 t −1<br />
1,t−1<br />
2<br />
t−1<br />
2,t<br />
−1<br />
k 1<br />
i=<br />
1<br />
i<br />
t−i<br />
t<br />
(5.1)<br />
where z1,t-1=(swfrt-1 - hrwt-1) and z2,t-1 = (swfrt-1 - pintt-1).<br />
If hrwt-1 > pintt-1, and then reg 1,<br />
only z1,t-1 is “active”; if hrwt-1 < pintt-1,<br />
1 = t−<br />
and then reg t−1<br />
= 0 , only z2,t-1 is “active”. The LOP will hold between the French<br />
and the highest between the US and the intervention price; adjustment coefficients<br />
are allowed to vary in either case.<br />
Estimates of Model 2 are reported in table 5.7 77 .<br />
α 1<br />
α 2<br />
LM test<br />
ARCH (12)<br />
OV test z 1,t-1, z 2,t-1<br />
Table 5.7 Model 2 estimates<br />
Standard errors are reported in parenthesis<br />
LM: LM test with null hypothesis of no-autocorrelation<br />
OV: Omitted Variable test (χ 2 )<br />
* 10% significance; ** 5% significance; *** 1% significance<br />
-0.013<br />
(0.015)<br />
-0.099***<br />
(0.028)<br />
0.303<br />
(p-value 0.998)<br />
2.265<br />
(p-value 0.999)<br />
15.043<br />
(p-value 0.005)<br />
∆swfr ∆hrw<br />
0.022<br />
(0.017)<br />
-0.025<br />
(0.033)<br />
0.543<br />
(p-value 0.935)<br />
25.818<br />
(p-value 0.018)<br />
The omitted variable test for regt − 1z1,t −1<br />
and ( 1− regt<br />
−1<br />
)z 2,t<br />
−1<br />
rejects the null<br />
hypothesis with a p-value of 0.005. In the French equation, the adjustment<br />
coefficients have the right sign, though only the one to the LOP holding with the<br />
intervention price is significant. As expected, for the French price α 1 < α 2 , i.e. it<br />
responds more quickly to the LOP holding with the intervention price than with<br />
the US price. In the US equation, α1 has the right sign but is not significant, and α2<br />
has a negative sign, which means that it doesn’t correctly adjusts to the<br />
disequilibria of the LOP holding between the French and the intervention price.<br />
Actually, the interpretation of the US adjustment coefficient brings some<br />
problems. In fact, the intervention price is assumed to be a threshold for the US<br />
price; a positive, “correct” (in the conventional VECM interpretation) sign for the<br />
US adjustment coefficient would mean that, when the disequilibrium from the<br />
77 Autocorrelation was removed by adding the 12 th differentiated lag. Monthly dummies were selected with<br />
specification tests.<br />
87
Empirical Analysis: Cointegration Models Accounting for Policy Regime Changes<br />
LOP holding between the French and the intervention price is positive (i.e., the<br />
French price is above the intervention price), then the US price is expected to<br />
raise, and the other way round.<br />
In reality, what we observe from the estimates is that the sign of the US<br />
adjustment coefficient is negative. This means that the US price doesn’t adjust to<br />
the disequilibria of the LOP holding with the intervention price. This could just<br />
indicate a non response of the US price to the disequilibria from the LOP holding<br />
between the French and the intervention price.<br />
But another possible, alternative explanation can be figured out. Recalling that<br />
the LOP is holding between the French and the intervention price right because<br />
the latter is above the US price (in other words, when the CAP market regulation<br />
is somehow “binding”), we might think that what happens is that when the<br />
domestic French price is above the intervention price, this is likely to depress the<br />
world’s price through an increase in the export supply (Thompson 2000, p. 720),<br />
and that, alternatively, when the French price is below the intervention price, the<br />
world price would be allowed to increase.<br />
5.2.2.2 Model 3: a changing cointegration vector<br />
As it has been previously explained, the appeal that lead to such a widespread<br />
use of cointegration models in price transmission testing is basically the<br />
possibility of separating long and short run market dynamics.<br />
In this respect, Model 3 is logically complementary to Model 2. Here, indeed,<br />
we assume that the observable regime changes don’t affect the adjustment<br />
parameters, i.e. the short run relations, but the cointegration vector itself.<br />
The French price is still expected to be linked to either the intervention or the<br />
US price according to which of them is higher; however, an attempt at discerning<br />
to which extent the two long-run relationships are different is made. In fact, the<br />
very nature of the relationship holding between the French and the intervention<br />
price is likely to be different from the one with the US price. Obviously, we<br />
suspect that the elasticity of transmission between the French and the intervention<br />
price is higher than the one between the French and the US price.<br />
The cointegration vector is then assumed to be the following one (equation<br />
5.2):<br />
88<br />
swfr =<br />
t − β0<br />
− β1wreft<br />
− β2regt<br />
wreft<br />
zt<br />
where I(<br />
0)<br />
which means that, if hrwt > pintt, and then regt = 1, it becomes<br />
swfr = β + β + β ) hrw + z<br />
t<br />
0<br />
( 1 2<br />
t<br />
t<br />
z t ≈ (5.2)<br />
(5.3)
Empirical Analysis: Cointegration Models Accounting for Policy Regime Changes<br />
and if hrwt < pintt, and regt = 0, the cointegration relation is instead<br />
swfr = β + β pint<br />
+ z<br />
(5.4)<br />
t<br />
0<br />
1<br />
t<br />
t<br />
By combining the composite variable wref with the policy regime dummy, we<br />
obtain a particular cointegration vector whose parameters depend on the policy<br />
regime in place.<br />
The cointegration vector was estimated with an OLS regression; its lagged<br />
residuals (for which the null hypothesis of non-stationarity yields an ADF statistic<br />
of -3.453, p-value 0.100) have been inserted in the VECM. Its estimates are<br />
reported in table 5.8 78 . As expected, the elasticity of transmission is lower with the<br />
US price (0.707-0.022) than with the intervention price (0.707), but, interestingly,<br />
the difference doesn’t seem of a big magnitude. Moreover, such a value is<br />
consistent with the ones estimated for Model 1.<br />
α 3<br />
LM test<br />
OV test z t-1<br />
ARCH (12)<br />
Table 5.8 Model 3 estimates<br />
∆swfr ∆hrw Cointegration vector<br />
-0.073***<br />
(0.023)<br />
0.361<br />
(p-value 0.993)<br />
10.214<br />
(p-value 0.006)<br />
2.027<br />
(p-value 0.999)<br />
0.002<br />
(0.028)<br />
0.583<br />
(p-value 0.910)<br />
25.395<br />
(p-value 0.013)<br />
Standard errors are reported in parenthesis<br />
LM: LM test with null hypothesis of no-autocorrelation<br />
OV: Omitted Variable test (χ 2 )<br />
* 10% significance; ** 5% significance; *** 1% significance<br />
swfr = 1.<br />
400*<br />
* * + 0.<br />
707wref<br />
* * * − 0.<br />
022*<br />
* * reg wref<br />
The omitted variable test for zt rejected the null hypothesis with a p-value of<br />
0.006. Both adjustments coefficients have the right sign; only the French one is<br />
significant. This means that the French price adjusts at a speed of about 7% per<br />
month to the disequilibria from the long run relationship between the French price<br />
and either the US or the intervention price, according to which of them is higher.<br />
The US price seems instead to perform as weakly exogenous even if it can’t be<br />
excluded that this is due to the fact that the intervention price intervenes in the<br />
cointegration vector, and in some periods the US price is then expected to respond<br />
78 Autocorrelation was removed by adding the 12 th differentiated lag. Monthly dummies were selected with<br />
specification tests.<br />
t<br />
( 0.<br />
205)<br />
( 0.<br />
040)<br />
t<br />
( 0.<br />
002)<br />
t<br />
t<br />
89
Empirical Analysis: Cointegration Models Accounting for Policy Regime Changes<br />
to the disequilibria between the French and the intervention price (see previous<br />
paragraph).<br />
5.2.2.3 Model 4: both adjustment coefficients and cointegration parameters can<br />
vary<br />
Finally, in Model 4, both adjustment coefficients and the cointegrating<br />
relationship were allowed to differ according to the policy regime in place. In<br />
equation 5.5, the disequilibrium term zt has been calculated as in Model 3, and<br />
then has been multiplied by the policy regime dummy like in Model 2.<br />
90<br />
t = α regt<br />
1 z t 1 + α − regt<br />
1 z t 1 + ∑ − k 1<br />
4 * − * − 5 * ( 1 − ) * −<br />
i=<br />
1<br />
∆p Γ ∆p + ε<br />
i<br />
t−i<br />
t<br />
(5.5)<br />
What happens is that, if regt-1 = 1, the adjustment coefficients to the LOP<br />
holding with the US price are given by α4; if regt-1 = 0, then the adjustment<br />
coefficients to the LOP holding with the intervention price are given by α5.<br />
The empirical estimates reported in table 5.9 79 show that the adjustment<br />
coefficients of both the US and the EU prices behave consistently with Model 2,<br />
though slightly higher in absolute value.<br />
α 4<br />
α 5<br />
LM test<br />
OV test z 1,t-1, z 2,t-1<br />
ARCH (12)<br />
Table 5.9 Model 4 estimates<br />
∆swfr ∆hrw Cointegration vector<br />
-0.023<br />
(0.026)<br />
-0.260***<br />
(0.049)<br />
0.233<br />
(p-value 0.999)<br />
28.815<br />
(p- value 0)<br />
1.814<br />
(p-value 0.999)<br />
0.021<br />
(0.031)<br />
-0.069<br />
(0.060)<br />
0.537<br />
(p-value 0.938)<br />
28.096<br />
(p-value 0.005)<br />
Standard errors are reported in parenthesis<br />
LM: LM test with null hypothesis of no-autocorrelation<br />
OV: Omitted Variable test (χ 2 )<br />
* 10% significance; ** 5% significance; *** 1% significance<br />
swfr = 1.<br />
400*<br />
* * + 0.<br />
707*<br />
* * wref − 0.<br />
022*<br />
* * reg wref<br />
79 Autocorrelation was removed by adding the 12 th differentiated lag. Monthly dummies were selected with<br />
specification tests.<br />
t<br />
( 0.<br />
205)<br />
( 0.<br />
040)<br />
t<br />
( 0.<br />
002)<br />
t<br />
t
Empirical Analysis: Cointegration Models Accounting for Policy Regime Changes<br />
Interestingly, for the French price, the adjustment coefficients of Model 1 and<br />
3, in which the LOP holds between a combination of US and intervention prices,<br />
are in between the two of Model 2 and 4, where they are allowed to vary<br />
according to which price the LOP holds with.<br />
This is valid also for Model 3 for the US price (in Model 1, the US price is not<br />
present as such but in combination with the intervention price in wref).<br />
The coefficients of the French price have always the expected sign, though<br />
they are significant only when the intervention price is included in the<br />
cointegration equations. US coefficients are instead significant only in Model 1.<br />
To which extent the US price is weakly exogenous (Model 3) or the cointegrating<br />
relationship is mainly driven by the intervention price (Model 2 and 4) requires<br />
further research. Answering to this question poses some interpretative problems,<br />
first of all because the intervention price is introduced as a threshold for the US<br />
price but in theory, when below such threshold, the two might be expected to have<br />
a diverging behaviour; and then also because the US price is assumed to be the<br />
relevant world price, whereas in some years (namely, the campaign 2001/2002),<br />
this might not have been the case.<br />
5.3 Concluding remarks<br />
In this chapter, the relation between soft wheat monthly prices for the US and<br />
France in the years 1978-2003 has been studied by developing various empirical<br />
models following the theoretical considerations made in chapter 4.<br />
The econometric models presented, though simplified, are a first attempt of<br />
combining policy and price data; the EU intervention price has then been used in<br />
different ways to take into account the role played by policy regime changes. The<br />
basic idea is that the intervention price acts as a threshold for the US price.<br />
Although empirical evidence is mixed in this respect, in our data domestic<br />
French prices turn out not to be cointegrated with the US ones. Indeed, what we<br />
argue is that this confirms that the presence of EU domestic and border policies<br />
prevents the two prices from sharing the same pattern, and need to be adequately<br />
considered when testing for price transmission.<br />
First of all, the regime switch has been modelled via the creation of a<br />
composite variable, the “EU external reference price”, constituted by the<br />
maximum between the US and the intervention price. Evidence of cointegration is<br />
found with the French price. This means that, basically after the MacSharry<br />
reform of 1993, which reduced the intervention price allowing the US one to be<br />
much more often above it, the US prices interacted more with the EU domestic<br />
ones. We might argue that the reduction in intervention prices, despite a nonchanging<br />
system of policy barriers, was what actually increased the degree of<br />
91
Empirical Analysis: Cointegration Models Accounting for Policy Regime Changes<br />
interaction between the EU internal prices and the US ones. By lowering<br />
intervention prices, both export subsidies and variable levies were in fact reduced.<br />
Secondly, a specific cointegration model has been estimated between the EU<br />
and the US prices, with different adjustments coefficients depending on the<br />
observable policy regime observations belong to. The LOP has been imposed<br />
between the French price and the highest between the US and the intervention<br />
price. The French price responds more to the LOP holding with the intervention<br />
price, but also the adjustment coefficient to the LOP holding with the US price<br />
has the correct sign. In turn, the interpretation of the coefficients of the US price is<br />
somehow problematic.<br />
Thirdly, it is the price transmission elasticity which has been allowed to<br />
change, depending on the policy regime in place (once again, assuming that the<br />
French price is linked to either the US or the intervention price according to which<br />
of them is higher). The price transmission elasticity between the French and the<br />
intervention price is found to be stronger than the one with the US price. The<br />
French price adjusts to the disequilibria from the long run relation between the<br />
French price and either the US price or the intervention price, according to which<br />
of them is higher. The US price is weakly exogenous.<br />
Finally, in Model 4, both adjustment coefficients and the cointegrating vector<br />
parameters are allowed to vary. Results are consistent with the previous ones.<br />
The models presented here, though over-simplified, represent an attempt of<br />
explicitly combining policy and price data. The observable policy regime change<br />
has been simulated with the construction of an ad hoc composite variable and<br />
other econometric devices.<br />
The consistent behaviour of EU adjustment coefficients suggests that the role<br />
of the US price might be understood only in light of adequate consideration for<br />
policy regimes.<br />
The response of the French price is consistent throughout all the models: this<br />
price responds correctly to the disequilibria from the various long run<br />
relationships in which the intervention price has been introduced in different<br />
ways. The adjustment coefficients always have the correct sign, although they<br />
tend to be significant and higher in magnitude when the intervention price is<br />
included in the cointegration vector. Indeed, they are bounded between -0.013<br />
(response to the LOP holding with the US price; model 2) and -0.260 (response to<br />
the LOP holding with the intervention price with a changing cointegration vector;<br />
model 4). However, they tend to be around 0.100 (see all model 1 estimates;<br />
model 3) when the wref series is included in the cointegration vector.<br />
We could say that, once the EU regulatory framework has been taken into<br />
account, a positive albeit small response to the behaviour of the US price emerges.<br />
The response of the US price leaves instead some questions open. US<br />
adjustment coefficients are usually much smaller in value and not significant<br />
92
Empirical Analysis: Cointegration Models Accounting for Policy Regime Changes<br />
(when they have the expected sign, i.e., positive, they are bounded between 0.002,<br />
model 3, and 0.063, model 1b; when they are negative, they are bounded between<br />
-0.069, model 4, and -0.007, model 1).<br />
This could be due to its exogeneity in the system, as model 3 would imply; but,<br />
also, the cointegration relation might be mostly driven by the intervention price<br />
(as can be noted in model 2 and 4), which in turns brings some interpretative<br />
problems. Indeed, the introduction of this threshold could explain why the US<br />
price has a negative adjustment coefficient (see paragraph 5.2.2.1).<br />
A final consideration concerns the reference period which has been used for the<br />
analysis.<br />
In this work, in order to study in depth the role of domestic and border policies<br />
on price transmission, verifying the effects of the major changes they underwent<br />
in the past years, the use of longer time series (Eurostat data), which would allow<br />
to go back in time, has been preferred.<br />
Unfortunately, this in turn implies the impossibility of using more recent data,<br />
and of considering what has recently happened on world markets.<br />
The current rise in food prices (figure 5.3), which started in the summer of<br />
2007, brought renewed interest in the debate on the appropriateness of agricultural<br />
domestic and border policies. At the same time, these issues are also currently<br />
discussed in the so-called “Health Check” of the CAP (European Commission,<br />
COM(2007) 722, and COM(2008) 306/4). The Health Check debate has the<br />
objective of completing the Fischler reform of 2003 and of establishing the new<br />
set of rules which will hold up to 2013.<br />
450<br />
350<br />
250<br />
150<br />
50<br />
2000:01<br />
2001:01<br />
Figure 5.3 French and US prices in the last years<br />
2002:01<br />
2003:01<br />
2004:01<br />
Source: ISMEA; International Grains Council<br />
2005:01<br />
2006:01<br />
French soft milling wheat<br />
hrw<br />
2007:01<br />
2008:01<br />
93
Empirical Analysis: Cointegration Models Accounting for Policy Regime Changes<br />
In addition to this, as explained in the introduction of this chapter, soaring food<br />
prices immediately caused major changes in the world trade environment.<br />
As high prices signal food scarcity, importers have removed import duties<br />
(such as the elimination of the EU tariffs for cereals up to 2009), while major<br />
exporters like Ukraine and Argentina have implemented, in turn, export taxes.<br />
These measures are of course expected to affect price transmission dynamics.<br />
For these reasons, the study of the most recent dynamics on world markets,<br />
which goes well beyond the use of more up-to date data, probably constitutes the<br />
most interesting development of the model presented.<br />
94
6 EMPIRICAL ANALYSIS: COINTEGRATION<br />
MODELS, STRUCTURAL BREAKS AND<br />
POLICY REFORM<br />
6.1 Introduction<br />
In this last chapter, a further investigation of the relationship between the EU<br />
and the US prices for soft wheat is proposed.<br />
Differently from chapter 5, where a policy variable, the intervention price, was<br />
introduced in the empirical models to consider policy regimes, here policy regime<br />
changes will instead be assumed to be directly responsible for structural breaks in<br />
the cointegration vector which links, in the long run, EU and US prices.<br />
Our research question is as follows: did the CAP reforms and the URAA<br />
implementation affect the relation between the two prices considered? We expect<br />
that the first, by reducing intervention prices, should have reduced the distance<br />
between EU and world prices; the second, by disciplining policy intervention,<br />
should have increased the price transmission elasticity.<br />
This means that no other variables are introduced in addition to the domestic<br />
EU prices and the US ones; instead, the cointegration relationship is allowed to<br />
vary according to the most relevant policy regime changes.<br />
This represents an alternative development of the econometric estimates<br />
proposed in chapter 5, that, focusing on the relationship between just the two<br />
prices, allows to avoid some of the interpretative problems which have been<br />
presented there. The underlying assumption here is that the two prices have<br />
always been interacting despite the presence of domestic and border policies, and<br />
that the policy regime switches had an impact on an existing relation.<br />
The chapter is structured as follows. In paragraph 6.2, a short introduction to<br />
the theoretical framework used is proposed, explaining what is the rationale<br />
behind the use of cointegration models allowing for structural breaks in the<br />
deterministic trend. In paragraph 6.3, unit root tests accounting for structural
Empirical Analysis: Cointegration Models, Structural Breaks and Policy Reform<br />
breaks are carried out and commented. The cointegration analysis is presented in<br />
paragraph 6.4, while paragraph 6.5 presents some concluding remarks.<br />
6.2 Policy regimes, structural breaks and price transmission<br />
According to the regulatory framework presented in chapter 4, since the EU<br />
market is isolated from the world one by variable levies and export subsidies,<br />
there should be, in theory, zero price transmission between the world and the EU<br />
price. Only if the world price is above the entry price (and consequently, above<br />
the intervention price, which is by definition below the entry price), we expect a<br />
positive price transmission elasticity with the domestic EU price.<br />
Moreover, if the EU policy measures are binding, not only is the transmission<br />
from the world to the EU price zero, but the one from the intervention price to the<br />
world one should be negative, since increases in the first will depress the latter<br />
through the increase in the EU net export supply (Thompson 2000).<br />
In chapter 5, various models have been adopted in order to allow for policy<br />
regime changes to be considered in cointegration models. In a nutshell, the<br />
introduction in the models of a policy variable, the intervention price, allows to<br />
distinguish between different policy regimes, in which we expect different price<br />
transmission relations to be in place.<br />
In this chapter, the relation between the world (US) and the EU (French) price<br />
is instead studied by considering structural breaks. This allows to avoid a number<br />
of interpretative problems which arise when policy variables are introduced in the<br />
model (see paragraph 5.2).<br />
We have proved already that the US and the EU prices turn out not to be<br />
cointegrated when standard Johansen tests are used (see the analysis reported in<br />
paragraph 5.2.1, and annex C). However, evidence of stationarity emerges when<br />
conventional unit root tests are repeated on the French-US price spread both in the<br />
overall sample and in the different subsamples (see annex D).<br />
We also noticed that empirical evidence is mixed, since in some works comovement<br />
between internal EU prices and the US prices is found (Thompson and<br />
Bohl 1999; Thompson et al. 2000; Thompson et al. 2002a and 2002b; see<br />
paragraph 5.2.1 and annex A).<br />
Thompson (2000, p.723) argues that finding a low but nonzero price<br />
transmission elasticity also before the tariffication introduced by the URAA might<br />
be due to the fact that, in fixing domestic prices, the EU legislator responds<br />
somehow to the behaviour of world prices: increasing the intervention price<br />
relieves the budget in a situation of overproduction, and EU institutions will do<br />
this probably more with high than with low world prices (see also Thompson et<br />
al. 2000, p.723). The intervention and, in turn, the French price, could follow the<br />
world ones.<br />
96
Empirical Analysis: Cointegration Models, Structural Breaks and Policy Reform<br />
In addition to this, more interestingly, also market-oriented policy reforms<br />
could have played a role. We expect the MacSharry reform to have lowered EU<br />
domestic prices, and possibly reduced their distance from the world ones, and the<br />
URAA, depending on the effectiveness of tariffication, to have increased price<br />
transmission elasticities (Thompson et al. 2000, p.722).<br />
Also in this respect, empirical evidence is mixed. Thompson and Bohl (1999),<br />
by using threshold cointegration models, find low price transmission elasticities,<br />
but increasing (from 0.18 to 0.30) after the liberalization reforms. Thompson et al.<br />
(2000), by ordinary OLS and 3SLS (3 Stages Least Squares) regressions, show a<br />
negative impact of the MacSharry reform on the level of the European prices, but<br />
also that the implementation of the URAA did not change the elasticity of price<br />
transmission between world and domestic prices, whose value is about 0.11. The<br />
same results apply to Thompson et al. (2002b). They find a price transmission<br />
elasticity of 0.18; the MacSharry reform is found to have caused a significant<br />
downward shift in domestic EU prices (its coefficient is -0.23), but an interaction<br />
term is not significant, which means that no increases in the price transmission<br />
elasticity took place. Thompson et al. (2002a), instead, by estimating a SURECM<br />
in different sub-samples according to the policy regimes in place, find evidence of<br />
increased price co-movement after the URAA implementation, although their<br />
price transmission coefficient is still small (0.183). The objective of this<br />
paragraph is then to analyze the existence and the evolution of a long run<br />
relationship between US and EU prices. This analysis can represent an interesting<br />
tool for the analysis of broader policy issues. Studying the implementation of the<br />
URAA can provide insights into the effects of more general liberalization<br />
reforms; analyzing the effects of the reduction of the intervention prices, in turn,<br />
is of a crucial importance in the current “Health Check” debate of the CAP, in<br />
which the elimination of this instrument is currently being considered. By using<br />
cointegration techniques allowing for structural breaks in the deterministic trend,<br />
it is possible to take into account observable policy regime changes. These are<br />
assumed to influence both the constant and the price transmission elasticity of the<br />
cointegration relation. This allows, on one side, to consider the time series<br />
properties of the data and, on the other, to take the entire number of observations<br />
available as a whole, studying the effects of the policy changes over time.<br />
6.3 Unit root tests and structural breaks<br />
Structural breaks due to policy reforms are likely to have affected both the<br />
pattern of EU prices and their long run relationship with the US ones.<br />
As far as European wheat prices are concerned, we expect that the MacSharry<br />
reform, by dramatically lowering intervention prices, did indeed constitute a<br />
structural break which should not be ignored while testing for unit roots. As<br />
97
Empirical Analysis: Cointegration Models, Structural Breaks and Policy Reform<br />
explained in paragraph 3.3.1, the risk is that, without considering the presence of<br />
structural breaks, prices could result I(1) processes while indeed they are<br />
stationary around a broken level or trend. Although the standard unit root tests<br />
carried out in the two sub-samples identified as before and after the MacSharry<br />
reform (reported in annex B), that find all the series I(1), are an indirect<br />
confirmation of the appropriateness of this reasoning, also specific unit root tests<br />
which allow for the presence of one or more endogenous structural breaks are<br />
carried out.<br />
The presence of unit roots allowing for structural breaks has been tested with<br />
the Perron and Vogelsang (1992), both additional outlier (AO) and innovational<br />
outlier (IO) tests, and with Clemente et al. (1998) tests (for a description, see<br />
paragraph 3.3.1). The dataset is the same as the one described in paragraph 4.4<br />
and used for the analysis in chapter 5. All prices have been used in logarithmic<br />
form. Results are reported in tables 6.1 and 6.2. In order to better understand the<br />
behaviour of the French price, the intervention price time series has been<br />
examined, as well.<br />
98<br />
Table 6.1 Perron and Vogelsang (1992) tests<br />
AO model IO model<br />
Lags Time of t stat on 5% Lags Time of t stat on 5%<br />
the break (ρ-1) critical value the break (ρ-1) critical value<br />
swfrt 12 1993:08*** -3.082 -3.560 12 1993:05*** -4.549** -4.270<br />
pintt 14 1993:08*** -1.814 -3.560 13 1993:04*** -5.810** -4.270<br />
hrwt 1 1986:05*** -3.998** -3.560 1 1985:01*** -4.191 -4.270<br />
***indicates rejection of the null hypothesis at 1%; ** at 5%; * at 10% significance<br />
swfr t<br />
pint t<br />
hrw t<br />
Table 6.2 Clemente et al. (1998) tests<br />
AO model IO model<br />
Lags Time of t stat on 5% Lags Time of t stat on 5%<br />
the break (ρ-1) critical value the break (ρ-1) critical value<br />
12<br />
1993:08***;<br />
1998:01 ***<br />
-3.719 -5.490 12<br />
1993:05***;<br />
1997:12***<br />
-5.934** -5.490<br />
14<br />
1993:08***;<br />
-2.092 -5.490 13<br />
1993:04***;<br />
-6.838** -5.490<br />
17<br />
2001:08 ***<br />
1986:09***;<br />
1996:02***<br />
-3.968 -5.490 1<br />
2001:05***<br />
1985:01***;<br />
2000:06**<br />
***indicates rejection of the null hypothesis at 1%; ** at 5%; * at 10% significance<br />
-4.562 -5.490<br />
As expected, the behaviour of the French price follows the one of the<br />
intervention price, due of course to the strong regulatory framework in place.
Empirical Analysis: Cointegration Models, Structural Breaks and Policy Reform<br />
With the additional outlier model, both for the French and the intervention<br />
price it is not possible to reject the null hypothesis of a unit root with structural<br />
break, occurred in August 1993. If two breaks are allowed, the situation is much<br />
less clear-cut; the 2001:08 break in the intervention price series coincides with the<br />
full implementation of Agenda 2000, but doesn’t correspond to the one in the<br />
French price. Provided that the change caused by the MacSharry reform is very<br />
likely to have had a strong immediate effect rather than a gradual one, as<br />
confirmed by visual inspection of the series, for these two prices the innovational<br />
outlier model, both allowing for one and two breaks, (according to which the<br />
French and the intervention price are both I(0) processes) seems less appropriate,<br />
(and indeed, the time of the break moves backwards to a date which has no<br />
political sense 80 ). For the US price it is possible to reject the unit root null<br />
hypothesis only in the AO model allowing for one break, only. This time the<br />
interpretation of the timing of the structural breaks is not immediate. The Zivot<br />
and Andrews test has been performed, as well (table 6.3). Both the French and the<br />
intervention prices turn out to be I(0) around a broken intercept. Nevertheless,<br />
remembering that the null hypothesis of unit root in this test excludes the presence<br />
of a structural break, and on the basis of the results of standard unit root tests<br />
carried out in the two subsamples identified as before and after the structural<br />
break constituted by the MacSharry reform (which, as recalled before, find<br />
evidence of nonstationarity; annex B), we conclude that the use of this test is not<br />
appropriate for the French and intervention price. For the US price it is not<br />
possible to reject the null hypothesis of a unit root process without structural<br />
break.<br />
Table 6.3 Zivot and Andrews (1992) tests<br />
AIC lagmethod TTest lag method<br />
Lags Time of t stat 5% Lags Time of t stat 5%<br />
the break critical value the break<br />
critical value<br />
swfrt 1 1993:07 -5.702** -4.80 1 1993:07 -5.702** -4.80<br />
pint t 1 1993:06 -6.042** -4.80 0 1993:06 -5.795** -4.80<br />
hrw t 1 1986:01 -4.686 -4.80 1 1986:01 -4.686 -4.80<br />
AIC/TTest lag method: AIC criterion/5% significance of the t-test used for lag selection<br />
***indicates rejection of the null hypothesis at 1%; ** at 5%; * at 10% significance<br />
In order to test for the presence of a unit root in the French price differentiated<br />
series, provided the structural break identified in the French price evidently<br />
80 While, for the French price, this might suggest the hypothesis of some “rational expectations” behaviour of<br />
market operators whose actions anticipate the following reduction in the intervention price, this is actually not<br />
the case since the same occurs for the intervention price, which is the very policy variable.<br />
99
Empirical Analysis: Cointegration Models, Structural Breaks and Policy Reform<br />
corresponds to the MacSharry reform, reference can be made to standard unit root<br />
tests which have been repeated on the log-differentiated series in the two subsamples<br />
identified as before and after the MacSharry reform (see annex B). For<br />
the US price, which most plausibly seems to be a I(1) process with no relevant<br />
structural breaks, evidence of its first-difference stationarity is confirmed by the<br />
conventional unit root tests reported in annex B.<br />
6.4 A cointegration model allowing for structural breaks<br />
At this point, the Johansen, Mosconi and Nielsen (2000) model has been tested<br />
on the data 81 .<br />
The model presented in paragraph 3.3.2.3, that is<br />
100<br />
⎡β⎤<br />
' ⎡ pt<br />
−1<br />
⎤<br />
k−1<br />
k q<br />
∆pt = α⎢<br />
+ γEt<br />
+ Γ ∆pt<br />
i<br />
k D j, t k i ε<br />
i 1 1 +<br />
i 1 j 2 i, j + t<br />
µ<br />
⎥ ⎢<br />
tE<br />
⎥ ∑ =<br />
− ∑ = ∑ =<br />
+ −<br />
⎣ ⎦ ⎣ t−1<br />
⎦<br />
(6.1)<br />
has been estimated restricting the broken level to the cointegration space 82 , the<br />
only difference being the insertion of a constant term and the corresponding<br />
elimination of one of the q dummy variables used. This means that the<br />
coefficients of the dummies indicating the policy regimes will have to be<br />
interpreted as relative to the constant valid in the overall period. Throughout this<br />
chapter, the underlying assumption is that the rank of the cointegration matrix<br />
between the French and the US price series, once the various structural breaks<br />
have been taken into account, is one. And this because in the estimated models<br />
more than 2 structural breaks will be introduced, differently from the Johansen,<br />
Mosconi and Nielsen (2000) procedure, which doesn’t allow to test for the<br />
cointegration rank with more than 2 structural breaks. According to conventional<br />
Johansen’s test, the EU and the US price are not cointegrated (when tested in the<br />
restricted constant option with 5 lags 83 , the null hypothesis of a zero rank in the<br />
cointegration matrix yield a trace and λ-max statistics of 16.086, p-value 0.173,<br />
and 12.538, p value 0.161, respectively). Nonetheless, standard ADF tests have<br />
been repeated on all the long-run residuals of the models estimated and confirm<br />
that they are I(0) at 5% level of significance.<br />
81 The prices have been de-seasonalized with the TRAMO/SEATS method developed by V. Gomez, A.<br />
Maravall (http://www.bde.es/servicio/software/econome.htm), in order to remove autocorrelation in the<br />
residuals. Unit root tests have been repeated on the de-seasonalized series and are reported in annex E.<br />
82 I.e., t = γ = 0. Indeed, the series don’t show any linear trend in levels, but the presence of a constant in the<br />
cointegration space is needed to account for all those factors contributing to price differentials not explicitly<br />
modelled.<br />
83 The optimum number of lags selected for the underlying VAR is 5 according to the SBIC.
Empirical Analysis: Cointegration Models, Structural Breaks and Policy Reform<br />
In the first VECM estimates, based on policy considerations (see paragraph<br />
4.2.2), three basic structural breaks are imposed:<br />
the implementation of the MacSharry reform in 1993:07, which we expect had<br />
the effect of lowering the French price, due to the reduction of intervention<br />
prices (dummy variable reg1t = 1 if t ≥ 1993:07, and 0 otherwise);<br />
the implementation of the URAA in 1995:07, which, if tariffication was<br />
effectively in place, should have increased price transmission elasticities. For<br />
this reason, both the dummy reg2t = 1 if t ≥ 1995:07, and 0 otherwise, and the<br />
interaction term reg2hrwt = hrwt * reg2t are introduced in the cointegration<br />
vector;<br />
Agenda 2000 reform, that also set the lowering of intervention prices (reg3t =<br />
1 if t ≥ 2000:07, and 0 otherwise).<br />
By inserting these regime dummies and the interaction term, the cointegration<br />
vector becomes (assuming it is normalized with respect to the French price):<br />
[ swfr β hrw β reg β reg2<br />
β reg2hrw<br />
β reg3<br />
]<br />
t<br />
0<br />
1<br />
t<br />
2<br />
1t 3 t 4<br />
t 5<br />
β (6.2)<br />
Based on the effects that the various policy regime changes are likely to have<br />
had, we can make some assumptions concerning the expected sign of the<br />
parameters; we expect:<br />
β0 < 0, i.e., a positive constant term in the cointegration relationship;<br />
β1 < 0 and, presumably, -1 ≤ β1 < 0, i.e., overall, a positive price transmission<br />
elasticity between the US and the EU price, which might be at the most equal<br />
to 1 (perfect price transmission);<br />
β2 , β5 > 0, since both the implementation of the MacSharry reform and of<br />
Agenda 2000 are expected to have lowered the French price;<br />
β4 < 0 (and, possibly, │β4 + β1│≤ 1), since we expect the URAA to have<br />
increased the value of the price transmission elasticity, at maximum up to the<br />
value of 1 (perfect price transmission) after the URAA.<br />
Estimates are reported in table 6.4.<br />
In the cointegration vector β1 = -0.250 and β4 = -0.314; this means that, after<br />
the URAA implementation, the price transmission elasticity between the two<br />
prices has increased up to the value of 0.564. As expected, β2, β3, β5 > 0; this<br />
means that the constant of the cointegration relation between the French and the<br />
US price decreased (most likely, as the French price decreased following the<br />
implementation of the MacSharry and of Agenda 2000 reforms), from 3.835 to<br />
3.671 (i.e., 3.835-0.164) after the Mac Sharry reform, to 2.009 (3.835-0.164-<br />
1.662) after the URAA implementation, and to 1.918 (3.835-0.164-1.662-0.091)<br />
after Agenda 2000.<br />
t<br />
101
Empirical Analysis: Cointegration Models, Structural Breaks and Policy Reform<br />
α<br />
∆swfr t-1<br />
∆swfr t-2<br />
∆swfr t-3<br />
∆swfr t-4<br />
∆hrw t-1<br />
∆hrw t-2<br />
∆hrw t-3<br />
∆hrw t-4<br />
102<br />
Table 6.4 VECM with structural breaks: EU and WTO policy regimes<br />
∆swfrt ∆hrwt Cointegration vector<br />
-0.044***<br />
0.142***<br />
(0.014)<br />
(0.047)<br />
-0.109*<br />
(0.060)<br />
0.080<br />
(0.202)<br />
β0 -3.835***<br />
(0.347)<br />
0.308***<br />
(0.060)<br />
0.255<br />
(0.203)<br />
β1 -0.250***<br />
(0.069)<br />
0.281***<br />
(0.062)<br />
-0.518**<br />
(0.208)<br />
β2 0.164**<br />
(0.049)<br />
0.195***<br />
(0.064)<br />
-0.064<br />
(0.216)<br />
β3 1.662<br />
(0.819)<br />
0.023<br />
(0.018)<br />
0.334***<br />
(0.062)<br />
β4 -0.314<br />
(0.166)<br />
-0.053***<br />
(0.019)<br />
-0.038<br />
(0.065)<br />
β5 0.091<br />
(0.049)<br />
-0.004<br />
0.057<br />
(0.019)<br />
(0.065)<br />
-0.066***<br />
0.047<br />
(0.019)<br />
(0.063)<br />
LM 2.249 (p-value 0.003) 0.717 (p-value 0.792) β 1 + β 4 = -1 χ 2 = 2.318 (p-value 0.128)<br />
ARCH(5) 11.628 (p-value 0.040) 12.381(p-value 0.030) β 2,β 3,β 4,β 5 = 0 χ 2 = 14.525 (p-value 0.006)<br />
SBIC -8.146 HQN -8.595<br />
Standard errors in parenthesis. *significant at 10%; **significant at 5%; *** significant at 1% for the null<br />
hypothesis of zero coefficients<br />
LM: LM test with null hypothesis of no-autocorrelation up to the 18 th lag. ARCH(5): LM test with the null<br />
hypothesis of no ARCH effects up to the 5 th lag. SBIC : Schwartz's Bayesian Information criterion. HQN:<br />
Hannan-Quinn Information criterion<br />
Both the French and the US adjustment coefficients (α) are significant and<br />
have the right sign: both prices respond to the disequilibria from the long-run<br />
relation where structural breaks have been taken into account. Interestingly, the<br />
US coefficient is higher in absolute value. This means that, being both adjustment<br />
coefficients significant, although none of the price is weakly exogenous, the US<br />
price responds more quickly to the disequilibria from the long run relation than<br />
the French price. However, the French price equation still displays<br />
autocorrelation, which indicates evidence of misspecification in the model.Indeed,<br />
within the simple model which has been presented, some additional factors can be<br />
considered (see paragraph 4.2.2), which also define specific policy regimes,<br />
although shorter in time, that have affected price transmission. First of all, we<br />
introduce export taxes, that have been imposed for very short periods of time (t1t<br />
=1 if 1984:08 ≤ t ≤ 1985:04 and zero otherwise; t2t =1 if 1995:12 ≤ t ≤ 1996:09<br />
and zero otherwise), and the inflow of Russian and Ukrainian grains (ut = 1 if<br />
2001:07 ≤ t ≤ 2002:12 and zero otherwise). Introducing these additional factors,<br />
the cointegration vector becomes:
Empirical Analysis: Cointegration Models, Structural Breaks and Policy Reform<br />
[ β β hrw β reg1<br />
β reg2<br />
β reg2hrw<br />
β reg3<br />
β t1<br />
β t2<br />
β u ]<br />
swfrt 0 1 t 2 t 3 t 4<br />
t 5 t 6 t 7 t 8<br />
t<br />
(6.3)<br />
As explained in chapter 3, all these factors are expected to have lowered the<br />
French prices with respect to the US ones, that is, β6, β7, β8 > 0, without having a<br />
direct impact on price transmission elasticities. Estimates are reported in table 6.5.<br />
α<br />
Table 6.5 VECM with structural breaks: EU and WTO policy regimes, export taxes,<br />
2001/02 campaign<br />
∆swfr t-1<br />
∆swfr t-2<br />
∆swfr t-3<br />
∆swfr t-4<br />
∆hrw t-1<br />
∆hrw t-2<br />
∆hrw t-3<br />
∆hrw t-4<br />
∆swfrt ∆hrwt Cointegration vector<br />
-0.066***<br />
(0.010)<br />
0.012<br />
(0.040) β0 -3.810***<br />
(0.367)<br />
-0.175***<br />
(0.060)<br />
0.297<br />
(0.227) β1 -0.257***<br />
(0.074)<br />
0.231***<br />
(0.060)<br />
0.282<br />
(0.228) β2 0.164**<br />
(0.045)<br />
0.256***<br />
(0.060)<br />
-0.488**<br />
(0.228) β3 -0.664<br />
(1.061)<br />
0.197***<br />
(0.062)<br />
0.147<br />
(0.235) β4 0.170<br />
(0.218)<br />
0.031*<br />
(0.017)<br />
0.324***<br />
(0.066) β5 -0.236***<br />
(0.074)<br />
-0.055***<br />
(0.018)<br />
-0.118*<br />
(0.069) β6 -0.013<br />
(0.100)<br />
0.008<br />
(0.018)<br />
0.062<br />
(0.069) β7 -0.179*<br />
(0.118)<br />
-0.079***<br />
(0.018)<br />
0.0002<br />
(0.068) β8 0.372***<br />
(0.082)<br />
LM 1.161 (p-value 0.296) 0.547 (p-value 0.932) β1 + β4 = -1 χ2 = 9.213 (p-value 0.002)<br />
ARCH (5) 24.667(p-value .0002) 11.540 (p-value 0.042)<br />
β 2,β3, β4, β5, β6, β7, β8 = 0<br />
χ2 = 34.668 (p-value 0)<br />
SBIC -7.404 HQN -8.301<br />
Standard errors in parenthesis. *significant at 10%; **significant at 5%; *** significant at 1% for the null<br />
hypothesis of zero coefficients<br />
LM: LM test with null hypothesis of no-autocorrelation up to the 18 th lag. ARCH(5): LM test with the null<br />
hypothesis of no ARCH effects up to the 5 th lag. SBIC : Schwartz's Bayesian Information criterion. HQN:<br />
Hannan-Quinn Information criterion<br />
The autocorrelation in the French equation has been removed. This time, even<br />
if both the French and the US adjustment coefficients have the expected sign, the<br />
US one is not significant, which may suggest its weak exogeneity. In the<br />
cointegration vector, although β0, β1 and β2 have very similar values to those<br />
reported in table 6.4 where the additional factors were not considered, β4, β6 and<br />
β7 have not the expected sign. For the latter two, this might well depend on the<br />
short number of observations available for these specific regimes, since export<br />
taxes were imposed for a very few months. Instead, β8 > 0 as expected; moreover,<br />
103
Empirical Analysis: Cointegration Models, Structural Breaks and Policy Reform<br />
as the two dummies largely overlap, this might explain why β5 , the coefficient of<br />
the dummy associated to the MacSharry reform, gets a negative sign. For this<br />
reason, the model is estimated without export taxes (table 6.6). This time, all the<br />
coefficients of the cointegration vector have the expected sign (for β5, the same<br />
consideration made for the previous model holds). Both adjustment coefficients<br />
have the expected sign. Once again, the US price performs as weakly exogenous.<br />
Table 6.6 VECM with structural breaks: EU and WTO policy regimes, 2001/02 campaign<br />
α<br />
∆swfr t-1<br />
∆swfr t-2<br />
∆swfr t-3<br />
∆swfr t-4<br />
∆hrw t-1<br />
∆hrw t-2<br />
∆hrw t-3<br />
∆hrw t-4<br />
104<br />
∆swfrt ∆hrwt Cointegration vector<br />
-0.067***<br />
0.048<br />
(0.012)<br />
(0.043)<br />
-0.185***<br />
(0.058)<br />
0.198<br />
(0.213)<br />
β0 -4.066***<br />
(0.310)<br />
0.248***<br />
(0.060)<br />
0.334<br />
(0.219)<br />
β1 -0.203***<br />
(0.062)<br />
0.255***<br />
(0.060)<br />
-0.416*<br />
(0.218)<br />
β2 0.163**<br />
(0.044)<br />
0.175***<br />
(0.062)<br />
0.010<br />
(0.225)<br />
β3 1.072<br />
(0.740)<br />
0.025<br />
(0.018)<br />
0.311***<br />
(0.064)<br />
β4 -0.190<br />
(0.150)<br />
-0.046**<br />
(0.018)<br />
-0.078<br />
(0.067)<br />
β5 -0.154**<br />
(0.062)<br />
0.001<br />
(0.018)<br />
0.042<br />
(0.067)<br />
β8 0.380***<br />
(0.079)<br />
-0.066***<br />
0.025<br />
(0.018)<br />
(0.065)<br />
LM 1.554 (p value 0.074) 0.564 (p value 0.922) β1 + β4 = -1 χ 2 ARCH<br />
(5)<br />
13.525 (pvalue 0.019) 13.519 (p value 0.019)<br />
= 15.920 (p-value 0)<br />
β 2,β3, β4, β5, β6, β7 = 0<br />
χ 2 = 33.485 (p-value 0)<br />
SBIC -7.910 HQN -8.508<br />
Standard errors in parenthesis. *significant at 10%; **significant at 5%; *** significant at 1% for the null<br />
hypothesis of zero coefficients<br />
LM: LM test with null hypothesis of no-autocorrelation up to the 18 th lag. ARCH(5): LM test with the null<br />
hypothesis of no ARCH effects up to the 5 th lag. SBIC : Schwartz's Bayesian Information criterion. HQN:<br />
Hannan-Quinn Information criterion<br />
Since this third model presents better information criteria than the one<br />
presented in table 6.5, this last one is preferred. The null hypothesis of a perfect<br />
price transmission elasticity after the URAA implementation cannot be accepted.<br />
The long run residuals of the model (figure 6.1; EC 1 dotted line, left-hand scale)<br />
show a stationary behaviour around zero. These long run residuals from the<br />
cointegration relation in which structural breaks are included are compared with<br />
the series called residuals = ( swfrt - 0.203 * hrwt ) (figure 6.1; residuals;<br />
unbroken line, right-hand scale), obtained just subtracting from the French price<br />
the US one multiplied by its overall transmission parameter. This series is of<br />
course higher in magnitude, as the constant term is missing, and is reported to
Empirical Analysis: Cointegration Models, Structural Breaks and Policy Reform<br />
show how the residuals from the overall cointegration relation have a constant<br />
which changes over time, in correspondence to structural breaks. In particular, the<br />
two series have a common patter up to 1993:06, after which the structural breaks<br />
are considered in the error correction term of the VECM estimated by allowing<br />
for a lower constant and an increased price transmission elasticity.<br />
Figure 6.1 Long run residuals of the VECM with structural breaks (EU and WTO policy<br />
regimes, 2001/02 campaign)<br />
0,8<br />
0,6<br />
0,4<br />
0,2<br />
0<br />
-0,2<br />
-0,4<br />
1978:12<br />
1980:12<br />
1982:12<br />
1984:12<br />
1986:12<br />
1988:12<br />
1990:12<br />
When cointegration is present, we expect IRFs not to always die out: their<br />
effect can be permanent, as the whole system will move to a new long run<br />
equilibrium. Both transitory and permanent shocks can be present (Goodwin et al.<br />
1999, p.168). To calculate orthogonal IRFs, the ordering of the Choleski<br />
decomposition for the VAR reformulated in levels is swfrt, hrwt. This means that,<br />
at time t, the French price depends on only one contemporaneous structural shock,<br />
whereas the US price depends on the two of them. We could interpret the first one<br />
as a shock occurring in the EU market, which affects contemporaneously both the<br />
French and the US price, and the second one as a shock happening on world<br />
markets, which at time t affects the US price only. In other words, we assume that<br />
the US price has no contemporaneous effects on the French price, but lagged<br />
values of the US price have an effect on the French price. The French price has,<br />
instead, a contemporaneous effect on the US one. We see that all IRFs, for a 12<br />
months time horizon, are generally low but different from zero (figure 6.2), with<br />
the exception of the French response to a shock in the US price. Both the French<br />
and the US price response to a shock in themselves tend to be persistent, whereas<br />
the response of each price to a shock in the other price is generally lower and<br />
1992:12<br />
1994:12<br />
1996:12<br />
1998:12<br />
EC 3<br />
residuals 3<br />
2000:12<br />
2002:12<br />
4,2<br />
4<br />
3,8<br />
3,6<br />
3,4<br />
3,2<br />
3<br />
105
Empirical Analysis: Cointegration Models, Structural Breaks and Policy Reform<br />
shows an upward pattern. In the long run, the ratio between the effects of a shock<br />
to the French price on swfr and hrw is 0.473, the long run transmission elasticity.<br />
106<br />
Figure 6.2 IRFs of the VECM with structural breaks (EU and WTO policy regimes,<br />
2001/02 campaign)<br />
0,1<br />
0,08<br />
0,06<br />
0,04<br />
0,02<br />
0<br />
-0,02<br />
1 2 3 4 5 6 7 8 9 10 11 12<br />
6.4.1 Assessing the robustness of the cointegration vector<br />
To assess the robustness of the parameters of the cointegration vector, the<br />
estimates have been repeated also using an alternative estimator for cointegrated<br />
systems, the Dynamic OLS estimator (or DOLS) developed by Stock and Watson<br />
(1993). Indeed, the models presented in tables 6.4, 6.5 and 6.6 have been reestimated<br />
by inserting the relevant policy regime dummies in equations like 6.4:<br />
t = hrw t +<br />
m<br />
∑<br />
i m<br />
+<br />
= −<br />
swfr ∆hrw + X + ε<br />
t−<br />
i<br />
t<br />
t<br />
swfr->swfr<br />
swfr->hrw<br />
hrw->swfr<br />
hrw->hrw<br />
(6.4)<br />
in which the French price was regressed on the US price and on his leads and<br />
lags differences (selected according to the SBIC), plus the regime dummies<br />
concerned (here indicated, for the sake of simplicity, with Xt). Using the DOLS<br />
allows focusing on the long run relations between the prices 84 .In general, all<br />
estimates yield consistent results, which confirms the robustness of the parameters<br />
of the cointegration vector. To give an example, the estimates of the model in<br />
84 Indeed, a possible objection to the estimates which have been presented in paragraph 6.4 is that also the<br />
short run parameters might be influenced by the structural breaks. This would require estimating different<br />
models for the different sub-samples, which is not advisable given the limited number of observations<br />
available.
Empirical Analysis: Cointegration Models, Structural Breaks and Policy Reform<br />
which just EU and WTO policy regime changes are considered are presented in<br />
table 6.7.<br />
Table 6.7 DOLS estimates: EU and WTO policy regimes<br />
Variable Coefficient<br />
const<br />
4.279***<br />
(0.143)<br />
hrwt 0.160***<br />
(0.028)<br />
reg1t -0.191***<br />
(0.012)<br />
reg2t -2.019***<br />
(0.290)<br />
reg2ust 0.396***<br />
(0.059)<br />
reg3t -0.188***<br />
(0.019)<br />
∆hrwt-6 -0.177***<br />
(0.047)<br />
∆hrwt-5 -0.126***<br />
(0.035)<br />
∆hrwt-4 -0.177***<br />
(0.040)<br />
∆hrwt-3 -0.158***<br />
(0.043)<br />
∆hrwt-2 -0.137***<br />
(0.046)<br />
∆hrwt-1 -0.153***<br />
(0.046)<br />
∆hrwt -0.149***<br />
(0.046)<br />
∆hrwt+1 0.103**<br />
(0.050)<br />
∆hrwt+2 0.144***<br />
(0.048)<br />
∆hrwt+3 0.073<br />
(0.048)<br />
∆hrwt+4 0.101**<br />
(0.046)<br />
∆hrwt+5 0.104**<br />
(0.046)<br />
∆hrwt+6 0.111**<br />
(0.051)<br />
SBIC -933.188<br />
Standard errors in parenthesis. *significant at 10%; **significant at 5%;<br />
*** significant at 1% for the null hypothesis of zero coefficients<br />
SBIC : Schwartz's Bayesian Information criterion<br />
107
Empirical Analysis: Cointegration Models, Structural Breaks and Policy Reform<br />
It can be noticed that the long run transmission elasticity (0.160) and its<br />
increase after the URAA implementation (0.396) show values which are<br />
consistent with those presented in table 6.4.<br />
6.5 Concluding remarks<br />
This chapter provides a further examination of short and long-run comovement<br />
relations between US and internal EU prices for soft wheat by<br />
considering policy regime changes.<br />
The major EU and international market policy changes have here been taken<br />
into account by using cointegration techniques allowing for structural breaks in<br />
the deterministic trend of the cointegrating vector. The model proposed by<br />
Johansen, Mosconi and Nielsen (2000) has been modified by considering more<br />
than one structural breaks.<br />
Also in light of the analysis carried out in the previous chapter, it is confirmed<br />
that, in the years 1978-2003, the US and the EU price common path emerges only<br />
when structural breaks, i.e. policy regime changes, are appropriately considered.<br />
Indeed, the empirical analysis shows that both prices respond to deviations<br />
from the long run relation, which has been affected by policy regime changes:<br />
namely, the MacSharry and Agenda 2000 reform of the CAP, and the URAA<br />
implementation. The introduction of an additional dummy accounting for the<br />
peculiar tariff situation of the 2001/02 campaign allows to find a better model<br />
specification.<br />
As expected, the MacSharry reform and Agenda 2000 are responsible for the<br />
reduction of domestic EU prices, while the URAA causes an increase in the price<br />
transmission elasticity (from about 0.20 before the implementation of the URAA<br />
to about 0.40 afterwards; and this in addition to a further reduction of prices).<br />
Even if, remarkably, evidence of co-movement between the two prices is<br />
confirmed, still full price transmission is not in place.<br />
Concerning the adjustment coefficients, interestingly, we note that the French<br />
ones are always significant and within the range that emerged in the previous<br />
chapter (see paragraph 5.3). Namely, they are close to the values shown when<br />
both the intervention and the US prices appear in the cointegration vector. This<br />
can be seen as a confirmation that the technique presented here is a consistent<br />
alternative to the ones presented in the previous chapter: the introduction of<br />
structural breaks in the deterministic term of the cointegration vector elicits the<br />
same response from the French price than when policy regime changes are<br />
represented by introducing the intervention price in the models.<br />
Also the response of the US price is consistent: in fact, its adjustment<br />
coefficients are always positive and bounded between 0.012 and 0.142. In this<br />
respect, it would seem that the model presented in this chapter really solves some<br />
108
Empirical Analysis: Cointegration Models, Structural Breaks and Policy Reform<br />
of the interpretative problems which came out in the previous one (paragraph<br />
5.2.2.1 and 5.3). Consistently with chapter 5, the US price behaves as weakly<br />
exogenous.<br />
To sum up, our findings confirm and contribute to shed light on a complex and<br />
controversial empirical literature, bridging the gap between studies not finding<br />
any evidence of co-movement and those that, conversely, find evidence of<br />
increased price transmission elasticities following the URAA.<br />
What we find is that co-movement between the two series exists, albeit the<br />
price transmission elasticity is small, and has been influenced by domestic and<br />
liberalizing policy reforms.<br />
The analysis show that the implementation of the URAA almost doubled the<br />
elasticity of transmission between European and US prices. This means that the<br />
markets could benefit from an increased efficiency.<br />
This exercise provides an alternative way of analyzing US and EU price<br />
patterns in the past 30 years by explicitly considering different policy regimes.<br />
In order to verify the effects of the major changes of domestic and border<br />
policies on price transmission, the use of time series allowing to go back in time<br />
was preferred (Eurostat data). As noted already, this in turn implied that,<br />
unfortunately, more recent phenomena could not be investigated.<br />
In the latest months, in particular, commodity world markets have been<br />
characterized by soaring prices whose causes have both a transitory and a<br />
structural nature. This provoked remarkable changes in the commercial policy<br />
measures in place in a number of countries, and in the EU. In our analysis this<br />
implies that, presumably, other structural breaks could be introduced in the<br />
cointegration vector, although their timing might not be so clear cut. In the EU,<br />
for example, the elimination of import duties, which was already included in the<br />
previous regulations to be applied in case of high world prices, keeps a transitory<br />
nature.<br />
109
7 CONCLUDING REMARKS<br />
This work aims at providing a theoretical framework to consider policy<br />
regimes while testing for price transmission, and at developing different models<br />
for the empirical analysis.<br />
The case study is constituted by international soft wheat markets in the years<br />
1978-2003. The French and the US prices are assumed to represent, respectively,<br />
the EU and the world ones.<br />
This work tries to shed light on a mixed empirical evidence. Indeed, the Law of<br />
One Price is often found not to hold in practice. Many factors are supposed to<br />
prevent prices from convergence: amongst them, policy measures are expected to<br />
play a relevant role.<br />
This is true in particular for the agricultural sector, traditionally characterized<br />
by high levels of policy intervention. The recent rise in food prices on<br />
international commodity markets drew new attention on price transmission<br />
mechanisms and, specifically, on the effects of policy intervention.<br />
Theoretical considerations on the functioning of domestic and border policies<br />
on international wheat markets (paragraph 4.3) lead to the basic assumption that<br />
the domestic EU price and the world one are expected to interact only when the<br />
latter is above the EU intervention price. The relative position of this policy<br />
variable and of the US price allows to define different policy regimes;<br />
alternatively, the intervention price can be considered as a threshold for the US<br />
price to interact with the European one.<br />
Accordingly to these theoretical considerations, different empirical models are<br />
derived.<br />
At first (chapter 5) the intervention price is used in different ways. Either a<br />
composite variable is built, constituted by the maximum between the intervention<br />
and the US price, or the LOP is imposed to hold between the French price and<br />
either the US or the intervention price depending on the policy regime in place,<br />
i.e. on which of the two prices is higher. In this case, either the adjustment<br />
coefficients, or the long run transmission elasticities, or, finally, both, are allowed<br />
to change.
Concluding Remarks<br />
These models represent an attempt of explicitly combining policy and price<br />
data. The observable policy regime change has been simulated with the<br />
construction of an ad hoc composite variable and other econometric devices.<br />
The consistent behaviour of EU adjustment coefficients suggests that the role<br />
of the US price might be understood only in light of adequate consideration for<br />
policy regimes. The adjustment coefficients of the French price always display the<br />
correct sign, although they tend to be significant and higher in magnitude only<br />
when the intervention price appears in the cointegration vector.<br />
The response of the US price leaves instead some questions open: US<br />
adjustment coefficients are usually much smaller in value and not significant. This<br />
could be due to its exogeneity, but, also, to the fact that the cointegration relation<br />
is mostly driven by the intervention price, which in turns brings some<br />
interpretative problems.<br />
The model presented in chapter 6, instead, directly explores the dynamic of a<br />
system constituted by the US and the French prices, only. In this case, the policy<br />
regime changes are assumed to influence the parameters of the long run relation<br />
linking the two prices. The policy regime changes are then expected to have an<br />
impact on an existing relation, as some previous empirical evidence would<br />
suggest (Thompson and Bohl 1999, Thompson et al. 2002a and 2002b). A<br />
cointegration model allowing for structural breaks in the deterministic term of the<br />
cointegration vector is tested. The Johansen, Mosconi and Nielsen (2000) model<br />
is partially modified by introducing more than one break.<br />
Once again, the French response to the disequilibria in the long run relation is<br />
found to be consistent and significant; moreover, also the response of the US price<br />
is consistent, which solves some of the interpretative problems of chapter 5.<br />
The theoretical assumptions are confirmed: indeed, the MacSharry and Agenda<br />
2000 reforms, by lowering intervention prices, did reduce the distance of the EU<br />
prices from the world ones; while the URAA implementation lead to an increased<br />
price transmission elasticity, although perfect price transmission is still not in<br />
place.<br />
Summing up, our empirical findings, which derive from the specific theoretical<br />
framework developed, confirm and contribute to shed light on a complex and<br />
controversial literature, bridging the gap between studies not finding any evidence<br />
of co-movement between the prices considered and those that, conversely, find<br />
evidence of positive and increased price transmission elasticities following the<br />
URAA.<br />
In addition to this, these findings are of a more general interest for the study of<br />
the dynamics occurring in global markets which are increasingly complex and<br />
interconnected.<br />
112
Concluding Remarks<br />
Indeed, the study of the outcomes of the implementation of the URAA<br />
provides insights about the effects of all liberalization reforms aimed at increasing<br />
market access.<br />
Moreover, analyzing the effects of reduction of the intervention prices is of a<br />
crucial importance within the “Health Check” debate of the CAP, since a<br />
substantial reduction of this mechanism is currently being proposed by the<br />
European Commission.<br />
However, a number of issues are left open for future research.<br />
These basically stem from some of the simplistic assumption that necessarily<br />
had to be made in the empirical applications proposed: the way in which unknown<br />
transport costs are modelled; the presence of market power; other possible<br />
exogenous drivers for the price dynamics; a more detailed study of the<br />
homogeneity issue. In addition to this, a deeper analysis of the relation between<br />
US and intervention prices, and especially of its evolution in time, can contribute<br />
to better understand the French and US price dynamics.<br />
Finally, it should be recalled that, in this work, the use of data which would<br />
allow to go back in time has been preferred although this, in turn, implied the<br />
impossibility of studying the latest years. In this respect, some additional<br />
considerations emerge considering the most recent market dynamics: the dramatic<br />
rise in energy prices (and in freight rates) could increase the complexity of the<br />
assumptions made on transaction costs; moreover, soaring food prices caused<br />
remarkable changes in the institutional settings of international trade.<br />
The effects of more recent policy and market developments should be the<br />
object of further research; considering the evolving international context goes then<br />
well beyond the use of more recent data, and probably represents the most<br />
interesting possibility of developing the framework presented.<br />
113
REFERENCES<br />
Alderman, H., 1992. Intercommodity price transmittal. Analysis of food<br />
markets in Ghana. The World Bank, WPS 884, April 1992.<br />
AGMEMOD Partnership, 2007a. Impact analysis of the CAP reform on main<br />
agricultural commodities. Final Report. European Commission Directorate<br />
General JRC – IPTS (Institute for Prospective Technological Studies).<br />
AGMEMOD Partnership, 2007b. European Union 2007 Agricultural Outlook.<br />
Rennes: AGMEMOD Partnership, March 2007.<br />
Anania, G., 2007a. Negoziati commerciali multilaterali, accordi preferenziali e<br />
politiche agricole dell’Unione Europea, QA- Rivista dell’Associazione Rossi-<br />
Doria (3), 75-122.<br />
Anania, G., 2007b. Multilateral trade negotiations, preferential agreements and<br />
the CAP. What’s ahead? 51 st Annual Conference of the Australian Agricultural<br />
and Resource Economics Society (AARES), 13-16 February 2007, Queenstown,<br />
New Zealand.<br />
Ardeni, P.G., 1989. Does the Law of One Price really hold for commodity<br />
prices? American Journal of Agricultural Economics, 71 (August 1989), 661-669.<br />
Asche, F., Bremnes, H. and Wessels C. R., 1999. Product aggregation, market<br />
integration and relationships between prices: an application to world salmon<br />
markets. American Journal of Agricultural Economics, 81 (August 1999), 568-<br />
581.<br />
Baek, J. and Woo, W. K., 2005. Price dynamics in the north American wheat<br />
market. American Agricultural Economics Association’s annual meeting, July 24-<br />
27, 2005, Providence, Rhode Island.<br />
Baffes, J. 1991. Some further evidence on the Law of One Price: the Law of<br />
One Price still holds. American Journal of Agricultural Economics, 73 (November<br />
1991), 1264-1273.<br />
Balcombe, K., Bailey, A. and Brooks, J., 2007. Threshold effects in price<br />
transmission: the case of Brazilian wheat, maize and soya prices. American<br />
Journal of Agricultural Economics, 89 (May 2007), 308-323.
References<br />
Bale, M. D. and Lutz, E., 1979. The effects of trade intervention on<br />
international price instability. American Journal of Agricultural Economics, 61<br />
(August 1979), 512-516.<br />
Balke, N. S. and Fomby, T. B., 1997. Threshold cointegration. International<br />
Economic Review, 38 (August 1997), 627-645.<br />
Barassi, M. R. and Ghoshray, A., 2007. Structural Change and Long-run<br />
Relationships between US and EU Wheat Export Prices. Journal of Agricultural<br />
Economics, 58 (February 2007), 76–90.<br />
Barrett, C. B., 1996. Market analysis: are our enriched toolkits well suited to<br />
enlivened markets? American Journal of Agricultural Economics, 78 (August<br />
1996), 825-829.<br />
Barrett, C. B., 2001. Measuring integration and efficiency in international<br />
agricultural markets. Review of Agricultural Economics, 23 (1), 19-32.<br />
Barrett, C. B. and Li J. R., 2002. Distinguishing between equilibrium and<br />
integration in spatial price analysis, American Journal of Agricultural Economics,<br />
84 (2), 292-307.<br />
Baulch, B., 1997. Transfer costs, spatial arbitrage, and testing for food market<br />
integration. American Journal of Agricultural Economics, 79 (May 1997), 477-<br />
487.<br />
Binfield, J., 2002. Cereals Trade Between the EU, Russia and the Ukraine.<br />
November 2002, unpublished.<br />
Bredahl, M.E., Meyers W. and Collins K. J., 1979. The elasticity of foreign<br />
demand for US agricultural products: the importance of the price transmission<br />
elasticity. American Journal of Agricultural Economics, 61 (November 1979), 58-<br />
63.<br />
Brooks, H. G., Devadoss, S. and Meyers, W. H., 1990. The impact of the USA<br />
wheat export enhancement program on the world wheat market. Canadian<br />
Journal of Agricultural Economics, 38 (1990), 253–277.<br />
Brooks, J. and Melyukhina, O., 2005. Estimating the Pass-Through of<br />
Agricultural Policy Reforms: An Application to Brazilian Commodity Markets.<br />
Food, Agriculture and Fisheries Working Papers 2, OECD.<br />
Bukenya, J. O. and Walter C. L., 2005. Price convergence on world commodity<br />
markets: fact or fiction? International Regional Science Review, 28 (July 2005),<br />
302-329.<br />
Carter, C. and Schmitz A., 1979. Import tariffs and price formation in the<br />
world wheat market. American Journal of Agricultural Economics, 61 (August<br />
1979), 517-521.<br />
Chantreuil, F., Levert, F. and Hanrahan, K., 2005. The Luxembourg agreement<br />
reform of the CAP: an analysis using the AG-MEMOD composite model. 89 th<br />
Seminar of the European Association of Agricultural Economists, Modelling<br />
116
References<br />
agricultural policies: state of the art and new challenges, 3-5 February 2005,<br />
Parma.<br />
Clemente, J., Montanes, A. and Reyes, M.,1998. Testing for a unit root in<br />
variables with a double change in the mean. Economic letters, 59 (2), 175-182.<br />
Conforti, P., 2004. Price transmission in selected agricultural markets. FAO<br />
Commodity and Trade Policy Research Working Paper 7, Basic Foodstuffs<br />
Service, Commodities and Trade Division, March 2004.<br />
Dawson, P.J. and Sanjuan, A., 2006. Structural breaks, the Export<br />
Enhancement Program and the relationship between Canadian and US Hard<br />
Wheat prices. Journal of Agricultural Economics, 57 (1), 101-116.<br />
Dawson, P.J., Sanjuan A. I. and White B., 2006. Structural breaks and the<br />
relationship between barley and wheat future prices on the London international<br />
financial futures exchange. Review of Agricultural Economics, 28 (4), 585-594.<br />
Dercon, S., van Campenhout, B., 1999. Dynamic price adjustments in spatially<br />
separated food markets with transaction costs. Katholieke Universiteit Leuven,<br />
Center for economic Studies, discussion papers, March 1999.<br />
Enders, W., 1995. Applied econometric time series. New York: John Wiley<br />
and Sons.<br />
Engle, R. F. and Granger, C. W. J., 1987. Cointegration and error correction:<br />
representation, estimation and testing. Econometrica, 55 (1), 251-276.<br />
European Commission, The Agricultural Situation in the Community, Report.<br />
Various issues. Bruxelles.<br />
European Commission, 2007. Preparing for the “Health Check” of the CAP<br />
reform. COM(2007) 722.<br />
European Commission, 2007. Commission proposal. COM(2008) 306/4.<br />
Fackler, P. L. and Goodwin, B. K., 2001. Spatial price analysis. In: B. L.<br />
Gardner, and G. C. Rausser ed. Handbook of Agricultural Economics, Elsevier,<br />
972-1025.<br />
Fanelli, L. and Bacchiocchi, E., 2005. Testing the purchasing power parity<br />
through I(2) cointegration techniques. Journal of Applied Econometrics, 20 (6),<br />
749-770.<br />
FAO, 2008. Soaring Food Prices: Facts, Perspectives, Impacts and Actions<br />
Required. HLC/08/INF/1, Information Document for the High-Level Conference<br />
on World Food Security: The Challenges of Climate Change and Bioenergy 3-5<br />
June, Rome.<br />
Faostat database, www.fao.org.<br />
Gallezot J., 2007. Database on Agricultural Tariffs DBTAR. Working paper<br />
05/07, TradeAG, Agricultural Trade Agreements, http://www.tradeag.eu/.<br />
Ghoshray, A., Lyoid, T. and Rayner, A. J., 2000. EU wheat export prices and<br />
its relation with other major wheat export prices. Discussion paper in Economics<br />
00/08, University of Nottingham, March 2000.<br />
117
References<br />
Ghoshray, A. , 2002. Asymmetric price adjustment and the world wheat<br />
market, Journal of Agricultural Economics, 53 (2), 299–317.<br />
Ghoshray, A. and Lyoid, T., 2003. Price linkages in international wheat<br />
markets. International Association of Agricultural Economists Triennial<br />
Conference, 18-11 August 2003 Durban, South Africa.<br />
Gjoelberg, O., Guttormsen, A., and Aarstad, L.E. (1996). When will European<br />
agriculture join the Common Market? Wheat market segregation 1984-94. Norges<br />
Landbrukshoegskole, Inst. for Oekonomi og Samfunnsfag, Aas (Norway).<br />
Glynn J., Perera N. and Verma R., 2007. Unit root tests and structural breaks: a<br />
survey with applications. Revista de métodos cuantitativos para la economίa y la<br />
impresa, 3 (June 2007), 63-79.<br />
Goodwin B. K., Grennes T.J. and Wohlgenant M.K., 1990. A revised test of<br />
the Law of One Price using rational price expectations. American Journal of<br />
Agricultural Economics, 72 (August 1990), 682-693.<br />
Goodwin, B. K. and Schroeder, T. C., 1991a. Price dynamics in international<br />
wheat markets. Canadian Journal of Agricultural Economics, 39 (1991), 237–<br />
254.<br />
Goodwin, B. K. and Schroeder T. C., 1991b. Cointegration tests and spatial<br />
price linkages in regional cattle markets. American Journal of Agricultural<br />
Economics, 73 (May 1991), 452-464.<br />
Goodwin, B. K., 1992. Multivariate Cointegration Tests and the Law of One<br />
Price in International Wheat Markets. Review of Agricultural Economics, 14<br />
(1992), 117-124.<br />
Goodwin, B. K., Grennes, T.J. and Mc Curdy, C., 1999. Spatial price and<br />
integration in Russian Food markets. Policy Reform, 3 (2), 157-193.<br />
Goodwin, B.K. and Piggot N. E., 2001. Spatial market integration in the<br />
presence of threshold effects. American Journal of Agricultural Economics, 83<br />
(May 2001), 302-317.<br />
Gordon, D.V., Hobbs, J.E. and Kerr, W.A., 1993. A test for price integration in<br />
the EC lamb market. Journal of Agricultural Economics, 44 (1), 126-134.<br />
Gupta, S. and Mueller, R. A. E., 1982. Analyzing the pricing efficiency in<br />
spatial markets: concept and application. European Review of Agricultural<br />
Economics, 9 (1982), 301-312.<br />
Hallett, G., 1968. Economia e Politica del Settore Agricolo. Bologna: Il<br />
Mulino.<br />
Hansen, H., Johansen, S., 1999. Some tests for parameter constancy in<br />
cointegrated VAR models, Econometrics Journal, 2 (1999), 306-333.<br />
Hui-Shung, C.C. and Griffith, G., 1998. Examining long run relationships<br />
between Australian beef prices. The Australian Journal of Agricultural and<br />
Resource Economics,42 (4), 369-387.<br />
118
References<br />
Isard, P., 1977. How far can we push the law of one price? The American<br />
Economic Review, 67 (5), 942-948.<br />
Johansen, S., 1995. Maximum Likelihood Inference in Co-Integrated Vector<br />
Autoregressive Processes. Oxford University Press.<br />
Johansen, S., Mosconi, R. and Nielsen, B., 2000. Cointegration Analysis in the<br />
Presence of Structural Breaks in the Deterministic Trend, The Econometrics<br />
Journal, 3 (December 2000), 216–249.<br />
Larue, B., 1991. Is wheat a Homogenous Product? Canadian Journal of<br />
Agricultural Economics, 39 (1), 103-117.<br />
Lucchetti R. (2008). Appunti di analisi delle serie storiche, available at<br />
http://www.econ.univpm.it/lucchetti/didattica/matvario/procstoc.pdf<br />
MacKinnon, J. G., 1996. Numerical Distribution Functions for Unit Root and<br />
Cointegration Tests”, Journal of Applied Econometrics, 11 (6), 601–18.<br />
Mahe, L. P. and Roe, T. L., 1996. The political economy of reforming the 1992<br />
CAP Reform. American Journal of Agricultural Economics, 78 (December 1996),<br />
1314–1323.<br />
Margarido, M. A., Turolla, F. A. and Bueno Anais, C. R. F., 2004. The world<br />
market for soybeans: price transmission into brazil and effects from the timing of<br />
crop and trade. 32 th Brazilian Economics Meeting from ANPEC - Associação<br />
Nacional dos Centros de Pósgraduação em Economia.<br />
Meyer, J. and von Craumon-Taubadel, S., 2004. Asymmetric price<br />
transmission: a survey. Journal of Agricultural Economics, 55 (3), 581-611.<br />
Mc New, K. and Fackler, P.L., 1997. Testing market equilibrium: is<br />
cointegration informative? Journal of Agricultural and Resource Economics, 22<br />
(2), 191-207. van Meijl, H., van Tongeren, F., 2002. The Agenda 2000 CAP<br />
Reform, world prices and GATT-WTO export constraints. European Review of<br />
Agricultural Economics, 29 (4), 445-470.<br />
Miljkovic, D., 1999. The Law of One Price in international trade: A critical<br />
review. Review of Agricultural Economics, 21 (1999), 126–139.<br />
Miljkovic, D. and Rodney J. P., 2001. Product aggregation, market integration<br />
and relationships between prices: an application to world salmon markets:<br />
comment. American Journal of Agricultural Economics, 83 (November 2001),<br />
1087-1089.<br />
Mohanty S., Meyers, W. H. and Smith, D. B., 1999. A re-examination of price<br />
dynamics in the international wheat market. Canadian Journal of Agricultural<br />
Economics, 47 (1999), 21-29.<br />
Mohanty, S. and Langley, S., 2003. The Effects of Various Policy Regimes in<br />
the Integration of North American Grain Markets. Canadian Journal of<br />
Agricultural Economics, 51 (2003), 109-120.<br />
Morgan., B., 2003. Russia and Ukraine: Wheat. Agriculture and Agri-Food<br />
Canada, Bi-weekly bulletin, 6 (14-03). www.agr.gc.ca.<br />
119
References<br />
Mundlak, Y. and Larson, D.F., 1992. On the transmission of world agricultural<br />
prices. World Bank Economic Review, 6 (3), 399-422.<br />
Myers, R. J., Piggott, R. R. and Tomek, W. J., 1990. Estimating sources of<br />
fluctuations in the Australian wool market: an application of VAR methods.<br />
Australian Journal of Agricultural Economics, 34 (3), 242-262<br />
Negassa, A. and Myers R. J., 2007. Estimating policy effects on spatial market<br />
efficiency: an extension to the parity bounds model. American Journal of<br />
Agricultural Economics, 89 (May 2007), 308-323.<br />
OECD, 2001. Multifunctionality, towards an analytical framework. OECD<br />
Publications, Paris.<br />
Perron, P. and Vogelsang T. J., 1992. Nonstationarity and level shifts with an<br />
application to Purchasing Power Parity. Journal of Business and Economic<br />
Statistics, 10 (3), 301-320.<br />
Ravallion, M., 1986. Testing market integration. American Journal of<br />
Agricultural Economics, 68 (February 1986), 102-108.<br />
Richardson, D. J., 1978. Some empirical evidence on commodity arbitrage and<br />
the Law of One Price. Journal of International Economics, 8 (1978), 341-351.<br />
Sanjuan, A. I. and Gil, J. M., 2001. Price transmission analysis: a flexible<br />
methodological approach applied to European pork and lamb markets. Applied<br />
Economics, 33 (2001), 123-131.<br />
Sephton, P. S., 2003. Spatial market arbitrage and threshold cointegration.<br />
American Journal of Agricultural Economics, 85 (November 2003), 1041-1046.<br />
Sexton R. J., Kling C. L., and Carman H. F., 1991. Market integration,<br />
efficiency of arbitrage, and imperfect competition: methodology and application<br />
to U.S. celery. American Journal of Agricultural Economics, 73 (August 1991),<br />
568-580.<br />
Sharma, R., 2002. The transmission of world price signals: concepts, issues<br />
and some evidence from Asian cereal markets. OECD Global Forum on<br />
Agriculture, 23-24 May 2002.<br />
Stigler, G. J. and Sherwin R. A., 1985. The extent of the market. Journal of<br />
Law and Economics, 28 (October 1985), 555-585.<br />
Stock, J. H. and Watson M. W., 1993. A simple estimator of cointegrating<br />
vectors in higher order integrated systems, Econometrica, 61(4), 783-820.<br />
Thompson, S.R. and Bohl, M.T., 1999. International wheat price transmission<br />
and CAP Reform. Discussion Paper 53, Institute of Agricultural Policy and<br />
Market Research, University of Giessen, Germany.<br />
Thompson, S. R., Herrmann, R. and Gohout ,W., 2000. Agricultural market<br />
liberalization and instability of domestic agricultural markets: the case of the<br />
CAP. American Journal of Agricultural Economics, 82 (August 2000), 718-726.<br />
120
References<br />
Thompson, S. R., Sul, D. and Bohl, M. T., 2002a. Spatial market efficiency<br />
and policy regime change: seemingly unrelated error correction model estimation.<br />
American Journal of Agricultural Economics, 84 (4), 1042-1053.<br />
Thompson, S. R., Gohout, W. and Hermann, R., 2002b. CAP reforms in the<br />
1990s and their price and welfare implications: the case of wheat. Journal of<br />
Agricultural Economics, 53 (March 2002), 1-13.<br />
Tomek, W. G. and Myers, R., 1993. Empirical analysis of agricultural<br />
commodity prices: a viewpoint. Review of Agricultural Economics, 15 (1), 181-<br />
202.<br />
USDA, 2005. Wheat Backgrounder, Electronic Outlook Report from the<br />
Economic Research Service. December 2005.<br />
Veerbek, M., 2004. A guide to modern econometrics. 2 nd ed. Chichester: John<br />
Wiley & Sons, LTD.<br />
Verga G., Zuppiroli M., 2003. Integrazione e causalità nel mercato europeo del<br />
frumento tenero. Rivista di Economia Agraria, 3 (2003), 323-364.<br />
Viju, C., Nolan, J. and Kerr, W. A., 2006. Common markets? Measuring price<br />
integration in European agricultural markets. Young Researchers Networks<br />
Canada’s Conference.<br />
Vollrath, T. and Hallahan, C., 2006. Testing the Integration of U.S.- Canadian<br />
Meat and Livestock Markets. Canadian Journal of Agricultural Economics, 54<br />
(1), 55-79.<br />
Wang, D. and Tomek, W.J., 2007. Commodity prices and Unit Root Tests.<br />
American Journal of Agricultural Economics, 89 (November 2007), 873-889.<br />
Williams, C. H. and Bewley, R. A., 1993. Price arbitrage between Queensland<br />
cattle auctions. Australian Journal of Agricultural Economics, 37 (1), 33-55.<br />
World Bank, 2008. Rising food prices: Policy options and World Bank<br />
response. Mimeo, Washington D.C.<br />
Zanias, G.P., 1993. Testing for integration in European Community<br />
agricultural product markets. Journal of Agricultural Economics, 44 (3), 418-427.<br />
Zivot, E. and Andrews, D.W.K., 1992. Further evidence on the great crash, the<br />
oil price shock, and the unit root hypothesis. Journal of Business and Economic<br />
Statistics, 10 (3), 251-261.<br />
121
ANNEXES
Annexes<br />
124<br />
Annex A – Empirical analysis on price transmission: a review<br />
METHODOLOGY DATA USED MAJOR FINDINGS<br />
CORRELATION<br />
Isard, 1977<br />
By visual inspection and by ordinary<br />
regression (Cochrane-Orcutt<br />
procedure), the behaviour of relative<br />
prices for various industries, is<br />
examined.<br />
Stigler and Sherwin, 1985<br />
They investigate the relations existing<br />
between differentiated series of prices.<br />
They use correlation analysis to assess<br />
the belonging of prices to the same<br />
market.<br />
Monthly time series of US,<br />
Germany and Japanese prices<br />
for a variety of industries<br />
collected at different<br />
frequencies for the years 1968-<br />
1975.<br />
Monthly wholesale prices (logs,<br />
indexes, levels) for a number of<br />
items: silver futures, flour,<br />
wheat, gasoline, interest rates,<br />
wages…<br />
Various years.<br />
Substantial changes in<br />
exchange rates have<br />
substantial and persistent<br />
effects on the relative<br />
common currency prices for<br />
close substitute products of<br />
different countries.<br />
The study, which covers<br />
different markets (future<br />
markets, commodity<br />
markets, capital and labour<br />
markets), discusses<br />
fundamental issues related to<br />
market integration.<br />
DYNAMIC REGRESSION MODELS BASED ON A POINT LOCATION MODEL: RAVALLION’S CRITERIA<br />
Aldermann,1992<br />
He applies both Ravallion’s radial<br />
dynamic model of market integration<br />
and cointegration techniques.<br />
Cointegration relations are analyzed<br />
within the same market between<br />
commodities that can be considered<br />
close substitutes.<br />
His objective is to verify whether, in<br />
developing countries, the connections<br />
existing among markets of different<br />
agricultural commodities allow<br />
governments to use policy measures<br />
addressed to only one of them.<br />
Mundlak and Larson, 1992<br />
They investigate world markets to find<br />
out what proportion of world prices is<br />
transmitted to the domestic ones<br />
(coefficients of the regressions) and<br />
what proportion of the variation in<br />
domestic prices can be attributed to<br />
the variations in world prices (R 2 of<br />
the regressions). They analyze<br />
different panel models (all<br />
commodities for each country,<br />
nominal and real values; all countries<br />
pooled together; insertion of yearly<br />
dummies; between and within<br />
commodity regressions).<br />
Deflated monthly wholesale<br />
maize, sorghum and millet<br />
prices (levels) from three<br />
markets in Ghana.<br />
1977-1990.<br />
In a first analysis, the prices<br />
refer to 58 counties and 60<br />
products, in the years1968-<br />
1978; then they examine the<br />
prices in EU countries, for 25<br />
years.<br />
Prices of different<br />
commodities are<br />
cointegrated. Often, the past<br />
prices of one product can be<br />
used to predict the prices of<br />
another one.<br />
Functional efficiency in<br />
Ghana’s coarse grain<br />
markets is found.<br />
This study finds very high<br />
transmission elasticities for<br />
all countries (in the range of<br />
0.74-1.24) and very high<br />
values of R 2 (in the range of<br />
0.66 and 0.96).<br />
The results are however<br />
likely to be biased by<br />
complete disregarding the<br />
time series properties of the<br />
data (autocorrelation tests are<br />
not reported).
METHODOLOGY DATA USED MAJOR FINDINGS<br />
DYNAMIC REGRESSION MODELS BASED ON A POINT LOCATION MODEL: RAVALLION’S CRITERIA<br />
Ravallion, 1986<br />
In his model of market integration, the<br />
price series for each local market have<br />
their own autoregressive structure and<br />
a dynamic relationship with market<br />
prices in a central region. His<br />
approach permits to distinguish<br />
between short and long run market<br />
integration.<br />
Richardson, 1978<br />
He tests the Law of One Price using<br />
twice differenced prices, to avoid of<br />
problems related to serial correlation<br />
and omitted explanatory variables.<br />
Thompson et al., 2000<br />
They want to test if the elasticity of<br />
transmission between EU and world<br />
prices was really zero under the old<br />
CAP, and how it has been affected by<br />
policy regime changes. Germany is<br />
assumed to be a small country for<br />
which the world price is exogenous.<br />
An econometric model is also built.<br />
They analyze the effect of the change<br />
in the variability of prices on<br />
consumers’ welfare.<br />
Monthly rice price data in<br />
five districts of Bangladesh<br />
(levels). Dummies to account<br />
for seasonality, the famine in<br />
1974, and a time trend are<br />
included.<br />
July 1972- June 1975.<br />
Monthly observations on<br />
Canadian and US price indexes<br />
(twice differenced logs). The<br />
exchange rate is included as a<br />
regressor.<br />
1965-1974.<br />
Annual data are derived by<br />
averaging monthly data (logs<br />
are used).<br />
The world wheat price is in US<br />
$ from the USDA, converted<br />
into DM using IMF exchange<br />
rates. The German producer<br />
price is from CRONOS dataset<br />
of EUROSTAT.<br />
Both price series are deflated by<br />
the CPI of their respective<br />
country.<br />
1976-1998.<br />
Annexes<br />
Departures from the<br />
conditions of both short run<br />
and long run integration are<br />
found in Bangladesh. They<br />
would not be revealed by the<br />
use of static correlation<br />
techniques.<br />
The Law of One Price fails.<br />
Canadian prices respond in<br />
the same way to exchange<br />
rates and US prices.<br />
The MacSharry reform<br />
caused a reduction in the<br />
levels of EU prices, but the<br />
URAA didn’t have any<br />
significant effect on price<br />
transmission elasticities, that<br />
have an average value of<br />
0.11 (which means that<br />
tariffication was not<br />
effective). The existence of<br />
low but not zero price<br />
transmission elasticities<br />
before the URAA suggests<br />
that the domestic support<br />
prices were not completely<br />
independent from the world<br />
ones. The impact of policy<br />
changes on producers’<br />
welfare is mostly due to cuts<br />
in protection (transfer) than<br />
to income instability (risk).<br />
Through compensative<br />
hectare payments, EU<br />
farmers are<br />
overcompensated.<br />
125
Annexes<br />
METHODOLOGY DATA USED MAJOR FINDINGS<br />
DYNAMIC REGRESSION MODELS BASED ON A POINT LOCATION MODEL: RAVALLION’S CRITERIA<br />
Thompson et al., 2002b<br />
They develop an aggregate structural<br />
model of the EU wheat economy,<br />
linked to the rest of the world.<br />
Amongst the structural equations<br />
estimated with 3SLS techniques, the<br />
price transmission equation regresses<br />
the EU price on a constant term, the<br />
world price, a time trend, and a<br />
dummy variable accounting for the<br />
MacSharry reform.<br />
126<br />
Annual data are derived by<br />
averaging monthly data (logs<br />
are used). The world wheat<br />
price is in US $ from the<br />
USDA, converted into DM<br />
using IMF exchange rates. The<br />
German producer price is from<br />
CRONOS dataset of<br />
EUROSTAT. Both price series<br />
are deflated by the CPI of their<br />
respective country.<br />
1976-2000.<br />
They find a price<br />
transmission elasticity of<br />
0.18, as the one obtained by<br />
Thompson et al. (2002a).<br />
The MacSharry reform is<br />
found to have caused a<br />
significant downward shift in<br />
prices; the addition of an<br />
interaction term is not<br />
significant.<br />
DYNAMIC REGRESSION MODELS BASED ON A POINT LOCATION MODEL (GC TESTS, IRFS, FEV)<br />
Goodwin and Schroeder, 1991a<br />
They estimate a VAR in levels<br />
between the prices. Their analysis<br />
focuses on Forecast Variance Error<br />
(FEV) decomposition and Impulse-<br />
Response Functions (IRF).<br />
Gordon et al., 1983<br />
They use a modification of Granger<br />
Causality test, the Holmes and Hutton<br />
causality test, based on the rank<br />
ordering of each variable. They test<br />
both bivariate models and trivariate<br />
ones.<br />
Monthly fob prices (in levels)<br />
for six exporting and importing<br />
wheat markets: US, Canada,<br />
Argentine, Australia, Japan and<br />
the EU.<br />
Missing observations are<br />
obtained regressing the series on<br />
a price series of a closely related<br />
market. Special Drawing Rights<br />
are used as a measure for<br />
exchange rates effects. A unique<br />
freight rate is calculated as the<br />
arithmetic average of various<br />
ones.<br />
July 1975 - December 1986<br />
Weekly prices (levels) of lamb:<br />
French lamb, Anglo-Irish lamb<br />
price on the French market, UK<br />
lamb price in the UK.<br />
1983-1986.<br />
According to the FEV, US<br />
and Canada seem to be<br />
dominant markets. A large<br />
proportion of FEVs are<br />
explained by transportation<br />
costs and the US and<br />
Canadian prices.<br />
Adjustments to innovations<br />
in freight rates are quite slow<br />
to occur.<br />
The IRFs show rapid price<br />
adjustments to exchange rate<br />
shocks, to US price shocks,<br />
to Canadian shocks (but not<br />
for the US and Argentina).<br />
Shocks in freight rates take<br />
two or more months to<br />
produce effects, but the<br />
response is large and<br />
persistent.<br />
British and French markets<br />
are integrated in the sense<br />
that price shocks in one<br />
market are eventually and<br />
fully transmitted on price<br />
changes in the other market.<br />
However, long orders of lag<br />
specifications are necessary,<br />
indicating a slow response to<br />
price incentives.
METHODOLOGY DATA USED MAJOR FINDINGS<br />
DYNAMIC REGRESSION MODELS BASED ON A POINT LOCATION MODEL (GC TESTS, IRFS, FEV)<br />
Gupta and Mueller, 1982<br />
They use GC tests (Haugh test to<br />
assess the dependence-independence<br />
between series; Sims test to ascertain<br />
the direction of causality) to see<br />
whether markets are perfectly priceefficient.<br />
Differently from the use of<br />
correlation coefficients, which only<br />
report the association between prices,<br />
this methodology allows to test if<br />
markets are independent,<br />
interdependent, or if lead-lag relations<br />
exist.<br />
Myers et al., 1990<br />
VAR methods are used to analyze the<br />
contribution of supply, demand and<br />
policy shocks to unpredictable<br />
fluctuations in the market for<br />
Australian wool. They develop a<br />
structural VAR in which the<br />
restrictions (which define<br />
contemporaneous interactions among<br />
variables) do not impose a recursive<br />
ordering of the variables. They<br />
perform IRF and FEV.<br />
Vollrath and Hallahan, 2006<br />
They investigate market integration<br />
for meat and livestock in the US and<br />
Canada, making use of three models:<br />
“streamlined” (prices expressed in a<br />
common currency) and “detailed”<br />
LOP models (to quantify both foreign<br />
price and exchange rate transmission),<br />
VAR models (IRF). They consider<br />
trade policy barriers and exchange rate<br />
changes, and evaluate the CUSTA<br />
(Canadian US Free Trade Agreement,<br />
since 1989) and its extension, the<br />
NAFTA (North American Free Trade<br />
Agreement, since 1994)<br />
Weekly prices (differentiated<br />
logs) for slaughter hogs in three<br />
German markets.<br />
Week 1:1977 - week 50:1980<br />
Quarterly prices for Australian<br />
wool, quantity purchased by<br />
private traders, total quantity of<br />
wool sold (in logs).<br />
1971:1 to 1988:2.<br />
US and Canada wholesale<br />
monthly and weekly prices for<br />
slaughter (steers, hogs, whole<br />
chicken), two cuts of beef and<br />
two pork products (in logs);<br />
US/Canada exchange rate.<br />
1988 - 2002<br />
DYNAMIC REGRESSION MODELS BASED ON A POINT LOCATION MODEL: COINTEGRATION<br />
Ardeni, 1989<br />
For the first time, cointegration is<br />
proposed to analyze the LOP, arguing<br />
that previous tests are flawed for<br />
disregarding the time series properties<br />
of the data.<br />
Quarterly export prices (in logs)<br />
for wheat, wool, beef, sugar,<br />
tea, tin and zinc for Australia,<br />
Canada, the UK, the US. Data<br />
are adjusted for exchange rates.<br />
January 1957-January 1986<br />
(from 79 to 117 obs., depending<br />
on the commodity).<br />
Annexes<br />
They find that markets are<br />
price-efficient, since the tests<br />
show that they are<br />
interdependent.<br />
Demand shocks are the<br />
dominant source of wool<br />
market fluctuations but<br />
intervention has blunted their<br />
effects.<br />
The market of whole chicken<br />
is segmented; hog and pork<br />
product markets are more<br />
integrated than steer and beef<br />
product markets. Changes in<br />
the Canadian-US exchange<br />
rate inhibits cross border<br />
integration.<br />
The LOP holds only in a<br />
small number of cases (but is<br />
nonetheless valid for US-<br />
Australian wheat, US-<br />
Canadian wheat); deviations<br />
from the pattern are<br />
permanent.<br />
127
Annexes<br />
METHODOLOGY DATA USED MAJOR FINDINGS<br />
DYNAMIC REGRESSION MODELS BASED ON A POINT LOCATION MODEL: COINTEGRATION<br />
Asche et al., (1999)<br />
The authors analyze the relation<br />
between market integration and<br />
product aggregation. In the<br />
deterministic case, if the Composite<br />
Commodity Theorem holds, the LOP<br />
holds, as well, and vice versa: in fact,<br />
for both conditions to hold, prices<br />
must move proportionally over time.<br />
In the stochastic case, the results also<br />
apply hold for relationships with<br />
stationary deviations.<br />
Baek and Koo, 2005<br />
This study examines price dynamics in<br />
the U.S. and Canadian hard red spring<br />
and durum wheat markets by using a<br />
vector error-correction model. The<br />
presence of a structural break is taken<br />
into account by splitting the sample in<br />
two.<br />
Baffes, 1991<br />
Using the same dataset and the same<br />
techniques as Ardeni, he shows<br />
instead that the LOP holds. The<br />
difference in the findings is explained<br />
by the fact that he imposes the<br />
cointegration parameters and uses the<br />
variables in levels.<br />
Barassi and Ghoshray, 2007<br />
They test cointegration with structural<br />
change between the EU and the US.<br />
They use a novel cointegration method<br />
which allows the time of the break to<br />
be unknown. The analysis is repeated<br />
on the two sub-samples identified.<br />
128<br />
fob Norwegian and US salmon<br />
prices for four different Pacific<br />
species.<br />
January 1986 – December 1996<br />
Monthly fob prices for the US<br />
and Canadian durum and hard<br />
red spring prices, already<br />
converted in dollars.<br />
July 1979 to June 2002<br />
Same as Ardeni (1989), but<br />
variables are used in levels.<br />
Monthly fob prices for EU<br />
wheat, US Hard Red Winter<br />
Wheat and US Soft Red Wheat<br />
(used in logs).<br />
July1981-July 2000.<br />
The analysis indicates that<br />
the species compete in the<br />
same market, as their prices<br />
are cointegrated; the LOP<br />
holds; the generalized<br />
composite theorem holds.<br />
The Hard Red Wheat<br />
exporting industry and<br />
Canada have been the price<br />
leader in North American<br />
wheat markets.<br />
The LOP cannot be rejected<br />
as a maintained hypothesis.<br />
When it fails, transport costs<br />
might be the explanation<br />
(non-stationarity of freightrates<br />
might explain nonstationarity<br />
of prices<br />
differentials).<br />
A structural break occurred<br />
after the MacSharry CAP<br />
reform was implemented.<br />
Before that, the only<br />
cointegrating relation<br />
existing is between the two<br />
US wheats. After that, they<br />
find a cointegrating vector<br />
between the US Hard Red<br />
Winter wheat and the US<br />
Soft Red Winter wheat, and<br />
another one between the US<br />
Soft Red Wheat and the EU.<br />
The EU acts as a price<br />
follower, as it would be<br />
expected since it makes use<br />
of export subsidies.
METHODOLOGY DATA USED MAJOR FINDINGS<br />
DYNAMIC REGRESSION MODELS BASED ON A POINT LOCATION MODEL: COINTEGRATION<br />
Brooks et al. (2005)<br />
They study the transmission of world<br />
to domestic prices in Brazil for a<br />
number of commodities. Standard<br />
cointegration procedures are compared<br />
in the overall sample and in two sub<br />
samples identified by the presence of<br />
policy regime changes, and then with<br />
the threshold model of Bailey,<br />
Balcombe and Brooks (BBB; 2006).<br />
Bukenya and Labys, 2005<br />
They examine the degree to which<br />
commodity prices have converged on<br />
world commodity markets by using<br />
correlation, regression, VAR and<br />
cointegration analysis.<br />
Conforti, 2004<br />
Both spatial and vertical price<br />
relations are investigated through the<br />
use of Autoregressive Distributed lag<br />
Models from which the corresponding<br />
Error Correction specification is<br />
derived. Annual price information is<br />
analyzed by testing for a long run<br />
equilibrium between the price series;<br />
monthly information by paying more<br />
attention to the dynamics of the<br />
relation between prices, to their<br />
causality (GC tests in both directions<br />
for the ARDL), and to the asymmetry<br />
of price transmission.<br />
Brazilian monthly prices for<br />
wheat, maize, rice, dry beans,<br />
soybeans, coffee, poultry, pig<br />
meat and beef (logs).<br />
January 1989 to October 2003.<br />
Annual data for tin, copper,<br />
lead, coffee, cotton, wheat (in<br />
US dollars).<br />
1930-1998<br />
Both annual and monthly prices<br />
for a number of basic food<br />
commodities collected from<br />
various sources in 16 countries<br />
(Argentina, Brazil, Chile, Costa<br />
Rica, Egypt, Ethiopia, Ghana,<br />
India, Indonesia, Mexico,<br />
Pakistan, Senegal, Thailand,<br />
Turkey, Uganda, Uruguay). The<br />
study used import prices,<br />
producer prices, wholesale<br />
prices and retail prices (in<br />
logs).<br />
Annexes<br />
Cointegration tests for<br />
Brazilian prices support the<br />
hypothesis of discontinuous<br />
price transmission and the<br />
presence of different regimes<br />
following policy reforms in<br />
the mid-1990s (with<br />
differences amongst the<br />
different markets). Once<br />
threshold effects are taken<br />
into account, prices show a<br />
much faster rate of<br />
adjustment outside the<br />
bound. The thresholds<br />
identified by BBB are<br />
sometimes difficult to<br />
reconcile with data on trade<br />
flows.<br />
The empirical results don’t<br />
support price convergence,<br />
with the exception of lead<br />
and wheat.<br />
Three main findings emerge:<br />
geographical regularity<br />
(African countries show<br />
lower degree of price<br />
transmission than Asian and<br />
Latin America ones); vertical<br />
transmission appears to be<br />
higher than the transmission<br />
of changes in the world<br />
reference prices; cereals<br />
show higher and faster price<br />
transmission, followed by<br />
oilseeds, while price<br />
transmission for livestock is<br />
poorer.<br />
129
Annexes<br />
METHODOLOGY DATA USED MAJOR FINDINGS<br />
DYNAMIC REGRESSION MODELS BASED ON A POINT LOCATION MODEL: COINTEGRATION<br />
Dawson and Sanjuan and White, 2006<br />
They apply Johansen’s procedure<br />
allowing for structural breaks. The<br />
time of occurrence of the structural<br />
break is known. Co-movement<br />
between futures prices can arise when<br />
commodities are substitutes. They<br />
investigate the relation between feed<br />
barley and wheat prices on the London<br />
International Financial Futures<br />
Exchange.<br />
Dawson and Sanjuan, 2006<br />
They apply Johansen’s procedure<br />
allowing for structural breaks to<br />
investigate the dynamics of North<br />
America wheat markets and verify the<br />
effects of the Export Enhancement<br />
Program. The time of occurrence of<br />
the structural break is known.<br />
Dercon and Campenhout, 1999<br />
They apply a threshold error<br />
correction model, the Band-TAR<br />
model. Such a model, like switching<br />
regime models (they explicitly refer to<br />
Baulch’s parity bound model), allows<br />
for trade discontinuities and trade flow<br />
reversals, but uses more reasonable<br />
distributional assumptions and is<br />
dynamic, explicitly considering the<br />
process of arbitrage in the form of<br />
non-linear correction.<br />
130<br />
London International Financial<br />
Futures Exchange weekly data<br />
for feed wheat and barley future<br />
prices (in logs).<br />
1996-2002<br />
Monthly fob prices (in logs):<br />
Canadian Western Red Spring,<br />
US Dark Northern Spring.<br />
January 1974-December2001.<br />
Same as Baulch, (1997).<br />
They find a significant break<br />
in October 2000 (due to<br />
Common Agricultural Policy<br />
intervention price reductions<br />
and poor sowing conditions).<br />
The barley–wheat futures<br />
market is perfectly<br />
integrated; the barley price<br />
Granger-causes the wheat<br />
price. Modelling structural<br />
breaks in price relationships<br />
appears of big importance.<br />
They find that cointegration<br />
exists and that there are two<br />
structural breaks<br />
corresponding to the<br />
beginning and the end of the<br />
US Export Enhancement<br />
Programme. The EEP has<br />
caused the US/Canada price<br />
ratio to fall.<br />
They find that in most<br />
markets full arbitrage is<br />
achieved with trade taking<br />
place; but, differently from<br />
Baulch, that in others<br />
arbitrage is slow and rather<br />
inefficient. This might be<br />
due to imperfect competition.<br />
This is explained by the fact<br />
that, in Baulch’s model, even<br />
in the efficient arbitrage<br />
regime, the transfer costs are<br />
assumed to be measured with<br />
errors (but dynamic<br />
properties of the errors are<br />
not considered), whereas<br />
here the price margin is<br />
taken as such. On the other<br />
side, they probably<br />
overestimate the times in<br />
which the efficient arbitrage<br />
condition is violated.
METHODOLOGY DATA USED MAJOR FINDINGS<br />
DYNAMIC REGRESSION MODELS BASED ON A POINT LOCATION MODEL: COINTEGRATION<br />
Ghoshray and Lyoid, 2003<br />
By using the method of irreducible<br />
cointegrated vectors, they investigate<br />
the relations existing amongst wheat<br />
prices of different countries according<br />
to wheat type and port location.<br />
Ghoshray et al., 2000<br />
They analyze the cointegrating<br />
relationships existing in 12 pairs of<br />
prices constituted by the EU price plus<br />
another one.<br />
Ghoshray, 2002<br />
He examines price differentials in the<br />
international wheat market using<br />
threshold autoregressive (TAR) and<br />
momentum threshold autoregressive<br />
(M-TAR) models, that allow for<br />
asymmetric adjustment.<br />
Gjoelberg et al. (1996)<br />
A set of conditions to hold is proposed<br />
to have market integration: not only<br />
must prices be cointegrated in a<br />
dynamic specification and adjust<br />
rapidly towards equilibrium, but also<br />
they must not systematically fluctuate<br />
outside transaction costs ranges, they<br />
must react simultaneously to new<br />
information (i.e., have a common<br />
behaviour at the harvest time), display<br />
similar paths within the marketing<br />
year, and tend towards “one price”.<br />
Goodwin, 1992<br />
He applies Johansen’s multivariate<br />
cointegrating testing procedure,<br />
arguing that bivariate Engle Granger<br />
cointegration tests are limited.<br />
Monthly fob export prices (in<br />
logs) of 13 different price series<br />
(from Argentina, Australia,<br />
Canada, the US, the EU).<br />
July 1980-December 1998.<br />
Monthly fob export prices (in<br />
logs) of 13 different price series<br />
(from Argentina, Australia,<br />
Canada, US, EU).<br />
July 1980-December 1998.<br />
Monthly average export price<br />
quotations on 8 series of<br />
Australian, Canadian, US and<br />
EU hard medium and soft<br />
wheat, analyzed in pairs (in<br />
logs).<br />
July 1980 to December 1985<br />
Monthly producer prices for soft<br />
wheat (Eurostat) for Belgium,<br />
Italy, germany, the United<br />
Kingdom and France<br />
January 1984-December 1994<br />
Monthly fob export prices (in<br />
levels) for the US, Canada,<br />
Australia, cif prices for Japan<br />
and the EU. Monthly average<br />
freight rates from the US Gulf<br />
to Rotterdam and Japan.<br />
January 1978-December 1989.<br />
Annexes<br />
They provide statistical<br />
support for examining<br />
wheats that have different<br />
end uses (namely hard<br />
wheats), separately.<br />
They find that cointegration<br />
exists in all the pairs but in<br />
those including Canadian<br />
feed wheat. All wheats used<br />
for human consumption<br />
show a common trend, while<br />
feed wheats have another<br />
one.<br />
The world wheat market is<br />
highly integrated and little<br />
evidence for asymmetry<br />
exists. Where asymmetry is<br />
found, it might be due to the<br />
quality of wheat (Canadian<br />
and Australian prices for<br />
higher quality wheats may<br />
respond easier to price<br />
increases than to price<br />
decreases).<br />
Evidence of no integration is<br />
found for EU wheat markets;<br />
only limited evidence of<br />
convergence towards a<br />
common price can be found.<br />
This can be due to distorsive<br />
effect of the CAP, due for<br />
example to the Monetary<br />
Compensatory Amounts,<br />
functioning as<br />
subsidies/taxes on intra-EU<br />
trade.<br />
He argues that, if transport<br />
costs are explicitly taken into<br />
account, the Law of One<br />
Price is valid. The inclusion<br />
of freight rates in the model<br />
(by subtracting them to the<br />
cif prices of the EU and<br />
Japan) allows to find one<br />
cointegration vector.<br />
131
Annexes<br />
METHODOLOGY DATA USED MAJOR FINDINGS<br />
DYNAMIC REGRESSION MODELS BASED ON A POINT LOCATION MODEL: COINTEGRATION<br />
Goodwin et al., 1999<br />
They evaluate spatial price dynamics<br />
and integration for selected Russian<br />
food markets by using conventional<br />
time series tests of spatial integration<br />
with an analysis of dynamic responses<br />
to price shocks (GC and IRF).<br />
Goodwin and Schroeder, 1991b<br />
By using cointegration tests, they<br />
evaluate spatial linkages in regional<br />
cattle markets.<br />
They conduct seven different Engle-<br />
Granger cointegration tests for two<br />
specifications of ten market<br />
comparisons over four periods. By<br />
using bootstrap regression techniques,<br />
they assess the influence on the test<br />
statistics of concentration ratios,<br />
average annual slaughter volumes and<br />
the distance between markets.<br />
Hui Shung and Griffith, 1998<br />
They investigate short and long run<br />
dynamics in the Australian beef<br />
market between farm, wholesale and<br />
retail prices, with cointegration and<br />
IRF.<br />
Margarido et al., 2004<br />
They investigate the elasticities of<br />
transmission in the soybeans market<br />
through the use of cointegration<br />
techniques (one VECM model for all<br />
the prices). They then calculate IRFs<br />
and FEVs.<br />
132<br />
Weekly eggs, milk, vegetable<br />
oil and potatoes prices in five<br />
Russian cities in both retail and<br />
“gray” (free) markets (in logs).<br />
Results were repeated with<br />
deflated prices and were found<br />
similar.<br />
June 1993-December 1994.<br />
Weekly price series for<br />
slaughter steers for eleven<br />
regional US markets (in levels).<br />
January 1980-September 1987.<br />
Monthly beef farm, wholesale<br />
and retail prices in Australia.<br />
January 1971 to September<br />
1994<br />
Monthly soybeans prices (in<br />
logs): cif Rotterdam Port, fob<br />
Argentina, fob US.<br />
October 1995-October 2003.<br />
Results provide tempered<br />
support for spatial<br />
integration, especially in<br />
retail market. Retail markets<br />
have bigger efficiency<br />
advantages and economies of<br />
scale, which allow a better<br />
price transmission than for<br />
“gray” markets. Because of<br />
gradual adjustments to price<br />
shocks, integration may<br />
occur mainly in the long run.<br />
Their results can be<br />
summarized as follows:<br />
increased market<br />
concentration leads to higher<br />
cointegration; relative<br />
slaughter volume has a<br />
negative impact on<br />
cointegration (the smaller<br />
markets exhibit a smaller<br />
degree of spatial dependence<br />
than the bigger ones); the<br />
degree of price cointegration<br />
is negatively affected by<br />
bigger distances between<br />
markets. Increasing<br />
cointegration during the<br />
1980s is explained by<br />
structural changes in the<br />
livestock industry.<br />
The three prices considered<br />
are cointegrated; the<br />
wholesale price is found to<br />
be weakly exogenous, which<br />
could be an indication of<br />
market inefficiency due in<br />
part to price levelling.<br />
The LOP is valid in the long<br />
run. Brazil and Argentina<br />
can be seen as price takers.<br />
Seasonal differences may<br />
explain the pattern of the<br />
response of Brazilian prices<br />
to shocks in the international<br />
market.
METHODOLOGY DATA USED MAJOR FINDINGS<br />
DYNAMIC REGRESSION MODELS BASED ON A POINT LOCATION MODEL: COINTEGRATION<br />
Mohanty and Langley, 2003<br />
They examine the co-movement<br />
between US and Canadian grain prices<br />
using cointegration techniques and<br />
ECMs in four different sub-periods:<br />
pre-post NAFTA, pre-post the<br />
Western Grain Transportation Act of<br />
Canada.<br />
Mohanty et al., 1999<br />
They analyze world wheat markets<br />
using cointegration techniques.<br />
Sanjuan and Gil, 2001<br />
Cointegration tests are applied to<br />
study long-run relationships; GC tests<br />
are then used to obtain the general<br />
pattern of influences. FEV analysis is<br />
used to analyze the strength of price<br />
interdependence.<br />
Sharma, 2002<br />
The Engle-Granger procedure is used<br />
to test for price co-movement in Asian<br />
wheat markets.<br />
Thompson and Bohl, 1999<br />
A cointegration analysis is performed<br />
to check how policy regime changes<br />
affected international price<br />
transmission elasticities. A threshold<br />
cointegrating technique is used.<br />
Monthly prices for wheat and<br />
barley (in logs) for Canada and<br />
the US.<br />
June 1986 - July 1999.<br />
Monthy fob prices (in logs) for<br />
the US, Canada, Australia,<br />
Argentina and the EU.<br />
January 1981 to June 1993.<br />
Weekly prices (in levels) for<br />
pork and lamb carcasses for<br />
seven EU countries (DE, DK,<br />
ES, FR, IL, NL,UK).<br />
1988-1995 (418 obs.).<br />
Monthly wholesale or retail<br />
prices for cereals for eight Asian<br />
markets.<br />
January 1990-December 1999<br />
Domestic prices for Germany<br />
are from Eurostat (in DM).<br />
World prices (Dark Northern<br />
Spring Wheat, cif Rotterdam,<br />
US$) are obtained from the<br />
USDA. Monthly exchange rates<br />
from the IMF were used for the<br />
conversion. Nominal prices are<br />
used since real price didn’t<br />
show any statistical difference.<br />
All prices in logs.<br />
June 1976 to December 1998.<br />
Annexes<br />
They find that the series are<br />
always cointegrated, and that<br />
the coefficients of<br />
transmissions are higher after<br />
the implementation of the<br />
two agreements.<br />
They find that there is no<br />
distinct leader in the<br />
international wheat market.<br />
This differs with the results<br />
of a number of different<br />
studies, that could<br />
nonetheless have been<br />
misspecified for disregarding<br />
the time series properties of<br />
the data.<br />
Pork markets shows a high<br />
degree of integration; a more<br />
limited degree of integration<br />
is observed in the sheep one.<br />
Both the review of past<br />
estimates and their findings<br />
confirm that price<br />
transmission elasticities tend<br />
to be very low (0.2-0.4 in the<br />
short run, and higher in the<br />
long run, but still less than<br />
unity in the import case) for<br />
most developing countries.<br />
The price series are<br />
integrated.<br />
Long run transmission<br />
elasticities range from 0.18<br />
during the 70s and 80s and<br />
0.30 during the post URAA.<br />
They argue that reforms<br />
made to the CAP had an<br />
effect in increasing internal<br />
price variability. World price<br />
volatility decreased over the<br />
period considered.<br />
133
Annexes<br />
METHODOLOGY DATA USED MAJOR FINDINGS<br />
DYNAMIC REGRESSION MODELS BASED ON A POINT LOCATION MODEL: COINTEGRATION<br />
Thompson et al., 2002a<br />
Their focus is on the estimation<br />
technique and on the extent to which<br />
liberalizing policy reforms contribute<br />
to market spatial efficiency. They use<br />
Seemingly Unrelated Regression<br />
Augmented Dickey Fuller tests and<br />
error-correction models to account for<br />
cross-equation correlations among<br />
markets.<br />
Verga e Zuppiroli, 2003<br />
They apply cointegration analysis to<br />
four European soft wheat markets to<br />
test the relations between them, with<br />
the institutional EU prices and with<br />
the international prices. With the<br />
“directed graphs” technique, they also<br />
analyze contemporaneous relations<br />
between the prices. They tests are run<br />
on the whole subsample and in the<br />
sub-period 1995-2002.<br />
Viju et al., 2006<br />
They asses the accession of Austria,<br />
Finland and Sweden to the EU from<br />
the perspective of market integration.<br />
They use cointegration techniques in<br />
two different samples (pre and post<br />
accession). For each product, for each<br />
period, they run cointegration analysis<br />
in pairs with the German price.<br />
134<br />
Soft wheat quarterly prices for<br />
Germany, France and the UK<br />
(Eurostat; domestic prices), and<br />
US cif Rotterdam. All prices are<br />
nominal and converted in<br />
dollars with IMF exchange rates<br />
(in logs; the analysis on deflated<br />
prices yields no significant<br />
differences). 1976:3-1999:4<br />
Weekly prices (in levels) for<br />
two main Italian markets and<br />
two main French makets; cif<br />
Rotterdam price of US Soft Red<br />
Winter wheat; intervention<br />
price; EU import price.<br />
January 1990-December 2002.<br />
Monthly data (in logs) for rye,<br />
oats, barley, soft wheat and<br />
potatoes for Austria, Finland,<br />
Sweden, Germany (=EU<br />
reference price). Data are<br />
obtained from Eurostat, and are<br />
all converted to ecu/euros.<br />
January 1975-December 2004.<br />
The adjustment coefficients<br />
for EU countries (the same<br />
speed of convergence is<br />
imposed amongst all<br />
countries) increase after<br />
1993 and 1995, but<br />
nonetheless keep low due to<br />
the imperfect tariffication<br />
realized under the URAA.<br />
The European market is<br />
strongly cointegrated, but<br />
there is no cointegrating<br />
relationship with the US<br />
price. The EU prices are<br />
cointegrated with the<br />
institutional prices (but they<br />
claim this relation is unstable<br />
and thus distorted) but not in<br />
the subsample 1995-2002.<br />
Higher variability of EU<br />
prices is not due to bigger<br />
linkages with the<br />
international markets but to<br />
the lowering of the<br />
intervention price.<br />
The prices are highly<br />
cointegrated after the three<br />
countries joined EU. Beyond<br />
the presence of arbitrage,<br />
results could be explained by<br />
the fact that all products<br />
studied (except of potatoes)<br />
are under CAP support. In<br />
the pre-EU period,<br />
cointegration among prices<br />
was discovered for rye, soft<br />
wheat and barley between<br />
Austria and Germany<br />
(neighbouring countries with<br />
strong transportation ties).
METHODOLOGY DATA USED MAJOR FINDINGS<br />
DYNAMIC REGRESSION MODELS BASED ON A POINT LOCATION MODEL: COINTEGRATION<br />
Wang and Tomek, 2007<br />
They investigate what seems to be<br />
inconsistency between price theory,<br />
which suggests that commodity prices<br />
should be stationary series, and tests<br />
for unit roots, which rather frequently<br />
imply that these prices are not<br />
stationary. Unit root tests are applied<br />
to nominal, deflated, log nominal, log<br />
deflated prices. Tests are run with and<br />
without a trend, and general to specific<br />
method for lag length is used.<br />
Williams and Bewley, 1995<br />
They investigate the presence of<br />
arbitrage opportunities between four<br />
Australian cattle markets.<br />
Zanias, 1993<br />
For four products (for which different<br />
levels of political support exist), they<br />
run cointegration tests amongst all<br />
possible pairs of countries for which<br />
data are available. Both the<br />
unrestricted and the restricted version<br />
of the LOP (where perfect price<br />
transmission is I posed) are tested.<br />
SWITCHING REGIME-THRESHOLD MODELS<br />
Balcombe et al., 2007<br />
They use a threshold cointegration<br />
model which introduces a<br />
generalization on existing threshold<br />
models: the prices could be attracted<br />
to either the edge of the threshold<br />
interval or the to some point within the<br />
interval. They are estimated with a<br />
Bayesian approach.<br />
Monthly prices for corn,<br />
soybeans, milk, barrow, gilts,<br />
weekly prices for corn and<br />
soybeans. All in Illinois.<br />
CPI is used for deflating prices<br />
1960-2005<br />
Weekly cattle prices for 4<br />
Australian markets (in logs)<br />
March 1986 - August 1989.<br />
Monthly prices from Eurostat,<br />
for soft wheat (1980:1-<br />
1990:12), cow’s milk (1983:1-<br />
1990:12), pig carcasses grade<br />
I(1986:1-1990:12), potatoes<br />
(1983:4-1990:12), for a number<br />
of countries, depending on data<br />
availability (BE,DE, FR,IT, NL,<br />
UK). All prices are expressed in<br />
ecu.<br />
Monthly Brazilian, US and<br />
Argentine prices for wheat<br />
(1988-2001), maize (1986-<br />
2001), soybeans (1988-2001).<br />
All prices are used in logs and<br />
converted in US dollars.<br />
Annexes<br />
Results of unit root tests vary<br />
with their specification.<br />
Evidence favouring unit<br />
roots in commodity prices is<br />
not strong, even without<br />
accounting for structural<br />
breaks.<br />
.<br />
Arbitrage opportunities are<br />
usually short lived and long<br />
run equilibrium is restored,<br />
except for one market which<br />
is identified as a satellite<br />
market.<br />
The LOP holds in about half<br />
of the cases considered. For<br />
soft wheat markets, price comovement<br />
is found after<br />
prices have been corrected<br />
by Monetary Compensatory<br />
Amounts. The existence of a<br />
minimum intervention price<br />
is probably fundamental, but<br />
efficient arbitrage is also<br />
necessary.<br />
Evidence of thresholds is<br />
found in three out of the five<br />
commodity pairs<br />
investigated. The size of the<br />
thresholds depends upon the<br />
commodities considered.<br />
135
Annexes<br />
METHODOLOGY DATA USED MAJOR FINDINGS<br />
SWITCHING REGIME-THRESHOLD MODELS<br />
Barrett and Li, 2002<br />
They introduce a new methodology<br />
based on maximum likelihood<br />
estimation of a mixture distribution<br />
model incorporating price, transfer<br />
costs, and trade flow data. Four<br />
different regimes are developed<br />
according to the presence or absence<br />
of market efficiency and integration.<br />
Baulch, 1997<br />
He develops the Parity Bound Model<br />
(PBM), an alternative methodology in<br />
which information on transfer costs is<br />
used in addition to prices. According<br />
to the size of price spreads and of<br />
transfer costs, three regimes are<br />
derived (within, at and outside the<br />
arbitrage band).<br />
Goodwin and Piggott, 2001<br />
They evaluate corn and soybean<br />
markets in North Carolina; they use<br />
threshold autoregression and<br />
cointegration models to account for a<br />
neutral band representing transaction<br />
costs. Regime switching is triggered<br />
when deviations in prices exceed the<br />
“neutral band” represented by<br />
transport costs. The prices are<br />
analyzed in pairs.<br />
Negassa and Myers, 2007<br />
The standard PBM model is extended<br />
to allow for dynamic shifts in regime<br />
probabilities (the probability of being<br />
in a particular trading regime is not<br />
time invariant) in response to changes<br />
in marketing policy. This allows to see<br />
whether changes in policies have<br />
increased or not spatial efficiency.<br />
136<br />
Monthly data on prices, trade<br />
flows, and estimated intermarket<br />
transaction costs for<br />
soybean meal over the years<br />
1990-1996 for Canada, Japan,<br />
Taiwan and the United States.<br />
Monthly wholesale price (in<br />
levels) for Philippine rice<br />
coming from eight different<br />
markets.<br />
January 1980-June 1993.<br />
Daily corn and soybean prices<br />
in 4 North Carolina terminal<br />
markets. (in logs).<br />
2 January 1992-4 March 1999.<br />
Weekly wholesale prices (in<br />
levels) converted into monthly<br />
prices for maize and wheat in<br />
eight Ethiopian markets.<br />
August 1996-August 2002.<br />
The methodology proposed,<br />
which is particularly useful<br />
when trade is discontinuous<br />
or bilateral and transfer costs<br />
are variable, is an attempt to<br />
bridge price and quantity<br />
based approaches to the<br />
study of price transmission,<br />
which allows to distinguish<br />
between market integration<br />
and efficiency. Competitive<br />
tradability and equilibrium<br />
conditions prevail in the<br />
market examined.<br />
Monte Carlo experiments<br />
show that the PBM is<br />
statistically reliable. An<br />
application to the Philippine<br />
rice markets demonstrates<br />
that the PBM detects<br />
efficient arbitrage when<br />
other tests do not.<br />
Results confirm the presence<br />
of thresholds and indicate<br />
support for market<br />
integration; threshold models<br />
suggest faster adjustments to<br />
disequilibrium than when<br />
threshold are ignored.<br />
Thresholds turn out to be<br />
bigger when there is a bigger<br />
distance between markets.<br />
The results highlight the<br />
importance of allowing for<br />
adjustment to policy<br />
changes.
METHODOLOGY DATA USED MAJOR FINDINGS<br />
SWITCHING REGIME-THRESHOLD MODELS<br />
Septhon, 2003<br />
They expand Goodwin and Piggott<br />
(2001) studies in three directions: they<br />
use the direct multivariate test of<br />
Hansen and Seo instead of a single<br />
equation search to look for<br />
confirmatory evidence; they use<br />
Hansen tests to determine the number<br />
of thresholds; they test for the<br />
presence of non-linear cointegration.<br />
Sexton et al., 1991<br />
Their estimation is based on a<br />
switching regression model with three<br />
regimes (the direction of trade flows is<br />
fixed, but arbitrage conditions might<br />
be violated): efficient arbitrage,<br />
relative shortage, relative glut. Only<br />
price data are needed.<br />
RATIONAL EXPECTATIONS MODELS<br />
Goodwin et al., 1990<br />
Typical analyses of the LOP<br />
overlooks temporal elements of trade,<br />
and assume that parity should hold<br />
contemporaneously. They use two<br />
different approaches to test the LOP:<br />
GMM to estimate rationally formed<br />
expected future prices (expectations<br />
augmented version of the LOP);<br />
nonparametric analysis of price parity.<br />
Same as Goodwin and Piggott,<br />
(2001).<br />
Weekly prices (in levels) of US<br />
celery in Florida and California<br />
in 6 terminal markets.<br />
January 1985-December 1988.<br />
Monthly prices (levels) for 34<br />
commodities from various<br />
countries, all converted in<br />
dollars.<br />
The period considered is from<br />
July 1973 to December 1985<br />
(72 to 128 obs., depending on<br />
the price).<br />
Annexes<br />
Their results indicate the<br />
presence of one threshold in<br />
most of the bivariate<br />
commodity pairings, and are<br />
supported by more general<br />
tests of nonlinear<br />
cointegration.<br />
The methodology allows for<br />
investigating market<br />
integration, arbitrage<br />
efficiency, magnitude of<br />
marketing margins, product<br />
substitutability, and market<br />
competitiveness.<br />
They conclude that using a<br />
simple-augmented<br />
expectations-model produces<br />
greater support for the LOP<br />
than using contemporaneous<br />
prices. Results provide<br />
strong support for a rational<br />
expectations version of the<br />
LOP. For the wheat market,<br />
adherence to the standard<br />
version of the LOP is limited<br />
(only two out of six markets<br />
support parity); for the<br />
expectations augmented<br />
version, the LOP is instead<br />
rejected only in one case.<br />
137
Annexes<br />
Variable<br />
swfr<br />
138<br />
Annex B – Unit root tests<br />
Table B.1 – Unit root tests, ADF statistics -18 (1978:12-2003:12)<br />
n° of lags<br />
logs (diff. logs)<br />
n 12(11)<br />
c 12(11)<br />
c+t 12(11)<br />
c+s 12(11)<br />
c+t+s 12(11)<br />
hrw<br />
n 1(0)<br />
c 1(0)<br />
c+t 1(0)<br />
c+s 1(0)<br />
c+t+s 1(0)<br />
Logs Differentiated logs<br />
-0.042<br />
(0.669)<br />
-1.823<br />
(0.369)<br />
-3.256<br />
(0.074)<br />
-1.737<br />
(0.412)<br />
-3.183<br />
(0.088)<br />
0.172<br />
(0.736)<br />
-3.255<br />
(0.017)<br />
-3.325<br />
(0.062)<br />
-3.107<br />
(0.026)<br />
-3.183<br />
(0.088)<br />
-3.761<br />
(0.0001)<br />
-3.733<br />
(0.004)<br />
-3.606<br />
(0.029)<br />
-3.761<br />
(0.003)<br />
-3.637<br />
(0.027)<br />
n= no constant; c= constant; c+ t=constant and trend; s= seasonal dummies included; p-values are based on<br />
MacKinnon (1996) and reported in parenthesis.<br />
-12.544<br />
(0)<br />
-12.528<br />
(0)<br />
-12.511<br />
(0)<br />
-12.477<br />
(0)<br />
-12.461<br />
(0)
Variable<br />
swfr<br />
Table B.2 – Unit root tests, ADF statistics -18 (1978:12-1993:06)<br />
n° of lags<br />
logs (diff. logs)<br />
n 12(11)<br />
c 17(11)<br />
c+t 17(11)<br />
c+s 12(11)<br />
c+t+s 12(11)<br />
hrw<br />
n 1(0)<br />
c 11(0)<br />
c+t 11(0)<br />
c+s 4(0)<br />
c+t+s 4(0)<br />
Annexes<br />
Logs Differentiated logs<br />
0.668<br />
(0.860)<br />
-2.720<br />
(0.070)<br />
-2.882<br />
(0.168)<br />
-2.502<br />
(0.115)<br />
-2.566<br />
(0.296)<br />
-0.072<br />
(0.659)<br />
-2.328<br />
(0.163)<br />
-2.984<br />
(0.136)<br />
-2.319<br />
(0.166)<br />
-3.061<br />
(0.116)<br />
-3.679<br />
(0.0001)<br />
-3.737<br />
(0.003)<br />
-3.740<br />
(0.019)<br />
-3.025<br />
(0.032)<br />
-2.988<br />
(0.135)<br />
n= no constant; c= constant; c+ t=constant and trend; s= seasonal dummies included; p-values are based on<br />
MacKinnon (1996) and reported in parenthesis.<br />
-9.223<br />
(0)<br />
-9.196<br />
(0)<br />
-9.25<br />
(0)<br />
-8.957<br />
(0)<br />
-9.027<br />
(0)<br />
139
Annexes<br />
Variable<br />
swfr<br />
140<br />
Table B.3 – Unit root tests, ADF statistics -18 (1993:07-2003:12)<br />
n° of lags<br />
logs (diff. logs)<br />
n 12(11)<br />
c 12(11)<br />
c+t 12(11)<br />
c+s 12(0)<br />
c+t+s 12(0)<br />
hrw<br />
n 2(1)<br />
c 1(1)<br />
c+t 1(1)<br />
c+s 1(1)<br />
c+t+s 1(1)<br />
Logs Differentiated logs<br />
0.546<br />
(0.8343)<br />
-1.807<br />
(0.377)<br />
-2.245<br />
(0.464)<br />
-1.574<br />
(0.496)<br />
-2.113<br />
(0.537)<br />
0.272<br />
(0.765)<br />
-3.081<br />
(0.028)<br />
-3.102<br />
(0.106)<br />
-2.843<br />
(0.052)<br />
-2.853<br />
(0.178)<br />
-1.926<br />
(0.0516)<br />
-1.808<br />
(0.3772)<br />
-1.798<br />
(0.706)<br />
-8.327<br />
(0)<br />
-8.308<br />
(0)<br />
n= no constant; c= constant; c+ t=constant and trend; s= seasonal dummies included; p-values are based on<br />
MacKinnon (1996) and reported in parenthesis.<br />
Variable<br />
n° of lags<br />
logs (diff. logs)<br />
swfr 13(12)<br />
n<br />
c<br />
c+t<br />
hrw 2(1)<br />
n<br />
c<br />
c+t<br />
Table B.4 – Unit root tests, PP statistics (1978:12-2003:12)<br />
n= no constant; c= constant; c+ t=constant and trend<br />
-7.950<br />
(0)<br />
-7.928<br />
(0)<br />
-7.9023<br />
(0)<br />
-7.269<br />
(0)<br />
-7.246<br />
(0)<br />
5% critical values Logs Differentiated logs<br />
-8.000<br />
-1.950<br />
-14.000<br />
-2.878<br />
-21.339<br />
-3.428<br />
-8.000<br />
-1.950<br />
-14.000<br />
-2.878<br />
-21.339<br />
-3.428<br />
0.013<br />
0.107<br />
-9.253<br />
-2.160<br />
-24.587<br />
-3.503<br />
0.049<br />
0.229<br />
-14.941<br />
-2.814<br />
-15.387<br />
-2.871<br />
-180.846<br />
-16.087<br />
-180.937<br />
-16.044<br />
-181.209<br />
-15.997<br />
-209.427<br />
-12.582<br />
-209.561<br />
-12.567<br />
-209.646<br />
-12.550
Variable<br />
n° of lags<br />
logs (diff. logs)<br />
swfr 13(12)<br />
n<br />
c<br />
c+t<br />
hrw 2(1)<br />
n<br />
c<br />
c+t<br />
Table B.5 – Unit root tests, PP statistics (1978:12-1993:06)<br />
n= no constant; c= constant; c+ t=constant and trend<br />
Variable<br />
n° of lags<br />
logs (diff. logs)<br />
swfr 2(1)<br />
n<br />
c<br />
c+t<br />
hrw 2(1)<br />
n<br />
c<br />
c+t<br />
Annexes<br />
5% critical values Logs Differentiated logs<br />
-7.949<br />
-1.950<br />
-13.848<br />
-2.885<br />
-20.996<br />
-3.440<br />
-7.949<br />
-1.950<br />
-13.848<br />
-2.885<br />
-20.996<br />
-3.440<br />
0.036<br />
0.620<br />
-25.548<br />
-3.883<br />
-25.669<br />
-3.863<br />
-0.006<br />
-0.041<br />
-5.894<br />
-1.738<br />
-8.467<br />
-2.338<br />
Table B.6 – Unit root tests, PP statistics (1993:07-2003:12)<br />
n= no constant; c= constant; c+ t=constant and trend<br />
-101.352<br />
-15.626<br />
-101.061<br />
-15.688<br />
-100.736<br />
-15.706<br />
-113.330<br />
-9.180<br />
-113.333<br />
-9.152<br />
-114.695<br />
-9.218<br />
5% critical values Logs Differentiated logs<br />
-7.917<br />
-1.950<br />
-13.750<br />
-2.888<br />
-20.800<br />
-3.447<br />
-7.917<br />
-1.950<br />
-13.750<br />
-2.888<br />
-20.800<br />
-3.447<br />
0.055<br />
0.503<br />
-9.682<br />
-1.988<br />
-13.062<br />
-2.082<br />
0.043<br />
0.301<br />
-13.225<br />
-2.641<br />
-13.508<br />
-2.646<br />
-93.872<br />
-8.619<br />
-94.210<br />
-8.607<br />
-94.528<br />
-8.597<br />
-90.899<br />
-8.267<br />
-91.014<br />
-8.239<br />
-91.024<br />
-8.207<br />
141
Annexes<br />
142<br />
Table B.7 – Unit root tests, KPSS statistics (1978:12-2003:12)<br />
Variable<br />
n°of lags<br />
logs (diff. logs)<br />
5% critical value Logs Differentiated logs<br />
swfr 24(23)<br />
c 0.463 1.003 0.129<br />
hrw 24(23)<br />
c 0.463 0.144 0.060<br />
c= constant<br />
Table B.8 – Unit root tests, KPSS statistics (1978:12-1993:06)<br />
Variable<br />
n°of lags<br />
logs (diff. logs)<br />
5% critical value Logs Differentiated logs<br />
swfr 24(23)<br />
c 0.463 0.132 0.184<br />
hrw 24(23)<br />
c 0.463 0.289 0.145<br />
c= constant<br />
Table B.9 – Unit root tests, KPSS statistics (1993:07-2003:12)<br />
Variable<br />
n°of lags<br />
logs (diff. logs)<br />
5% critical value Logs Differentiated logs<br />
swfr 24(23)<br />
c 0.463 0.408 0.351<br />
hrw 24(23)<br />
c<br />
c= constant<br />
0.463 0.105 0.102
Annex C – Cointegration tests<br />
Table C.1 – Cointegration tests, Johansen tests for swfr and hrw (1978:12-2003:12)<br />
Annexes<br />
H0(H1) 16 lags (nd)<br />
trace λmax<br />
16 lags (d)<br />
trace λmax<br />
16 lags (d6, d7, d8)<br />
trace λmax<br />
r = 0 (r = 2) 18.457(0.086) ♦ 14.939(0.069)* 17.694(0.109) 14.159(0.092) 17.245(0.125) 13.870(0.102)<br />
r = 1 (r = 2) 3.518(0.500) 3.518(0.500) 3.535(0.497) 3.535(0.497) 3.376(0.524) 3.376(0.524)<br />
nd = no monthly dummies considered; d = eleven monthly dummies were included; d6,d7,d8 = only dummies for June, July and<br />
August were considered; trace = Johansen trace test; λmax = Johansen λmax test; p-values are reported in parenthesis<br />
♦ In the hypothesis of a 1 cointegration rank, the corresponding VECM was estimated, but the value of the transmission elasticity<br />
parameters were implausible. When 13 lags were used, in analogy with wref, the cointegration rank was always 0<br />
Table C.2 – Cointegration tests, Johansen tests for swfr and hrw (1978:12-1993:06)<br />
H0(H1) 13 lags (nd)<br />
trace λmax<br />
5 lags (d)<br />
trace λmax<br />
5 lags (d6, d7, d8)<br />
trace λmax<br />
r = 0 (r = 2) 29.112(0.002) 25.585(0.0007) 24.885(0.009) 19.065(0.013) 25.323(0.008) 18.459(0.017)<br />
r = 1 (r = 2) 3.527(0.498) 3.527(0.498) 5.820(0.212) 5.820(0.212) 6.863(0.137) 6.863(0.137)<br />
nd = no monthly dummies considered; d = eleven monthly dummies were included; d6,d7,d8 = only dummies for June, July and<br />
August were considered; trace = Johansen trace test; λmax = Johansen λmax test; p-values are reported in parenthesis<br />
Table C.3 – Cointegration tests, Johansen tests for swfr and hrw (1993:07-2003:12)<br />
H0(H1) 2 lags (nd)<br />
trace λmax<br />
23 lags (d)<br />
trace λmax<br />
2 lags (d6, d7, d8)<br />
trace λmax<br />
r = 0 (r = 2) 18.853(0.0764) 12.100(0.186) 30.663(0.0009) 28.726(0.0002) 18.279(0.091) 11.352(0.235)<br />
r = 1 (r = 2) 6.753(0.144) 6.753(0.144) 2.837(0.619) 2.8373(0.6176) 6.928(0.134) 6.928(0.134)<br />
H0(H1) 13 lags (nd)<br />
trace λmax<br />
13 lags (d)<br />
trace λmax<br />
13 lags (d6, d7, d8)<br />
trace λmax<br />
r = 0 (r = 2) 17.232(0.125) 13.467(0.118) 18.707(0.080) 15.647(0.053) 17.781(0.106) 14.588(0.079)<br />
r = 1 (r = 2) 3.765(0.460) 3.765(0.459) 3.060(0.579) 3.060(0.577) 3.193(0.555) 3.193(0.554)<br />
nd = no monthly dummies considered; d = eleven monthly dummies were included; d6,d7,d8 = only dummies for June, July and<br />
August were considered; trace = Johansen trace test; λmax = Johansen λmax test; p-values are reported in parenthesis<br />
Table C.4 – Cointegration tests, Johansen tests for swfr and wref (1978:12-2003:12)<br />
H0(H1)<br />
13 lags (nd)<br />
trace λmax<br />
13 lags (d)<br />
trace λmax<br />
13 lags (d6, d7, d8)<br />
trace λmax<br />
r = 0 (r = 2) 32.852(0.0004) 29.137(0.0001) 28.183(0.003) 24.798(0.001) 27.621(0.003) 24.237(0.0013)<br />
r = 1 (r = 2) 3.751(0.468) 3.751(0.468) 3.385(0.522) 3.385(0.522) 3.385(0.522) 3.385(0.522)<br />
nd = no monthly dummies considered; d = eleven monthly dummies were included; d6,d7,d8 = only dummies for June, July and<br />
August were considered; trace = Johansen trace test; λmax = Johansen λmax test; p-values are reported in parenthesis<br />
143
Annexes<br />
144<br />
Table C.5 – Cointegration tests, Johansen tests for swfr and wref (1978:12-1993:06)<br />
H0(H1) 13 lags (nd)<br />
trace λmax<br />
1 lag (d)<br />
trace λmax<br />
1 lag (d6, d7, d8)<br />
trace λmax<br />
r = 0 (r = 2) 31.470(0.0007) 26.264(0.0005) 37.889(0) 33.123(0) 45.083(0) 37.962(0)<br />
r = 1 (r = 2) 5.206(0.271) 5.206(0.271) 4.766(0.321) 4.766(0.321) 7.1213(0.123) 7.1213(0.123)<br />
nd = no monthly dummies considered; d = eleven monthly dummies were included; d6,d7,d8 = only dummies for June, July and<br />
August were considered; trace = Johansen trace test; λmax = Johansen λmax test; p-values are reported in parenthesis<br />
Table C.6 – Cointegration tests, Johansen tests for swfr and wref (1993:07-2003:12)<br />
H0(H1) 2 lags (nd)<br />
trace λmax<br />
2 lags (d)<br />
trace λmax<br />
2 lags (d6, d7, d8)<br />
trace λmax<br />
r = 0 (r = 2) 20.435(0.046) 13.769(0.1058) 19.993(0.059) 12.490(0.164) 19.548(0.061) 12.869(0.153)<br />
r = 1 (r = 2) 6.665(0.150) 6.6655(0.150) 7.503(0.104) 7.503(0.104) 6.585(0.138) 6.585(0.138)<br />
H0(H1) 13 lags (nd)<br />
trace λmax<br />
13 lags (d)<br />
trace λmax<br />
13 lags (d6, d7, d8)<br />
trace λmax<br />
r = 0 (r = 2) 19.604(0.060) 15.642(0.053) 20.234(0.049) 17.200(0.029) 19.619(0.060) 16.469(0.038)<br />
r = 1 (r = 2) 3.962(0.430) 3.962(0.430) 3.034(0.583) 3.034(0.583) 3.149(0.563) 3.149(0.563)<br />
nd = no monthly dummies considered; d = eleven monthly dummies were included; d6,d7,d8 = only dummies for June, July and<br />
August were considered; trace = Johansen trace test; λmax = Johansen λmax test; p-values are reported in parenthesis
Annex D – Unit root tests on the price spread<br />
Annexes<br />
Table D.1 – Unit root tests on the price spread, ADF statistics (1978:12-2003:12)<br />
Spread n° of lags ADF statistics<br />
n 2<br />
c 2<br />
c+s 2<br />
n= no constant; c= constant; s= seasonal dummies included; p-values are based on MacKinnon (1996) and<br />
reported in parenthesis<br />
Table D.2 – Unit root tests on the price spread, ADF statistics (1978:12-1993:06)<br />
-2.464<br />
(0.132)<br />
-2.495<br />
(0.117)<br />
-2.416<br />
(0.137)<br />
Spread n° of lags ADF statistics<br />
n 1<br />
c 1<br />
c+s 1<br />
n= no constant; c= constant; s= seasonal dummies included; p-values are based on MacKinnon (1996) and<br />
reported in parenthesis<br />
Table D.3 – Unit root tests on the price spread, ADF statistics (1993:07-2003:12)<br />
-1.615<br />
(0.100)<br />
-1.829<br />
(0.366)<br />
-1.654<br />
(0.455)<br />
Spread n° of lags ADF statistics<br />
n 2<br />
c 2<br />
c+s 2<br />
n= no constant; c= constant; s= seasonal dummies included; p-values are based on MacKinnon (1996) and<br />
reported in parenthesis<br />
-1.934<br />
(0.051)<br />
-3.658<br />
(0.005)<br />
-3.449<br />
(0.009)<br />
145
Annexes<br />
146<br />
Table D.4 – Unit root tests on the price spread, PP statistics (1978:12-2003:12)<br />
Spread n° of lags 5%critical values PP statistics<br />
n 2<br />
c 2<br />
n= no constant; c= constant<br />
-8.000<br />
-1.950<br />
-14.000<br />
-2.878<br />
Table D.5 – Unit root tests on the price spread, PP statistics (1978:12-1993:06)<br />
-11.519<br />
-2.455<br />
-11.704<br />
-2.482<br />
Spread n° of lags 5%critical values PP statistics<br />
n 1<br />
c 1<br />
n= no constant; c= constant<br />
-7.949<br />
-1.950<br />
-13.848<br />
-2.885<br />
Table D.6 – Unit root tests on the price spread, PP statistics (1993:07-2003:12)<br />
-4.671<br />
-1.403<br />
-5.916<br />
-1.625<br />
Spread n° of lags 5%critical values PP statistics<br />
n 2<br />
c 2<br />
n= no constant; c= constant<br />
-7.917<br />
-1.950<br />
-13.750<br />
-2.888<br />
Table D.7 – Unit root tests on the price spread, KPSS statistics (1978:12-2003:12)<br />
-3.280<br />
-1.388<br />
-9.194<br />
-2.143<br />
Spread n°of lags 5% critical value KPSS statistics<br />
c 24 0.463 0.455<br />
c= constant
Annexes<br />
Table D.8 – Unit root tests on the price spread, KPSS statistics (1978:12-1993:06)<br />
Spread n°of lags 5% critical value KPSS statistics<br />
c 24 0.463 0.346<br />
c= constant<br />
Table D.9 – Unit root tests on the price spread, KPSS statistics (1993:07-2003:12)<br />
Spread n°of lags 5% critical value KPSS statistics<br />
c 24 0.463 0.373<br />
c= constant<br />
147
Annexes<br />
148<br />
Annex E – Unit root tests on de-seasonalized time series<br />
Table E.1 – Unit root tests on de-seasonalized time series, ADF statistics -18 (1978:12-2003:12)<br />
Variable<br />
swfr<br />
n° of lags<br />
logs (diff. logs)<br />
n 12(11)<br />
c 12(11)<br />
c+t 12(11)<br />
hrw<br />
n 1(0)<br />
c 1(0)<br />
c+t 1(0)<br />
Logs Differentiated logs<br />
-0.179<br />
(0.622)<br />
-1.172<br />
(0.696)<br />
-2.552<br />
(0.302)<br />
0.182<br />
(0.739)<br />
-3.164<br />
(0.022)<br />
-3.241<br />
(0.076)<br />
-4.956<br />
(0)<br />
-4.929<br />
(0)<br />
-4.795<br />
(0)<br />
-12.729<br />
(0)<br />
-12.713<br />
(0)<br />
-12.699<br />
(0)<br />
n= no constant; c= constant; c+ t=constant and trend; p-values are based on MacKinnon (1996) and reported in<br />
parenthesis<br />
Table E.2 – Unit root tests on de-seasonalized time series, ADF statistics -18 (1978:12-1993:06)<br />
Variable<br />
swfr<br />
n° of lags<br />
logs (diff. logs)<br />
Logs Differentiated logs<br />
n 12(11)<br />
0.072<br />
(0.706)<br />
-3.486<br />
(0.0004)<br />
c 12(11)<br />
-2.118<br />
(0.238)<br />
-3.429<br />
(0.010)<br />
c+t<br />
hrw<br />
12(11)<br />
-2.554<br />
(0.32)<br />
-3.843<br />
(0.014)<br />
n 1(0)<br />
-0.018<br />
(0.677)<br />
-9.451<br />
(0)<br />
c 4(0)<br />
-2.390<br />
(0.145)<br />
-9.423<br />
(0)<br />
c+t 4(0)<br />
-3.132<br />
(0.238)<br />
-9.487<br />
(0)<br />
n= no constant; c= constant; c+ t=constant and trend; p-values are based on MacKinnon (1996) and reported in<br />
parenthesis
Annexes<br />
Table E.3 – Unit root tests on de-seasonalized time series, ADF statistics -18 (1993:07-2003:12)<br />
Variable<br />
swfr<br />
n° of lags<br />
logs (diff. logs)<br />
n 12(11)<br />
c 12(11)<br />
c+t 12(11)<br />
hrw<br />
n 2(1)<br />
c 1(1)<br />
c+t 1(1)<br />
Logs Differentiated logs<br />
-0.409<br />
(0.536)<br />
-1.925<br />
(0.321)<br />
-0.702<br />
(0.972)<br />
0.314<br />
(0.776)<br />
-3.138<br />
(0.024)<br />
-3.119<br />
(0.102)<br />
-3.502<br />
(0.0004)<br />
-3.410<br />
(0.011)<br />
-3.823<br />
(0.015)<br />
n= no constant; c= constant; c+ t=constant and trend; p-values are based on MacKinnon (1996) and reported in<br />
parenthesis<br />
Table E.4 – Unit root tests on de-seasonalized time series, PP statistics (1978:12-2003:12)<br />
Variable<br />
n° of lags<br />
logs (diff. logs)<br />
swfr 13(12)<br />
n<br />
c<br />
c+t<br />
hrw 2(1)<br />
n<br />
c<br />
c+t<br />
n= no constant; c= constant; c+ t=constant and trend<br />
-8.037<br />
(0)<br />
-8.019<br />
(0)<br />
-7.999<br />
(0)<br />
5%critical values Logs Differentiated logs<br />
-8.000<br />
-1.950<br />
-14.000<br />
-2.878<br />
-21.339<br />
-3.428<br />
-8.000<br />
-1.950<br />
-14.000<br />
-2.878<br />
-21.339<br />
-3.428<br />
0.001<br />
0.006<br />
-4.044<br />
-1.424<br />
-12.956<br />
-2.682<br />
0.050<br />
0.242<br />
-14.323<br />
-2.777<br />
-14.794<br />
-2.843<br />
-510.862<br />
-19.107<br />
-511.001<br />
-19.090<br />
-509.967<br />
.-19.060<br />
-212.827<br />
-12.757<br />
-212.971<br />
-12.742<br />
-213.103<br />
-12.727<br />
149
Annexes<br />
Table E.5 – Unit root tests on de-seasonalized time series, PP statistics (1978:12-1993:06)<br />
Variable<br />
n° of lags<br />
logs (diff. logs)<br />
swfr 2(1)<br />
n<br />
c<br />
c+t<br />
hrw 2(1)<br />
n<br />
c<br />
c+t<br />
n= no constant; c= constant; c+ t=constant and trend<br />
150<br />
5%critical values Logs Differentiated logs<br />
-7.949<br />
-1.950<br />
-13.848<br />
-2.885<br />
-20.996<br />
-3.440<br />
-7.949<br />
-1.950<br />
-13.848<br />
-2.885<br />
-20.996<br />
-3.440<br />
0.020<br />
0.637<br />
-7.048<br />
-2.541<br />
-6.521<br />
-2.416<br />
0.002<br />
0.012<br />
-5.694<br />
-1.737<br />
-8.240<br />
-2.357<br />
-238.904<br />
-19.058<br />
-239.236<br />
-19.049<br />
-242.493<br />
-19.498<br />
-116.846<br />
-9.414<br />
-116.862<br />
-9.386<br />
-118.347<br />
-9.454<br />
Table E.6 – Unit root tests on de-seasonalized time series, PP statistics (1993:07-2003:12)<br />
Variable<br />
n° of lags<br />
logs (diff. logs)<br />
swfr 3(2)<br />
n<br />
c<br />
c+t<br />
hrw 2(1)<br />
n<br />
c<br />
c+t<br />
n= no constant; c= constant; c+ t=constant and trend<br />
5%critical values Logs Differentiated logs<br />
-7.917<br />
-1.950<br />
-13.750<br />
-2.888<br />
-20.800<br />
-3.447<br />
-7.917<br />
-1.950<br />
-13.750<br />
-2.888<br />
-20.800<br />
-3.447<br />
0.006<br />
0.111<br />
-3.165<br />
-1.167<br />
2.095<br />
-0.529<br />
0.033<br />
0.235<br />
-12.482<br />
-2.546<br />
-12.782<br />
-2.546<br />
-69.704<br />
-6.928<br />
-69.703<br />
-6.900<br />
-74.979<br />
-7.253<br />
-91.308<br />
-8.314<br />
-91.386<br />
-8.285<br />
-91.389<br />
-8.252
Annexes<br />
Table E.7 – Unit root tests on de-seasonalized time series, KPSS statistics (1978:12-2003:12)<br />
Variable<br />
n°of lags<br />
logs (diff. logs)<br />
5% critical value Logs Differentiated logs<br />
swfr 24(23)<br />
c 0.463 1.007 0.335<br />
hrw 24(23)<br />
c 0.463 0.144 0.098<br />
c= constant<br />
Table E.8 – Unit root tests on de-seasonalized time series, KPSS statistics (1978:12-1993:06)<br />
Variable<br />
n°of lags<br />
logs (diff. logs)<br />
5% critical value Logs Differentiated logs<br />
swfr 24(23)<br />
c 0.463 0.138 0.289<br />
hrw 24(23)<br />
c 0.463 0.288 0.147<br />
c= constant<br />
Table E.9 – Unit root tests on de-seasonalized time series, KPSS statistics (1993:07-2003:12)<br />
Variable<br />
n°of lags<br />
logs (diff. logs)<br />
5% critical value Logs Differentiated logs<br />
swfr 24(23)<br />
c 0.463 0.454 0.335<br />
hrw 24(23)<br />
c 0.463 0.105 0.098<br />
c= constant<br />
151
The notion of “price transmission” refers to the co-movement shown by prices of the same<br />
good in different locations. In this respect, many empirical works essentially aim at verifying<br />
whether the Law of One Price holds. Cointegration models especially have shown to have<br />
an “intuitive appeal”, as they allow disentangling short and long run dynamics. However,<br />
despite the use of increasingly sophisticated techniques, empirical findings are extremely<br />
mixed. Indeed, a number of factors are expected to prevent prices from convergence.<br />
This work focuses on how international price transmission is affected by domestic and<br />
border policies. The case study is constituted by price transmission between EU and US<br />
soft wheat markets in the years 1978-2003.<br />
The objective of this analysis is twofold. On the one side, to develop a consistent<br />
theoretical framework to understand under which conditions co-movement between EU<br />
and US prices is expected, after considering the presence of domestic and border policies:<br />
namely, the European Common Agricultural Policy and the implementation of the Uruguay<br />
Round Agreement on Agriculture of the WTO. On the other, to derive different econometric<br />
models in order to test whether such a co-movement exists, and to which extent it has<br />
been affected by policy reforms.<br />
The work is organized as follows. After a general introduction to the study of price<br />
transmission and to empirical tests for spatial price analysis (chapters 2 and 3),<br />
international soft wheat markets are described (chapter 4). This allows to develop a<br />
consistent theoretical framework for the analysis, according to which different empirical<br />
models are developed and tested (chapters 5 and 6). They represent an original attempt of<br />
explicitly combining policy and price data. Findings contribute to shed light on a complex<br />
and controversial empirical evidence and, in addition, to provide analytical tools which are<br />
of a more general interest for the study of international price dynamics.<br />
Giulia Listorti è dottore di ricerca in Economia Politica presso il Dipartimento di Economia<br />
dell’Università Politecnica delle Marche.