Sample classification using the GA/KNN algorithm with varying ...
Sample classification using the GA/KNN algorithm with varying ...
Sample classification using the GA/KNN algorithm with varying ...

You also want an ePaper? Increase the reach of your titles
YUMPU automatically turns print PDFs into web optimized ePapers that Google loves.
<strong>Sample</strong> <strong>classification</strong> <strong>using</strong> <strong>the</strong> <strong>GA</strong>/<strong>KNN</strong> <strong>algorithm</strong> <strong>with</strong> <strong>varying</strong> values<br />
of <strong>the</strong> p parameter<br />
By<br />
E. Prabhu Raman<br />
George Mason University<br />
Abstract : The <strong>GA</strong>/<strong>KNN</strong> method developed by Leping Li 1 has been tested and is<br />
proved to classify ALL/AML samples efficiently. This study explores <strong>the</strong> results obtained<br />
after modifying <strong>the</strong> <strong>KNN</strong> method used in <strong>the</strong> <strong>GA</strong>/<strong>KNN</strong> method by <strong>varying</strong> <strong>the</strong><br />
minkowski’s p-parameter. The <strong>GA</strong>/<strong>KNN</strong> method did not efficiently classify <strong>the</strong> test<br />
samples in <strong>the</strong> runs performed. Out of 34 test samples, around 12 - 14 samples were<br />
misclassified in each run. It was observed that an odd numbered p parameter (3,5,7) gave<br />
<strong>the</strong> same <strong>classification</strong> result, it classified all of <strong>the</strong> samples as ALL. It were only <strong>the</strong><br />
even numbered parameters(2,4,6) which could classify some of <strong>the</strong> AML samples<br />
correctly in <strong>the</strong> test data.<br />
Introduction : With <strong>the</strong> invention of microarray technology, it is possible to measure<br />
<strong>the</strong> expression of thousands of genes at a time. A microarray image gives a snapshot of<br />
<strong>the</strong> activity of each gene of a cell at <strong>the</strong> time of mRNA extraction.<br />
Hence, we can develop expression signatures for cells by which we can identify an<br />
unknown type of cell. This approach is thus applied to identify tumor samples. Firstly,<br />
<strong>using</strong> a training set, a signature is constructed. Then, <strong>using</strong> that signature samples are<br />
classified into different classes.<br />
This study deals <strong>with</strong> leukemia data (Golub et al, 1999 3 ). There are 72 samples<br />
comprising of classes Acute lymphoblastic leukemia(ALL) and Acute myeloid<br />
leukemia(AML). Subclasses exist <strong>with</strong>in <strong>the</strong>se two classes.<br />
The <strong>GA</strong>/<strong>KNN</strong> <strong>algorithm</strong> employs constructing subsets(<strong>the</strong> user specifies <strong>the</strong> size) of<br />
genes. The Genetic Algorithm is used to choose relatively few discriminative subsets of<br />
genes 1 . The <strong>KNN</strong> is used to decide whe<strong>the</strong>r a subset is discriminative or not. For a<br />
detailed description, please refer to Li et al. 1<br />
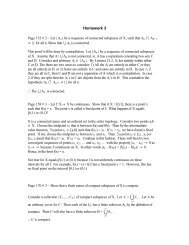
The p parameter comes in <strong>the</strong> distance formula which comes in <strong>the</strong> <strong>KNN</strong> calculation. The<br />
distance is calculated between n dimensional data points(samples), n being equal to <strong>the</strong><br />
number of genes. If S1,S2,….Sm are <strong>the</strong> m samples. And g1k,g2k,….gnk are <strong>the</strong> n<br />
expression values of <strong>the</strong> n genes of sample Sk. Then <strong>using</strong> a p parameter of value 2, we<br />
would calculate distance between any two samples Sj and Sk as :<br />
D = [ (g1k – g1j) 2 +…….+(gnk – gnj) 2 ] 1/2
Similarly if <strong>the</strong> p parameter equals 5, <strong>the</strong>n <strong>the</strong> formula will be as follows:<br />
Methods :<br />
D = [ (g1k – g1j) 5 +…….+(gnk – gnj) 5 ] 1/5<br />
Data: Golub data was obtained from BINF 733 website .The data was filtered and<br />
transformed to log scale as shown below (taken from Li et al. 1 ).<br />
The filtering was done by excluding genes whose expression levels were below 50 in<br />
more than 57 out of <strong>the</strong> 72 samples. 5455 genes were left after <strong>the</strong> filtering which were<br />
transformed to <strong>the</strong> log scale. The data set was tailored to act as an input for <strong>the</strong> <strong>GA</strong>/<strong>KNN</strong><br />
<strong>algorithm</strong>.<br />
Usage of <strong>GA</strong>/<strong>KNN</strong> <strong>algorithm</strong>:<br />
The <strong>GA</strong>/<strong>KNN</strong> source code was kindly provided by Dr. Leping Li .First, it was run on <strong>the</strong><br />
dataset <strong>with</strong>out any modification. In that case <strong>the</strong> p parameter was equal to 2. Then <strong>the</strong><br />
code was modified by changing <strong>the</strong> distance calculation used while calculating <strong>the</strong> Knearest<br />
neighbors. Then <strong>the</strong> modified source code was run for p parameter values 3, 4 ,5,<br />
6 and 7. Higher p values increased <strong>the</strong> run time of <strong>the</strong> program and <strong>the</strong> program did not<br />
successfully execute because of limited computing resources.<br />
The program was run several times on unix server(mason.gmu.edu) to find out <strong>the</strong><br />
optimal parameters, taking into account <strong>the</strong> run time. The following parameters were<br />
found best suited for <strong>the</strong> golub data set:<br />
Chromosome length : 10 (higher values did not change <strong>the</strong> output)<br />
Number of near optimal solutions : 5000(higher values did not change <strong>the</strong> output)<br />
Termination fitness cutoff : 36<br />
K( in <strong>KNN</strong>) 3<br />
Number of training samples 38<br />
Number of test samples 34<br />
For a Detailed description of each of <strong>the</strong>se parameters please refer to Li et al 1 .<br />
The results from <strong>the</strong> <strong>algorithm</strong> were analyzed and <strong>the</strong> number of wrong <strong>classification</strong>s<br />
were counted for each run(for each value of p parameter). Each run of <strong>the</strong> program<br />
yielded a Gene ranking. 50 Top ranked genes were taken in each case and <strong>the</strong> dataset was<br />
cut short from 5455 genes across 72 samples to 50 genes across 72 samples. This data<br />
was now plotted in its first two principal components <strong>using</strong> MATLAB.
Results :<br />
The <strong>GA</strong>/<strong>KNN</strong> did not work perfectly well in this study for <strong>the</strong> golub data. 12 – 14<br />
samples out of 34 were misclassified in each run.<br />
p ALL mis<strong>classification</strong>s AML mis<strong>classification</strong>s Total mis<strong>classification</strong>s<br />
2 6 7 13 out of 34<br />
3 0 14 14 out of 34<br />
4 5 7 12 out of 34<br />
5 0 14 14 out of 34<br />
6 7 7 14 out of 34<br />
7 0 14 14 out of 34<br />
For <strong>the</strong> p parameter value 3, 5, 7 <strong>the</strong> results are alike. Similarly we can see similarity<br />
between <strong>the</strong> results <strong>with</strong> even numbered p parameter. The striking feature is that that odd<br />
numbered p values fail to classify AML samples totally. The p parameter 4 seems to be<br />
<strong>the</strong> best choice for <strong>the</strong> dataset as it classifies 22 samples out of 34 correctly. There is not<br />
much difference between <strong>the</strong> outputs of even numbered p-values. Please Refer to <strong>the</strong> next<br />
page for explanations of <strong>the</strong> PCA graphs shown below.<br />
p = 2
p = 3<br />
p = 4
p = 5<br />
p = 6
p = 7<br />
The PCA of even numbered p parameter (except p = 6) runs seem to distinguish ALL and<br />
AML better. ALL is concentrated towards one end and <strong>the</strong> AML samples towards<br />
ano<strong>the</strong>r. But in <strong>the</strong> odd numbered p value runs, The ALL samples are at <strong>the</strong> centre and<br />
are not so well separated and hence do not distinguish so well. The ALLs are closer to<br />
AML samples than in <strong>the</strong> even numbered p value runs. This is in agreement to <strong>the</strong><br />
number of mis<strong>classification</strong>s counted for odd numbered p value runs.<br />
Conclusions<br />
The <strong>GA</strong>/<strong>KNN</strong> <strong>algorithm</strong> did not work really well for this study. It misclassified 12 -14<br />
samples out of 34 test samples. It was observed that <strong>the</strong> output of <strong>the</strong> <strong>GA</strong>/<strong>KNN</strong> <strong>algorithm</strong><br />
changes <strong>with</strong> changing <strong>the</strong> p parameter. The even numbered p parameters seem to<br />
perform better than <strong>the</strong> odd numbered values. The odd ones fail to classify any AML<br />
samples, <strong>the</strong> reason for which remains unexplored.<br />
References<br />
1. Computational Analysis of Leukemia Microarray Expression Data <strong>using</strong> <strong>the</strong><br />
<strong>GA</strong>/<strong>KNN</strong> Method by Leping Li, Lee G. Pedersen, Thomas A. Darden, and<br />
Clarice R. Weinberg<br />
The PCA graphs:<br />
For each value of p, <strong>the</strong> algo<br />
was run and PCA was done<br />
<strong>using</strong> <strong>the</strong> top 50 genes<br />
obtained.<br />
Green circles- B-cell ALL<br />
Green squares-T-cell ALL<br />
Red circles – M1 type AML<br />
Red square – M2 type AML<br />
Red diamond- M4 type<br />
AML<br />
Red Stars – M5 type AML
2. A tutorial on Principal Component Analysis by Lindsay I Smith. Feb 26,2002.<br />
3 .Molecular Classification ofCancer: Class Discovery andClass Prediction by Gene<br />
Expression Monitoring by Golub et al. 1999
This document was created <strong>with</strong> Win2PDF available at http://www.daneprairie.com.<br />
The unregistered version of Win2PDF is for evaluation or non-commercial use only.