Development and Characterization of a Genetic Linkage Map of ...
Development and Characterization of a Genetic Linkage Map of ...
Development and Characterization of a Genetic Linkage Map of ...

You also want an ePaper? Increase the reach of your titles
YUMPU automatically turns print PDFs into web optimized ePapers that Google loves.
Fungal <strong>Genetic</strong>s <strong>and</strong> Biology 31, 189–203 (2000)<br />
doi:10.1006/fgbi.2000.1240, available online at http://www.idealibrary.com on<br />
<strong>Development</strong> <strong>and</strong> <strong>Characterization</strong> <strong>of</strong> a <strong>Genetic</strong><br />
<strong>Linkage</strong> <strong>Map</strong> <strong>of</strong> Cryptococcus ne<strong>of</strong>ormans var.<br />
ne<strong>of</strong>ormans Using Amplified Fragment Length<br />
Polymorphisms <strong>and</strong> Other Markers<br />
Anja Forche,* , † ,1 Jianping Xu,* , † Rytas Vilgalys,* <strong>and</strong> Thomas G. Mitchell†<br />
*Department <strong>of</strong> Biology, Duke University, Durham, North Carolina 27708; <strong>and</strong> †Department <strong>of</strong> Microbiology,<br />
Duke University Medical Center, Durham, North Carolina 27710<br />
Accepted for publication November 29, 2000<br />
Forche, A., Xu, J., Vilgalys, R., <strong>and</strong> Mitchell, T. G.<br />
2000. <strong>Development</strong> <strong>and</strong> <strong>Characterization</strong> <strong>of</strong> a <strong>Genetic</strong><br />
<strong>Linkage</strong> <strong>Map</strong> <strong>of</strong> Cryptococcus ne<strong>of</strong>ormans var. ne<strong>of</strong>ormans<br />
Using Amplified Fragment Length Polymorphisms<br />
<strong>and</strong> Other Markers. Fungal <strong>Genetic</strong>s <strong>and</strong> Biology<br />
31, 189–203. A segregating population <strong>of</strong> single<br />
basidiospore isolates from a sexual cross was used to<br />
generate the first moderately dense genetic linkage<br />
map <strong>of</strong> Cryptococcus ne<strong>of</strong>ormans var. ne<strong>of</strong>ormans<br />
(Serotype D). Polymorphic DNA markers were developed<br />
using amplified fragment length polymorphisms,<br />
r<strong>and</strong>om amplified polymorphic DNA, <strong>and</strong> gene-encoding<br />
sequences. These markers were used to analyze<br />
100 meiotic progeny. All markers were tested for distorted<br />
segregation with a goodness <strong>of</strong> fit test. Of the<br />
total <strong>of</strong> 181 markers, 148 showed balanced (1:1) segregation<br />
ratios. Segregation distortion was observed<br />
for 33 markers. Based on all the markers, a linkage<br />
map was generated that consists <strong>of</strong> 14 major linkage<br />
groups with 127 markers, several small linkage<br />
groups, <strong>and</strong> 2 linkage groups that consist only <strong>of</strong><br />
highly skewed markers. The genetic distance <strong>of</strong> the<br />
linkage map is 1356.3 cM. The estimated total haploid<br />
genome size for C. ne<strong>of</strong>ormans var. ne<strong>of</strong>ormans was<br />
calculated using Hulberts method <strong>and</strong> yielded a map<br />
1 To whom correspondence should be addressed at current address:<br />
Department <strong>of</strong> <strong>Genetic</strong>s, Cell Biology <strong>and</strong> <strong>Development</strong>, University <strong>of</strong><br />
Minnesota, St. Paul, MN 55108. Fax: (612)-625-5754. E-mail:<br />
forche@mail.ahc.umn.edu.<br />
1087-1845/00 $35.00<br />
Copyright © 2000 by Academic Press<br />
All rights <strong>of</strong> reproduction in any form reserved. 189<br />
size <strong>of</strong> 1917 cM. The number <strong>of</strong> major linkage groups<br />
correlates well with the proposed number <strong>of</strong> 13 chromosomes<br />
for C. ne<strong>of</strong>ormans var. ne<strong>of</strong>ormans. Several<br />
genes, including CAP64, CnLAC, <strong>and</strong> the mating-type<br />
locus, were mapped, <strong>and</strong> their associations were consistent<br />
with published data. To date, 6 linkage groups<br />
have been assigned to their corresponding chromosomes.<br />
This linkage map should provide a framework<br />
for the ongoing genome sequencing project <strong>and</strong> will be<br />
a useful tool for studying the genetics <strong>and</strong> pathogenicity<br />
<strong>of</strong> this important medical yeast. © 2000 Academic Press<br />
Index Descriptors: Cryptococcus ne<strong>of</strong>ormans; genetic<br />
linkage map; amplified fragment length polymorphism<br />
(AFLP); karyotyping.<br />
Cryptococcus ne<strong>of</strong>ormans is a haploid basidiomycetous<br />
yeast. A major phenotypic feature <strong>of</strong> C. ne<strong>of</strong>ormans is its<br />
thick enveloping polysaccharide capsule. Antigenic differences<br />
among the capsules <strong>of</strong> strains were used to identify<br />
five serotypes—A, D, AD, B, <strong>and</strong> C. Three varieties <strong>of</strong> C.<br />
ne<strong>of</strong>ormans have been recognized. C. ne<strong>of</strong>ormans var.<br />
gattii is represented by capsular serotypes B <strong>and</strong> C <strong>and</strong><br />
appears to be geographically limited to tropical regions.<br />
Serotypes A, D, <strong>and</strong> AD are found globally <strong>and</strong> are associated<br />
with two closely related varieties, C. ne<strong>of</strong>ormans<br />
var. ne<strong>of</strong>ormans (serotype D) <strong>and</strong> C. ne<strong>of</strong>ormans var.<br />
grubii (serotype A) (Xu et al., 2000; Casadevall <strong>and</strong> Perfect,<br />
1999; Franzot et al., 1999). The mode <strong>of</strong> reproduc-
190 Forche et al.<br />
tion <strong>of</strong> all serotypes <strong>and</strong> varieties is primarily asexual, but<br />
in the laboratory, compatible strains <strong>of</strong> opposite mating<br />
types can be induced to engage in sexual reproduction<br />
(Kwon-Chung, 1976). Mating compatibility is governed by<br />
one locus with two alleles, denoting mating type a or .<br />
Under laboratory conditions, sexual crosses can be obtained<br />
between strains <strong>of</strong> the opposite mating type <strong>and</strong><br />
between the same or different serotype.<br />
In the past decade, C. ne<strong>of</strong>ormans has emerged as a<br />
human pathogen <strong>of</strong> life-threatening consequences, especially<br />
in immunocompromised patients. Indeed, cryptococcal meningoencephalitis<br />
is the leading mycological cause <strong>of</strong> death<br />
among patients with AIDS. Several properties <strong>of</strong> C. ne<strong>of</strong>ormans<br />
have been associated with its virulence, including the<br />
capsule, production <strong>of</strong> melanin, <strong>and</strong> the mating type (Casadevall<br />
<strong>and</strong> Perfect, 1999; Kwon-Chung <strong>and</strong> Rhodes, 1986).<br />
Cryptococcosis can be treated with native or liposomal amphotericin<br />
B, but AIDS patients with cryptococcal meningitis<br />
require life-long maintenance therapy with fluconazole.<br />
Since relapses are common <strong>and</strong> drug-resistant strains have<br />
been reported (Casadevall <strong>and</strong> Perfect, 1999), better antifungal<br />
drugs are being sought.<br />
A genetic linkage map <strong>of</strong> C. ne<strong>of</strong>ormans will foster<br />
underst<strong>and</strong>ing <strong>of</strong> the genetic organization <strong>of</strong> this important<br />
pathogen, enable important genes to be mapped, <strong>and</strong><br />
support the genome project to sequence C. ne<strong>of</strong>ormans.<br />
The search for better underst<strong>and</strong>ing <strong>of</strong> phenotypically<br />
important traits, including drug resistance, would also benefit<br />
from a genetic linkage map <strong>of</strong> C. ne<strong>of</strong>ormans. Because <strong>of</strong><br />
its in vitro mating characteristics, the current genome effort,<br />
<strong>and</strong> its clinical importance, C. ne<strong>of</strong>ormans is an ideal pathogenic<br />
fungus for a genetic linkage map. The initial efforts to<br />
study the genetic organization <strong>of</strong> a genome entail the development<br />
<strong>of</strong> physical <strong>and</strong> genetic linkage maps.<br />
Little is known about the genome <strong>and</strong> the genome<br />
organization <strong>of</strong> C. ne<strong>of</strong>ormans. Several karyotyping studies<br />
have been used to develop rudimentary physical maps <strong>of</strong><br />
C. ne<strong>of</strong>ormans (Perfect et al., 1989; Polacheck <strong>and</strong> Lebens,<br />
1989; Spitzer <strong>and</strong> Spitzer, 1997; Wickes et al., 1994).<br />
Chromosome (CH)-specific probes have been developed<br />
for C. ne<strong>of</strong>ormans (Spitzer <strong>and</strong> Spitzer, 1997; Wickes et<br />
al., 1994). Wickes et al. (1994) located 10 genes on chromosomes<br />
that were separated by pulsed-field gel electrophoresis<br />
(PFGE) <strong>and</strong> transferred to a nylon membrane;<br />
representatives <strong>of</strong> four serotypes (A, B, C, <strong>and</strong> D) were<br />
evaluated, <strong>and</strong> linked genes were identified on seven chromosomes<br />
(Wickes et al., 1994). Electrophoretic karyotyping<br />
has also been used to identify strains in epidemiological<br />
studies <strong>of</strong> C. ne<strong>of</strong>ormans (Boekhout <strong>and</strong> van Belkum,<br />
1997; Boekhout et al., 1997; Thompson et al., 1999). For<br />
clinical <strong>and</strong> environmental strains <strong>of</strong> the four major sero-<br />
Copyright © 2000 by Academic Press<br />
All rights <strong>of</strong> reproduction in any form reserved.<br />
types, karyotyping <strong>of</strong>fered a high level <strong>of</strong> resolution <strong>and</strong><br />
discrimination for epidemiological studies. Spitzer <strong>and</strong><br />
Spitzer (1997) hybridized partial sequences <strong>of</strong> r<strong>and</strong>omly<br />
chosen cDNA clones to blots <strong>of</strong> electrophoretic karyotypes<br />
produced by PAGE. They identified at least seven chromosomes<br />
<strong>of</strong> C. ne<strong>of</strong>ormans strain B3501. These physical<br />
maps should complement the genetic linkage map. Another<br />
group performed a recombinational mapping analysis<br />
<strong>of</strong> capsular mutants (Still <strong>and</strong> Jacobson, 1983); pairs <strong>of</strong><br />
capsule-negative mutants were crossed, <strong>and</strong> r<strong>and</strong>om spore<br />
analysis determined the proportion <strong>of</strong> wild-type recombinants.<br />
In this investigation, all seven capsule-negative mutants<br />
were linked within a distance <strong>of</strong> 35 map units.<br />
For this emerging pathogen, a combined physical <strong>and</strong><br />
genetic linkage map has not been developed. The goals <strong>of</strong><br />
this study were to (i) develop genetic markers, (ii) produce<br />
a linkage map based on these markers, (iii) increase underst<strong>and</strong>ing<br />
<strong>of</strong> the genetics <strong>and</strong> basic biology <strong>of</strong> C. ne<strong>of</strong>ormans,<br />
(iv) examine meiotic behavior, which has not<br />
been extensively studied, <strong>and</strong> (v) provide a framework for<br />
future genetic analyses <strong>and</strong> genomics <strong>of</strong> C. ne<strong>of</strong>ormans. To<br />
generate a genetic linkage map <strong>of</strong> C. ne<strong>of</strong>ormans var.<br />
ne<strong>of</strong>ormans, we used amplified fragment length polymorphisms<br />
(AFLP), r<strong>and</strong>om amplified polymorphic DNAs<br />
(RAPDs), <strong>and</strong> gene-encoding regions. Using selected<br />
markers for hybridization studies, linkage groups were<br />
physically located on the appropriate chromosome. In<br />
addition to abetting the C. ne<strong>of</strong>ormans genome sequencing<br />
project, this genetic linkage map should provide a powerful<br />
tool for researchers to investigate the genetics <strong>and</strong> molecular<br />
pathogenesis <strong>of</strong> C. ne<strong>of</strong>ormans. To generate basidiospores,<br />
we mated two strains that were originally derived from a<br />
cross between a clinical isolate, NIH412, <strong>and</strong> an environmental<br />
strain, NIH433 (Heitman et al., 1999). The original<br />
MAT parent (NIH412) was self-fertile, but neither F 1 progeny<br />
(B-3501 <strong>and</strong> B-3502) posed this problem. The electrophoretic<br />
karyotypes <strong>of</strong> these mating strains are quite dissimilar,<br />
which suggests the likelihood <strong>of</strong> significant genetic polymorphism<br />
between them <strong>and</strong> therefore that they are good<br />
strains to select for the construction <strong>of</strong> a genetic map (Heitman<br />
et al., 1999).<br />
MATERIALS AND METHODS<br />
Mating Experiment<br />
Two strains <strong>of</strong> C. ne<strong>of</strong>ormans serotype D, B3502 (mating<br />
type a or MATa) <strong>and</strong> B3501 (MAT), were crossed on<br />
V8 juice agar (Xu et al., 2000), <strong>and</strong> 280 r<strong>and</strong>om basidios-
<strong>Genetic</strong> <strong>Linkage</strong> <strong>Map</strong> <strong>of</strong> C. ne<strong>of</strong>ormans var. ne<strong>of</strong>ormans<br />
TABLE 1<br />
Adapter <strong>and</strong> Primer Sequences for the MseI <strong>and</strong> EcoRI Restriction Sites<br />
pores were selected <strong>and</strong> used for genetic analyses. To<br />
determine the mating type, each progeny was mated with<br />
both parents <strong>and</strong> to the congenic tester strains, JEC20<br />
(MATa) <strong>and</strong> JEC21 (MAT). In this paper we refer to<br />
B3502 as parent A <strong>and</strong> to B3501 as parent B.<br />
DNA Extraction<br />
DNA was extracted according to an established procedure<br />
(Xu et al., 2000).<br />
<strong>Development</strong> <strong>of</strong> AFLP Markers<br />
Digestion <strong>of</strong> genomic DNA with restriction endonucleases<br />
(REs). To initially evaluate the REs planned<br />
for the AFLP protocol (Vos et al., 1995), genomic DNA <strong>of</strong><br />
C. ne<strong>of</strong>ormans was digested with two REs, EcoRI <strong>and</strong><br />
MseI. One hundred fifty nanograms <strong>of</strong> genomic DNA was<br />
mixed in a final volume <strong>of</strong> 40 l containing 100 mM<br />
Tris/acetic acid (pH 7.5), 100 mM magnesium acetate, 500<br />
mM potassium acetate, 50 mM dithiothreitol (DTT), 0.5<br />
mg/ml bovine serum albumin (BSA), <strong>and</strong> 5 units each <strong>of</strong><br />
EcoRI <strong>and</strong> MseI <strong>and</strong> incubated at 37°C for 2.5 h. As a<br />
control for complete digestion by the REs, 50 ng <strong>of</strong><br />
lambda DNA was subjected to treatment with 10 l <strong>of</strong><br />
Restriction site Primer Sequence<br />
Adapter MseI 5-GACGATGAGTCCTGAG-3<br />
Universal primer 3-TACTCAGGACTCAT-5<br />
Preamplification M 5-GATGAGTCCTGAGTAAA-3<br />
Ma 5-GATGAGTCCTGAGTAAAA-3<br />
Mc 5-GATGAGTCCTGAGTAAAC-3<br />
Mg 5-GATGAGTCCTGAGTAAAG-3<br />
Mt 5-GATGAGTCCTGAGTAAAT-3<br />
Selective amplification Mac 5-GATGAGTCCTGAGTAAAAC-3<br />
Mga 5-GATGAGTCCTGAGTAAAGA-3<br />
Mgt 5-GATGAGTCCTGAGTAAAGT-3<br />
Mtg 5-GATGAGTCCTGAGTAAATG-3<br />
Mtgc 5-GATGAGTCCTGAGTAAATGC-3<br />
Adapter EcoRI 5-CTCGTAGACTGCGTACC-3<br />
3-CATCTGACGCATGGTTAA-5<br />
Universal primer E 5-GACTGCGTACCAATTCA-3<br />
Preamplification Ec 5-GACTGCGTACCAATTCAC-3<br />
Eg 5-GACTGCGTACCAATTCAG-3<br />
Et 5-GACTGCGTACCAATTCAT-3<br />
Selective amplification Eca 5-GACTGCGTACCAATTCACA-3<br />
Egt 5-GACTGCGTACCAATTCAGT-3<br />
Egtc 5-GACTGCGTACCAATTCAGTC-3<br />
Etg 5-GACTGCGTACCAATTCATG-3<br />
Note. Abbreviations <strong>of</strong> the primers are given. Nucleotide extensions for preamplification <strong>and</strong> selective amplification are indicated in boldface. EcoRI<br />
primers for selective amplification were labeled with fluorescent dye 6FAM (Egt, Egtc, Etg) or 9TET (Eca).<br />
191<br />
each RE. After digestion, DNA was examined by electrophoresis<br />
in 1.5% agarose. Complete digestion <strong>of</strong> the<br />
lambda DNA, as well as a lack <strong>of</strong> high-molecular-weight<br />
genomic DNA <strong>of</strong> C. ne<strong>of</strong>ormans, indicated that this treatment<br />
likely resulted in complete digestion.<br />
Ligation <strong>of</strong> the EcoRI <strong>and</strong> MseI adapters to the<br />
restriction fragments. To each 40-l RE digestion<br />
tube, 10 l AFLP ligation cocktail, consisting <strong>of</strong> 100 mM<br />
Tris/acetic acid (pH 7.5), 100 mM magnesium acetate, 500<br />
mM potassium acetate, 50 mM DTT, 0.5 mg/ml BSA, 100<br />
mM ATP, 1 Weiss unit T4 ligase, 5 M double-str<strong>and</strong>ed<br />
EcoRI adapters, <strong>and</strong> 50 M MseI adapters, was added.<br />
Reactions were incubated at room temperature (22°C) for<br />
3 h. Each reaction was then diluted with 5–10 volumes <strong>of</strong><br />
distilled water depending on the initial concentration <strong>of</strong><br />
genomic DNA. The EcoRI <strong>and</strong> MseI adapters are listed in<br />
Table 1.<br />
Preamplification <strong>of</strong> the AFLP markers. PCRs were<br />
performed in a total volume <strong>of</strong> 25 l with 10 mM Tris/HCl<br />
(pH 8.0), 50 mM KCl, 1.5 mM MgCl 2, 100 mM each<br />
dATP, dCTP, dGTP, <strong>and</strong> dTTP (Amersham Pharmacia<br />
Biotech, New Jersey, USA), 10 M each primer (see<br />
Table 1 for primer sequences), 1.25 units Taq polymerase,<br />
<strong>and</strong> 5 l <strong>of</strong> the diluted ligation product. PCR conditions<br />
comprised 20 cycles with a denaturation step for 30 s at<br />
Copyright © 2000 by Academic Press<br />
All rights <strong>of</strong> reproduction in any form reserved.
192 Forche et al.<br />
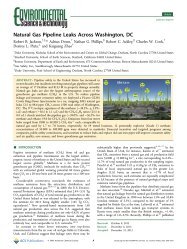
FIG. 1. Example <strong>of</strong> a scoring pattern for a backcross to parent A<br />
(B3501). The example shows two markers: one is absent in parent A <strong>and</strong><br />
the other is present in parent A. The progeny strain shares marker 1 with<br />
parent A (scored as A) <strong>and</strong> is heterozygous for marker 2 (scored as H).<br />
94°C, an annealing step for 1 min at 56°C, <strong>and</strong> an extension<br />
step <strong>of</strong> 1 min at 72°C. Preamplification PCR products<br />
were diluted 10-fold prior to selective amplification.<br />
Selective amplification <strong>of</strong> the AFLP markers.<br />
PCRs were performed as above, except that the EcoRI<br />
primers were labeled with a fluorescent dye to detect<br />
AFLPs with the ABI 377 sequencer (Perkin–Elmer, Foster<br />
City, CA) <strong>and</strong> 5 l diluted PCR preamplification products<br />
served as DNA templates. For selective amplification,<br />
two <strong>and</strong> three nucleotides were added to the 3 end <strong>of</strong> the<br />
primers (see Table 1). PCRs were performed over 13<br />
cycles with a denaturation step for 30 s at 94°C, an annealing<br />
step for 30 s at 65°C with a temperature decrease<br />
<strong>of</strong> 0.7°C per cycle, <strong>and</strong> an extension step <strong>of</strong> 1 min at 72°C,<br />
followed by 20 cycles with a denaturation step for 30 s at<br />
94°C, an annealing step for 30 s at 56°C, <strong>and</strong> an extension<br />
step for 1 min at 72°C.<br />
Analysis <strong>of</strong> AFLP patterns. A5-l sample <strong>of</strong> each<br />
PCR product was electrophoresed in 1.5% agarose to<br />
confirm successful amplification <strong>and</strong> roughly quantify the<br />
PCR product by comparison with a 100-bp DNA molecular<br />
weight marker. AFLP samples were run on an ABI<br />
377 sequencer (Perkin–Elmer, Norwalk, CO) for 4.5 h,<br />
<strong>and</strong> samples were analyzed using Genescan s<strong>of</strong>tware, version<br />
3.0 (Perkin–Elmer). The AFLP patterns <strong>of</strong> each<br />
strain were compared with the two parental strains, <strong>and</strong> all<br />
polymorphic markers, which were present in one parent<br />
<strong>and</strong> absent in the other, were scored. The 100 progeny<br />
strains were then scored for these polymorphic markers.<br />
The results were expressed as a binary data set, coded, <strong>and</strong><br />
analyzed as a back cross to parent A (Fig. 1). Segregation<br />
values were calculated for each marker, <strong>and</strong> a simple<br />
goodness <strong>of</strong> fit test ( 2 test) was applied to test for significance<br />
<strong>of</strong> segregation (i.e., any skewing from the expected<br />
Mendelian segregation ratio <strong>of</strong> 50:50).<br />
<strong>Development</strong> <strong>and</strong> Analysis <strong>of</strong><br />
RAPD Markers<br />
To develop RAPD markers (Williams et al., 1990), initially<br />
67 pairwise combinations <strong>of</strong> arbitrary 10-mer oligo-<br />
Copyright © 2000 by Academic Press<br />
All rights <strong>of</strong> reproduction in any form reserved.<br />
nucleotides (Operon Technologies Inc., Alameda, CA;<br />
Kits A <strong>and</strong> B) <strong>and</strong> 10 single 10-mer oligonucleotides<br />
(Operon Technologies Inc.; Kits A <strong>and</strong> B) were tested for<br />
polymorphisms between the parental strains, B3501 <strong>and</strong><br />
B3502. Briefly, PCRs were carried out in a total volume <strong>of</strong><br />
25 l with 10 mM Tris/HCl (pH 8.0), 50 mM KCl, 1.5 mM<br />
MgCl 2, 100 mM each dATP, dCTP, dGTP, <strong>and</strong> dTTP<br />
(Pharmacia), 4.5 mM magnesium acetate, 1.25 units taq<br />
polymerase, 10 ng genomic DNA, <strong>and</strong> a final primer<br />
concentration <strong>of</strong> 0.6 M each. PCR conditions comprised<br />
45 cycles with a denaturation step for 1 min at 95°C, an<br />
annealing step for 1 min at 36°C, <strong>and</strong> an extension step <strong>of</strong><br />
2 min at 72°C. PCR products were electrophoresed on a<br />
1.5% agarose gel with ethidum bromide in 1 TAE for 5 h<br />
at 4.3 V/cm. Primer combinations that revealed unambigously<br />
scorable polymorphisms between the parental<br />
strains were tested for all 100 progeny. The sequences <strong>of</strong><br />
these primers are listed in Table 2. The scoring <strong>of</strong> the<br />
RAPD markers was similar to that <strong>of</strong> the AFLP markers<br />
(see above).<br />
<strong>Development</strong> <strong>and</strong> Analysis <strong>of</strong> Gene-<br />
Encoding DNA Markers<br />
Fifteen different gene-encoding DNA sequences were<br />
tested for polymorphisms between the two parental<br />
strains, B3501 <strong>and</strong> B3502 (see Table 3). For 11 <strong>of</strong> the<br />
genes, sequences were obtained from GenBank, primer<br />
pairs were designed, <strong>and</strong> PCR conditions were optimized<br />
to amplify a single PCR fragment representing the correspondent<br />
DNA coding region. Primers that revealed polymorphisms<br />
between the parental strains <strong>and</strong> primer sequences<br />
are given in Table 2. PCRs were performed in a<br />
total volume <strong>of</strong> 25 l with 10 mM Tris/HCl (pH 8.0), 50<br />
mM KCl, 1.5 mM MgCl 2, 1.25 mM each dATP, dCTP,<br />
dGTP, <strong>and</strong> dTTP, 10 M each primer, 1.25 units taq, <strong>and</strong><br />
10–50 ng <strong>of</strong> genomic DNA. PCR amplifications were<br />
carried out over 35 cycles with an initial denaturation step<br />
at 94°C for 3 min, a denaturation step at 94°C for 1 min,<br />
an annealing step (specific temperature for each primer<br />
pair) for 30 s, an extension step at 72°C for 1 min, <strong>and</strong> a<br />
final extension at 72°C for 7 min. PCR products were<br />
purified using a Qiaquick PCR purification kit (Qiagen,<br />
Valencia, CA) <strong>and</strong> sequenced using a st<strong>and</strong>ard dye-terminator<br />
sequencing kit following the manufacturer’s instructions<br />
(Applied Biosystems Inc.) with an automated sequencer<br />
(ABI Model 377 or 373; Perkin–Elmer). Sequence<br />
data were assembled <strong>and</strong> analyzed using<br />
Sequencer 3.0 s<strong>of</strong>tware (Gene Codes Corp., Inc.). For<br />
DNA sequences that revealed polymorphisms between<br />
the parental strains, PCR products <strong>of</strong> all 100 progeny
<strong>Genetic</strong> <strong>Linkage</strong> <strong>Map</strong> <strong>of</strong> C. ne<strong>of</strong>ormans var. ne<strong>of</strong>ormans<br />
TABLE 2<br />
RAPD Primers <strong>and</strong> Primers to Amplify Gene-Encoding DNA Regions<br />
That Revealed Polymorphisms between the Parental Strains B3501<br />
(Parent B) <strong>and</strong> B3502 (Parent A)<br />
Primer<br />
Name <strong>of</strong><br />
primer Primer sequence (5-3)<br />
RAPD<br />
A1 CAGGCCCTTC<br />
A2 TGCCGAGCTG<br />
A7 GAAACGGGTG<br />
A8 GTGACGTAGG<br />
A9 GGGTAACGCC<br />
A10 GTGATCGCAG<br />
A11 CAATCGCCGT<br />
A17 GACCGCTTGT<br />
B10 CGTCTGGGAC<br />
B11 GTAGACCCGT<br />
B15 GGAGGGTGTT<br />
Gene-encoding<br />
DNA regions<br />
CAP64 CAP5 CCAAGGGAGTCTTATATGGCGAC<br />
CAP6 GTAAATAGCCACATCGCCCGCG<br />
CnLAC1 LAC1 GGCGATACTATTATCGTA<br />
LAC2 TTCTGGAGTGGCTAGAGC<br />
URA5 URA3 ACGCCTGCCTGTTACTTAA<br />
URA4 GGACATGATGATTGGAGT<br />
Ste11 Ste11-1 ATGGCAGCTTTACACCAGCCTTC<br />
Ste11-2 GATACCACCAATAAGCCTTACC<br />
Ste12 Ste12-1 CTGAGGAATCTCAAACCGGG<br />
Ste12-2 CCAGGGCATCTAGAAACAATCG<br />
Ste20a Ste20a-1 GATCTGTCTCAGCAGCCAC<br />
Ste20a-2 AAAATCAGCTGCGCAGGTGA<br />
Ste20 Ste20-1 GATTTATCTCAGCAGCCACG<br />
Ste20-2 AAATCGGCTACGGGACGTC<br />
Note. Abbreviations <strong>of</strong> the primer names are given <strong>and</strong> the primer<br />
sequences are arranged from the 5-3 end.<br />
strains were sequenced, polymorphisms were detected,<br />
<strong>and</strong> data sets were generated as described above (see<br />
<strong>Development</strong> <strong>of</strong> AFLP Markers). For the remaining four<br />
genes, Ste11, Ste12, Ste20 MATa, <strong>and</strong> Ste20 MAT, polymorphisms<br />
were scored on the presence or absence <strong>of</strong> a<br />
single amplified PCR b<strong>and</strong> for each gene. The amplification<br />
<strong>of</strong> Ste11 <strong>and</strong> Ste12 was performed as described above.<br />
Ste20 MATa <strong>and</strong> Ste20 MAT were amplified in a total<br />
volume <strong>of</strong> 25 l with 10 mM Tris/HCl (pH 8.0), 50 mM<br />
KCl, 1.5 mM MgCl 2, 100 mM each dATP, dCTP, dGTP,<br />
<strong>and</strong> dTTP, 10 M each primer, 1.25 units taq polymerase,<br />
<strong>and</strong> 10–50 ng <strong>of</strong> genomic DNA, respectively. PCRs were<br />
carried out over 25 cycles with an initial denaturation step<br />
at 94°C for 5 min, a denaturation step at 94°C for 30 s, an<br />
annealing step at 65°C for 30 s, an extension step at 72°C<br />
for 30 s, <strong>and</strong> a final extension step at 72°C for 5 min.<br />
Markers were scored as described.<br />
<strong>Linkage</strong> <strong>and</strong> <strong>Map</strong>ping Analysis<br />
<strong>Linkage</strong> <strong>and</strong> mapping analyses <strong>of</strong> the combined data<br />
sets were performed using MAPMAKER s<strong>of</strong>tware, version<br />
3.0 (L<strong>and</strong>er <strong>and</strong> Green, 1987; L<strong>and</strong>er et al., 1987). To<br />
initially generate linkage groups, only markers with balanced<br />
segregation ratios (1:1) were analyzed. <strong>Linkage</strong><br />
groups were formed using a likelihood <strong>of</strong> (log) odds<br />
(LOD) score <strong>of</strong> 5.0 <strong>and</strong> a recombination fraction <strong>of</strong> 0.2<br />
(25.2 cM maximum distance [Haldane function] between<br />
two linked markers) (Morton, 1955). After stable linkage<br />
groups were obtained, more markers were added by stepwise<br />
relaxing <strong>of</strong> the recombination fraction value to 0.3<br />
(approximately 48 cM maximum distance between two<br />
markers). Additionally, markers with skewed segregation<br />
ratios ( 2 3.84, P 0.05) were added to the analysis <strong>and</strong><br />
examined for linkage. To check for progeny strains with<br />
identical genotypes that might have derived from the same<br />
basidiospore isolate, UPGMA cluster analysis was carried<br />
out on the combined data set, revealing that all progeny<br />
strains had unique genotypes <strong>and</strong> differed from each parental<br />
genotype (data not shown).<br />
Electrophoretic Karyotypes<br />
To karyotype the two parental strains, pulsed field gel<br />
electrophoresis was performed following a published protocol<br />
(Wickes et al., 1994). Briefly, four loopfuls <strong>of</strong> liquid<br />
culture were transferred to plates <strong>of</strong> yeast extract–potato<br />
dextrose agar or yeast morphology agar (Difco), <strong>and</strong> cells<br />
were grown at 30°C for up to 5 days. Five loopfuls <strong>of</strong> cells<br />
were then transferred onto yeast nitrogen broth (Difco)<br />
TABLE 3<br />
DNA Coding Regions That Were Tested for Polymorphisms between<br />
the Two Parental Strains B3501 (Parent A) <strong>and</strong> B3502 (Parent B)<br />
No. DNA coding region/gene Citation<br />
193<br />
1 Ste11 J. Heitman et al., unpublished<br />
2 Ste12 Wickes et al., 1997<br />
3 Ste20a Lengeler et al., 2000<br />
4 Ste20 Sia et al., 2000<br />
5 CAP59 Chang <strong>and</strong> Kwon-Chung, 1994<br />
6 CAP64 Chang et al., 1996<br />
7 CNLAC1 Williamson, 1994<br />
8 URA5 Edman <strong>and</strong> Kwon-Chung, 1990<br />
9 HIS3 Parker et al., 1994<br />
10 Small subunit rRNA Hong et al., 1993<br />
11 TDS Livi et al., 1994<br />
12 TRP1 Perfect et al., 1992<br />
13 UBC Spitzer <strong>and</strong> Spitzer, 1995<br />
14 DHFR Sirawaraporn et al., 1993<br />
15 IGS2 region Fan et al., 1995<br />
Copyright © 2000 by Academic Press<br />
All rights <strong>of</strong> reproduction in any form reserved.
194 Forche et al.<br />
agar <strong>and</strong> grown at 30°C for 20 h. Four loopfuls <strong>of</strong> cells<br />
were carefully scraped from the agar <strong>and</strong> suspended in 1<br />
ml TEME buffer (100 mM Tris, pH 8.0, 5 mM EDTA,<br />
0.5% -mercaptoethanol). PFGE was performed on a<br />
CHEF II gel apparatus (Bio-Rad). Plugs were loaded onto<br />
a 1% agarose gel in 0.5 TBE buffer, <strong>and</strong> the chromosomes<br />
were separated under the following conditions:<br />
block 1,250–900 switch at 3 V/cm at 14°C for 46 h; block<br />
2, 170–300 switch at 4 V/cm at 14°C for 48 h. The gel was<br />
then stained in ethidium bromide (0.5 g/ml) for 15 min,<br />
destained in distilled water for 15 min, <strong>and</strong> photographed<br />
using a Polaroid system.<br />
Hybridization<br />
For hybridization experiments, gels were blotted under<br />
neutralizing (20 SSC) conditions using capillary<br />
transfer. Briefly, the gel was submerged in 0.25 M HCl<br />
for 10 min, rinsed in distilled water, <strong>and</strong> submerged in<br />
denaturation solution (0.5 N NaOH, 1.5 M NaCl) for 30<br />
min at room temperature (RT). The gel was briefly<br />
washed in distilled water <strong>and</strong> then submerged in neutralizing<br />
solution (0.5 M Tris/HCl [pH 7.5], 3 M NaCl)<br />
for 30 min at RT. Finally, the gel was rinsed in distilled<br />
water <strong>and</strong> blotted as described elsewhere (Maniatis et<br />
al., 1989). After blotting, the membrane was crosslinked<br />
under UV light, rinsed in distilled water, <strong>and</strong> air<br />
dried for 30 min. The membrane was then wrapped in<br />
aluminum foil until further use.<br />
To determine the corresponding chromosome for each<br />
generated linkage group, markers from each linkage group<br />
were labeled <strong>and</strong> hybridized to chromosomal blots <strong>of</strong> the<br />
two parental strains using a digoxigenin (DIG) labeling<br />
<strong>and</strong> detection system (Roché Pharmaceuticals, Nutley,<br />
NJ) according to the manufacturer’s instructions.<br />
To develop probes from AFLP <strong>and</strong> RAPD markers,<br />
PCRs were carried out (as described above), <strong>and</strong> the PCR<br />
products were separated on gels <strong>of</strong> 1.5% agarose in 1<br />
TAEfor5hat3.5V/cm. B<strong>and</strong>s <strong>of</strong> interest were then<br />
excised from the gel <strong>and</strong> purified with a QIAquick gel<br />
extraction kit (Qiagen). DIG high prime labeling reactions<br />
were carried out using 300 ng–1 g <strong>of</strong> DNA per marker<br />
following the manufacturer’s instructions (Roché Pharmaceuticals).<br />
Probes were stored at 20°C until further use.<br />
To obtain DNA coding markers, PCRs were performed,<br />
<strong>and</strong> the markers were directly purified from the PCR<br />
product using a QIAquick PCR purification kit (Qiagen).<br />
DIG hybridization <strong>and</strong> detection was carried out following<br />
the manufacturer’s instructions (Roché).<br />
Copyright © 2000 by Academic Press<br />
All rights <strong>of</strong> reproduction in any form reserved.<br />
RESULTS<br />
Marker <strong>Development</strong><br />
AFLP markers. Of 25 primer pairs initially tested<br />
using the two parental strains, 10 were selected for subsequent<br />
analysis (Table 4). For each primer pair, an average<br />
<strong>of</strong> 166 AFLP fragments were obtained. The number <strong>of</strong><br />
polymorphisms distinguished between the parents ranged<br />
from 5 (for primer pair MgaEca) to 22 (for primer pair<br />
MgaEgtc), with an average <strong>of</strong> 14.1 polymorphic fragments<br />
(markers) per primer pair (see also Table 4). Of the polymorphic<br />
AFLP markers, 63 markers were present only in<br />
parent A (B3502), <strong>and</strong> 78 markers were found only in<br />
parent B (B3501). Of these 141 AFLP markers, 31 showed<br />
significant segregation distortion, <strong>and</strong> 16 expressed highly<br />
distorted segregation ratios ( 2 values 7.88; P 0.005).<br />
AFLP b<strong>and</strong>s are quite numerous <strong>and</strong> very close to each<br />
other. All markers were scored three times <strong>and</strong> ambiguous<br />
markers were discarded.<br />
RAPD markers <strong>and</strong> genes as markers. RAPD markers<br />
were selected for analysis if they segregated among the<br />
parental strains <strong>and</strong> were well isolated <strong>and</strong> easy to purify<br />
from agarose gels. Consequently, only 6 primer combinations<br />
<strong>of</strong> an initial 64 tested combinations <strong>and</strong> 4 <strong>of</strong> 10 single<br />
primers tested satisfied these criteria (Table 4). A total <strong>of</strong><br />
31 markers was obtained: 13 markers were present only in<br />
parent A <strong>and</strong> 18 markers were present only in parent B<br />
(Table 4). Two RAPD markers showed segregation distortion<br />
( 2 values 3.84; P 0.05).<br />
Gene-coding DNA sequence markers. Of 15 surveyed<br />
genes, 11 were screened by sequencing, <strong>and</strong> the 4<br />
Ste genes were tested for the presence <strong>and</strong> the absence <strong>of</strong><br />
a PCR fragment. Of the 11 genes that were partially<br />
sequenced from the parental strains, only 3 genes (CAP64,<br />
URA5, CnLAC1) displayed polymorphisms between the<br />
parents (Table 4). For these 3 genes, a total <strong>of</strong> five codominant<br />
single nucleotide polymorphisms (SNPs) was obtained<br />
with one SNP each for CAP64 <strong>and</strong> CNLAC1 <strong>and</strong><br />
three SNPs for URA5. From the 4 Ste genes, four markers<br />
were scored for the presence or absence <strong>of</strong> a single amplicon.<br />
Consequently, a total <strong>of</strong> nine markers was obtained<br />
with significant balanced segregation ratios. The mating<br />
type <strong>of</strong> each progeny was determined by backcrosses with<br />
each parent <strong>and</strong> other tester strains.<br />
Combined markers. For linkage analysis, segregation<br />
data from the progeny were combined for all markers, <strong>and</strong><br />
the linkage analysis was based on a total <strong>of</strong> 181 dominant/<br />
recessive markers. Seventy-seven markers (b<strong>and</strong>s) were<br />
present only in parent A, 99 markers (b<strong>and</strong>s) were detected
<strong>Genetic</strong> <strong>Linkage</strong> <strong>Map</strong> <strong>of</strong> C. ne<strong>of</strong>ormans var. ne<strong>of</strong>ormans<br />
TABLE 4<br />
Results <strong>of</strong> the <strong>Development</strong> <strong>of</strong> AFLP Markers, RAPD Markers, <strong>and</strong> Gene-Encoding DNA Markers<br />
Marker<br />
only in parent B, <strong>and</strong> 5 codominant markers were obtained<br />
from sequence data (see Table 4). From these 181 markers,<br />
148 segregated in a ratio <strong>of</strong> 1:1, the segregation <strong>of</strong> 15 markers<br />
was slightly skewed (3.84 2 10.81), <strong>and</strong> 18 markers<br />
exhibited highly distorted segregation ( 2 10.81; P <br />
0.001). The proportion <strong>of</strong> markers with skewed segregation<br />
ratios was higher for markers inherited from parent B (21 <strong>of</strong><br />
33 markers) than for markers inherited from parent A (12 <strong>of</strong><br />
33 markers).<br />
<strong>Linkage</strong> Analysis<br />
Total AFLP<br />
fragments<br />
To determine the optimal parameters to generate the<br />
linkage map, several combinations <strong>of</strong> LOD thresholds<br />
Total number <strong>of</strong> polymorphic fragments<br />
Total Parent A Parent B<br />
Skewed<br />
markers*<br />
Unlinked<br />
markers<br />
AFLP MgtEgt 144 13 6 7 3 0<br />
MtgEtg 134 15 8 7 5 1<br />
MgaEca 204 12 9 3 2 3<br />
MgtEca 150 5 3 2 0 1<br />
McaEgt 142 13 6 7 2 2<br />
MacEgt 132 12 4 8 3 0<br />
McaEtg 194 13 5 8 1 1<br />
MacEgtc 163 19 5 14 4 3<br />
MgaEgtc 240 22 7 15 5 2<br />
MtgcEtg 155 17 10 7 6 5<br />
RAPD A1B11 — 2 1 1 0 2<br />
A2B10 — 1 0 1 0 1<br />
A7A8 — 2 0 2 0 0<br />
A7A9 — 2 0 2 0 0<br />
A7A10 — 4 1 3 0 1<br />
A7A11 — 4 2 2 0 1<br />
A1 — 3 3 0 1 1<br />
A2 — 4 1 3 0 1<br />
A17 — 4 3 1 1 2<br />
B15 — 5 2 3 0 0<br />
Gene-encoding DNA regions Ste11 — 1 0 1 0 0<br />
Ste12 — 1 0 1 0 0<br />
Ste20a — 1 1 0 0 0<br />
Ste20 — 1 0 1 0 0<br />
CAP64 1<br />
— 1 0 1 0 0<br />
URA5 1<br />
— 3 3 0 0 0<br />
CnLAC1 1<br />
— 1 1 0 0 0<br />
Total: 181 Total A: 81 Total B: 100 Total: 33 Total: 27<br />
(44.7%) (55.3%) (18%) (15%)<br />
Note. AFLP markers are listed based on the different primer combinations, followed by the number <strong>of</strong> obtained AFLP fragments per primer pair <strong>and</strong><br />
the number <strong>of</strong> polymorphic fragments (markers); the markers are divided according to their parental origin. The number <strong>of</strong> skewed <strong>and</strong> the number <strong>of</strong><br />
unlinked markers are given for each primer combination. The same scheme was applied for the RAPD markers <strong>and</strong> the coding DNA markers. The total<br />
<strong>of</strong> markers for each specified column is given at the bottom <strong>of</strong> the table.<br />
* Markers were called skewed if they exceeded a 2 value <strong>of</strong> 3.84 with P 0.05 (markers did not segregate significantly at a 50:50 ratio).<br />
1 Codominant markers.<br />
195<br />
(3.0, 4.0, <strong>and</strong> 5.0) <strong>and</strong> recombination fraction values<br />
(0.20–0.30) were applied to the data set. With recombination<br />
values less than 0.24, the linkage groups (LG)<br />
obtained with these data were more stable. Changing<br />
the LOD values from 3.0 to 5.0 did not seem to influence<br />
the results. Based on these findings, a LOD<br />
threshold <strong>of</strong> 5.0 <strong>and</strong> recombination fractions varying<br />
from 0.20 to 0.24 between two adjacent markers were<br />
used to generate the main framework <strong>of</strong> the linkage<br />
map. Only 148 markers with normal segregation ratios<br />
( 2 3.84; P 0.05) were used. Fourteen linkage<br />
groups with at least 4 markers each were obtained, as<br />
well as several smaller linkage groups with 2 <strong>and</strong> 3<br />
markers.<br />
Copyright © 2000 by Academic Press<br />
All rights <strong>of</strong> reproduction in any form reserved.
196 Forche et al.<br />
TABLE 5<br />
Generated <strong>Linkage</strong> Groups for Cryptococcus ne<strong>of</strong>ormans var.<br />
ne<strong>of</strong>ormans, Serotype D<br />
Major LGs/<br />
Chromosomes (CH)<br />
Name <strong>of</strong><br />
LG/CH<br />
Number <strong>of</strong><br />
markers<br />
Size <strong>of</strong><br />
LG<br />
(in cM)<br />
Average<br />
spacing <strong>of</strong><br />
markers<br />
LG1 19 151.5 7.97<br />
CH2 9 125.6 13.95<br />
CH3 11 76.2 6.93<br />
CH4/5/6-A 9 124.9 13.9<br />
CH4/5/6-B 8 53.8 6.7<br />
CH4/5/6-C 6 43 8.6<br />
CH7 8 77.6 9.7<br />
LG8 17 117.9 6.9<br />
LG9 12 112.6 9.4<br />
LG10 7 94.5 13.5<br />
LG11 7 57.8 8.2<br />
LG12 6 55.2 9.2<br />
LG13 4 28.8 9.6<br />
LG14 4 3.2 0.8<br />
Small LGs (SLG) SLG1 2 0 0<br />
SLG2 2 1.3 0.65<br />
SLG3 2 22.3 11.1<br />
SLG4 2 7.8 8.4<br />
SLG5 2 40.8 20.4<br />
SLG6 3 27 9<br />
SLG7 3 9.7 3.2<br />
SLG8 3 13.6 4.5<br />
Distorted LGs (DLG) DLG1 4 38.7 9.7<br />
DLG2 5 52.5 10.5<br />
Note. <strong>Linkage</strong> groups (LG) are divided into main LGs, small LGs, <strong>and</strong><br />
distorted LGs. The columns indicate the number <strong>of</strong> markers for each LG,<br />
the size <strong>of</strong> each LG, <strong>and</strong> the average spacing <strong>of</strong> the markers within each LG.<br />
To include markers with slightly skewed segregation<br />
ratios <strong>and</strong> to map markers that were unlinked, the recombination<br />
fraction values were relaxed in a stepwise fashion,<br />
while the LOD was maintained at 5.0, <strong>and</strong> one marker was<br />
added at a time to the stable linkage groups. Markers that<br />
significantly changed the order <strong>of</strong> LGs or the composition<br />
<strong>of</strong> the map were not included.<br />
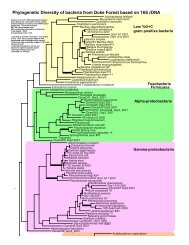
The final linkage map (based on 3 markers) was constructed<br />
from 127 <strong>of</strong> 181 markers, consisting <strong>of</strong> 14 major LGs<br />
(Fig. 2). The map covers a total length <strong>of</strong> 1142.6 cM with an<br />
average distance <strong>of</strong> 8.9 cM between markers. The largest LG<br />
has 19 markers <strong>and</strong> is 151.5 cM in size, <strong>and</strong> the smallest LG<br />
contained 4 markers <strong>and</strong> is 3.1 cM in size (Table 5). Eight<br />
small LGs, containing 2 <strong>and</strong> 3 markers, were also obtained;<br />
they vary in size from 0 to 40.8 cM. Twenty-six markers could<br />
not be assigned to any linkage group. Nine <strong>of</strong> the markers<br />
with highly skewed segregation ratios formed 2 LGs with 4<br />
<strong>and</strong> 5 markers (Table 5). One <strong>of</strong> these 2 LGs contained only<br />
markers that were skewed toward parent A, <strong>and</strong> the other<br />
LG contained markers that were skewed toward parent B. To<br />
Copyright © 2000 by Academic Press<br />
All rights <strong>of</strong> reproduction in any form reserved.<br />
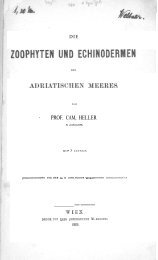
visualize the skewness <strong>of</strong> markers within linkage groups, a<br />
chart was generated. For 100 progeny, the recombination<br />
frequency <strong>of</strong> each marker was calculated <strong>and</strong> plotted against<br />
the distal location (in cM) <strong>of</strong> the marker on the linkage group<br />
(Micros<strong>of</strong>t Excel, version 5.0). This calculation was applied to<br />
each major LG <strong>and</strong> to the 2 skewed LGs individually, <strong>and</strong> all<br />
LGs were combined in the same chart (Fig. 3). A recombination<br />
frequency <strong>of</strong> 0.5 denotes independent segregation.<br />
Figure 3 shows that all major LGs are located slightly below<br />
the level <strong>of</strong> 0.5 recombination frequency, indicating that they<br />
are skewed toward parent B. The 2 highly skewed LGs are<br />
graphed as expected. The LG with markers skewed toward<br />
parent A was located near the highest recombination fraction<br />
<strong>of</strong> 1.0, <strong>and</strong> the LG with markers skewed toward parent B was<br />
positioned near the lowest level <strong>of</strong> the recombination fraction<br />
(zero) (Fig. 3).<br />
If small LGs <strong>and</strong> skewed LGs are included in the linkage<br />
map, the genome size exp<strong>and</strong>s to a total length <strong>of</strong> 1356.3 cM.<br />
However, using a combination <strong>of</strong> different methods to calculate<br />
the genome sizes (Chakravarti et al., 1991; Hulbert et<br />
al., 1988; Remington et al., 1999), our data suggest a total<br />
length <strong>of</strong> 1917 cM for the genetic linkage map <strong>of</strong> C. ne<strong>of</strong>ormans.<br />
Based on this estimation, the linkage map generated in<br />
this study spans about 71% <strong>of</strong> the total length <strong>of</strong> the genome<br />
<strong>of</strong> C. ne<strong>of</strong>ormans var. ne<strong>of</strong>ormans.<br />
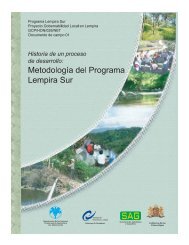
<strong>Linkage</strong> Plot Analysis<br />
To further examine associations among loci including possible<br />
higher-level (e.g., two-way) interactions, linkage values<br />
among loci were plotted to facilitate visualization <strong>of</strong> LGs.<br />
First, segregating markers were ordered by LG <strong>and</strong> by their<br />
map order within LGs. A matrix <strong>of</strong> recombination fractions<br />
(Rf) was then calculated for all pairs <strong>of</strong> loci <strong>and</strong> plotted as a<br />
shaded graph with lower recombination values shaded highest.<br />
Distinct LGs are readily viewed in the resulting linkage<br />
plot (Fig. 4) by their darker shading. Most LGs also are<br />
segmented into two major shaded portions separated by a<br />
lighter shading probably representing the centromere region<br />
for each chromosome. In addition, regions <strong>of</strong> darker shading<br />
suggest possible associations between several linkage groups,<br />
particularly between LG 9 <strong>and</strong> CH4/5/6-A <strong>and</strong> between CH2<br />
<strong>and</strong> LG 12. Several unlinked loci can also be seen to have<br />
little or no linkage with the main 14 groups. This method <strong>of</strong><br />
graphically imaging complex interlocus interactions is similar<br />
to the clustering methods proposed for analysis <strong>of</strong> gene<br />
expression used in genome analysis (e.g., Eisen et al., 1998),<br />
except that in this case the data are estimating linkage instead<br />
<strong>of</strong> gene expression. Computer programs for calculating <strong>and</strong><br />
plotting the Rf matrix are available upon request from the<br />
authors.
FIG. 2. <strong>Genetic</strong> linkage map <strong>of</strong> Cryptococcus ne<strong>of</strong>ormans var. ne<strong>of</strong>ormans based on 127 molecular markers (AFLPs, RAPDs, <strong>and</strong> gene-encoding<br />
sequences) at a LOD score <strong>of</strong> 5.0. Markers that are underlined confirmed the chromosome location <strong>of</strong> these linkage groups.
198 Forche et al.<br />
FIG. 3. Segregation plot for major <strong>and</strong> skewed linkage groups (LG). The y axis represents the recombination frequency values; the x axis gives the<br />
distance between the markers on the linkage group. Each curve demonstrates a linkage group, a distorted LG (DLG), or a chromosome (CH); see<br />
right-h<strong>and</strong> legend for identification <strong>and</strong> color code. The black horizontal arrow indicates the segregation ratio <strong>of</strong> 50:50, <strong>and</strong> the two vertical arrows on<br />
the left indicate the direction <strong>of</strong> skewness toward parent A <strong>and</strong> parent B.<br />
FIG. 4. <strong>Linkage</strong> plot based on recombination fraction <strong>of</strong> pair wise comparisons <strong>of</strong> all 181 markers, ordered by linkage groups/chromosomes. Color<br />
coding: white, no linkage; black-blue, strongest linkage. SLGs, small linkage groups; DLGs, distorted linkage groups.<br />
The AFLP markers appear evenly distributed throughout<br />
the linkage map. No LGs consist <strong>of</strong> markers derived from<br />
only one parent. The majority <strong>of</strong> RAPD markers map to a<br />
cluster within LG 7. Most <strong>of</strong> the skewed markers that were<br />
integrated into the map are located at the ends <strong>of</strong> LGs. For<br />
several LGs, these regions are also characterized by none or<br />
only few recombinational events, <strong>and</strong> these might represent<br />
telomeric regions. Some regions within LGs, such as in LGs<br />
8 <strong>and</strong> 10, have fewer markers. The largest such gap is located<br />
on LG 7 <strong>and</strong> spans 48.5 cM. No significant marker clustering<br />
Copyright © 2000 by Academic Press<br />
All rights <strong>of</strong> reproduction in any form reserved.<br />
was observed. Instead, there were many small groups <strong>of</strong><br />
tightly linked clusters <strong>of</strong> two to four markers. Predictably,<br />
these groups <strong>of</strong> tightly linked markers exhibited no recombination<br />
(genetic distance was zero).<br />
Crossover Events<br />
The amount <strong>of</strong> recombination between markers within<br />
<strong>and</strong> among LGs varied from 0 to 31, with the highest<br />
numbers found for LG 7. The average number <strong>of</strong> cross-
<strong>Genetic</strong> <strong>Linkage</strong> <strong>Map</strong> <strong>of</strong> C. ne<strong>of</strong>ormans var. ne<strong>of</strong>ormans<br />
over events was 6.9 per LG. As expected, the number <strong>of</strong><br />
crossovers increased with higher distance between markers<br />
(data not shown). Some <strong>of</strong> the higher values, which<br />
were detected in several LGs, may reflect recombinational<br />
hot spots throughout the genome. However, since the<br />
probability <strong>of</strong> crossovers increases with the distance between<br />
two markers, the higher crossover values may be<br />
due to large distances between two markers within LGs<br />
rather than hot spots. More markers per LG would likely<br />
decrease the observed recombination between markers<br />
<strong>and</strong> within LGs.<br />
Mating Locus<br />
The mating loci for C. ne<strong>of</strong>ormans var. ne<strong>of</strong>ormans<br />
have been located on chromosome 3 (Fig. 2) (Wickes et<br />
al., 1994). Four Ste genes, Ste11-, Ste12-, Ste20-a,<br />
<strong>and</strong> Ste20-, have been mapped to this chromosome.<br />
Based on our linkage analysis, all four genes are tightly<br />
linked with no <strong>and</strong> little genetic distance separating<br />
them (Fig. 3). The order <strong>of</strong> these genes seems to be<br />
Ste11, Ste12, Ste20-, <strong>and</strong> Ste20-a. The MAT <strong>and</strong><br />
MATa loci map next to each other on the chromosome<br />
<strong>and</strong> are separated by only 1 cM. Chromosome 3 has a<br />
physical size <strong>of</strong> 1.88 Mb <strong>and</strong> spans a genetic distance <strong>of</strong><br />
76.2 cM. Since the entire mating locus has a genetic<br />
distance <strong>of</strong> 3 cM, this locus spans approximately 74 kb.<br />
PFGE Analysis <strong>and</strong> Assignment <strong>of</strong> LGs to<br />
Their Corresponding Chromosomes<br />
The karyotypes <strong>of</strong> the parental strains were obtained by<br />
PFGE, as shown in Fig. 5. The size <strong>of</strong> each chromosome<br />
was estimated based on visual examination using the chromosomes<br />
<strong>of</strong> Saccharomyces cerevisiae <strong>and</strong> Hansenula<br />
wingei as size st<strong>and</strong>ards. This analysis revealed 10 clearly<br />
visible chromosomal b<strong>and</strong>s for parent B (B3501) <strong>and</strong> 11<br />
for parent A (B3502). Based on the greater intensity <strong>of</strong><br />
b<strong>and</strong>s 4 <strong>and</strong> 7 <strong>of</strong> parent B <strong>and</strong> b<strong>and</strong>s 6 <strong>and</strong> 11 <strong>of</strong> parent A,<br />
13 chromosomes are proposed for both strains. For both<br />
parental strains, the largest chromosome has a physical<br />
size <strong>of</strong> 2.44 Mb (CH 1), <strong>and</strong> the smallest chromosome is<br />
about 806 kb (CH 13). The calculated sizes <strong>of</strong> chromosomes<br />
5 <strong>and</strong> 9 are also identical for both parents; the size<br />
variations between parental chromosomes 2, 3 <strong>and</strong> 8 are<br />
slight. All the other chromosomes differ in their sizes,<br />
indicating the presence <strong>of</strong> chromosomal length polymorphisms<br />
(CLPs). To assign the generated LGs to their<br />
appropriate chromosomes, selected markers (preferably<br />
199<br />
FIG. 5. Karyotypes <strong>of</strong> the parental strains obtained by PFGE analysis<br />
<strong>and</strong> diagrams <strong>of</strong> the karyotypes with sizes <strong>and</strong> nomenclature <strong>of</strong> the<br />
chromosomes.<br />
RAPDs <strong>and</strong> gene-encoding DNA markers) were hybridized<br />
to PFGE blots <strong>of</strong> the two parental strains. To date, six<br />
LGs have been assigned that correspond to chromosomes<br />
2 to 7 (Fig. 2, Table 5). The chromosomal location <strong>of</strong> these<br />
LGs was confirmed by one or more markers (underlined in<br />
Fig. 2).<br />
The estimate <strong>of</strong> the total genome size for both parents<br />
varies between 18.31 Mb for parent A <strong>and</strong> 18.52 Mb for<br />
parent B (Fig. 5). Since the total length <strong>of</strong> this linkage map<br />
is 1356.3 cM, 1 cM would correspond to approximately<br />
13.6 kb. However, this value is not consistent with the<br />
calculated sum <strong>of</strong> the physical size <strong>and</strong> length in cM <strong>of</strong> the<br />
individual chromosomes. There is no linear correlation<br />
between the physical size <strong>of</strong> a chromosome <strong>and</strong> its genetic<br />
length across the genome. For example, CH 3 has a<br />
physical size <strong>of</strong> 1.88 Mb <strong>and</strong> a genetic length <strong>of</strong> 76.2 cM,<br />
yielding 24.7 kb/cM, <strong>and</strong> CH 7 is approximately 1.29 Mb<br />
(average sizes for both parents with a genetic length <strong>of</strong><br />
77.6 cM), resulting in 16.6 kb/cM. Since this map covers<br />
about 71% <strong>of</strong> the total length <strong>of</strong> the genome, these values<br />
will most likely change, as the map becomes more complete.<br />
Copyright © 2000 by Academic Press<br />
All rights <strong>of</strong> reproduction in any form reserved.
200 Forche et al.<br />
DISCUSSION<br />
This moderately dense genetic linkage map is the first to<br />
be developed for C. ne<strong>of</strong>ormans, <strong>and</strong> it covers 71% <strong>of</strong> the<br />
total genome. To generate a linkage map, one needs a<br />
mapping population with large numbers <strong>of</strong> progeny <strong>and</strong><br />
easily readable markers. The markers used in this study<br />
included AFLP markers, RAPD markers, <strong>and</strong> gene-encoding<br />
DNA sequences. Most were AFLP markers, which<br />
have been used increasingly to develop genetic linkage<br />
maps, especially for plants (Lu et al., 1998; von Heusden<br />
et al., 2000) <strong>and</strong> phytopathogenic fungi (Van der Lee et al.,<br />
1997). AFLP markers are advantageous because a large<br />
number <strong>of</strong> markers can be rapidly generated to provide<br />
high-resolution mapping (Jones et al., 1997). AFLP markers<br />
are also more reproducible than RAPD markers.<br />
AFLPs span the genome <strong>and</strong> are sensitive enough to<br />
detect SNPs. The initial phase in the development <strong>of</strong><br />
AFLP markers includes the total digestion <strong>of</strong> the genome<br />
with EcoRI <strong>and</strong> MseI, which is expensive, compared to<br />
methods such as RAPDs. However, once the preamplification<br />
reactions are obtained for each progeny strain,<br />
more than 100 final reactions can be carried out with<br />
different primer pairs per sample. Because <strong>of</strong> these advantages,<br />
we chose to use the AFLP method to develop<br />
the majority <strong>of</strong> our markers.<br />
One hundred eighty-one markers were analyzed to generate<br />
the linkage map. Screening 10 primer pairs, 141<br />
AFLP markers were obtained. In comparison with<br />
RAPDs, 64 combinations <strong>of</strong> 10-mer arbitrary primers <strong>and</strong><br />
10 single 10-mer oligonucleotides were tested, but only 31<br />
RAPD markers were found that met our criteria. An even<br />
smaller number <strong>of</strong> polymorphisms was observed when<br />
gene-encoding sequences were compared between the<br />
parental strains. Eleven different genes were screened,<br />
but only five SNPs were detected among the parents.<br />
One reason for the low level <strong>of</strong> polymorphisms might be<br />
that the parental strains, B3501 <strong>and</strong> B3502, which were<br />
used in the cross to obtain sexual progeny, are sibling<br />
strains. The fact that their karyotypes revealed chromosomal<br />
length polymorphisms, suggesting certain levels <strong>of</strong><br />
genomic differences between them, is not reflected by the<br />
markers, which characterize only small polymorphisms,<br />
such as single nucleotide polymorphisms. CLPs have been<br />
studied in a variety <strong>of</strong> other fungi, including C<strong>and</strong>ida<br />
albicans (Thrash-Bingham <strong>and</strong> Gorman, 1992), Coprinus<br />
cinereus (Zolan et al., 1994), S. cerevisiae (Camasses,<br />
1996), <strong>and</strong> Yarrowia lypolytica (Casaregola et al., 1997),<br />
<strong>and</strong> can have different origins (Zolan, 1995). A future<br />
Copyright © 2000 by Academic Press<br />
All rights <strong>of</strong> reproduction in any form reserved.<br />
study <strong>of</strong> the nature <strong>of</strong> CLPs would certainly enrich the<br />
knowledge about the genome <strong>of</strong> C. ne<strong>of</strong>ormans.<br />
One hundred progeny strains from this cross were used<br />
in this analysis. The size <strong>of</strong> the progeny population is<br />
important for the development <strong>of</strong> a genetic linkage map,<br />
because a sufficient number <strong>of</strong> recombinational events are<br />
needed to calculate an accurate linkage <strong>of</strong> the markers.<br />
The number <strong>of</strong> progeny used in this study is similar or<br />
larger than progeny sizes used to generate genetic linkage<br />
maps for other organisms, such as plants, plant pathogenic<br />
fungi, <strong>and</strong> cultivated fungi. For example, to create a genetic<br />
linkage map for the Oomycete Phytophthora infestans,<br />
73 single spore progenies were analyzed, yielding 191<br />
markers (Van der Lee et al., 1997), <strong>and</strong> a genetic linkage<br />
map was produced for Agaricus bisporus with 52 haploid<br />
<strong>of</strong>fspring <strong>and</strong> 64 markers (Kerrigan et al., 1993). Other<br />
linkage studies in plants used numbers <strong>of</strong> progeny that<br />
varied between 35 (Su et al., 1999) <strong>and</strong> 106 (Lespinasse et<br />
al., 2000).<br />
To determine linkage relationships between markers,<br />
the progeny strains were first screened for all markers that<br />
were polymorphic between the parents. The segregation<br />
ratios were calculated, <strong>and</strong> the significance <strong>of</strong> these values<br />
was tested by applying a simple goodness <strong>of</strong> fit test ( 2<br />
test). Of 181 markers, 33 (18%) showed segregation ratios<br />
that were skewed toward either parent A (12 <strong>of</strong> 33; 36.4%)<br />
or parent B (21 <strong>of</strong> 33; 63.6%). Clearly, most skewed<br />
markers were inherited from parent B. This phenomenon<br />
has been noted by others; there are several reports in<br />
which the distortion <strong>of</strong> marker segregation was higher for<br />
the markers <strong>of</strong> one parent (Debener <strong>and</strong> Mattiesch, 1999;<br />
Su et al., 1999; von Heusden et al., 2000). Skewed markers<br />
may reflect any <strong>of</strong> several genomic processes. They have<br />
been associated with distortion factors, such as self-incompatibility<br />
alleles, or with the expression <strong>of</strong> linked lethal<br />
genes (Bert et al., 1999; Lu et al., 1998). Skewed markers<br />
might also indicate epistatic effects <strong>of</strong> genes that suppress<br />
the expression <strong>of</strong> linked genes. Other explanations for<br />
segregation distortion can be attributed to sampling errors,<br />
such as incorrectly scoring b<strong>and</strong>s or an inadequate number<br />
<strong>of</strong> progeny (Lu et al., 1998). Markers with distorted segregation<br />
ratios were also observed when the mapping<br />
population was obtained from parents with different genome<br />
sizes (Bert et al., 1999). However, these latter explanations<br />
are unlikely to pertain in this study because the<br />
population size <strong>of</strong> 100 progeny was sufficiently large, <strong>and</strong><br />
all markers were scored repeatedly to ensure accuracy.<br />
Skewed markers in this analysis are more likely caused by<br />
genetic interactions throughout the genome as well as<br />
other distortion factors.
<strong>Genetic</strong> <strong>Linkage</strong> <strong>Map</strong> <strong>of</strong> C. ne<strong>of</strong>ormans var. ne<strong>of</strong>ormans<br />
Initial linkage analyses were carried out using only<br />
markers with normal Mendelian segregation ratios, <strong>and</strong><br />
markers with segregation distortion were added later to<br />
the established linkage map. The MAPMAKER program<br />
was used to analyze 155 markers <strong>and</strong> generated 14 major<br />
linkage groups, 8 smaller linkage groups, <strong>and</strong> 2 linkage<br />
groups with exclusively skewed markers, spanning a cumulative<br />
size <strong>of</strong> 1356.3 cM. Based on calculations proposed<br />
by Hulbert <strong>and</strong> coworkers (1988), the estimated<br />
total genome size <strong>of</strong> C. ne<strong>of</strong>ormans is approximately 1917<br />
cM. With the limited number <strong>of</strong> markers, it is not surprising<br />
that the coverage is only 71%. Highly saturated genetic<br />
linkage maps <strong>of</strong> other organisms have been published,<br />
consisting <strong>of</strong> 708 markers (Lespinasse et al., 2000), 508<br />
markers (Remington et al., 1999), <strong>and</strong> 463 markers (Bert<br />
et al., 1999). Therefore, many more markers are necessary<br />
to saturate the genetic linkage map <strong>of</strong> C. ne<strong>of</strong>ormans, <strong>and</strong><br />
this work is in progress.<br />
No large groups <strong>of</strong> markers were densely clustered on<br />
the linkage map <strong>of</strong> C. ne<strong>of</strong>ormans. In other linkage studies,<br />
this phenomenon was observed commonly, <strong>and</strong> two<br />
explanations have been suggested. First, marker clusters<br />
represent regions where recombination is suppressed, perhaps<br />
corresponding to centromere <strong>and</strong>/or telomere regions<br />
(Grattapaglia <strong>and</strong> Seder<strong>of</strong>f, 1994; Lespinasse et al.,<br />
2000). Second, the clustering <strong>of</strong> markers has been associated<br />
with the AFLP markers. The AFLP method is more<br />
sensitive than the RFLP method for the detection <strong>of</strong><br />
SNPs, which <strong>of</strong>ten occur in repetitive sequences near the<br />
centromere <strong>and</strong>/or telomere. Therefore, since AFLP<br />
markers are more likely to detect SNPs, they may produce<br />
clustered markers (Qi et al., 1998). This cluster phenomenon<br />
<strong>of</strong> AFLP markers was associated with more dense<br />
linkage maps. Hence, additional AFLP markers may reveal<br />
clustering in this linkage map.<br />
There is still no explanation for the two linkage groups<br />
that consist <strong>of</strong> exclusively skewed markers. One group is<br />
composed <strong>of</strong> markers inherited only from parent A, <strong>and</strong><br />
the other group includes only markers from parent B. This<br />
result is reminiscent <strong>of</strong> sex chromosomes. It is also possible<br />
that these linkage groups are “pseudo” linkage groups<br />
rather than real linkage groups. In reality, these markers<br />
might be dispersed throughout the genome, but they<br />
could be linked because <strong>of</strong> strong epistatic effects. The<br />
reason that other skewed markers fit well within linkage<br />
groups could be that the segregation ratios <strong>of</strong> these markers<br />
are less skewed. To explore these possibilities, we will<br />
isolate key markers from the pseudo linkage groups <strong>and</strong><br />
hybridize these markers to a PFGE blot to determine their<br />
actual location <strong>and</strong> linkage status.<br />
Karyotyping was performed in this study to confirm the<br />
number <strong>of</strong> chromosomes <strong>of</strong> both parental strains (B3501<br />
<strong>and</strong> B3502) <strong>and</strong> to calculate the physical size <strong>of</strong> the genome.<br />
Both parents revealed 13 chromosomes. Two chromosome<br />
st<strong>and</strong>ards were used, <strong>and</strong> seven different PFGE<br />
gels were analyzed to provide a correct size for each <strong>of</strong> the<br />
13 chromosomes. An approximate size <strong>of</strong> 18.53 <strong>and</strong> 18.31<br />
Mb was calculated for the parental strains B3501 <strong>and</strong><br />
B3502, respectively. In recent years, several karyotyping<br />
studies have been performed on these strains. The number<br />
<strong>of</strong> chromosomes that we observed is consistent with<br />
data from other laboratories (Wickes et al., 1994; Perfect<br />
et al., 1989). However, there are discrepancies in the<br />
chromosomal sizes, especially in the range <strong>of</strong> larger chromosomes.<br />
In this study, the largest chromosome was determined<br />
to be 2.44 Mb, similar to the finding <strong>of</strong> Boekhout<br />
et al. (1997). However, Wickes et al. (1994) estimated a<br />
size <strong>of</strong> 3.87 Mb. Consequently, their estimated average<br />
genome size <strong>of</strong> C. ne<strong>of</strong>ormans var. ne<strong>of</strong>ormans <strong>of</strong> 21.6 Mb<br />
was larger than that in our analysis (Wickes et al., 1994). It<br />
is difficult to calculate chromosomal sizes because <strong>of</strong> the<br />
influence <strong>of</strong> a number <strong>of</strong> PFGE running parameters, including<br />
the gel concentration, switch times, running times,<br />
<strong>and</strong> voltage. To minimize the effects <strong>of</strong> these conditions,<br />
we analyzed many gels <strong>and</strong> used two different chromosome<br />
st<strong>and</strong>ards to achieve a physical genomic size <strong>of</strong><br />
approximately 18.4 Mb.<br />
To determine the chromosomal locations <strong>of</strong> the generated<br />
LGs, blots <strong>of</strong> parental chromosomes were hybridized<br />
with markers from each LG. This approach identified the<br />
chromosomes on which six LGs were located. Chromosomes<br />
2, 3, <strong>and</strong> 7 were clearly identified, but we have not<br />
resolved the specific chromosomal locations <strong>of</strong> the three<br />
linkage groups that hybridized to chromosomes 4, 5, <strong>and</strong> 6.<br />
However, chromosomes 4, 5, <strong>and</strong> 6 have identical migration<br />
rates in the gel, <strong>and</strong> therefore it was not possible to<br />
determine the exact location <strong>of</strong> each chromosome. Improved<br />
separation <strong>of</strong> these chromosomes <strong>and</strong> additional<br />
hybridizations will be necessary to assign the remaining<br />
linkage groups to their appropriate chromosomes.<br />
CONCLUSIONS<br />
201<br />
This investigation produced a genetic linkage map <strong>of</strong> C.<br />
ne<strong>of</strong>ormans, including markers, mapping data, <strong>and</strong> information<br />
on recombination parameters. This information<br />
will support laboratory studies on the genetics <strong>and</strong> pathogenicity<br />
<strong>of</strong> C. ne<strong>of</strong>ormans. This map provides the first<br />
overview <strong>of</strong> this genome <strong>and</strong> a basis for determining the<br />
Copyright © 2000 by Academic Press<br />
All rights <strong>of</strong> reproduction in any form reserved.
202 Forche et al.<br />
organization <strong>of</strong> the genome <strong>and</strong> genomic rearrangements,<br />
such as chromosomal length polymorphisms.<br />
With the data on recombination frequencies, crossover<br />
events, <strong>and</strong> genetic linkage, the general meiotic behavior<br />
<strong>of</strong> C. ne<strong>of</strong>ormans could be investigated <strong>and</strong> compared with<br />
other fungal or nonfungal species. Furthermore, by comparing<br />
the genetic linkage map with the physical map,<br />
potential recombination hotspot <strong>and</strong> centromers could be<br />
detected.<br />
An important application <strong>of</strong> a linkage map is to tag<br />
genes. If a gene <strong>of</strong> interest is closely linked to a marker on<br />
the map, it is likely that both are inherited together from<br />
parents to their <strong>of</strong>fspring. This marker can then be used to<br />
determine the genomic location <strong>of</strong> the linked gene in<br />
subsequent genetic studies. By knowing the position <strong>of</strong> the<br />
marker in relation to the gene <strong>of</strong> interest, one can identify<br />
the fragments <strong>and</strong> sequences <strong>of</strong> the gene by chromosome<br />
walking. This approach permits one to localize genes that<br />
control simple or complex traits (e.g., virulence, drug<br />
resistance), which are important areas <strong>of</strong> research in C.<br />
ne<strong>of</strong>ormans.<br />
Furthermore, this map may provide a framework for the<br />
recently initiated genome sequencing project. It will help<br />
to assign sequence contigs to chromosomes <strong>and</strong> guide<br />
their order <strong>and</strong> orientation. This is especially important for<br />
regions with repetitive sequences, where errors may occur<br />
with the assembling <strong>of</strong> contigs. With the availability <strong>of</strong> a<br />
genetic linkage map, knowledge <strong>of</strong> the karyotype, <strong>and</strong> the<br />
forthcoming genomic sequence <strong>of</strong> C. ne<strong>of</strong>ormans var. ne<strong>of</strong>ormans,<br />
we can start working toward a thorough underst<strong>and</strong>ing<br />
<strong>of</strong> the genome <strong>of</strong> this emerging human pathogen.<br />
ACKNOWLEDGMENTS<br />
We thank Timothy James <strong>and</strong> John Mercer for providing the C<br />
program for calculating the Rf matrix <strong>and</strong> for the program to plot the Rf<br />
matrix, respectively. This research was supported by Public Health Service<br />
Grants AI25783 <strong>and</strong> AI44975 from the National Institute <strong>of</strong> Health.<br />
This is a publication <strong>of</strong> the Duke University Mycology Research Unit.<br />
REFERENCES<br />
Bert, P. F., Gharmet, G., Sourdille, P., Hayward, M. D., <strong>and</strong> Balfourier,<br />
F. 1999. A high-density molecular map for rye grass (Lolium perenne)<br />
using AFLP markers. Theor. Appl. Genet. 99: 445–452.<br />
Boekhout, T., <strong>and</strong> van Belkum, A. 1997. Variability <strong>of</strong> karyotypes <strong>and</strong><br />
RAPD types in genetically related strains <strong>of</strong> Cryptococcus ne<strong>of</strong>ormans.<br />
Curr. Genet. 32: 203–208.<br />
Copyright © 2000 by Academic Press<br />
All rights <strong>of</strong> reproduction in any form reserved.<br />
Boekhout, T., van Belkum, A., Leenders, A. C. A. P., Verbrugh, H. A.,<br />
Mukamurangwa, P., Swinne, D., <strong>and</strong> Scheffers, W. A. 1997. Molecular<br />
typing <strong>of</strong> Cryptococcus ne<strong>of</strong>ormans: Taxonomic <strong>and</strong> epidemiological<br />
aspects. Int. J. Syst. Bacteriol. 47: 432–442.<br />
Camasses, A. 1996. Natural translocation <strong>of</strong> a large segment <strong>of</strong> chromosome<br />
III to chromosome I in a laboratory strain <strong>of</strong> Saccharomyces<br />
cerevisiae. Curr. Genet. 30: 218–223.<br />
Casadevall, A., <strong>and</strong> Perfect, J. R. 1999. Cryptococcus ne<strong>of</strong>ormans. ASM<br />
Press, Washington, DC.<br />
Casaregola, S., Feynerol, C., Diez, M., Fournier, P., <strong>and</strong> Gaillardin, C.<br />
1997. Genomic organization <strong>of</strong> the yeast Yarrowia lipolytica. Chromosoma<br />
106: 380–390.<br />
Chakravarti, A., Lasher, L. K., <strong>and</strong> Reefer, J. E. 1991. A maximum<br />
likelihood method for estimating genome length using genetic linkage<br />
data. <strong>Genetic</strong>s 128: 175–182.<br />
Debener, T., <strong>and</strong> Mattiesch, L. 1999. Construction <strong>of</strong> a genetic linkage<br />
map for roses using RAPD <strong>and</strong> AFLP markers. Theor. Appl. Genet.<br />
99: 891–899.<br />
Eisen, M. B., Spellman, P. T., Brown, P. O., <strong>and</strong> Botstein, D. 1998.<br />
Cluster analysis <strong>and</strong> display <strong>of</strong> genome-wide expression patterns. Proc.<br />
Natl. Acad. Sci. USA 95: 14863–14868.<br />
Franzot, S. P., Salkin, I. F., <strong>and</strong> Casadevall, A. 1999. Cryptococcus<br />
ne<strong>of</strong>ormans var. grubii: Separate varietal status for Cryptococcus ne<strong>of</strong>ormans<br />
serotype A isolates. J. Clin. Microbiol. 37: 838–840.<br />
Grattapaglia, D., <strong>and</strong> Seder<strong>of</strong>f, R. 1994. <strong>Genetic</strong> linkage maps <strong>of</strong> Eucalyptus<br />
gr<strong>and</strong>is <strong>and</strong> Eucalyptus urophylla using a pseudo-testcross:<br />
<strong>Map</strong>ping strategy <strong>and</strong> RAPD markers. <strong>Genetic</strong>s 137: 1121–1137.<br />
Heitman, J., Allen, B., Alspaugh, J. A., <strong>and</strong> Kwon-Chung, K. J. 1999. On<br />
the origins <strong>of</strong> congenic MAT <strong>and</strong> MATa strains <strong>of</strong> the pathogenic<br />
yeast Cryptococcus ne<strong>of</strong>ormans. Fungal Genet. Biol. 28: 1–5.<br />
Hulbert, S. H., Ilott, T. W., Legg, E. J., Lincoln, S. E., L<strong>and</strong>er, E. S., <strong>and</strong><br />
Michelmore, R. W. 1988. <strong>Genetic</strong> analysis <strong>of</strong> the fungus, Bremia<br />
lactucae, using restriction fragment polymorphisms. <strong>Genetic</strong>s 120:<br />
947–958.<br />
Jones, N., Ougham, H., <strong>and</strong> Thomas, H. 1997. Markers <strong>and</strong> mapping: We<br />
are all geneticists now. New Phytol. 137: 165–177.<br />
Kerrigan, R. W., Royer, J. C., Baller, L. M., Kohli, Y., Horgen, P. A., <strong>and</strong><br />
Anderson, J. B. 1993. Meiotic behavior <strong>and</strong> linkage relationships in the<br />
secondarily homothallic fungus Agaricus bisporus. <strong>Genetic</strong>s 133: 225–<br />
236.<br />
Kwon-Chung, K. J. 1976. Morphogenesis <strong>of</strong> Filobasidiella ne<strong>of</strong>ormans,<br />
the sexual state <strong>of</strong> Cryptococcus ne<strong>of</strong>ormans. Mycologia 68: 821–833.<br />
Kwon-Chung, K. J., <strong>and</strong> Rhodes, J. C. 1986. Encapsulation <strong>and</strong> melanin<br />
formation as indicators <strong>of</strong> virulence in Cryptococcus ne<strong>of</strong>ormans. Infect.<br />
Immun. 51: 218–223.<br />
L<strong>and</strong>er, E. S., <strong>and</strong> Green, P. 1987. Construction <strong>of</strong> multilocus genetic<br />
linkage maps in humans. Proc. Natl. Acad. Sci. USA 84: 2363–2367.<br />
L<strong>and</strong>er, E. S., Green, P., Abrahamson, A., Barlow, A., <strong>and</strong> Daly, M. J.<br />
1987. MAPMAKER: An interactive computer package for constructing<br />
primary genetic linkage maps <strong>of</strong> experimental <strong>and</strong> natural populations.<br />
Genomics 1: 174–181.<br />
Lengeler, K. B., Wang, P., Cox, G. M., Perfect, J. R., <strong>and</strong> Heitman, J.<br />
2000. Identification <strong>of</strong> the MATa mating type locus <strong>of</strong> Cryptococcus<br />
ne<strong>of</strong>ormans reveals a serotype A MATa strain thought to have been<br />
extinct. Proc. Natl. Acad. Sci. USA 97: 14455–14460.<br />
Lespinasse, D., Rodier-Goud, M., Grivet, L., Leconte, A., <strong>and</strong> Legnate,<br />
H. 2000. A saturated genetic linkage map <strong>of</strong> rubber tree (Hevea spp.)
<strong>Genetic</strong> <strong>Linkage</strong> <strong>Map</strong> <strong>of</strong> C. ne<strong>of</strong>ormans var. ne<strong>of</strong>ormans<br />
based on RFLP, AFLP, microsatellite, <strong>and</strong> isozyme markers. Theor.<br />
Appl. Genet. 100: 127–138.<br />
Lu, Z.-X., Sosinski, B., Reighard, G. L., Baird, W. V., <strong>and</strong> Abbott, A. G.<br />
1998. Construction <strong>of</strong> a genetic linkage map <strong>and</strong> identification <strong>of</strong><br />
AFLP markers for resistance to root-knot nematodes in peach rootstocks.<br />
Genome 41: 199–207.<br />
Maniatis, T., Fritsch, E. F., <strong>and</strong> Sambrook, J. 1989. Molecular Cloning:<br />
A Laboratory Manual. Cold Spring Harbor Laboratory Press, Cold<br />
Spring Harbor, NY.<br />
Morton, N. E. 1955. Sequential tests for the detection <strong>of</strong> linkage. Am. J.<br />
Hum. Genet. 7: 277–318.<br />
Perfect, J. R., Magee, B. B., <strong>and</strong> Magee, P. T. 1989. Separation <strong>of</strong><br />
chromosomes <strong>of</strong> Cryptococcus ne<strong>of</strong>ormans by pulsed field gel electrophoresis.<br />
Infect. Immun. 57: 2624–2627.<br />
Polacheck, I., <strong>and</strong> Lebens, G. A. 1989. Electrophoretic karyotype <strong>of</strong> the<br />
pathogenic yeast Cryptococcus ne<strong>of</strong>ormans. J. Gen. Microbiol. 135:<br />
65–71.<br />
Qi, X., Stam, P., <strong>and</strong> Lindhout, P. 1998. Use <strong>of</strong> locus-specific AFLP<br />
markers to construct a high density molecular map in barley. Theor.<br />
Appl. Genet. 96: 376–384.<br />
Remington, D. L., Whetten, R. W., Liu, B.-H., <strong>and</strong> O’Malley, D. M.<br />
1999. Construction <strong>of</strong> an AFLP genetic linkage map with nearly<br />
complete genome coverage in Pinus taeda. Theor. Appl. Genet. 98:<br />
1279–1292.<br />
Sia, R. A., Lengeler, K. B., <strong>and</strong> Heitman, J. 2000. Diploid strains <strong>of</strong> the<br />
pathogenic basidiomycete Cryptococcus ne<strong>of</strong>ormans are thermally dimorphic.<br />
Fungal Genet. Biol. 29: 153–163.<br />
Spitzer, S. G., <strong>and</strong> Spitzer, E. D. 1997. Isolation <strong>of</strong> Cryptococcus ne<strong>of</strong>ormans<br />
chromosome-specific probes using expressed sequence tags.<br />
J. Med. Vet. Mycol. 35: 257–261.<br />
Still, C. N., <strong>and</strong> Jacobson, E. S. 1983. Recombinational mapping <strong>of</strong> capsule<br />
mutations in Cryptococcus ne<strong>of</strong>ormans. J. Bacteriol. 156: 460–462.<br />
Su, X., Ferdig, M. T., Huang, Y., Huynh, C. Q., Liu, A., You, J., Wootton,<br />
J. C., <strong>and</strong> Wellems, T. E. 1999. A genetic map <strong>and</strong> recombination<br />
parameters <strong>of</strong> the human malaria parasite Plasmodium falciparum.<br />
Science 286: 1351–1353.<br />
203<br />
Thompson, J. R., Douglas, C. M., Li, W., Jue, C. K., Pramanik, B., Yuan,<br />
X., Rude, T. H., T<strong>of</strong>faletti, D. L., Perfect, J. R., <strong>and</strong> Kurtz, M. B. 1999.<br />
A glucan synthase FKS1 homolog in Cryptococcus ne<strong>of</strong>ormans is<br />
single copy <strong>and</strong> encodes an essential function. J. Bacteriol. 181: 444–<br />
453.<br />
Thrash-Bingham, C., <strong>and</strong> Gorman, J. A. 1992. DNA translocations contribute<br />
to chromosome length polymorphisms in C<strong>and</strong>ida albicans.<br />
Curr. Genet. 22: 93–100.<br />
Van der Lee, T., DeWitte, I., Drenth, A., Alfonso, C., <strong>and</strong> Govers, F.<br />
1997. AFLP linkage map <strong>of</strong> the Oomycete Phytophthora infestans.<br />
Fungal Genet. Biol. 21: 278–291.<br />
Von Heusden, A. W., Van Ooijen, J. W., Von Ginkel, R. V., Verbeek,<br />
W. H. J., <strong>and</strong> Wietsma, W. A. 2000. A genetic map <strong>of</strong> an interspecific<br />
cross in Allium based on amplified fragment length polymorphism<br />
(AFLP) markers. Theor. Appl. Genet. 100: 118–126.<br />
Vos, P., Hogers, R., Bleeker, M., Reijans, M., van der Lee, T., Hornes,<br />
M., Frijters, A., Pot, J., Peleman, J., Kuiper, M., <strong>and</strong> Zabeau, M. 1995.<br />
AFLP: A new technique for DNA fingerprinting. Nucleic Acids Res.<br />
23: 4407–4414.<br />
Wickes, B. L., Moore, T. D. E., <strong>and</strong> Kwon-Chung, K. J. 1994. Comparison<br />
<strong>of</strong> the electrophoretic karyotypes <strong>and</strong> chromosomal location <strong>of</strong> ten<br />
genes in the two varieties <strong>of</strong> Cryptococcus ne<strong>of</strong>ormans. Microbiology<br />
140: 543–550.<br />
Williams, J. G. K., Kubelik, A. R., Livak, K. J., Rafalski, J. A., <strong>and</strong> Tingey,<br />
S. V. 1990. DNA polymorphisms amplified by arbitrary primers are<br />
useful as genetic markers. Nucleic Acids Res. 18: 6531–6535.<br />
Wolfram, S. 1998. Mathematica 4. Vers. 4.0.1.0. Wolfram Research, Inc.<br />
Xu, J., Vilgalys, R., <strong>and</strong> Mitchell, T. G. 2000. Multiple gene genealogies<br />
reveal recent dispersion <strong>and</strong> hybridization in the human pathogenic<br />
fungus Cryptococcus ne<strong>of</strong>ormans. Mol. Ecol. 9: 1471–1482.<br />
Zolan, M. E. 1995. Chromosome-length polymorphism in fungi. Microbiol.<br />
Rev. 59: 686–698.<br />
Zolan, M. E., Heyler, N., <strong>and</strong> Stassen, N. 1994. Inheritance <strong>of</strong> chromosome-length<br />
polymorphisms in Coprinus cinereus. <strong>Genetic</strong>s 137: 87–<br />
94.<br />
Copyright © 2000 by Academic Press<br />
All rights <strong>of</strong> reproduction in any form reserved.