- Page 2:
EIGHTH EDITION TECHNICAL ANALYSIS O
- Page 5 and 6:
Library of Congress Cataloging-in-P
- Page 7 and 8:
not foresee the electronic calculat
- Page 9 and 10:
volume. These concepts are briefly
- Page 12 and 13:
About the Editorial Practices in Th
- Page 14 and 15:
everyone knows, has only 50 seconds
- Page 16 and 17:
the markets a woman plunger (shoote
- Page 18:
Acknowledgments In General: John Ma
- Page 21 and 22:
for subscribers to his Technical St
- Page 23 and 24:
In his books, Stock Market Theory a
- Page 25 and 26:
Through his technical work, John Ma
- Page 28:
Preface to the Fourth Edition In th
- Page 32 and 33:
Foreword This book has been written
- Page 34 and 35:
Contents Preface to the Eighth Edit
- Page 36 and 37:
Chapter 12 Gaps....................
- Page 38 and 39:
Chapter 23 Choosing and Managing Hi
- Page 40:
APPENDIX A Chapters A-D Chapter A T
- Page 44 and 45:
chapter one The Technical Approach
- Page 46 and 47:
Chapter one: The Technical Approach
- Page 48:
Chapter one: The Technical Approach
- Page 51 and 52:
10 Technical Analysis of Stock Tren
- Page 53 and 54:
12 Technical Analysis of Stock Tren
- Page 55 and 56:
14 Technical Analysis of Stock Tren
- Page 57 and 58:
16 Technical Analysis of Stock Tren
- Page 59 and 60:
18 Technical Analysis of Stock Tren
- Page 61 and 62:
20 Technical Analysis of Stock Tren
- Page 63 and 64:
22 Technical Analysis of Stock Tren
- Page 65 and 66:
24 Technical Analysis of Stock Tren
- Page 67 and 68:
26 Technical Analysis of Stock Tren
- Page 69 and 70:
28 Technical Analysis of Stock Tren
- Page 71 and 72:
30 Technical Analysis of Stock Tren
- Page 73 and 74:
P.U. Fig. 5, p. 37 32 Technical Ana
- Page 75 and 76:
34 Technical Analysis of Stock Tren
- Page 77 and 78:
36 Technical Analysis of Stock Tren
- Page 79 and 80:
38 Technical Analysis of Stock Tren
- Page 81 and 82:
40 Technical Analysis of Stock Tren
- Page 83 and 84:
42 Technical Analysis of Stock Tren
- Page 85 and 86:
44 Technical Analysis of Stock Tren
- Page 87 and 88:
46 Technical Analysis of Stock Tren
- Page 89 and 90:
48 Technical Analysis of Stock Tren
- Page 91 and 92:
50 Technical Analysis of Stock Tren
- Page 94 and 95:
chapter six Important Reversal Patt
- Page 96 and 97:
Chapter six: Important Reversal Pat
- Page 98 and 99:
Chapter six: Important Reversal Pat
- Page 100 and 101:
Chapter six: Important Reversal Pat
- Page 102 and 103:
Chapter six: Important Reversal Pat
- Page 104 and 105:
Chapter six: Important Reversal Pat
- Page 106 and 107:
Chapter six: Important Reversal Pat
- Page 108 and 109:
Chapter six: Important Reversal Pat
- Page 110 and 111:
Chapter six: Important Reversal Pat
- Page 112 and 113:
chapter seven Important Reversal Pa
- Page 114 and 115:
Chapter seven: Important Reversal P
- Page 116 and 117:
Chapter seven: Important Reversal P
- Page 118 and 119:
Chapter seven: Important Reversal P
- Page 120 and 121:
Chapter seven: Important Reversal P
- Page 122 and 123:
Chapter seven: Important Reversal P
- Page 124 and 125:
Chapter seven: Important Reversal P
- Page 126 and 127:
Chapter seven: Important Reversal P
- Page 128 and 129:
Chapter seven: Important Reversal P
- Page 130 and 131:
Chapter seven: Important Reversal P
- Page 132 and 133:
Chapter seven: Important Reversal P
- Page 134:
P.U. Fig. 43, p. 105 Chapter seven:
- Page 137 and 138:
96 Technical Analysis of Stock Tren
- Page 139 and 140:
98 Technical Analysis of Stock Tren
- Page 141 and 142:
100 Technical Analysis of Stock Tre
- Page 143 and 144:
102 Technical Analysis of Stock Tre
- Page 145 and 146:
104 Technical Analysis of Stock Tre
- Page 147 and 148:
106 Technical Analysis of Stock Tre
- Page 149 and 150:
108 Technical Analysis of Stock Tre
- Page 151 and 152:
110 Technical Analysis of Stock Tre
- Page 153 and 154:
112 Technical Analysis of Stock Tre
- Page 155 and 156:
114 Technical Analysis of Stock Tre
- Page 157 and 158:
116 Technical Analysis of Stock Tre
- Page 159 and 160:
118 Technical Analysis of Stock Tre
- Page 161 and 162:
120 Technical Analysis of Stock Tre
- Page 163 and 164:
122 Technical Analysis of Stock Tre
- Page 166 and 167:
chapter nine Important Reversal Pat
- Page 168 and 169:
Chapter nine: Important Reversal Pa
- Page 170 and 171:
Chapter nine: Important Reversal Pa
- Page 172 and 173:
Chapter nine: Important Reversal Pa
- Page 174 and 175:
Chapter nine: Important Reversal Pa
- Page 176 and 177:
Chapter nine: Important Reversal Pa
- Page 178 and 179:
Chapter nine: Important Reversal Pa
- Page 180 and 181:
Chapter nine: Important Reversal Pa
- Page 182 and 183:
Chapter nine: Important Reversal Pa
- Page 184 and 185:
Chapter nine: Important Reversal Pa
- Page 186 and 187:
Chapter nine: Important Reversal Pa
- Page 188 and 189:
chapter ten Other Reversal Phenomen
- Page 190 and 191:
Chapter ten: Other Reversal Phenome
- Page 192 and 193:
Chapter ten: Other Reversal Phenome
- Page 194 and 195:
Chapter ten: Other Reversal Phenome
- Page 196 and 197:
Chapter ten: Other Reversal Phenome
- Page 198 and 199:
Chapter ten: Other Reversal Phenome
- Page 200 and 201:
Chapter ten: Other Reversal Phenome
- Page 202 and 203:
Chapter ten: Other Reversal Phenome
- Page 204 and 205:
Chapter ten: Other Reversal Phenome
- Page 206 and 207:
Chapter ten: Other Reversal Phenome
- Page 208 and 209:
Chapter ten: Other Reversal Phenome
- Page 210 and 211:
Chapter ten: Other Reversal Phenome
- Page 212 and 213:
Chapter ten: Other Reversal Phenome
- Page 214 and 215:
Chapter ten: Other Reversal Phenome
- Page 216:
Chapter ten: Other Reversal Phenome
- Page 219 and 220:
178 Technical Analysis of Stock Tre
- Page 221 and 222:
180 Technical Analysis of Stock Tre
- Page 223 and 224:
182 Technical Analysis of Stock Tre
- Page 226 and 227:
chapter eleven Consolidation Format
- Page 228 and 229:
Chapter eleven: Consolidation Forma
- Page 230 and 231:
Chapter eleven: Consolidation Forma
- Page 232 and 233:
Chapter eleven: Consolidation Forma
- Page 234 and 235:
Chapter eleven: Consolidation Forma
- Page 236 and 237:
Chapter eleven: Consolidation Forma
- Page 238 and 239:
Chapter eleven: Consolidation Forma
- Page 240 and 241:
Chapter eleven: Consolidation Forma
- Page 242 and 243:
Chapter eleven: Consolidation Forma
- Page 244 and 245:
Chapter eleven: Consolidation Forma
- Page 246:
Chapter eleven: Consolidation Forma
- Page 249 and 250:
208 Technical Analysis of Stock Tre
- Page 251 and 252:
210 Technical Analysis of Stock Tre
- Page 253 and 254:
212 Technical Analysis of Stock Tre
- Page 255 and 256:
214 Technical Analysis of Stock Tre
- Page 257 and 258:
216 Technical Analysis of Stock Tre
- Page 259 and 260:
218 Technical Analysis of Stock Tre
- Page 261 and 262:
220 Technical Analysis of Stock Tre
- Page 263 and 264:
222 Technical Analysis of Stock Tre
- Page 265 and 266:
224 Technical Analysis of Stock Tre
- Page 267 and 268:
226 Technical Analysis of Stock Tre
- Page 269 and 270:
228 Technical Analysis of Stock Tre
- Page 271 and 272:
230 Technical Analysis of Stock Tre
- Page 273 and 274:
232 Technical Analysis of Stock Tre
- Page 275 and 276:
234 Technical Analysis of Stock Tre
- Page 277 and 278:
236 Technical Analysis of Stock Tre
- Page 279 and 280:
238 Technical Analysis of Stock Tre
- Page 281 and 282:
240 Technical Analysis of Stock Tre
- Page 283 and 284:
242 Technical Analysis of Stock Tre
- Page 285 and 286:
244 Technical Analysis of Stock Tre
- Page 287 and 288:
246 Technical Analysis of Stock Tre
- Page 289 and 290:
248 Technical Analysis of Stock Tre
- Page 291 and 292:
250 Technical Analysis of Stock Tre
- Page 293 and 294:
252 Technical Analysis of Stock Tre
- Page 295 and 296:
254 Technical Analysis of Stock Tre
- Page 297 and 298:
256 Technical Analysis of Stock Tre
- Page 299 and 300:
258 Technical Analysis of Stock Tre
- Page 301 and 302:
260 Technical Analysis of Stock Tre
- Page 303 and 304:
262 Technical Analysis of Stock Tre
- Page 305 and 306:
264 Technical Analysis of Stock Tre
- Page 307 and 308:
266 Technical Analysis of Stock Tre
- Page 309 and 310:
268 Technical Analysis of Stock Tre
- Page 311 and 312:
270 Technical Analysis of Stock Tre
- Page 313 and 314:
272 Technical Analysis of Stock Tre
- Page 315 and 316:
274 Technical Analysis of Stock Tre
- Page 318 and 319:
chapter fifteen Major Trendlines In
- Page 320 and 321:
Chapter fifteen: Major Trendlines 2
- Page 322 and 323:
Chapter fifteen: Major Trendlines 2
- Page 324 and 325:
Chapter fifteen: Major Trendlines 2
- Page 326 and 327:
Chapter fifteen: Major Trendlines 2
- Page 328 and 329:
chapter 15.1 Trading the Averages i
- Page 330 and 331:
Chapter 15.1: Trading the Averages
- Page 332 and 333:
chapter sixteen Technical Analysis
- Page 334 and 335:
Chapter sixteen: Technical Analysis
- Page 336:
Chapter sixteen: Technical Analysis
- Page 339 and 340:
298 Technical Analysis of Stock Tre
- Page 341 and 342:
300 Technical Analysis of Stock Tre
- Page 343 and 344:
302 Technical Analysis of Stock Tre
- Page 345 and 346:
304 Technical Analysis of Stock Tre
- Page 347 and 348:
306 Technical Analysis of Stock Tre
- Page 349 and 350:
308 Technical Analysis of Stock Tre
- Page 351 and 352:
310 Technical Analysis of Stock Tre
- Page 353 and 354:
312 Technical Analysis of Stock Tre
- Page 355 and 356:
314 Technical Analysis of Stock Tre
- Page 357 and 358:
316 Technical Analysis of Stock Tre
- Page 359 and 360:
318 Technical Analysis of Stock Tre
- Page 361 and 362:
320 Technical Analysis of Stock Tre
- Page 363 and 364:
322 Technical Analysis of Stock Tre
- Page 365 and 366:
324 Technical Analysis of Stock Tre
- Page 367 and 368:
326 Technical Analysis of Stock Tre
- Page 369 and 370:
328 Technical Analysis of Stock Tre
- Page 371 and 372:
330 Technical Analysis of Stock Tre
- Page 373 and 374:
332 Technical Analysis of Stock Tre
- Page 375 and 376:
334 Technical Analysis of Stock Tre
- Page 378 and 379:
chapter eighteen The Tactical Probl
- Page 380 and 381:
Chapter eighteen: The Tactical Prob
- Page 382 and 383:
Chapter eighteen: The Tactical Prob
- Page 384 and 385:
Chapter eighteen: The Tactical Prob
- Page 386:
Chapter eighteen: The Tactical Prob
- Page 389 and 390:
348 Technical Analysis of Stock Tre
- Page 391 and 392:
350 Technical Analysis of Stock Tre
- Page 393 and 394:
352 Technical Analysis of Stock Tre
- Page 395 and 396:
354 Technical Analysis of Stock Tre
- Page 397 and 398:
356 Technical Analysis of Stock Tre
- Page 400 and 401:
chapter 20.1 The Kind of Stocks We
- Page 402 and 403:
Chapter 20.1: Long-term Investor’
- Page 404 and 405:
Chapter 20.1: Long-term Investor’
- Page 406:
Chapter 20.1: Long-term Investor’
- Page 409 and 410:
368 Technical Analysis of Stock Tre
- Page 412 and 413:
chapter twenty-two Selection of Sto
- Page 414 and 415:
Chapter twenty-two: Selection of St
- Page 416 and 417:
Chapter twenty-two: Selection of St
- Page 418 and 419:
chapter twenty-three Choosing and M
- Page 420 and 421:
Chapter twenty-three: Choosing and
- Page 422 and 423:
Chapter twenty-three: Choosing and
- Page 424 and 425:
Chapter twenty-three: Choosing and
- Page 426 and 427:
Chapter twenty-three: Choosing and
- Page 428:
Chapter twenty-three: Choosing and
- Page 431 and 432:
390 Technical Analysis of Stock Tre
- Page 433 and 434:
392 Technical Analysis of Stock Tre
- Page 436 and 437:
chapter twenty-five Two Touchy Ques
- Page 438 and 439:
Chapter twenty-five: Two Touchy Que
- Page 440 and 441:
Chapter twenty-five: Two Touchy Que
- Page 442:
Chapter twenty-five: Two Touchy Que
- Page 445 and 446: 404 Technical Analysis of Stock Tre
- Page 447 and 448: 406 Technical Analysis of Stock Tre
- Page 449 and 450: 408 Technical Analysis of Stock Tre
- Page 451 and 452: 410 Technical Analysis of Stock Tre
- Page 454 and 455: chapter twenty-eight What Is a Bott
- Page 456 and 457: Chapter twenty-eight: What Is a Bot
- Page 458: Chapter twenty-eight: What Is a Bot
- Page 461 and 462: 420 Technical Analysis of Stock Tre
- Page 463 and 464: 422 Technical Analysis of Stock Tre
- Page 465 and 466: 424 Technical Analysis of Stock Tre
- Page 467 and 468: 426 Technical Analysis of Stock Tre
- Page 469 and 470: 428 Technical Analysis of Stock Tre
- Page 471 and 472: 430 Technical Analysis of Stock Tre
- Page 473 and 474: 432 Technical Analysis of Stock Tre
- Page 476 and 477: chapter thirty-one Not All in One B
- Page 478 and 479: chapter thirty-two Measuring Implic
- Page 480: Chapter thirty-two: Measuring Impli
- Page 483 and 484: 442 Technical Analysis of Stock Tre
- Page 485 and 486: 444 Technical Analysis of Stock Tre
- Page 487 and 488: 446 Technical Analysis of Stock Tre
- Page 489 and 490: 448 Technical Analysis of Stock Tre
- Page 491 and 492: 450 Technical Analysis of Stock Tre
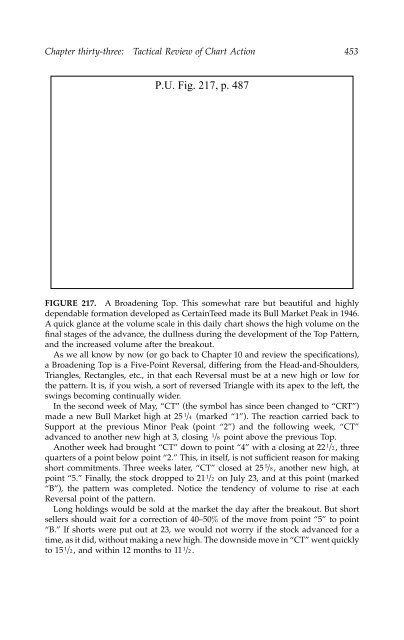
- Page 493: 452 Technical Analysis of Stock Tre
- Page 497 and 498: 456 Technical Analysis of Stock Tre
- Page 499 and 500: 458 Technical Analysis of Stock Tre
- Page 501 and 502: 460 Technical Analysis of Stock Tre
- Page 503 and 504: 462 Technical Analysis of Stock Tre
- Page 505 and 506: 464 Technical Analysis of Stock Tre
- Page 507 and 508: 466 Technical Analysis of Stock Tre
- Page 509 and 510: 468 Technical Analysis of Stock Tre
- Page 512 and 513: chapter thirty-four A Quick Summati
- Page 514: Chapter thirty-four: A Quick Summat
- Page 517 and 518: 476 Technical Analysis of Stock Tre
- Page 519 and 520: 478 Technical Analysis of Stock Tre
- Page 521 and 522: 480 Technical Analysis of Stock Tre
- Page 524 and 525: chapter thirty-seven “The Same Ol
- Page 526 and 527: Chapter thirty-seven: “The Same O
- Page 528 and 529: Chapter thirty-seven: “The Same O
- Page 530 and 531: Chapter thirty-seven: “The Same O
- Page 532 and 533: Chapter thirty-seven: “The Same O
- Page 534 and 535: Chapter thirty-seven: “The Same O
- Page 536 and 537: Chapter thirty-seven: “The Same O
- Page 538 and 539: Chapter thirty-seven: “The Same O
- Page 540 and 541: Chapter thirty-seven: “The Same O
- Page 542 and 543: Chapter thirty-seven: “The Same O
- Page 544 and 545:
Chapter thirty-seven: “The Same O
- Page 546 and 547:
Chapter thirty-seven: “The Same O
- Page 548 and 549:
507 Technical Analysis of Stock Tre
- Page 550 and 551:
Chapter thirty-seven: “The Same O
- Page 552 and 553:
Chapter thirty-seven: “The Same O
- Page 554 and 555:
Chapter thirty-seven: “The Same O
- Page 556 and 557:
Chapter thirty-seven: “The Same O
- Page 558 and 559:
Chapter thirty-seven: “The Same O
- Page 560 and 561:
Chapter thirty-seven: “The Same O
- Page 562 and 563:
Chapter thirty-seven: “The Same O
- Page 564 and 565:
Chapter thirty-seven: “The Same O
- Page 566 and 567:
Chapter thirty-seven: “The Same O
- Page 568 and 569:
Chapter thirty-seven: “The Same O
- Page 570 and 571:
Chapter thirty-seven: “The Same O
- Page 572 and 573:
Chapter thirty-seven: “The Same O
- Page 574 and 575:
Chapter thirty-seven: “The Same O
- Page 576 and 577:
Chapter thirty-seven: “The Same O
- Page 578 and 579:
Chapter thirty-seven: “The Same O
- Page 580 and 581:
Chapter thirty-seven: “The Same O
- Page 582 and 583:
chapter thirty-eight Balanced and D
- Page 584 and 585:
Chapter thirty-eight: Balanced and
- Page 586 and 587:
Chapter thirty-eight: Balanced and
- Page 588:
Chapter thirty-eight: Balanced and
- Page 591 and 592:
550 Technical Analysis of Stock Tre
- Page 593 and 594:
552 Technical Analysis of Stock Tre
- Page 596 and 597:
chapter forty-one Application of Ca
- Page 598 and 599:
Chapter forty-one: Application of C
- Page 600:
Chapter forty-one: Application of C
- Page 603 and 604:
562 Technical Analysis of Stock Tre
- Page 605 and 606:
564 Technical Analysis of Stock Tre
- Page 607 and 608:
566 Technical Analysis of Stock Tre
- Page 609 and 610:
568 Technical Analysis of Stock Tre
- Page 611 and 612:
570 Technical Analysis of Stock Tre
- Page 614 and 615:
chapter forty-three Stick to Your G
- Page 616 and 617:
appendix A Chapter A (Magee’s Ori
- Page 618 and 619:
Appendix A 577 and this fraction is
- Page 620 and 621:
Appendix A 579 was clean-cut and fa
- Page 622 and 623:
Appendix A 581 Composite Leverage I
- Page 624 and 625:
Appendix A 583 be clear that such s
- Page 626 and 627:
Appendix A 585 Chapter D Sensitivit
- Page 628 and 629:
Appendix A 587 Control Data Corp. 1
- Page 630 and 631:
Appendix A 589 Occidental Petroleum
- Page 632:
Appendix A 591 Northern States Powe
- Page 635 and 636:
594 Technical Analysis of Stock Tre
- Page 637 and 638:
596 Technical Analysis of Stock Tre
- Page 639 and 640:
598 Technical Analysis of Stock Tre
- Page 641 and 642:
600 Technical Analysis of Stock Tre
- Page 643 and 644:
602 Technical Analysis of Stock Tre
- Page 645 and 646:
604 Technical Analysis of Stock Tre
- Page 647 and 648:
606 Technical Analysis of Stock Tre
- Page 649 and 650:
608 Technical Analysis of Stock Tre
- Page 651 and 652:
610 Technical Analysis of Stock Tre
- Page 653 and 654:
612 Technical Analysis of Stock Tre
- Page 655 and 656:
614 Technical Analysis of Stock Tre
- Page 657 and 658:
616 Technical Analysis of Stock Tre
- Page 659 and 660:
618 Technical Analysis of Stock Tre
- Page 661 and 662:
620 Technical Analysis of Stock Tre
- Page 663 and 664:
622 Technical Analysis of Stock Tre
- Page 665 and 666:
624 Technical Analysis of Stock Tre
- Page 667 and 668:
626 Technical Analysis of Stock Tre
- Page 669 and 670:
628 Technical Analysis of Stock Tre
- Page 671 and 672:
630 Technical Analysis of Stock Tre
- Page 674 and 675:
appendix D Resources • Section 1:
- Page 676 and 677:
Appendix D 635 Briefing.com www.bri
- Page 678 and 679:
Appendix D 637 where E is the expec
- Page 680 and 681:
Appendix D 639 PORTFOLIO PROFIT ANA
- Page 682 and 683:
Appendix D 641 Section 7 From the J
- Page 684 and 685:
List of Illustrations/Diagrams 643
- Page 686 and 687:
List of Illustrations/Diagrams 645
- Page 688 and 689:
List of Illustrations/Diagrams 647
- Page 690 and 691:
List of Illustrations/Diagrams 649
- Page 692 and 693:
List of Illustrations/Diagrams 651
- Page 694 and 695:
List of Illustrations/Diagrams 653
- Page 696 and 697:
List of Illustrations/Diagrams 655
- Page 698 and 699:
List of Illustrations/Diagrams 657
- Page 700:
List of Illustrations/Diagrams 659
- Page 703 and 704:
662 Technical Analysis of Stock Tre
- Page 705 and 706:
664 Technical Analysis of Stock Tre
- Page 707 and 708:
666 Technical Analysis of Stock Tre
- Page 709 and 710:
668 Technical Analysis of Stock Tre
- Page 711 and 712:
670 Technical Analysis of Stock Tre
- Page 713 and 714:
672 Technical Analysis of Stock Tre
- Page 715 and 716:
674 Technical Analysis of Stock Tre
- Page 717 and 718:
676 Technical Analysis of Stock Tre
- Page 719 and 720:
678 Technical Analysis of Stock Tre
- Page 721 and 722:
680 Technical Analysis of Stock Tre
- Page 723 and 724:
682 Technical Analysis of Stock Tre
- Page 725 and 726:
684 Technical Analysis of Stock Tre
- Page 727 and 728:
686 Technical Analysis of Stock Tre
- Page 729 and 730:
688 Technical Analysis of Stock Tre
- Page 732 and 733:
Index Principal references are give
- Page 734 and 735:
Index 693 (see Head-and-Shoulders)
- Page 736 and 737:
Index 695 versus speculative stocks
- Page 738 and 739:
Index 697 Formation, 671 (see Patte
- Page 740 and 741:
Index 699 Support, 430 et seq. (see
- Page 742 and 743:
Index 701 Monthly charts, 9, 11, 89
- Page 744 and 745:
Index 703 gains and losses, 578-9 s
- Page 746 and 747:
Index 705 (see Ascending Triangle)
- Page 748 and 749:
Index 707 Symmetrical Triangle, 96-
- Page 750:
Index 709 W commodities/futures, 60