Dynamic properties of shear thickening colloidal suspensions
Dynamic properties of shear thickening colloidal suspensions
Dynamic properties of shear thickening colloidal suspensions

You also want an ePaper? Increase the reach of your titles
YUMPU automatically turns print PDFs into web optimized ePapers that Google loves.
206<br />
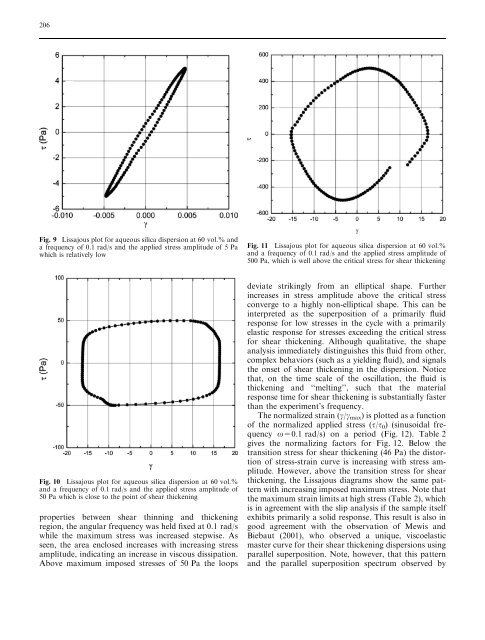
Fig. 9 Lissajous plot for aqueous silica dispersion at 60 vol.% and<br />
a frequency <strong>of</strong> 0.1 rad/s and the applied stress amplitude <strong>of</strong> 5 Pa<br />
which is relatively low<br />
Fig. 10 Lissajous plot for aqueous silica dispersion at 60 vol.%<br />
and a frequency <strong>of</strong> 0.1 rad/s and the applied stress amplitude <strong>of</strong><br />
50 Pa which is close to the point <strong>of</strong> <strong>shear</strong> <strong>thickening</strong><br />
<strong>properties</strong> between <strong>shear</strong> thinning and <strong>thickening</strong><br />
region, the angular frequency was held fixed at 0.1 rad/s<br />
while the maximum stress was increased stepwise. As<br />
seen, the area enclosed increases with increasing stress<br />
amplitude, indicating an increase in viscous dissipation.<br />
Above maximum imposed stresses <strong>of</strong> 50 Pa the loops<br />
Fig. 11 Lissajous plot for aqueous silica dispersion at 60 vol.%<br />
and a frequency <strong>of</strong> 0.1 rad/s and the applied stress amplitude <strong>of</strong><br />
500 Pa, which is well above the critical stress for <strong>shear</strong> <strong>thickening</strong><br />
deviate strikingly from an elliptical shape. Further<br />
increases in stress amplitude above the critical stress<br />
converge to a highly non-elliptical shape. This can be<br />
interpreted as the superposition <strong>of</strong> a primarily fluid<br />
response for low stresses in the cycle with a primarily<br />
elastic response for stresses exceeding the critical stress<br />
for <strong>shear</strong> <strong>thickening</strong>. Although qualitative, the shape<br />
analysis immediately distinguishes this fluid from other,<br />
complex behaviors (such as a yielding fluid), and signals<br />
the onset <strong>of</strong> <strong>shear</strong> <strong>thickening</strong> in the dispersion. Notice<br />
that, on the time scale <strong>of</strong> the oscillation, the fluid is<br />
<strong>thickening</strong> and ‘‘melting’’, such that the material<br />
response time for <strong>shear</strong> <strong>thickening</strong> is substantially faster<br />
than the experiment’s frequency.<br />
The normalized strain (c/cmax) is plotted as a function<br />
<strong>of</strong> the normalized applied stress (s/s0) (sinusoidal frequency<br />
x=0.1 rad/s) on a period (Fig. 12). Table 2<br />
gives the normalizing factors for Fig. 12. Below the<br />
transition stress for <strong>shear</strong> <strong>thickening</strong> (46 Pa) the distortion<br />
<strong>of</strong> stress-strain curve is increasing with stress amplitude.<br />
However, above the transition stress for <strong>shear</strong><br />
<strong>thickening</strong>, the Lissajous diagrams show the same pattern<br />
with increasing imposed maximum stress. Note that<br />
the maximum strain limits at high stress (Table 2), which<br />
is in agreement with the slip analysis if the sample itself<br />
exhibits primarily a solid response. This result is also in<br />
good agreement with the observation <strong>of</strong> Mewis and<br />
Biebaut (2001), who observed a unique, viscoelastic<br />
master curve for their <strong>shear</strong> <strong>thickening</strong> dispersions using<br />
parallel superposition. Note, however, that this pattern<br />
and the parallel superposition spectrum observed by