assessing the transportation needs of welfare-to-work participants in ...
assessing the transportation needs of welfare-to-work participants in ...
assessing the transportation needs of welfare-to-work participants in ...

You also want an ePaper? Increase the reach of your titles
YUMPU automatically turns print PDFs into web optimized ePapers that Google loves.
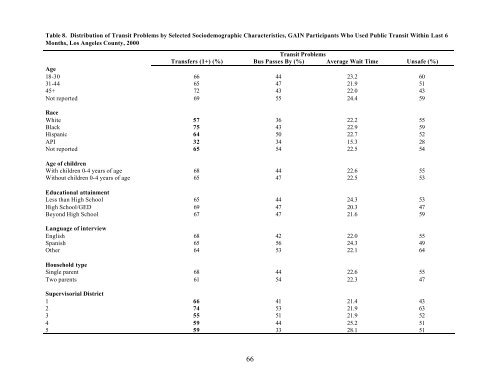
Table 8. Distribution <strong>of</strong> Transit Problems by Selected Sociodemographic Characteristics, GAIN Participants Who Used Public Transit With<strong>in</strong> Last 6<br />
Months, Los Angeles County, 2000<br />
Transit Problems<br />
Transfers (1+) (%) Bus Passes By (%) Average Wait Time Unsafe (%)<br />
Age<br />
18-30 66 44 23.2 60<br />
31-44 65 47 21.9 51<br />
45+ 72 43 22.0 43<br />
Not reported 69 55 24.4 59<br />
Race<br />
White 57 36 22.2 55<br />
Black 75 43 22.9 59<br />
Hispanic 64 50 22.7 52<br />
API 32 34 15.3 28<br />
Not reported 65 54 22.5 54<br />
Age <strong>of</strong> children<br />
With children 0-4 years <strong>of</strong> age 68 44 22.6 55<br />
Without children 0-4 years <strong>of</strong> age 65 47 22.5 53<br />
Educational atta<strong>in</strong>ment<br />
Less than High School 65 44 24.3 53<br />
High School/GED 69 47 20.3 47<br />
Beyond High School 67 47 21.6 59<br />
Language <strong>of</strong> <strong>in</strong>terview<br />
English 68 42 22.0 55<br />
Spanish 65 56 24.3 49<br />
O<strong>the</strong>r 64 53 22.1 64<br />
Household type<br />
S<strong>in</strong>gle parent 68 44 22.6 55<br />
Two parents 61 54 22.3 47<br />
Supervisorial District<br />
1 66 41 21.4 43<br />
2 74 53 21.9 63<br />
3 55 51 21.9 52<br />
4 59 44 25.2 51<br />
5 59 33 28.1 51<br />
66