PDF file - Facultatea de Chimie şi Inginerie Chimică
PDF file - Facultatea de Chimie şi Inginerie Chimică
PDF file - Facultatea de Chimie şi Inginerie Chimică

You also want an ePaper? Increase the reach of your titles
YUMPU automatically turns print PDFs into web optimized ePapers that Google loves.
CHEMIA<br />
1/2008
Studia Universitatis Babes-Bolyai Chemia has been selected for coverage<br />
in Thomson Reuters products and custom information services. Beginning<br />
with V. 53 (1) 2008, this publication will be in<strong>de</strong>xed and abstracted in the<br />
following:<br />
• Science Citation In<strong>de</strong>x Expan<strong>de</strong>d (also known as SciSearch ® )<br />
• Chemistry Citation In<strong>de</strong>x ®<br />
• Journal Citation Reports/Science Edition
ANUL LIII 2008<br />
S T U D I A<br />
UNIVERSITATIS BABE-BOLYAI<br />
CHEMIA<br />
1<br />
Desktop Editing Office: 51 ST B.P. Has<strong>de</strong>u Street, Cluj-Napoca, Romania, Phone + 40 264-405352<br />
CUPRINS – CONTENT – SOMMAIRE – INHALT<br />
In memoriam prof. dr. Liviu Oniciu.......................................................... 3<br />
S. VARVARA, B. FABBRI, S. GUALTIERI, P. RICCIARDI, M. GLIGOR,<br />
Archaeometric Characterisation of the Neolithic Pottery Discovered<br />
at Alba Iulia-Lumea Noua Archaeological Site (Romania) ..................... 5<br />
D.GLIGOR, L. MURESAN, I. C. POPESCU, C. CRISTEA, G. CORMOS,<br />
Synthesis and Electrochemical Behaviour of Bis-(10-Ethylphenothiazinyl)-Phenylmethane........................................................................<br />
15<br />
A. NICOARA, Mott-Schottky Analysis of Electro<strong>de</strong>posited ZnS Thin<br />
Films ................................................................................................... 23<br />
N. BONCIOCAT, About the Possibility of Using the Electrochemical<br />
Impedance Spectroscopy as a Method of Classifying the Drugs ......... 31<br />
C. ROBA, L. D. BOBOS, A. OLTEAN, I.-O. MARIAN, B.-R.-H. MISCA,<br />
D. MANCIULA, Photoconductive Properties of CdS Electro<strong>de</strong>posited<br />
Thin Films ........................................................................................... 43<br />
D. MANCIULA, I.-O. MARIAN, B.-R.-H. MICA, Nano- and Microparticle<br />
Distribution on Solid and Flexible Substrates – Part I .......................... 49
D. GLIGOR, E. CSOREGI, I. C. POPESCU, Amperometric Biosensor<br />
for Ethanol Based on a Phenothiazine Derivative Modified Carbon<br />
Paste Electro<strong>de</strong>................................................................................... 55<br />
A.-M. TODEA, L. M. MUREAN, I. C. POPESCU, Caractérisation<br />
operationnelle d’un biocapteur amperometrique pour la <strong>de</strong>tection <strong>de</strong><br />
l’anion nitrate....................................................................................... 63<br />
L. MUREAN, K. J. ZOR, M. NISTOR, E. CSÖREGI, I. C. POPESCU,<br />
Amperometric Biosensors for Glucose and Ethanol Determination in<br />
Wine Using Flow Injection Analysis ..................................................... 71<br />
E. M. RUS, D. M. CONSTANTIN, G. ARLUNG, Pasted Nickel<br />
Electro<strong>de</strong>s for Alkaline Batteries.......................................................... 81<br />
A. KELLENBERGER, N. VASZILCSIN, N. DUEANU, M.L. DAN, W.<br />
BRANDL, Structure, Morphology and Electrochemical Properties of<br />
High Surface Area Copper Electro<strong>de</strong>s Obtained by Thermal<br />
Spraying Techniques........................................................................... 89<br />
S.-A. DORNEANU, B. FERENCZ-LÁSZLÓ, P. ILEA, Electro<strong>de</strong>position<br />
of Some Heavy Metals on Reticulated Vitreous Carbon Electro<strong>de</strong> ...... 97<br />
G. L. TURDEAN, C. FRCA, A. F. PALCU, M. S. TURDEAN, Electrochemistry<br />
of Iron (III) Protoporphyrin (IX) Solution at Graphite Electro<strong>de</strong>...105<br />
L. VARVARI, I. C. POPESCU, S. A. DORNEANU, New [4.4.4.4]Cyclophane<br />
as Ionophore for Ion-Selective Electro<strong>de</strong>s......................................... 113<br />
L. ANICAI, A. COJOCARU, A. FLOREA, T. VISAN, Electrochemical<br />
Investigation of Silver / Silver Ion Couple Reversibility in Choline<br />
Chlori<strong>de</strong> - Urea Based Ionic Liquid.................................................... 119<br />
M. JITARU, M. TOMA, Electroreduction of Carbon Dioxi<strong>de</strong> to Formate<br />
on Bronze Electro<strong>de</strong>.......................................................................... 135<br />
M. TOMOAIA-COTISEL, O. HOROVITZ, O. BOROSTEAN, L.-D. BOBOS,<br />
G. TOMOAIA, A. MOCANU, T.YUPSANIS, Kinetic and Thermodynamic<br />
Characterization of Protein Adsorption at Fluid Interfaces ................. 143
STUDIA UNIVERSITATIS BABE-BOLYAI, CHEMIA, LIII, 1, 2008<br />
IN MEMORIAM<br />
Profesor Doctor Docent LIVIU ONICIU<br />
Profesor Liviu Oniciu was born on 11 th of February 1927 in Cluj. He<br />
got an excellent high school education in both, literary and scientific directions,<br />
at the Pedagogical Seminar of the Cluj University (1946). He graduated the<br />
Faculty of Science of “Victor Babe” University in Cluj (1950), becoming an<br />
assistant at the Chair of Physical Chemistry of this faculty. He retired in<br />
1997, at the age of 70, but he continued to work as a consulting Professor,<br />
until the last days of his life (27 th of November 1999).<br />
In his remarkable teaching period, he was: lecturer (1961), associated<br />
professor (1965), full professor (1970), Dean of the Faculty of Chemistry<br />
(11 years), Head of the Department of Physical Chemistry (14 years), member<br />
of Faculty Council (32 years), member of the University Senate (24 years).<br />
In 1984, he received the Award of the Excellence in Teaching, from the<br />
Ministry of Education.
4<br />
IN MEMORIAM: Profesor Doctor Docent LIVIU ONICIU<br />
In his outstanding scientific period, he become: PhD (1961), ScD (1971),<br />
PhD advisor (since 1969), and he received the “Nicolae Teclu” prise from<br />
the Romanian Aca<strong>de</strong>my of Science (1980).<br />
Profesor Liviu Oniciu was: Director of the Cluj-section of the Institute<br />
of Chemical and Biochemical Energetics (10 years), Director of the Research<br />
Centre in Electrochemistry at the Babe-Bolyai University (9 years), member<br />
of the International Society of Electrochemistry (I S E), the American Society<br />
of Electrochemistry, the Council of European Aca<strong>de</strong>my of Surface Technology,<br />
and as a proof of his recognition at the international level. I mention that I S E<br />
has elected him to be the representative of Romanian group of electrochemistry<br />
in ISE.<br />
Professor Liviu Oniciu wrote 6 books (two of them abroad), 8<br />
monographs (one of them translated abroad), 19 patents and more than<br />
220 scientific papers.<br />
Prof. Liviu Oniciu was the foun<strong>de</strong>r of the prestigious School of<br />
Electrochemistry from Cluj, recognized in our country as being the most<br />
important school in “Electrochemical Conversion of Energy”.<br />
As research directions I mention: anodic oxidation of methanol<br />
on various electrocatalysts, the fuel cells: hydrazine/ hydrogen peroxi<strong>de</strong>,<br />
hydrogen/oxygen, the alkaline batteries Ni-Fe; Ni-Cd, as well as Na-S battery<br />
and batteries with Li ano<strong>de</strong>.<br />
One must also mention the results obtained in applied electrochemistry<br />
by the Cluj-Section of the Institute of Chemical and Biochemical Energetics<br />
(10 years), namely: organic electrosynthesis, electro<strong>de</strong>position of metals, and<br />
photoelectrochemical conversion of energy.<br />
Finally, we must un<strong>de</strong>rline that prof. Liviu Oniciu was a visionary<br />
scientist and due to this quality he was able to orient his coworkers towards<br />
scientific directions which will become important in millennium III, as for<br />
instance: fundamentals and applications of Electrochemical (and<br />
Electrochemical –Hydrodynamical) Impedance Spectroscopy in: Chemistry,<br />
Biochemistry, Pharmacy and Biology; Biosensors; mo<strong>de</strong>rn electrochemical<br />
methods in studying the drugs and their therapeutic effects, just to indicate<br />
some of those which are already in <strong>de</strong>velopment at Cluj.<br />
Prof. Liviu Oniciu died in 1999, but his name will live as much as the<br />
Electrochemical Science in our country.<br />
May he rest in peace.<br />
Prof. dr. ing. Nicolae Bonciocat<br />
Prof. dr. Ionel Ctlin Popescu
STUDIA UNIVERSITATIS BABE-BOLYAI, CHEMIA, LIII, 1, 2008<br />
In memoriam prof. dr. Liviu Oniciu<br />
ARCHAEOMETRIC CHARACTERISATION OF THE NEOLITHIC<br />
POTTERY DISCOVERED AT ALBA IULIA-LUMEA NOUA<br />
ARCHAEOLOGICAL SITE (ROMANIA)<br />
SIMONA VARVARA a,* , BRUNO FABBRI b , SABRINA GUALTIERI b ,<br />
PAOLA RICCIARDI b , MIHAI GLIGOR a<br />
ABSTRACT. A set of 21 Neolithic painted pottery fragments belonging to<br />
the Lumea Noua culture (5th millennium B.C.) and discovered at Alba Iulia-<br />
Lumea Noua (Romania) settlement were investigated in or<strong>de</strong>r to elucidate<br />
some aspects concerning the manufacturing technique used for the ancient<br />
pottery production. The chemical, microstructural and petrographic features<br />
of the ceramic bodies were <strong>de</strong>termined by X-ray fluorescence, X-ray diffraction<br />
and optical microscopy. The preliminary obtained data were used to make<br />
inferences concerning the pottery’s technology in terms of type of raw clays<br />
and firing temperatures.<br />
Keywords: pottery, Neolithic, Romania, X-ray fluorescence, X-ray diffraction,<br />
optical microscopy<br />
INTRODUCTION<br />
Pottery analysis plays an important and multi-faceted role in the<br />
interpretation of an archaeological site, being the fundamental tool used by<br />
archaeologists for dating sites or for <strong>de</strong>termining trading patterns, cultural<br />
exchanges between peoples and social structures.<br />
In the last <strong>de</strong>ca<strong>de</strong>s, an impressive range of analytical techniques (i.e.<br />
X-ray fluorescence, neutron activation analysis, SEM-EDS, X-ray diffraction,<br />
etc.) have been exploited with consi<strong>de</strong>rable success to produce <strong>de</strong>tailed<br />
“fingerprints” that can be used to ascertain the provenance and to reconstruct<br />
the technologies used in the manufacture of the ancient artefacts [1].<br />
Contrary to other European regions, in Romania only very few<br />
investigations on prehistoric pottery have been ma<strong>de</strong> using mo<strong>de</strong>rn<br />
techniques [2-3]. Consequently, in spite of the large quantities of ancient<br />
ceramic material collected from archaeological excavations, there are still<br />
many unknown aspects about the origin and production techniques of the<br />
prehistoric pottery discovered on the actual Romanian territory.<br />
a “1 Decembrie 1918” University, Dept. of Topography, 11-13 Nicolae Iorga St., 510009 Alba Iulia,<br />
ROMANIA. *E-mail: svarvara@uab.ro<br />
b CNR, Institute of Science and Technology for Ceramics, 64 Via Granarolo, 48018 Faenza,<br />
Italy. E-mail: bruno.fabbri@istec.cnr.it
6<br />
S. VARVARA, B. FABBRI, S. GUALTIERI, P. RICCIARDI, M. GLIGOR<br />
In the last years, one of the most controversial issues of the Romanian<br />
archaeology was related to a Neolithic painted ceramic material belonging<br />
to the “Lumea Noua” culture (first half of the 5 th Millennium B. C.). “Lumea<br />
Noua” pottery was found in relatively small quantities in few settlements<br />
(Alba Iulia-Lumea Noua, Limba, Tartaria, Zau <strong>de</strong> Campie, Cheile Turzii) from<br />
Transylvania and the painted <strong>de</strong>coration patterns show strong analogies<br />
with the ceramic finds from Slovakia (Bükk and Raškovce cultures) [4],<br />
Hungary (Esztár and Bükk cultures) [5] and Ukraine (Diakovo culture) [6],<br />
and North-Western of Romania (Piscolt group) [7].<br />
The present study is part of a systematic archaeometric investigation on<br />
“Lumea Noua” pottery discovered at Alba Iulia-Lumea Noua settlement aiming<br />
at establishing its production technology in terms of the raw materials used,<br />
forming and firing procedures. The selected pottery samples were studied<br />
by X-ray fluorescence, X-ray diffraction and optical microscopy in or<strong>de</strong>r to<br />
obtain chemical, mineralogical and petrographic information.<br />
RESULTS AND DISCUSSION<br />
Thin-sections analysis (texture and mineralogy)<br />
The observation of the thin-section of the samples un<strong>de</strong>r the polarizing<br />
microscope revealed that the 21 “Lumea Noua” potsherds display aplastic<br />
inclusions of various type, abundance and grain-size. Moreover, different<br />
types of relicts of micro-fossils (i.e. bioclasts, bivalve, algae and foraminifera)<br />
have been i<strong>de</strong>ntified.<br />
According to the absence or presence of the fossil relics, the “Lumea<br />
Noua” potteries have been grouped into two main “petrographic groups”.<br />
Besi<strong>de</strong> bioclasts, the abundance, type and size of aplastic inclusions are<br />
other parameters used to ascertain the groups.<br />
Group 1 consists of 9 pottery samples (LN1 – LN 9) which do not<br />
enclose bioclasts in their ceramic body (Figure 1).<br />
(a) (b)<br />
Figure 1. Thin-section of the ceramic bodies of the pottery samples belonging to<br />
group 1: (a) LN 1; (b) LN6 (40x; parallel nicol).
ARCHAEOMETRIC CHARACTERISATION OF THE NEOLITHIC POTTERY DISCOVERED AT ALBA IULIA<br />
These samples are characterized by an inhomogeneous and mainly<br />
anisotropic matrix, which contains argillaceous rock fragments. The skeleton<br />
has a sandy texture; the aplastic inclusions are around 15-20% of the ceramic<br />
body. Their mineralogical composition is represented by quartz (mono- and<br />
polycrystalline), mica (biotite or muscovite), small amounts of K-feldspars and<br />
plagioclase.<br />
Group 2 inclu<strong>de</strong>s 12 samples (LN 10 - LN 21) which contain different<br />
types of relicts of fossils in their ceramic body (Figure 2).<br />
(a) (b)<br />
Figure 2. Thin-section of the ceramic bodies of the pottery samples belonging to<br />
the group 2: (a) LN 18; (b) LN19 (40x; parallel nicol)<br />
The samples in group 2 have a semi-isotropic to isotropic groundmass,<br />
orange-yellow to reddish-brown in colour. Many samples have a sandwichlike<br />
structure from the colour point of view, which suggests that the firing<br />
atmosphere was not sufficiently oxidizing. A characteristic of the samples<br />
belonging to the group 2 is represented by the presence of a relatively high<br />
macro-porosity. The pores are roun<strong>de</strong>d, have big dimensions and are seldom<br />
filled with secondary calcite. The roun<strong>de</strong>d pores suggest that the artefacts<br />
were shaped by hands. The mineral composition of the temper is given by<br />
quartz (mono- and polycrystalline), micas, plagioclase, K-feldspars and rare<br />
and partially <strong>de</strong>composed carbonatic rock fragments.<br />
Un<strong>de</strong>r the polarizing microscope the white or light yellow slips observed<br />
on all “Lumea Noua” pottery appear as thin layers with thicknesses varying<br />
mostly between 100 and 120 m. The thickness of the <strong>de</strong>coration layer<br />
varies between 10 and 20 m.<br />
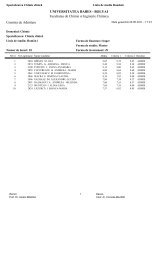
Chemical composition of the ceramic bodies<br />
The chemical composition of the ceramic bodies was <strong>de</strong>termined by<br />
XRF analysis and the measured elements were Na, Mg, Al, Si, K, Ca, Ti, Fe,<br />
Mn and P expressed as oxi<strong>de</strong> percentages (w/w). The P2O5 concentration<br />
exhibits values in a restricted range (0.18-0.50 %), except for samples<br />
LN 10 (0.95%) and LN 16 (1.37%), suggesting a possible post-<strong>de</strong>positional<br />
contamination with phosphorous during burial [8].<br />
7
8<br />
S. VARVARA, B. FABBRI, S. GUALTIERI, P. RICCIARDI, M. GLIGOR<br />
The IL values vary over a not very wi<strong>de</strong> range, mainly between 1 and<br />
3%, approximately. Only three samples show higher values, LN 1 (4.56%),<br />
LN 16 (6.63%) and LN 15 (6.57%), probably due to the fact that they were<br />
partially rehydrated during burial.<br />
In or<strong>de</strong>r to make accurate comparisons between the chemical<br />
composition of different pottery and raw clays, the analytical data were<br />
normalised by excluding the IL and P2O5 values (Table 1). The silica content<br />
of the ceramic bodies is situated in the range of 61 to 73%, while the amount<br />
of alumina and iron oxi<strong>de</strong> varies from 14.7 to 20% for Al2O3 and from 4.9 to<br />
8% for Fe2O3. Most of the samples are characterized by a relatively low<br />
content of CaO (1.26 – 3.47%) and MgO (around 2%). In three samples<br />
(LN 2, LN 8, LN 11) the amount of CaO is around 4.8%, while sample LN 18<br />
shows the highest concentration of calcium oxi<strong>de</strong> (6.2%). All the samples<br />
present a low content of sodium (
ARCHAEOMETRIC CHARACTERISATION OF THE NEOLITHIC POTTERY DISCOVERED AT ALBA IULIA<br />
As it regards the raw clay samples, it is evi<strong>de</strong>nt that they are very<br />
different to each other. For example, silica and alumina contents of the<br />
samples LC, BC and RC are very similar to those of the pottery, while the<br />
sample YC exhibits a very high concentration over 80% of silica and a very<br />
low value of alumina (about 12%).<br />
In or<strong>de</strong>r to compare the chemical data relative to the two groups of<br />
potsherds with those of local raw materials, variation diagrams between<br />
pairs of significant elements were used (Figure 3).<br />
Al 2 O 3 (wt %)<br />
MgO (wt %)<br />
25<br />
20<br />
15<br />
10<br />
60 65 70 75<br />
SiO (wt %)<br />
2<br />
80 85<br />
3<br />
2<br />
1<br />
0<br />
0 1 2 3 4 5<br />
CaO (wt %)<br />
6 7<br />
TiO 2 (wt %)<br />
Na 2 O (wt %)<br />
1.2<br />
1.0<br />
0.8<br />
0.6<br />
1.5<br />
1.0<br />
0.5<br />
3 4 5 6 7 8 9<br />
Fe O (wt %)<br />
2 3<br />
0.0<br />
0 1 2<br />
K O (wt %)<br />
2<br />
3 4<br />
Figure 3. Chemical composition of the samples belonging to the two groups and of<br />
the raw clays represented in different binary diagrams: () Group 1; () Group 2;<br />
() LC; () BC; () RC; () YC.<br />
The results of the two ceramic groups show that the samples are<br />
chemically heterogeneous, and they do not evi<strong>de</strong>nce the two groups obtained<br />
by petrographic examination.<br />
The differences in the chemical composition of the pottery samples allow<br />
rejecting the hypothesis of the use of a unique but very heterogeneous sediment<br />
for the pottery-making. The more reliable hypotheses are the following:<br />
(i) two sources of raw clay materials, with and without microfossils<br />
respectively, were used with the addition of the same type of temper;<br />
(ii) it was a unique source of raw clay material, not containing microfossils,<br />
which is modified adding temper with or without microfossils.<br />
9
10<br />
S. VARVARA, B. FABBRI, S. GUALTIERI, P. RICCIARDI, M. GLIGOR<br />
The comparison between pottery and clays does not show any overlap<br />
for RC and YC, while LC and BC should not be retained incompatible,<br />
especially if we take into account that the introduction of temper can modify<br />
the whole chemical composition in a significant way. But it is obvious that<br />
<strong>de</strong>eper investigations on the local clays composition are required in or<strong>de</strong>r to<br />
i<strong>de</strong>ntify the correct hypothesis.<br />
In a previous study [9] it has been established that the slip of the “Lumea<br />
Noua” pottery consists of carbonatic clay with a high content of illite, while<br />
iron-rich materials have been used for the painted <strong>de</strong>corations.<br />
Mineralogical composition of the ceramic bodies<br />
The mineral phases i<strong>de</strong>ntified in the XRD patterns of representative<br />
pottery samples from each petrographic group are reported in Table 2.<br />
Clay<br />
Group 1<br />
Group 2<br />
Table 2.<br />
Mineralogical composition of the “Lumea Noua” pottery samples and of the raw<br />
materials as <strong>de</strong>termined from the XRD patterns<br />
Sample Qtz Ill Chl Cc K Pl Kfs<br />
Other<br />
phases<br />
Temp<br />
( 0 C)<br />
LC xxxx xx xx xx tr. xx tr. Mo (tr.) ----<br />
BC xxx x - x tr. - x - ----<br />
RC xxx tr. - - xx - - Go (tr.) ----<br />
YC xxxx tr. - - xx - - - ----<br />
LN 1 xxxx x - - - xx x Mo 700-800<br />
LN 6 xxxx xx - - - xx - He 850-900<br />
LN 7 xxxx x tr. - tr. xx tr. - ~600<br />
LN 8 xxxx x - - - x x - 850-900<br />
LN 10<br />
xxxx xx - x - xx x Do (tr.) 600-700<br />
LN 11 xxxx xx - x - x - Do 600-700<br />
LN 12 xxxx x - - - x x - 850-900<br />
LN 18 xxxx x - - - xx - - 850-900<br />
LN 21 xxxx xx - - - xx x - 850-900<br />
Gr. – group; Qtz – quartz; Ill – illite; Chl – chlorite; Cc – calcite; Pl – plagioclase; K – kaolinite;<br />
Kfs – K-feldspar; Mo – Montmorillonite Do – dolomite; He – hematite; Go – goethite; tr. – traces.<br />
It is well known that during firing the clays <strong>de</strong>compose and chemical<br />
reactions occur which lead to the formation of new microcrystalline mineral<br />
phases, which <strong>de</strong>pend mainly on the composition of clays, the kiln atmosphere<br />
and the firing temperature [10]. The firing temperatures can be estimated by<br />
the mineralogy of the potsherd bodies, assuming that the phase association<br />
present in the sample reflects the one formed during firing and that no<br />
important changes occurred during burial.
ARCHAEOMETRIC CHARACTERISATION OF THE NEOLITHIC POTTERY DISCOVERED AT ALBA IULIA<br />
A temperature interval was assigned to each of the investigated<br />
potsherds on the basis of the minerals present in the assemblage i<strong>de</strong>ntified<br />
by XRD and taking into consi<strong>de</strong>ration the thin-section observations.<br />
As can be seen from Table 2, many investigated “Lumea Noua” samples<br />
were fired at 850-900 0 C. In the case of LN 10 and LN 11, the absence of<br />
chlorite and the contemporaneous presence of dolomite and calcite indicate<br />
a low firing temperature between 600 and 700 0 C.<br />
Since kaolinite loses its stability rather abruptly at 550–600 0 C, for sample<br />
LN 7 a lower firing temperature (around 600 0 C) was hypothesized.<br />
EXPERIMENTAL SECTION<br />
Description of the pottery samples<br />
A set of 21 pottery fragments belonging to the “Lumea Noua” culture,<br />
were selected as experimental samples. They were supplied from the collection<br />
of the “1 Decembrie 1918” University. Examples of “Lumea Noua” potsherds<br />
are presented in Figure 4.<br />
LN 1 LN 10 LN 18 N 1<br />
Figure 4. Examples of pottery samples belonging to “Lumea Noua” culture<br />
Macroscopically, the potsherds consisting of rim or fragment of vessels<br />
are covered with a white or a white-yellowish slip and <strong>de</strong>corated with red,<br />
red-orange to purple or brown bands or geometrical mo<strong>de</strong>ls. In some cases,<br />
parallel black lines are also drawn on the slip.<br />
In addition, four samples of different local clays, named “Limba Clay”<br />
(LC), “Brown Clay” (BC), “Red Clay” (RC) and “Yellow Clay” (YC), originating<br />
from natural <strong>de</strong>posits situated in the surroundings of the archaeological site<br />
have also been investigated.<br />
Methods<br />
All samples were analyzed from the petrographic, chemical and<br />
mineralogical points of view.<br />
11
12<br />
S. VARVARA, B. FABBRI, S. GUALTIERI, P. RICCIARDI, M. GLIGOR<br />
The microscopic examination by transmitted polarized light was carried<br />
out on pottery thin-sections using a Leitz Laborlux 11 POL optical microscope.<br />
The main goal was to discriminate among groups of pottery having similar<br />
“ceramic fabrics”.<br />
The chemical composition of the ceramic bodies (for major and minor<br />
elements) and of the raw clays was <strong>de</strong>termined using a Philips PW 1480 XRF<br />
spectrometer. The test specimens were obtained by cutting small pieces<br />
from each ceramic fragment. After removing the slip and <strong>de</strong>coration layers<br />
by a lancet, the cut pieces were ground to pow<strong>de</strong>r in an agate mortar and a<br />
quantity of 0.5 grams of pow<strong>de</strong>r was used to prepare the tablets by pressing it<br />
on a boric acid support at approximately 2000 kg/cm 2 . The chemical data<br />
were completed by <strong>de</strong>termining the ignition loss (IL) of the dried sample after<br />
calcination at 1000 0 C.<br />
The mineral composition was estimated using a SIEMENS X-ray<br />
diffractometer with copper anticatho<strong>de</strong>, scanning an angular range between<br />
4° and 64° 2 with a step of 2°/min.<br />
CONCLUSIONS<br />
The results of the archaeometrical investigations on “Lumea Noua”<br />
artefacts allowed the individualization of two different types of ceramic body<br />
with and without microfossils respectively. In spite of this, all the artefacts<br />
could be probably retained of local provenance.<br />
The samples are chemically heterogeneous, suggesting that different<br />
starting raw clay materials were used for their production.<br />
Archaeometric data allowed “reconstructing” the stages used to produce<br />
the “Lumea Noua” artefacts; the proposed flow-manufacturing processes<br />
consists of: (i) preparation of the paste by mixing raw clays, (probably illitic<br />
clays) with temper (quartz - feldspatic sand) and water; (ii) shaping the clays<br />
by hands pressure; (iii) smoothening and partial drying; (iv) application of<br />
the slip, consisting very probably of a fine-grained carbonatic clay with high<br />
illite content; (v) polishing the surface; (vi) painting using iron-rich materials;<br />
(vii) final drying and (viii) firing at temperatures between 600 and 900 0 C.<br />
Further and more <strong>de</strong>tailed investigations on different clays sources<br />
and on other “Lumea Noua” pottery collected from the archaeological sites<br />
from Transylvania will allow us to i<strong>de</strong>ntify the raw materials used and to<br />
ascertain exactly their origin or to discriminate between sources.<br />
ACKNOWLEDGEMENTS<br />
The financial support from COST G8 (STSM-G8-01426/2005) and CNCSIS<br />
(A/640/2004-2007) is gratefully acknowledged.
ARCHAEOMETRIC CHARACTERISATION OF THE NEOLITHIC POTTERY DISCOVERED AT ALBA IULIA<br />
REFERENCES<br />
1. H. Mommsen, Journal of Radioanalytical and Nuclear Chemistry, 2001, 247, 657.<br />
2. G. Lazarovici, L. Ghergari, C. Ionescu, Angvstia, 2002, 7, 7.<br />
3. A. Goleanu, A. Marian, M. Gligor, C. Florescu, S. Varvara, Revue Roumaine <strong>de</strong><br />
<strong>Chimie</strong>, 2005, 11-12, 939.<br />
4. J. Lichardus, Studijné Zvesti. Archeologickeho ústavu Slovenskej académie vied.<br />
Nitra, 1969, 17, 219.<br />
5.G. Goldman, J. G. Szénásky, Nyíregyháza, 1994, XXXVI, 225.<br />
6. M. Potushniak, Nyíregyháza, 1997, XXXIX, 35.<br />
7. Gh. Lazarovici, J. Németi, Acta Musei Porolissensis, 1983, VII, 17.<br />
8. B. Fabbri, G. Guarini, E. Arduino, M. Coghe, Proceeding of 1st European workshop<br />
on archaeological ceramics, Roma, Italy, 1994, 183.<br />
9 P. Ricciardi, S. Varvara, B. Fabbri, S. Gualtieri, M. Gligor, Proceeding of 10a<br />
Giornata di Archeometria <strong>de</strong>lla Ceramica, Roma, Italy, 2006 (in press).<br />
10. C. Rathossi, P. T. Katagas, C. Katagas, Journal of Applied Clay Science, 2004, 24,<br />
313.<br />
13
STUDIA UNIVERSITATIS BABE-BOLYAI, CHEMIA, LIII, 1, 2008<br />
In memoriam prof. dr. Liviu Oniciu<br />
SYNTHESIS AND ELECTROCHEMICAL BEHAVIOUR OF<br />
BIS-(10-ETHYLPHENOTHIAZINYL)-PHENYLMETHANE<br />
DELIA GLIGOR a , LIANA MURESAN a , IONEL CATALIN POPESCU a ,<br />
CASTELIA CRISTEA a , GABRIELA CORMOS b<br />
ABSTRACT. Bis-(10-ethylphenothiazinyl)-phenylmethane was obtained by<br />
the con<strong>de</strong>nsation of 10-ethyl-phenothiazine with benzal<strong>de</strong>hy<strong>de</strong> in the presence<br />
of acid catalysts. The electrochemical behavior of bis-(10-ethylphenothiazinyl)phenylmethane<br />
adsorbed on spectrographic graphite has been investigated.<br />
Cyclic voltammetric measurements performed in aqueous buffer solutions at<br />
different potential scan rates pointed out to a quasi-reversible, surface-confined<br />
redox process, with a negative formal standard potential of -55 mV vs. SCE<br />
(10 mV s -1 ). The voltammetric response involves the transfer of 1e - , with a<br />
heterogeneous rate constant of 18.9 s -1 (pH 7). The modified electro<strong>de</strong>s<br />
showed a good electrochemical stability.<br />
Keywords: 10-alkylphenothiazine, modified electro<strong>de</strong>s, cyclic voltammetry<br />
INTRODUCTION<br />
The con<strong>de</strong>nsation reaction of phenothiazine with aromatic al<strong>de</strong>hy<strong>de</strong>s<br />
(benzal<strong>de</strong>hy<strong>de</strong>, o-, m- and p-nitrobenzal<strong>de</strong>hy<strong>de</strong>) in acid media was already<br />
reported [1]. The mild electrophile generated by the al<strong>de</strong>hy<strong>de</strong> in the presence<br />
of methanesulfonic acid is responsible for the substitution of the phenothiazine<br />
ring and bis-(10H-phenothiazin-3-yl)-methane <strong>de</strong>rivatives were obtained as<br />
major reaction products. 10H-Phenothiazine is characterized by enhanced<br />
reactivity towards electrophilic substitution, but the introduction of alkyl<br />
functional groups at different positions affects both orientation of subsequent<br />
substitution and the overall reactivity [2]. Thus, 10-alkylphenothiazine is<br />
a “slightly <strong>de</strong>activated” substrate for electrophilic substitution. Theoretical<br />
explanations are based on both electronic and steric effects. Due to the sp 3<br />
hybridization state of the two heterocyclic heteroatoms (nitrogen and sulfur),<br />
phenothiazine molecular structure is fol<strong>de</strong>d about S-N axis with a dihedral<br />
angle of about 150 0 [3], influenced by the presence of substituents. According<br />
a “Babe-Bolyai” University, Faculty of Chemistry and Chemical Engineering, 400028 Cluj-Napoca<br />
b “L. Blaga” University, Faculty of Medicine, Sibiu
16<br />
D. GLIGOR, L. MURESAN, I. C. POPESCU, C. CRISTEA, G. CORMOS<br />
to the spatial position of the substituent attached to nitrogen with respect to<br />
the dihedral angle, two distinct configurations may appear as it can be seen<br />
in figure 1.<br />
10H-Phenothiazine is characterized by an “intra” orientation of the<br />
hydrogen atom (by pointing insi<strong>de</strong> with respect to the dihedral angle, figure<br />
1a), while 10-ethylphenothiazine preferentially adopts an “extra” orientation<br />
of the ethyl group due to steric reasons (figure 1b).<br />
N<br />
S<br />
H<br />
H 5C 2<br />
Figure 1. Configurations of phenothiazine <strong>de</strong>rivatives<br />
a) 10H-Phenothiazine, b) 10-Ethylphenothiazine<br />
These two configurations are not electronically equivalent, according<br />
to the possibility of conjugation of the nitrogen lone pair of electrons with<br />
the adjacent benzene system. In 10H-phenothiazine, the transmission of<br />
the electronic effects is very efficient and electrophilic substitution occurs<br />
easily. The reduced participation of the nitrogen lone pair to the exten<strong>de</strong>d <br />
system in 10-ethylphenothiazine structure due to steric hindrance explains<br />
the <strong>de</strong>creased reactivity in electrophilic substitution.<br />
In this paper, we <strong>de</strong>scribe the synthesis of bis-(10-ethylphenothiazin-<br />
3-yl)-phenylmethane (1), a new product obtained by the con<strong>de</strong>nsation between<br />
10-ethylphenothiazine and benzal<strong>de</strong>hy<strong>de</strong>. The electrochemical behavior<br />
and electrochemical stability of 1 adsorbed on spectrographic graphite were<br />
investigated by cyclic voltammetric (CV) measurements performed at different<br />
scan rates. The heterogeneous electron transfer rate constant (ks) was<br />
estimated using Laviron treatment [4].<br />
RESULTS AND DISCUSSIONS<br />
Synthesis<br />
The con<strong>de</strong>nsation of 10H-phenothiazine with benzal<strong>de</strong>hy<strong>de</strong> generated<br />
bis-(10H-phenothiazin-3-yl)-phenylmethane in good yields, when methane<br />
sulfonic acid was employed as catalyst and the reaction mixture was heated to<br />
reflux in ethanol solution [1]. These reaction conditions were modified in<br />
or<strong>de</strong>r to perform the con<strong>de</strong>nsation of less reactive 10-ethylphenothiazine<br />
with benzal<strong>de</strong>hy<strong>de</strong>. Bis-(10-ethylphenothiazin-3-yl)-phenylmethane (1) was<br />
obtained using acetic acid as a solvent (Scheme 1). After refluxing the reaction<br />
mixture several hours, the con<strong>de</strong>nsation product 1 precipitated from the<br />
reaction mixture and was easily separated by filtration.<br />
N<br />
S
SYNTHESIS AND ELECTROCHEMICAL BEHAVIOUR OF BIS-(10-ETHYLPHENOTHIAZINYL)-PHENYLMETHANE<br />
C 2H 5<br />
N<br />
S<br />
C 6H 5-HC=O<br />
H 3C-SO 3H<br />
Scheme 1<br />
The structure assignment of 1 is supported by NMR spectroscopic<br />
data. The presence of the ethyl substituent was revealed by the coupled<br />
signals situated at 1.2 ppm (t, 6H) and 3.1 ppm (q, 4H) and the proton in<br />
the methine bridge generated a singlet signal situated at 3.8 ppm.<br />
Electrochemical behaviour of bis-(10-ethylphenothiazin-3-yl)-phenylmethanemodified<br />
graphite electro<strong>de</strong><br />
The electrochemical behavior of 1 adsorbed on spectrographic<br />
graphite (G/1) was investigated using CV measurements, at different potential<br />
scan rates. As it can be seen from figure 2A, the cyclic voltammogram recor<strong>de</strong>d<br />
for G/1 electro<strong>de</strong> presents a peak pair with the formal standard potential<br />
placed at -55 mV vs. SCE (pH 7). It is the most negative value recor<strong>de</strong>d in<br />
a series of phenothiazine <strong>de</strong>rivatives based on bis-(10Hphenothiazin-3-yl)methane<br />
and bis-(10Hphenothiazin-3-yl)-phenylmethane [5]. This suggests<br />
that compound 1 participates easier to oxidation processes and is explained by<br />
the reduced participation of the nitrogen lone pair to the exten<strong>de</strong>d system<br />
in the 10-ethylphenothiazine unit responsible for redox equilibria. The oxidation<br />
wave (Epa 0/+1 = -43 mV vs. SCE) can be assigned to the radical cation<br />
formation of one phenothiazine unit in the molecular structure. Scheme 2<br />
shows the proposed reaction scheme for the electrochemical processes<br />
occurring during the voltammetric experiments.<br />
C 2H 5<br />
N<br />
S<br />
C 6H 5<br />
C 2H 5<br />
N<br />
S<br />
-1e -<br />
+1e -<br />
Scheme 2<br />
The electrochemical parameter ∆E indicates a quasi-reversible redox<br />
process, taking into consi<strong>de</strong>ration its value of 24 mV, as criterion for the<br />
process reversibility. This value is smaller than those obtained for the related<br />
compounds mentioned above [5], suggesting a more reversible electron<br />
transfer.<br />
C 2H 5<br />
N<br />
S<br />
C 2H 5<br />
N<br />
S<br />
C 6H 5<br />
1<br />
C 2H 5<br />
N<br />
S<br />
C 6H 5<br />
C 2H 5<br />
N<br />
S<br />
17
18<br />
D. GLIGOR, L. MURESAN, I. C. POPESCU, C. CRISTEA, G. CORMOS<br />
The width at half peak height (EFWHM) was different to the corresponding<br />
i<strong>de</strong>al case (EFWHM = 90.6/n mV, where n is the number of electrons). The<br />
observed discrepancies (140 and 33 mV for anodic and cathodic process,<br />
respectively) prove the existence of repulsive interactions between the<br />
adsorbed redox species (radical cations generated in the anodic process)<br />
and attractive ones (neutral molecules or dimers formed during the cathodic<br />
process) [5,6].<br />
As expected for surface confined redox active species [4], the cyclic<br />
voltammograms recor<strong>de</strong>d for a wi<strong>de</strong> range of potential scan rates (0.01 –<br />
0.8 V s -1 ) showed a linear <strong>de</strong>pen<strong>de</strong>nce of the peak currents (Ip) on the<br />
electro<strong>de</strong> potential scan rate (v). The slope of log Ip vs. log v <strong>de</strong>pen<strong>de</strong>nce<br />
was close to one (0.88 ± 0.03 and 0.98 ± 0.04 for anodic and cathodic<br />
process, respectively), confirming once again the existence of adsorbed<br />
species. The number of electrons involved in the redox process, estimated<br />
from Ip vs. v <strong>de</strong>pen<strong>de</strong>nce [7] was found close to 1 (within ± 10%), in accordance<br />
with the predicted value for the cation formation.<br />
I / µA<br />
20<br />
0<br />
-20<br />
A<br />
-500 0 500<br />
E / mV vs. SCE<br />
(E p - E 0' ) / mV vs. SCE<br />
800<br />
400<br />
0<br />
-400<br />
B<br />
0.1 1 10<br />
Log v (V s -1 )<br />
Figure 2. (A) Cyclic voltammograms of graphite electro<strong>de</strong> (---) and of compound 1<br />
adsorbed on graphite (⎯) and (B) experimental <strong>de</strong>pen<strong>de</strong>nce of (Ep - E o’ ) on the<br />
scan rate, corresponding to 1 adsorbed on graphite electro<strong>de</strong>s. Experimental<br />
conditions: starting potential, -500 mV vs. SCE; potential scan rate,<br />
100 mV s -1 (A); supporting electrolyte, 0.1 M phosphate buffer (pH 7).<br />
The heterogeneous electron transfer rate constant (ks, s -1 ) was<br />
estimated at pH 7, using the treatment proposed by Laviron [4] (figure 2B)<br />
and it was found equal to 18.9 s -1 , while the transfer coefficient () was 0.52.<br />
The ks value is higher than those <strong>de</strong>termined for phenothiazine (1.7 s -1 ) [8],<br />
which proves that compound 1 is more active electrochemically than<br />
phenothiazine.
SYNTHESIS AND ELECTROCHEMICAL BEHAVIOUR OF BIS-(10-ETHYLPHENOTHIAZINYL)-PHENYLMETHANE<br />
The stability of modified electro<strong>de</strong>s was tested by measuring the<br />
variation of phenothiazine electrochemical signal in a <strong>de</strong>fined time range. It<br />
is known that the immobilization stability of a compound on graphite<br />
electro<strong>de</strong> is <strong>de</strong>ci<strong>de</strong>d by the number of conjugated aromatic rings from the<br />
molecule. Thus, the electrochemical stability tests of the G/1 were performed<br />
in potentiodynamic conditions: the electro<strong>de</strong> potential was continuously<br />
cycled within the potential range covering the domain of the phenothiazine<br />
redox activity, in phosphate buffer solution, pH 7. From the recor<strong>de</strong>d<br />
voltammograms a progressive <strong>de</strong>crease of the electro<strong>de</strong> surface coverage<br />
was observed, while the voltammogram shape remains invariant (results<br />
not shown). This behaviour proves the G/1 good electrochemical stability<br />
and its relatively strong adsorption on the graphite surface.<br />
The kinetic interpretation of the <strong>de</strong>activation process showed that it<br />
obeys first-or<strong>de</strong>r kinetics. The slopes of kinetic plots were used to <strong>de</strong>termine<br />
the values of the <strong>de</strong>activation rate constants, as an average of the anodic<br />
and cathodic process and a value of 3.45·10 -13 mol cm -2 s -1 was obtained.<br />
The value of <strong>de</strong>activation rate constant is smaller in comparison with other<br />
phenothiazine <strong>de</strong>rivatives, octachloro-phenothiazinyl and heptachloro-hydroxyphenothiazine<br />
(k<strong>de</strong>act = 27.5·10 -10 mol cm -2 s -1 and 1.3·10 -8 mol cm -2 s -1 ,<br />
respectively) [9]. This is due to the structure of 1, which is favorable for<br />
increasing the electrochemical stability of modified graphite electro<strong>de</strong>.<br />
CONCLUSIONS<br />
The con<strong>de</strong>nsation of 10-ethylphenothiazine, a slightly <strong>de</strong>activated<br />
phenothiazine substrate, with benzal<strong>de</strong>hy<strong>de</strong> in the presence of acid catalysts<br />
generated bis-(10-ethylphenothiazin-3-yl)-phenylmethane (1) in good<br />
yields. Modified electro<strong>de</strong>s were prepared by adsorption of 1 on graphite.<br />
Electrochemical data show that oxidation process occurs easier for 1 as<br />
compared to related bis-(10H-phenothiazin-3-yl)-methane <strong>de</strong>rivatives [4], as<br />
well as other <strong>de</strong>rivatives containing phenothiazine units which were previously<br />
studied un<strong>de</strong>r the same conditions [8,9]. The linear <strong>de</strong>pen<strong>de</strong>nce between<br />
peak current (Ip) and the potential scan rate (v) proves the existence of a<br />
redox couple adsorbed on electro<strong>de</strong> surface involving 1e - .<br />
The graphite electro<strong>de</strong>s modified with 1 presented a good electrochemical<br />
stability.<br />
EXPERIMENTAL SECTION<br />
Reagents from Merck were used.<br />
TLC was used to monitor the reaction progress (Merck silica gel F 254 plates).<br />
NMR spectra were recor<strong>de</strong>d using a 300 MHz Brucker NMR spectrometer.<br />
FT-IR spectra were recor<strong>de</strong>d using a Brucker Vector 22 FT-IR spectrometer.<br />
19
20<br />
D. GLIGOR, L. MURESAN, I. C. POPESCU, C. CRISTEA, G. CORMOS<br />
Bis(10-ethylphenothiazin-3-yl)-phenylmethane (1)<br />
10-Ethylphenothiazine 0,5 g (2,5 mmol) was solved in acetic acid (50 mL),<br />
methanesulfonic acid (0.5 mL) was ad<strong>de</strong>d and then benzal<strong>de</strong>hy<strong>de</strong> (1.5 mmol)<br />
was ad<strong>de</strong>d drop wise un<strong>de</strong>r vigorous stirring at room temperature. The reaction<br />
mixture was heated to reflux for 4 hours. The pink precipitate accumulated<br />
was filtered and washed several times with warm methanol; the precipitate was<br />
suspen<strong>de</strong>d in THF and then filtered. 0.4 g pow<strong>de</strong>r was obtained, yield 67%.<br />
1<br />
H-NMR (300MHz, DMSO-d6): δ=1.2 ppm (t, 6H), 3.1ppm (q, 4H), 3.8 ppm<br />
(s, 1H), 6.61-7.2 ppm (m, 19H).<br />
IR (cm -1 ): 3100, 1595, 1487, 1314, 794, 740.<br />
Electro<strong>de</strong> preparation<br />
A spectrographic graphite rod (Ringsdorff-Werke, GmbH, Bonn-Bad Go<strong>de</strong>sberg,<br />
Germany), of ~ 3 mm diameter, was wet polished on fine (grit 400 and 600)<br />
emery paper (Buehler, Lake Bluff, Ill., USA). Then, a graphite piece of suitable<br />
length was carefully washed with <strong>de</strong>ionized water, dried, and finally pressfitted<br />
into a PTFE hol<strong>de</strong>r in or<strong>de</strong>r to obtain a graphite electro<strong>de</strong> having, in<br />
contact with the solution, a flat circular surface of ~ 0.071 cm 2 . The modified<br />
graphite electro<strong>de</strong> was obtained by spreading onto the electro<strong>de</strong> surface 2 µl<br />
of 1 mM <strong>de</strong>rivative 1 solution in dimethylsulfoxi<strong>de</strong>, and leaving them for one<br />
day at room temperature to evaporate the solvent. Before immersion in the test<br />
solution the modified electro<strong>de</strong>s were carefully washed with <strong>de</strong>ionized water.<br />
For each electro<strong>de</strong>, the surface coverage (Γ, mol cm -2 ) was estimated from the<br />
un<strong>de</strong>r peak areas, recor<strong>de</strong>d during the CV measurements at low scan rate<br />
(< 10 mV s -1 ). The presented results are the average of 3 i<strong>de</strong>ntically prepared<br />
electro<strong>de</strong>s.<br />
Electrochemical measurements<br />
CV measurements were carried out in a conventional three-electro<strong>de</strong><br />
electrochemical cell. A saturated calomel electro<strong>de</strong> (SCE) and a coiled Pt<br />
wire served as reference and counter electro<strong>de</strong>, respectively. The cell was<br />
connected to a computer-controlled voltammetric analyzer (Autolab-PGSTAT10,<br />
Eco Chemie, Utrecht, Netherlands). The supporting electrolyte was a 0.1 M<br />
phosphate buffer, pH 7 prepared using K2HPO4·2H2O and KH2PO4·H2O from<br />
Merck (Darmstadt, Germany).<br />
ACKNOWLEDGEMENTS<br />
The authors thank to CNCSIS for financial support (Project ID_512).
SYNTHESIS AND ELECTROCHEMICAL BEHAVIOUR OF BIS-(10-ETHYLPHENOTHIAZINYL)-PHENYLMETHANE<br />
REFERENCES<br />
1. G. Cormo, C. Cristea, I. Filip, I. A. Silberg, Studia Universitatis Babes-Bolyai,<br />
Chemia, 2006, LI, 2, 155.<br />
2. C. Bo<strong>de</strong>a, I. A. Silberg, „Advances in Heterocyclic Chemistry”, Aca<strong>de</strong>mic Press,<br />
1968, vol 9, pp. 430.<br />
3. J.J. H. McDowell, Acta Crystallographica, Section B: Structural Science, 1976,<br />
32, 5.<br />
4. C. Cristea, G. Cormos, D. Gligor, I. Filip, L. Muresan, I. C. Popescu, Journal of<br />
New Materials for Electrochemical Systems, submitted, 2008.<br />
5. R. W. Murray, “Introduction to the Chemistry of Molecularly Designed Electro<strong>de</strong><br />
Surfaces”, in "Techniques of Chemistry", W.H. Saun<strong>de</strong>rs, Jr., (ed.), J. Wiley,<br />
1992, vol. XXII, pp. 9.<br />
6. R. Laviron, Journal of Electroanalytical Chemistry, 1979, 101, 19.<br />
7. R. W. Murray, "Chemically Modified Electro<strong>de</strong>", in “Electroanalytical Chemistry”,<br />
A.J. Bard (ed.), M. Dekker, New York, 1984, vol. 13, pp. 191.<br />
8. D. Gligor, “Electrozi modificati pentru oxidarea electrocatalitica a NADH”, PhD<br />
Thesis, Cluj-Napoca, 2002.<br />
9. D. Gligor, L. Muresan, I. C. Popescu, I. A. Silberg, Revue Roumaine <strong>de</strong> <strong>Chimie</strong>,<br />
2003, 48, 463.<br />
21
STUDIA UNIVERSITATIS BABE-BOLYAI, CHEMIA, LIII, 1, 2008<br />
In memoriam prof. dr. Liviu Oniciu<br />
MOTT-SCHOTTKY ANALYSIS OF ELECTRODEPOSITED<br />
ZnS THIN FILMS<br />
ADRIAN NICOARA *<br />
ABSTRACT. Some semiconductor properties, flat band potential and donor<br />
<strong>de</strong>nsity, of electro<strong>de</strong>posited ZnS thin films were evaluated by Mott-Schottky<br />
analysis. To this aim the <strong>de</strong>pletion region capacitance of semiconductor/<br />
solution interface was <strong>de</strong>termined by analysis of impedance spectrums.<br />
Keywords: ZnS, thin film, semiconductor, impedance spectroscopy.<br />
INTRODUCTION<br />
In recent years, extensive studies have been carried out on preparation<br />
and characterization of large band gap semiconductors, such as TiO2, ZnS,<br />
ZnO, SnO2, due to their application in photovoltaic-photoelectrochemical<br />
energy conversion and photoconductors [1-4]. Devices based on these<br />
materials require obtaining of thin films, usually by the means of vacuum<br />
<strong>de</strong>position techniques (i.e., molecular beam epitaxy, vapour phase epitaxy or<br />
metal-organic chemical vapour <strong>de</strong>position) or spray pyrolysis [5-7]. However,<br />
chemical and electrochemical <strong>de</strong>positions are attractive alternatives, mainly<br />
due to their lower cost and to advantages related to the use of ambient<br />
temperature and pressure. The electro<strong>de</strong>position is further advantaged by<br />
an easier control of the film growth, by using electric charge as process<br />
advance variable, and by higher yields, restricting the film formation on the<br />
electro<strong>de</strong> interface [8-10].<br />
The properties of electro<strong>de</strong>posited thin films can be obtained by<br />
examining electronic structures of the semiconductor/solution interface.<br />
Electrochemical and electrophotochemical techniques of investigation are<br />
well-suited for obtaining of some important properties of the semiconductor,<br />
namely donor <strong>de</strong>nsity and flat-band potential, both factors influencing the<br />
efficiency of photoelectrical and photochemical application of semiconductors.<br />
There are a number of such techniques used for measuring these properties;<br />
* Universitatea Babe-Bolyai, <strong>Facultatea</strong> <strong>de</strong> <strong>Chimie</strong> i <strong>Inginerie</strong> Chimic, Str. Koglniceanu<br />
Nr. 1, RO-400084 Cluj-Napoca, Romania, anicoara@chem.ubbcluj.ro
24<br />
ADRIAN NICOARA<br />
the flat-band potential (Efb) can be <strong>de</strong>termined either by measuring the<br />
photopotential or the onset of the photocurrent as a function of radiation<br />
intensity, or by measuring the capacitance of the space charge region into<br />
semiconductor [1, 11, 12]. The latter technique, employed in this work, allows<br />
the <strong>de</strong>termination avoiding the use of controlled level of electromagnetic<br />
radiation that would have requested a more sophisticated instrumental setup.<br />
The selected <strong>de</strong>termination method of a semiconductor/electrolyte<br />
interface flat-band potential was performed using a correlation between<br />
capacitance of the semiconductor <strong>de</strong>pletion layer and applied voltage bias,<br />
correlation common known as Mott-Schottky analysis. Several methods of<br />
capacitance measurement are <strong>de</strong>scribed in literature, among which a.c.<br />
voltammetry, capacitive reactance and impedance spectroscopy measurements<br />
are the most utilized [13].<br />
The aim of present work is to perform a Mott-Schottky analysis on<br />
semiconductor ZnS thin film electro<strong>de</strong>s by means of impedance spectroscopy.<br />
RESULTS AND DISCUSSION<br />
A common approach in <strong>de</strong>scribing the response of a system to an<br />
a.c. perturbation is the recourse to an electrical equivalent circuit, composed<br />
by resistances, R, and capacitances, C.<br />
The most complex equivalent circuit takes into account the behaviour<br />
of all the elementary steps that accompany the charge transfer across the<br />
semiconductor/solution interface. It uses elements for solution phase (Rs),<br />
<strong>de</strong>pletion region (R<strong>de</strong>p and C<strong>de</strong>p), electric double-layer (Cdl), and for the<br />
charge transfer (Rct) and mass transport (Rdif and Cdif). These electric<br />
elements <strong>de</strong>scribe the charge transport into solution and semiconductor<br />
phases, charge accumulation on semiconductor/solution interface and<br />
elementary steps of the faradaic process, respectively. Solely <strong>de</strong>pletion region<br />
capacitance is of interest in present investigation.<br />
Figure 1. General equivalent circuit of a metal/semiconductor/solution system.
MOTT-SCHOTTKY ANALYSIS OF ELECTRODEPOSITED ZnS THIN FILMS<br />
Depending on the experimental conditions employed, the contribution<br />
of some elementary steps can be neglected, as summarised in ref. [13]. In<br />
present study, by using a reasonable high concentration of electrolyte<br />
solution which increases Cdl, one can set asi<strong>de</strong> not only the faradaic terms<br />
(Rct, Rdif and Cdif) as the low reactance of Cdl acts as a shunt, but also the<br />
Cdl itself as it is connected in series with another capacitance of lower<br />
value. Accordingly, a simplified equivalent circuit that retains only Rs, R<strong>de</strong>p<br />
and C<strong>de</strong>p is further discussed and utilised.<br />
It is now at hand to discuss about choosing the method of capacitance<br />
measurement. When using a.c. voltammetry or capacitive reactance (XC)<br />
measurements of pulsation , the presence of Rs and R<strong>de</strong>p resistance will<br />
cause an un<strong>de</strong>r-evaluation of measured capacitance (Cmeas):<br />
C<br />
meas<br />
1 C<strong>de</strong>pR<strong>de</strong>p + 1 ω<br />
= =<br />
ω X R + R + ωC<br />
R R<br />
C <strong>de</strong>p s <strong>de</strong>p <strong>de</strong>p s<br />
Eq. 1 evi<strong>de</strong>nces the conditions necessary for accurate capacitance<br />
ω >> C R and R
26<br />
ADRIAN NICOARA<br />
Z ( f , θ ) = Z ( f , θ ) + jZ ( f , θ )<br />
(3)<br />
M i M , re, i i M , im, i i<br />
where f is the frequency, j is the complex operator, θ is here a 4-element<br />
real vector of (Rs; R<strong>de</strong>p; C<strong>de</strong>p; α), and ε i is an i<strong>de</strong>ntically distribution complex<br />
error term, with the real and imaginary components being in<strong>de</strong>pen<strong>de</strong>nt on<br />
each other [15].<br />
It is known that on polycrystalline electro<strong>de</strong>s the double-layer<br />
capacitance is often frequency <strong>de</strong>pen<strong>de</strong>nt. Whatever of atomic scale (i.e.,<br />
steps, kinks and dislocations) or larger (i.e., scratches, pits and grooves),<br />
surface irregularities cause this capacitance dispersion phenomenon. To<br />
characterize this phenomenon, the response of the capacitance can be<br />
approximated to a constant phase element; in other words C(f)∝(j 2πf) 1-α , with<br />
exponent α value between 0.7 and 0.9 is common with solid electro<strong>de</strong>s [16].<br />
On these bases, the components of the mo<strong>de</strong>l impedance are:<br />
R <br />
1+ 2π f R C sin( α)<br />
<br />
<br />
<strong>de</strong>p i <strong>de</strong>p <strong>de</strong>p<br />
M , re, i ( i, θ ) = s + 2<br />
1+ 4π fiR<strong>de</strong>pC <strong>de</strong>p sin( α) + (2 π fiR<strong>de</strong>pC <strong>de</strong>p )<br />
Z f R<br />
2<br />
2 fiR<strong>de</strong>pC <strong>de</strong>p cos( )<br />
M , im, i ( i,<br />
θ ) = − 2<br />
1+ 4π fiR<strong>de</strong>pC <strong>de</strong>p sin( α) + (2 π fiR<strong>de</strong>p C<strong>de</strong>p<br />
)<br />
Z f<br />
Ω<br />
<br />
<br />
<br />
<br />
<br />
π α<br />
<br />
<br />
Ω<br />
<br />
<br />
<br />
<br />
<br />
<br />
Figure 2. Influence of applied dc potential (for selected values presented in<br />
the legend) on Nyquist plot of measured impedance spectra for the ZnS film<br />
obtained at -1.25V vs. SCE. Continuous lines <strong>de</strong>note the fitted spectrums.<br />
<br />
(4)<br />
(5)
MOTT-SCHOTTKY ANALYSIS OF ELECTRODEPOSITED ZnS THIN FILMS<br />
The fittings were performed in Microcal Origin 5.0 using the simplex<br />
algorithm. The results of the fitting procedure are the components of θ. To<br />
evaluate graphically the fitting goodness, corresponding fitted curves are<br />
also presented in fig. 2. From the components of fitted vector, analysis is<br />
restricted to <strong>de</strong>pletion region capacitance C<strong>de</strong>p. Fig. 3a <strong>de</strong>picts the influence of<br />
applied dc bias on the capacitance values of the three investigated electro<strong>de</strong>s.<br />
The significantly higher values are obtained for the uncovered electro<strong>de</strong>; in<br />
this case, due to absence of semiconductor film, the <strong>de</strong>termined capacitance<br />
corresponds to the electric double-layer.<br />
<br />
µµ <br />
<br />
<br />
<br />
<br />
<br />
<br />
<br />
<br />
<br />
<br />
<br />
<br />
<br />
<br />
where A is the interfacial area, eo the elementary charge, Nd the donor <strong>de</strong>nsity<br />
and the dielectric constant of the semiconductor. Accordingly, a plot of<br />
1/C<strong>de</strong>p<br />
27<br />
2 vs. E should give a straight line with the flat-band potential as x-axis<br />
intercept and the slope allowing calculation of donor <strong>de</strong>nsity.<br />
It is clear from the data presented in fig. 3b that Mott-Schottky equation<br />
is valid within a wi<strong>de</strong> potential range, of about 0.7V, which indicates a well<strong>de</strong>fined<br />
electronic surface state of <strong>de</strong>posited film. Wi<strong>de</strong>r linear potential range,<br />
<br />
<br />
<br />
<br />
<br />
<br />
<br />
<br />
<br />
<br />
<br />
<br />
<br />
<br />
<br />
<br />
(a) (b)<br />
Figure 3. Influence of applied dc potential on calculated C<strong>de</strong>p (fig. 2a) and<br />
Mott-Schottky linearization (fig. 2b). Presented data correspond to Al electro<strong>de</strong><br />
uncovered and covered with a ZnS film electro<strong>de</strong>posed as indicated in legend.<br />
The flat-band potential of a semiconductor/solution junction can be<br />
calculated from the Mott-Schottky equation [17]:<br />
2<br />
= − (6)<br />
2<br />
1 C<strong>de</strong>p ( E E )<br />
2<br />
fb<br />
eoN dε<br />
A
28<br />
ADRIAN NICOARA<br />
that exceeds 1V, can be obtained only for high organised solids, namely<br />
single crystals. Furthermore a positive slope is an indication of an n-type<br />
semiconductor.<br />
At negative potentials (roughly for E< -1.2 V vs. SCE) a significant<br />
<strong>de</strong>viation from linearity is observed. This <strong>de</strong>viation is very likely related to<br />
the presence of surface states because an electronic structure change, as<br />
a result of elementary zinc formation by reduction, would have <strong>de</strong>creased the<br />
<strong>de</strong>pletion region capacitance dramatically. Accordingly, at lowest investigated<br />
potentials the reduction process corresponds to sulphur or polysulphi<strong>de</strong><br />
reduction, since a 1:1.1 Zn:S molar ratio for the obtained film was previously<br />
establish [14].<br />
When the data in fig. 3b are fitted using equation (6), a value for the<br />
flat-band potential of (-1.51 ± 0.02) V vs. SCE was calculated. This value is<br />
in good agreement with that found in the literature (-1.54 V vs. SCE) for a<br />
single crystal ZnS [18]. The donor <strong>de</strong>nsity was estimated to be (7.4 10 18 and<br />
6.9 10 18 ) cm -3 for the films obtained by electro<strong>de</strong>position at -1.25 and -1.45 V<br />
vs. SCE, respectively. The donor <strong>de</strong>nsity values should be regar<strong>de</strong>d with<br />
caution because the surface area of the irregularly crystallites contained by the<br />
semiconductor thin film could only be estimated with a rather poor accuracy.<br />
But, assuming potential in<strong>de</strong>pen<strong>de</strong>nce of surface area, on basis of increasing<br />
the slope of Mott-Schottky plot when electro<strong>de</strong>position takes place at a more<br />
negative potential, one can discuss about the nature of reaction causing the<br />
excess of sulphur in electro<strong>de</strong>posited film. Because elementary sulphur has<br />
no implication into charge transport, reduction of thiosulphate takes place<br />
more likely to polysulphi<strong>de</strong> than to elementary sulphur.<br />
CONCLUSIONS<br />
Impedance spectroscopy was employed in or<strong>de</strong>r to obtain information<br />
about the electric charge <strong>de</strong>pletion in a semiconductor thin film of ZnS<br />
obtained from electro<strong>de</strong>position from acidified thiosulphate solution containing<br />
zinc ion. The investigation of two ZnS films, obtained by electro<strong>de</strong>position at<br />
-1.25 and -1.45 V vs. SCE, allowed calculation of the flat-band potential of<br />
(-1.51 ± 0.02) V vs. SCE and the donor <strong>de</strong>nsity was estimated to be (7.4 10 18<br />
and 6.9 10 18 ) cm -3 , respectively.<br />
In a previous paper electro<strong>de</strong>position of ZnS thin films was investigated<br />
by cyclic voltammetry and electrochemical quartz crystal microbalance allowed<br />
the estimation of an 1:1.1 Zn:S stoechiometric ratio. The present Mott-Schottky<br />
analysis suggested that the excess sulphur of ZnS films is caused by the<br />
presence of zinc polysulphi<strong>de</strong>, excluding the presence of elementary sulphur,<br />
as the donor <strong>de</strong>nsity of semiconductor is potential <strong>de</strong>pen<strong>de</strong>nt.
MOTT-SCHOTTKY ANALYSIS OF ELECTRODEPOSITED ZnS THIN FILMS<br />
EXPERIMENTAL SECTION<br />
The impedance spectroscopy measurements were performed using<br />
a computer controlled potentiostat (Elektroflex EF-451, Hungary) by means<br />
of a customised Turbo Pascal TM software application. A 10mV ac perturbation,<br />
with frequencies in range of 0.3 to 10 KHz, was superimposed to the imposed<br />
voltage bias.<br />
A standard three-electro<strong>de</strong> electrochemical cell configuration was<br />
employed for the measurements. The reference electro<strong>de</strong> was a doublejunction<br />
saturated calomel electro<strong>de</strong> (SCE) and the counter electro<strong>de</strong> was<br />
a spiralled Pt wire. The working electro<strong>de</strong> was obtained by electro<strong>de</strong>posing<br />
a 1m thin film of ZnS onto an Al (refined, 99.5% purity) disk electro<strong>de</strong><br />
(A=0.032 cm 2 ). Electro<strong>de</strong>position <strong>de</strong>tails are presented elsewhere [14]. The<br />
electrolyte solution employed was Na2SO4 0.2 M (p.a. Rie<strong>de</strong>l <strong>de</strong> Haen),<br />
being prepared using distillated water.<br />
All measurements were performed with the cell introduced into a<br />
dark casket and kept at 20 ± 1 o C.<br />
ACKNOWLEDGMENTS<br />
The Romanian Education and Research Ministry supported this work, un<strong>de</strong>r<br />
grant PNCDI CERES (Contract 28/2002). High purity Na2S2O3 and ZnSO4<br />
(purified in the frame of above mentioned grant) were received by courtesy<br />
of Dr. Elisabeth-Janne Popovici (“Raluca Ripan” Institute of Chemistry, Cluj-<br />
Napoca).<br />
REFERENCES<br />
1. L. D. Partain, “Solar Cells and Their Applications”, John Wiley and Sons, New York,<br />
1995, chapters 1,2.<br />
2. J. McEvoy, M. Gratzel, Solar Energy and Materials for Solar Cells, 1994, 32, 221.<br />
3. B. O’ Regan, M. Gratzel, Nature, 1991, 353, 737.<br />
4. A. M. Fernan<strong>de</strong>z, P. J. Sebastian, Journal of Physics. D: Applied Physics, 1993,<br />
26, 2001.<br />
5. Ch. Bouchenaki, B. Ullrich, J. P. Zielinger, H. Nguyen Cong, P. Chartier, Journal<br />
of Crystal Growth, 1990, 101, 797.<br />
6. C. Saravani, K. T. R. Reddy, P. J. Reddy, Semiconductor Science Technology,<br />
1992, 6, 1036.<br />
7. H. Nguyen Cong, P. Chartier, Solar Energy and Materials for Solar Cells, 1993,<br />
30, 127.<br />
8. S. A. Al Kuhaimi, Z. Tulbah, Journal of Electrochemistry Society, 2000, 147, 214.<br />
9. M. Sasagawa, Y. Nosaka, Electrochimica Acta, 2003, 48, 483.<br />
29
30<br />
ADRIAN NICOARA<br />
10. M. Innocenti, G. Pezzatini, F. Forni, M. L. Foresti, Journal of Electrochemical<br />
Society, 2001, 148, C357.<br />
11. S. Burnsi<strong>de</strong>, J.-E. Moser, K. Brooks, M. Gratzel, D. Cahen, Journal of Physical<br />
Chemistry B, 1999, 103, 9328.<br />
12. B. Yacobi, "Semiconductor Materials An Introduction to Basic Principles", Kluwer,<br />
New York, 2003, chapter 1.<br />
13. V. Lehmann, “Electrochemistry of Silicon Instrumentation”, Wiley-VCH, Weinheim,<br />
2002, chapter 5.<br />
14. A. Nicoara, Studia Universitatis Babes-Bolyai, Chemia, 2004, XLIX, 65.<br />
15. J. R. Macdonald, “Impedance spectroscopy. Emphasizing solid materials and<br />
systems”, John Wiley and Sons, New York, 1987, chapter 6.<br />
16. A. Sadkowski, Journal of Electroanalytical Chemistry, 2000, 481, 222.<br />
17. K. Rajeshwar, “Fundamentals of Semiconductor Electrochemistry and Photoelectrochemistry”<br />
in “Encyclopedia of Electrochemistry, Vol 6 Semiconductor<br />
Electro<strong>de</strong>s and Photoelectrochemistry” (A.J. Bard, ed.), Willey, Weinheim, 2002,<br />
chapter 1.<br />
18. Y. Xu, M. A. A. Schoonen, American Minerals, 2000, 85, 543.
STUDIA UNIVERSITATIS BABE-BOLYAI, CHEMIA, LIII, 1, 2008<br />
In memoriam prof. dr. Liviu Oniciu<br />
ABOUT THE POSSIBILITY OF USING THE ELECTROCHEMICAL<br />
IMPEDANCE SPECTROSCOPY AS A METHOD OF<br />
CLASSIFYING THE DRUGS<br />
N. BONCIOCAT a<br />
ABSTRACT. The proposed EIS method uses the reference redox dielectro<strong>de</strong>:<br />
3−<br />
4−<br />
Pt [ Fe(<br />
CN)<br />
6 ] / [ Fe(<br />
CN)<br />
6 ] , KCl (in excess), O2 physically dissolved (1)<br />
which, e.g., in weak acidic media, has the reactions:<br />
1<br />
1<br />
O2<br />
+ H + → H 2O<br />
4<br />
2<br />
+<br />
e (2a)<br />
Fe CN<br />
4−<br />
→ Fe CN<br />
3−<br />
+<br />
(2b)<br />
[ ( ) ] [ ( ) ] e<br />
6<br />
In the case of the reference redox dielectro<strong>de</strong> (1), the pseudo-capacitance<br />
CW(), introduced by Warburg to explain the phase difference between the<br />
current and the tension, has led to expressions of the Nyquist plots, obtaned<br />
in the domain of very small radial frequencies , in good agreement with<br />
the experimetal data. Consi<strong>de</strong>r now the multielectro<strong>de</strong>:<br />
3−<br />
4−<br />
Pt [ Fe(<br />
CN)<br />
6 ] / [ Fe(<br />
CN)<br />
6 ] , KCl (in excess), v ml (LD), O2 physically<br />
dissolved (3), where LD= liquid drug.<br />
New additional reactions appear, and we don’t know them. Therefore, it is<br />
necessary to give a criterion of classifying the drugs which doesn’t imply the<br />
knowledge of the additional reactions. Consequently, we have consi<strong>de</strong>red<br />
that to explain the phase difference between the current and the tension, it<br />
is also correct to replace CW(), either by a series arrangement C *<br />
W(),<br />
L *<br />
* * ∗∗<br />
W(), or by a parallel one C W ( ω)<br />
, L W ( ω)<br />
of course, if one maintains the<br />
value of the impedance of CW(). The quantities C *<br />
W(), L *<br />
W(), as well as<br />
* * ∗∗<br />
C W ( ω)<br />
, LW ( ω)<br />
are theoretical quantities (i.e., not real quantities), but they<br />
permit to <strong>de</strong>termine what values must have the quotients L *<br />
W()/ C *<br />
W(), or<br />
∗∗<br />
∗∗<br />
( ω)<br />
C ( ω)<br />
L / , for both, the charge transfer, and the diffusion, resistances<br />
W<br />
W<br />
of the multielectro<strong>de</strong> [3] regain the values corresponding to the dielectro<strong>de</strong> (1).<br />
In this way, a criterion of classifying the medicaments, based on the values<br />
of above-mentioned quotients, has resulted.<br />
Keywords: electrochemical impedance spectroscopy, drug analysis<br />
a Babes-Bolyai University, Faculty of Chemistry and Chemical Engineering, Department of Physical<br />
Chemistry, 11 Arany Janos, Cluj-Napoca, Romania<br />
6
INTRODUCTION<br />
32<br />
N. BONCIOCAT<br />
In a series of papers, Bonciocat at al., have shown that the faradaic<br />
current <strong>de</strong>nsity of an electro<strong>de</strong> redox reaction occuring with combined<br />
limitations of charge transfer and nonstationary, linear, semiinfinite diffusion,<br />
is the solution of an integral equation of Volterra type [1-7]. By solving this<br />
integral equation, new methods of direct and cyclic voltammetry, applicable in<br />
aqueous electrolytic solution, or in molten salts, have been <strong>de</strong>veloped [8-20].<br />
Similarly, the above mentioned integral equation has led to a new approach to<br />
the Electrochemical Impedance Spectroscopy when only the charge transfer<br />
and diffusion limitations are present[21-23]. Very recently has been shown<br />
that the (E I S) method may have important applications in drug research<br />
[24,25].<br />
Some results already obtained are nee<strong>de</strong>d to un<strong>de</strong>rstand the<br />
<strong>de</strong>velopment given in this paper. We briefly remind them, and for <strong>de</strong>tails,<br />
see [22,24]. They refer to redox multielectro<strong>de</strong>s and give the parametric<br />
equation of their Nyquist plots in the domain of very small frequencies<br />
<br />
(round = = 0.2Hz). The equation which we are interested in, is:<br />
2<br />
J<br />
( ) 1[<br />
(<br />
t −<br />
) ]<br />
Re = R<br />
( ) 1/2<br />
sol + Rct<br />
+ <br />
<br />
−<br />
(4)<br />
2<br />
Re represents the real part of the impedance of the measuring cell,<br />
the radial frequency of the alternating current, Rsol the solution resistance,<br />
τ the moment of the time when the alternating overtension is superposed<br />
over the constant overtension, applied at t=0, and t is the time when the<br />
Nyquist plot recording ends. Cd represents the double layer capacity, and<br />
J1[(t – τ)] the Fresnel integral:<br />
( t−<br />
)<br />
cosx<br />
J1<br />
[ ( t − )<br />
] = dx<br />
(4’)<br />
0 x<br />
1/2<br />
whose value tends to π / 2 ≅ 1.<br />
253 for sufficiently great values of the product<br />
(t – ).<br />
(γ Rct) and (γ ) express the charge transfer, respective diffusion,<br />
limitations, and they have the meanings:<br />
1 1 1<br />
= + + ....<br />
(5)<br />
( Rct<br />
) 1Rct<br />
1 2Rct<br />
2<br />
( ) <br />
1 1<br />
1 1 <br />
=<br />
<br />
+ .......... .<br />
<br />
2<br />
11<br />
2<br />
2 <br />
(5’)
ABOUT THE POSSIBILITY OF USING THE ELECTROCHEMICAL IMPEDANCE SPECTROSCOPY…<br />
where the terms in the right-hand si<strong>de</strong>s of eqs.(5,5’) refer to the individual<br />
electro<strong>de</strong> reactions occuring simultaneously at the interface. For the aim of<br />
this paper, it is not important to give their expressions.<br />
The last term in eq.(4), represents the Warburg diffusion resistance<br />
RW() of the interface. It is an ohmical term that doesn’t introduce a phase<br />
difference between the current and the tension. To explain the phase difference<br />
between the current and the tension, Warburg has introduced a pseudocapacitance<br />
CW() in the series circuit by which represents the Faraday<br />
impedance of the interface:<br />
X C situated<br />
W<br />
along the imaginary axes of the complex plane, and having the expression:<br />
CW() introduces a Warburg capacitive reactance ( ω)<br />
[ ( t −<br />
) ]<br />
( <br />
) <br />
−1/2<br />
j<br />
J<br />
X ( )<br />
2<br />
C = −<br />
W<br />
2<br />
(7)<br />
where:<br />
( t−<br />
)<br />
sin x<br />
J2<br />
[ ( t − )<br />
] = dx<br />
0 x<br />
1/2<br />
(7’)<br />
Like the Fresnel integral (4’), also this Fresnel integral tends to<br />
for sufficiently great values of (t – τ).<br />
From eq.(7) it fallows:<br />
π / 2 ,<br />
1<br />
2 1 1<br />
CW<br />
( )<br />
=<br />
=<br />
⋅<br />
⋅ (8)<br />
X ( )<br />
J2[<br />
( t −<br />
) ] ( <br />
) <br />
−1/2<br />
<br />
CW<br />
From the expressions of RW() (i.e., the last term in eq.(4)) and<br />
CW() one gets:<br />
[ ( t −<br />
) ] 1 1<br />
⋅ ≅<br />
[ ( t −<br />
) ] <br />
J<br />
R ( )<br />
C ( )<br />
1<br />
W W ≅<br />
J2<br />
(9)<br />
for times of recording sufficiently large<br />
Concerning the electric scheme of the measuring cell nee<strong>de</strong>d to<br />
obtain the Nyquist plots, it refers only to the electro<strong>de</strong> un<strong>de</strong>r study, because the<br />
impedance of the reference electro<strong>de</strong> is practically equal to zero. Consequently,<br />
(6)<br />
33
34<br />
N. BONCIOCAT<br />
in the scheme one must enter excepting the Faraday impedance ZF (see (6)),<br />
the double layer capacity Cd and the resistance of the solution. Of course,<br />
this is an oversimplifyed scheme, but as we shall see, for the aim of this<br />
paper it is a<strong>de</strong>quate.<br />
Thus:<br />
This scheme is consi<strong>de</strong>red to be a<strong>de</strong>quate for the reference redox<br />
dielectro<strong>de</strong>; because the expressions of the Nyquist plots in the domain of very<br />
small values , obtained on its basis, have proved to be in good agreement<br />
with the experimental data.<br />
To propose a criterion of classifying the drugs, we have consi<strong>de</strong>red<br />
other two schemes. In one, the pseudo-capacitance CW() is replaced by a<br />
series arrangement, C *<br />
W(), L *<br />
W(), in the other, by a parallel arrangement<br />
* * ∗∗<br />
C W ( ω)<br />
, L W ( ω)<br />
, but maintaining the impedance of the Warburg pseudocapacitance,<br />
i.e.,<br />
Z =<br />
∗<br />
=<br />
∗∗<br />
C Z<br />
W series Zparallel<br />
(10)<br />
of course, the charge transfer resistance Rct, and the Warburg diffusion<br />
resistance, RW() will change, becoming<br />
∗<br />
R W<br />
∗<br />
, respective R ,<br />
∗∗<br />
CW ( )<br />
respective<br />
. Therefore, these two schemes are:<br />
∗ ct<br />
R , ( )<br />
( I )<br />
∗ ct<br />
(I*)<br />
(I**)
ABOUT THE POSSIBILITY OF USING THE ELECTROCHEMICAL IMPEDANCE SPECTROSCOPY…<br />
ct<br />
In addition, we shall consi<strong>de</strong>r that also the total ohmical resistance<br />
R W preserves its value, i.e.,<br />
R + ( )<br />
( )<br />
= R<br />
∗<br />
+ R<br />
∗ ( )<br />
= R<br />
∗∗<br />
+ R<br />
∗∗<br />
( )<br />
Rct + + RW<br />
ct W ct W<br />
(11)<br />
THEORETICAL SECTION<br />
The theoretical <strong>de</strong>velopment given in this paper is based on the<br />
following i<strong>de</strong>a: to explain the phase difference between the current and the<br />
tension, we shall use instead of one theoretical quantity (as the pseudocapacitance<br />
CW() introduced by Warburg, two theoretical quantities, namely,<br />
a pseudo-capacitance, and a pseudo-inductance.<br />
Because the phase differences introduced by these physical quantities<br />
are different, and <strong>de</strong>pend on their arrangement, i.e., in series or in parallel,<br />
we shall analyse separately these two possibilities.<br />
1. Characteristic quantities of the scheme (I * ) for very small <br />
As one knowns, in the complex plane, the impedance of an inductance<br />
L is Lj, and of a capacitance C is − j<br />
ωC<br />
1<br />
. Then from the equality<br />
( ) = Z ( ω)<br />
Z C ω<br />
W series (see eqs.(10), one gets:<br />
i.e.,<br />
<br />
<br />
L<br />
∗<br />
W<br />
<br />
L<br />
∗<br />
W<br />
( )<br />
( )<br />
1<br />
−<br />
C<br />
∗<br />
W<br />
1<br />
=<br />
C<br />
∗<br />
W<br />
Because ( ω )<br />
<br />
j = −<br />
<br />
1<br />
( ) ( ) j<br />
<br />
C<br />
W <br />
−<br />
1<br />
( )<br />
C<br />
W ( )<br />
ω ∗ L W is a positive quantity, it follows:<br />
( )<br />
= <br />
∗<br />
C ( )<br />
; α * ∗<br />
< 1, and L<br />
( )<br />
C<br />
∗<br />
W W<br />
W<br />
1−<br />
=<br />
∗<br />
<br />
∗<br />
⋅<br />
1<br />
C<br />
W<br />
( )<br />
(12)<br />
(12’)<br />
(13)<br />
Further, the product RW() CW() <strong>de</strong>pending only on (see eq. (9)), it<br />
is normal to consi<strong>de</strong>r that eq.(9) remains valid for the scheme ( I * ) too.<br />
Then:<br />
and therefore:<br />
( )<br />
C<br />
∗ ( )<br />
= R ( )<br />
C ( )<br />
R<br />
∗<br />
W W W W<br />
(14)<br />
35
36<br />
N. BONCIOCAT<br />
1<br />
R<br />
∗<br />
W ( )<br />
= RW<br />
( )<br />
(15)<br />
<br />
∗<br />
Coming back to eqs.(11) and using eq.(15), it results:<br />
1<br />
R<br />
∗ <br />
ct = 1<br />
<br />
<br />
−<br />
<br />
RW<br />
+<br />
<br />
∗<br />
<br />
( )<br />
Rct<br />
(16)<br />
Let’s write eq.(16) for multielectro<strong>de</strong>s and for 1 = 1.256s -1 . In addition,<br />
using the approximation:<br />
or:<br />
<br />
1[<br />
( t − )<br />
] ≅ , one gets:<br />
2<br />
∗<br />
1 <br />
∗<br />
( <br />
)<br />
R −<br />
ct = − + R<br />
<br />
<br />
∗ <br />
2<br />
1/2<br />
<br />
J 1<br />
( )<br />
1<br />
( )<br />
1 −<br />
∗<br />
R sol + ct<br />
sol +<br />
<br />
<br />
∗ <br />
<br />
∗ ( R<br />
) = −<br />
[<br />
0.446 ( <br />
) ] + R ( R<br />
)<br />
if one introduces the solution resistance too.<br />
2. Characteristic quantities of the scheme ( I ** ), for very small <br />
i.e.,<br />
From the same eqs.(10) it follows 1/ZC = 1/Z<br />
W parallel , and thus:<br />
( ω)<br />
1<br />
L<br />
∗∗<br />
W<br />
1<br />
L<br />
∗∗<br />
W<br />
( )<br />
( )<br />
+ C<br />
∗∗<br />
W<br />
j<br />
= C<br />
∗∗<br />
W<br />
ω ∗∗ W L / 1 being a positive quantity:<br />
ct<br />
( )<br />
j = C<br />
( )j<br />
W<br />
( )<br />
−<br />
C ( )<br />
W<br />
1<br />
C<br />
∗∗<br />
W ( )<br />
= CW<br />
( )<br />
; α<br />
α<br />
∗∗<br />
** < 1, and<br />
L<br />
∗∗<br />
W<br />
( )<br />
α<br />
∗∗<br />
= ⋅<br />
1 − α<br />
∗∗<br />
1<br />
C<br />
W<br />
( )<br />
ct<br />
(16’)<br />
(17)<br />
(18)<br />
(18’)<br />
(19)
ABOUT THE POSSIBILITY OF USING THE ELECTROCHEMICAL IMPEDANCE SPECTROSCOPY…<br />
i.e.,<br />
Further, eq.(9) remains valid for the scheme ( I ** ) too, and gives:<br />
( )<br />
C<br />
∗∗<br />
( )<br />
= R ( )<br />
C ( )<br />
R<br />
∗∗<br />
W W W W<br />
( )<br />
<br />
∗∗<br />
R ( )<br />
(20)<br />
R<br />
∗∗<br />
W = W<br />
(20’)<br />
∗∗<br />
Using eq.(20’) to express the term R W ( )<br />
( 1−<br />
∗∗<br />
) RW<br />
( )<br />
Rct<br />
R<br />
∗∗<br />
ct =<br />
+<br />
[ ω ] ≅ π / 2<br />
For 1= 1.256s -1 and ( t −τ<br />
)<br />
, eq.(11) leads to:<br />
(21)<br />
J 1<br />
multielectro<strong>de</strong>s, takes the final form:<br />
1<br />
, eq.(21), written for<br />
( R<br />
) ∗∗<br />
= ( 1−<br />
∗∗<br />
) 0.446 ( <br />
)<br />
[ ] + R ( R<br />
)<br />
R sol + ct<br />
sol +<br />
ct<br />
(22)<br />
3. Estimation of Rsol + (γ Rct) and (γσ)<br />
Suppose that the Nyquist plots are recor<strong>de</strong>d using 10 points per<br />
<strong>de</strong>ca<strong>de</strong>, starting with ν1= 0.2Hz and ending at 10 5 Hz. Then, the first point P1<br />
corresponds to ω1=2πν1 = 1.256 s -1 , and the second point P2 to ω2 = ω1 10 0.1 =<br />
1.582s -1 .<br />
Let’s suppose that the intervals of time (t - τ) required to record the<br />
Nyquist plots are sufficiently great to be permitted the approximation<br />
J1[ 1(<br />
t − )<br />
] ≅ J2<br />
[ 1(<br />
t −<br />
) ] ≅ 1.253 . Then, writing eq.(4) for the two points<br />
P1 and P2, one gets:<br />
Re<br />
Re<br />
−1/2<br />
− X <br />
1<br />
=<br />
2 X <br />
<br />
<br />
<br />
− 2<br />
( P1)<br />
( P )<br />
; X R + ( R<br />
)<br />
= sol ct<br />
(23)<br />
and consequently:<br />
Re<br />
( ) ( )<br />
( P ) − Re(<br />
P ) <br />
R + R<br />
≅ Re<br />
P −<br />
1 2<br />
sol ct 2 <br />
<br />
0.122<br />
(24)<br />
where: 0.122 = (ω1 / ω2) -1/2 -1.<br />
Coming back to eq.(4), and using the expression(24) of Rsol +(γ Rct),<br />
one gets:<br />
1/2<br />
2<br />
Re<br />
( )<br />
( ) ( )<br />
( P ) − Re(<br />
P ) <br />
<br />
≅<br />
1<br />
[ ( ) ] Re<br />
P − Re P +<br />
1 2<br />
1 2<br />
J t −<br />
(26)<br />
1 1 <br />
0.122<br />
37
i.e.,<br />
38<br />
( ) 20.6 [ Re(<br />
P ) − Re(<br />
P ) ]<br />
N. BONCIOCAT<br />
≅ 1 2<br />
(26’)<br />
EXPERIMENTAL SECTION<br />
Two liquid drugs have been tested: the Swedish Bitter (Original<br />
Schwe<strong>de</strong>n Tropfen, BANO) and the Energotonic complex (ENERGOTONIC-<br />
multivitamin complex, Plant Extract). The reference redox dielectro<strong>de</strong>(RRD)<br />
and the multieletro<strong>de</strong>s (i.e., RRD containing the respective liquid drug:<br />
Bitter or Energotonic) had the compositions given above (see (1 and 3)) we<br />
only mention that in all three cases the total volume has been V=300ml<br />
and vBitter = 50ml, respective vEnergotonic = 20ml. In Table 1-3 are reproduced<br />
from the papers[24, 25] the horizontal coordinates of the points P1(ω1),<br />
P2(ω2) corresponding to the 12 Nyquist plots obtained experimentally (three<br />
values for the constant overtension η, and for each value of η four values<br />
for τ). Of course, these coordinates represent the real parts Re(P1), Re(P2),<br />
of the corresponding Niquist plots: -Im vs Re, and permit to get the values<br />
of Rsol + (γ Rct), respective of (γ σ), by using the formulae (24 and 26’). As<br />
one sees, there is a good compatibility betwen the values corresponding to<br />
a given value of η , but appear differences when one passes to an other<br />
value of η. However, in this paper we are not interested in explaining the<br />
origin of these differences. We are interested only in comparing the effect<br />
that the too drugs investigated have in changing the values Rsol + (γ Rct)<br />
and (γ σ) of the reference redox dielectro<strong>de</strong>. For this reason, and because<br />
the thee values of η are close values, we shall compare the mean values<br />
resulted by using all Nyquist plots.<br />
Table 1.<br />
Reference Redox Dielectro<strong>de</strong> R R D<br />
η<br />
τ<br />
Re(ω1)<br />
Re(ω2)<br />
Rsol + (γRct)RRD<br />
( γ σ)RRD<br />
(V) (s) (Ω) (Ω)<br />
(Ω)<br />
(Ω s -1/2 )<br />
0 0 1368 1274 504 1938<br />
0 10 1343 1242 414 2082<br />
0 100 1324 1230 460 1938<br />
0 1000 1299 1211 490 1814<br />
-0.05 0 1838 1712 679 2597<br />
-0.05 10 1838 1685 431 3154<br />
-0.05 100 1820 1676 496 2968<br />
-0.05 1000 1784 1646 515 2845<br />
0.05 0 2703 2486 707 4473<br />
0.05 10 2703 2486 707 4473<br />
0.05 100 2703 2486 707 4473<br />
0.05 1000 2689 2473 703 4453<br />
Mean= 572 Mean= 3101
ABOUT THE POSSIBILITY OF USING THE ELECTROCHEMICAL IMPEDANCE SPECTROSCOPY…<br />
η<br />
τ<br />
R R D Containing Swedish Bitter (B)<br />
Re(ω1)<br />
Re(ω2)<br />
Rsol + (γRct)B<br />
( γ σ)B<br />
(V) (s) (Ω) (Ω)<br />
(Ω)<br />
(Ω s -1/2 )<br />
0 0 4236 3791 143 9173<br />
0 10 4297 3851 195 9194<br />
0 100 4419 3932 - 60 10039<br />
0 1000 4595 4054 - 380 11152<br />
-0.05 0 6495 5676 - 1037 16883<br />
-0.05 10 6559 5707 - 1277 17563<br />
-0.05 100 6559 5739 - 982 16903<br />
-0.05 1000 6527 5739 - 720 16244<br />
0.05 0 5676 4973 - 789 14492<br />
0.05 10 5946 5243 - 519 14492<br />
0.05 100 5946 5243 - 519 14492<br />
0.05 1000 5838 5135 - 627 14492<br />
η<br />
τ<br />
Mean= - 548 Mean= 13760<br />
R R D Containing Energotonic Complex (E)<br />
Re(ω1)<br />
Re(ω2)<br />
Rsol + (γRct)E<br />
( γ σ)E<br />
(V) (s) (Ω) (Ω)<br />
(Ω)<br />
(Ω s -1/2 )<br />
0 0 1358 1273 576 1752<br />
0 10 1325 1240 543 1752<br />
0 100 1287 1197 459 1855<br />
0 1000 1263 1178 481 1752<br />
-0.05 0 2525 2323 667 4164<br />
-0.05 10 2525 2313 575 4370<br />
-0.05 100 2535 2333 677 4164<br />
-0.05 1000 2535 2354 870 3731<br />
0.05 0 1912 1771 615 2907<br />
0.05 10 1926 1785 629 2907<br />
0.05 100 1933 1798 691 2783<br />
0.05 1000 1946 1805 649 2907<br />
Mean= 619 Mean= 2920<br />
Table 2.<br />
Table 3.<br />
1. Estimation of drugs effects<br />
As one sees from the Tables1-3, the effects of the investigated<br />
drugs consist in changing the values of Rsol + (γRct)RRD and (γ σ)RRD.<br />
Because the RRD containing the drug investigated corresponds, either<br />
to a scheme of type (I * ), or to one of type (I ** ), we shall estimate the effects of<br />
∗ ∗<br />
∗∗<br />
∗∗<br />
drugs by the values of the quotients LW<br />
( 1)<br />
/ CW<br />
( 1)<br />
, or LW<br />
( 1)<br />
/ CW<br />
( 1)<br />
for which these schemes become equivalent to the scheme (I) corresponding<br />
to the RRD electro<strong>de</strong>.<br />
39
40<br />
N. BONCIOCAT<br />
Let’s start with the Swedish Bitter. From table2, one sees that the mean<br />
value of Rsol + (γRct)B , i.e., -548Ω, is less than the mean value of Rsol + (γRct)RRD,<br />
equal to 572Ω (se Table 1). Consequently, it must increase to 572Ω, and<br />
equation (22) shows that this increase implies a parallel arrangement (i.e.,<br />
a scheme I ** ∗∗<br />
) and a value α B given by:<br />
1<br />
− B<br />
∗<br />
( γ Rct<br />
) RRD ] −[<br />
Rsol<br />
+ ( Rct<br />
)<br />
0.446(<br />
)<br />
RRD<br />
[ Rsol +<br />
γ<br />
=<br />
572 + 548<br />
=<br />
0.<br />
446 ⋅ 3101<br />
0.<br />
810<br />
B<br />
]<br />
=<br />
(27)<br />
In the case of Energotonic complex, Table 2 shows that the mean<br />
value Rsol + (γRct)E =619Ω must <strong>de</strong>crease to 572Ω, and equation (17)<br />
shows that this <strong>de</strong>crease implies a series arrangement (i.e., a scheme I ** ),<br />
and a value ∗ α E given by:<br />
1 [ Rsol<br />
+<br />
1−<br />
=<br />
∗<br />
E<br />
572 − 619<br />
= − 0.<br />
034<br />
0.<br />
446 ⋅ 3101<br />
( R ct ) RRD ] −[<br />
R sol + ( R ct )<br />
0.446 ⋅ ( )<br />
RRD<br />
E<br />
]<br />
=<br />
∗∗ ∗<br />
Therefore, eqs.(27 and 28) give: α B = 0.<br />
190 and α E = 0.<br />
967<br />
2. The proposed criterion of classifying the drugs<br />
one gets:<br />
From eqs.(13) written for α * = ∗ E<br />
(28)<br />
α , ω = ω1 and [ ( t −<br />
) ] ≅ /2<br />
J1 1<br />
2<br />
L<br />
∗<br />
( ) W ( 1)<br />
1−<br />
∗<br />
E 1 <br />
λ<br />
∗<br />
E 1 = = ⋅<br />
C<br />
∗ ( ) 2 <br />
( ) 1C<br />
W ( 1)<br />
W 1<br />
<br />
∗ <br />
E<br />
[ ( ) ] 2<br />
1−<br />
∗<br />
E<br />
⋅ 0.446 <br />
2<br />
RRD<br />
<br />
∗<br />
E<br />
( )<br />
and similarly, from eqs.(19), results:<br />
( 1)<br />
( )<br />
L<br />
∗∗<br />
λ<br />
∗∗(<br />
) W<br />
B 1 = = ⋅<br />
C<br />
∗∗<br />
W 1 1−<br />
∗∗<br />
B<br />
2 ( <br />
∗∗<br />
B ) 0.446 ( <br />
)<br />
=<br />
[ ] 2<br />
RRD<br />
(29)<br />
(30)
ABOUT THE POSSIBILITY OF USING THE ELECTROCHEMICAL IMPEDANCE SPECTROSCOPY…<br />
∗ ∗∗<br />
Introducing the values of α E and α B , the proposed criterion takes<br />
for two drugs investigated the values:<br />
λE ∗<br />
CONCLUDING REMARKS<br />
( ) = 67505<br />
2<br />
; λ ( ) = 85259<br />
2<br />
∗ ∗<br />
1<br />
B<br />
1<br />
(31)<br />
W 1<br />
W 1<br />
LW 1<br />
∗ ∗<br />
CW 1<br />
∗ ∗<br />
play the role of theoretical<br />
quantities that have permitted to <strong>de</strong>velop an advantageous physicomathematical<br />
<strong>de</strong>duction of the proposed criterion of classifying the drugs.<br />
2. The proposed criterion is a qualitative one, because it divi<strong>de</strong>s the drugs<br />
into two classes, ( I * ) or ( I ** ) <strong>de</strong>pending on what type of arrangement is<br />
necessary to estimate their action, i.e., a series or a parallel arrangement;<br />
it is also a quantitative criterion, because it estimates numerically these<br />
actions by the values λ * (ω1) or λ ** (ω1).<br />
3. For a drug that has no effect, α * and α ** are equal to unity. Consequently,<br />
for such a drug, λ * (ω1) = 0, and λ ** (ω1)= ∞. It fallows that for a drug<br />
belonging to the class ( I * ), the greater the value of λ * (ω1), the greater is<br />
its effect, and for a drug belongingto the class ( I ** ), the smaller the<br />
1. L ( ) ∗ C ( ) ∗<br />
and ( ) , ( )<br />
value of λ ** (ω1), the greater is its effect.<br />
∗<br />
The values resulted for the two drugs investigated, i.e., α E = 0.<br />
957 ,<br />
∗∗ respective α B = 0.<br />
190 , show that the Energotonic complex has a much<br />
∗<br />
smaller effect than the Swedish Bitter, because α E is very close to unity, while<br />
∗∗<br />
α B is more close to zero than to unity. The values resulted for E ( 1)<br />
<br />
∗<br />
λ and<br />
B ( 1)<br />
<br />
∗∗<br />
λ lead to the same conclusion, because E ( 1)<br />
∗ is more close to zero<br />
than B ( 1)<br />
<br />
∗<br />
∗<br />
to infinity.<br />
REFERENCES<br />
1. N. Bonciocat, S. Borca, St. Moldovan, Bulgarian Aca<strong>de</strong>my Scientific Communication,<br />
1990, 23, 289.<br />
2. A. Cotarta, Ph.D Thesis, Chemical Research Institute, Bucharest, 1992.<br />
3. N. Bonciocat, Electrokhimiya, 1993, 29, 92.<br />
4. N. Bonciocat, ‘’Electrochimie si Aplicatii’’, Dacia Europa - Nova, Timisoara, 1996,<br />
chapter 5.<br />
41
42<br />
N. BONCIOCAT<br />
5. N. Bonciocat, A. Cotarta, Revue Roumaine <strong>de</strong> <strong>Chimie</strong>, 1998, 43, 925.<br />
6. N. Bonciocat, A. Cotarta, Revue Roumaine <strong>de</strong> <strong>Chimie</strong>, 1998, 43, 1027.<br />
7. N. Bonciocat, “Alternativa Fredholm in Electrochimie”, Editura MEDIAMIRA,<br />
Cluj-Napoca, 2005, chapter 2.<br />
8. N. Bonciocat, “Electrochimie si Aplicatii”, Dacia Europa-Nova, Timisoara, 1996,<br />
cap.6, 268.<br />
9. N. Bonciocat, “Electrochimie si Aplicatii”, Dacia Europa-Nova, Timisoara, 1996,<br />
chapter 6.<br />
10. A. Radu (Cotarta), Ph.D. These, Institut National Polytechnique <strong>de</strong> Grenoble,<br />
1997.<br />
11. N. Bonciocat, A. Cotarta, “A new approach based on the theory of variational<br />
calculus in studying the electro<strong>de</strong>position process of chromium in the system<br />
Cr 0 /CrCl2, LiCl-KCl”, Contract Copernicus 1177-2 “Utilisation <strong>de</strong> sels fondus en<br />
metallurgie”, Final Report of European Community, July 1998.<br />
12. I. O. Marian, E. Papadopol, S. Borca, N. Bonciocat, Studia Universitatis Babes-<br />
Bolyai, Cluj Napoca, Seria Chemia, 1998, 43, 91.<br />
13. N. Bonciocat, Scientific Bulletin Chemistry Series Politechnica University Timisoara,<br />
1998, 43(57), 5.<br />
14. N. Bonciocat, “Alternativa Fredholm in Electrochimie”, Editura MEDIAMIRA,<br />
Cluj-Napoca, 2005, chapter 5.<br />
15. N. Bonciocat, E. Papadopol, S. Borca, I. O. Marian, Revue Roumaine <strong>de</strong> <strong>Chimie</strong>,<br />
2000, 45, 981.<br />
16. N. Bonciocat, E. Papadopol, S. Borca, I. O. Marian Revue Roumaine <strong>de</strong> <strong>Chimie</strong>,<br />
2000, 45, 1057.<br />
17. I. O. Marian, R. Sandulescu, N. Bonciocat, Journal of Pharmaceutical and<br />
Biomedical Analysis, 2000, 23, 227.<br />
18. I. O. Marian, N. Bonciocat, R. Sandulescu, C. Filip, Journal of Pharmaceutical<br />
and Biomedical Analysis, 2001, 24, 1175.<br />
19. N. Bonciocat, A. Cotarta, J. Bouteillon, J. C. Poignet, Journal of High Temperature<br />
Material Processes, 2002, 6, 283.<br />
20. N. Bonciocat, I. O. Marian, R. Sandulescu, C. Filip, S. Lotrean Journal of<br />
Pharmaceutical and Biomedical Analysis, 2003, 32, 1093.<br />
21. N. Bonciocat, “Alternativa Fredholm in Electrochimie”, Editura MEDIAMIRA,<br />
Cluj-Napoca, 2006, chapter 2.<br />
22. N. Bonciocat, A. Cotarta, “Spectroscopia <strong>de</strong> Impedanta Electrochimica in cazul<br />
limitarilor <strong>de</strong> transfer <strong>de</strong> sarcina si difuziune”, Editura Printech, Bucuresti, 2005,<br />
chapter 9.<br />
23. N. Bonciocat, I. O. Marian, “Metoda Impedantei Faraday si variantele sale”, Presa<br />
Universitara Clujeana, 2006, chapter 5.<br />
24. N. Bonciocat, A. Cotarta, Annals of West University of Timisoara, Series<br />
Chemistry, 2006, 15(2), 137.<br />
25. N. Bonciocat, A. Cotarta, Revista <strong>de</strong> <strong>Chimie</strong>, 2008, in press.
STUDIA UNIVERSITATIS BABE-BOLYAI, CHEMIA, LIII, 1, 2008<br />
In memoriam prof. dr. Liviu Oniciu<br />
PHOTOCONDUCTIVE PROPERTIES OF CdS<br />
ELECTRODEPOSITED THIN FILMS<br />
CARMEN ROBA a , LIVIU DOREL BOBOS b , ANDREEA OLTEAN b ,<br />
IULIU-OVIDIU MARIAN b , BARBU-RADU-HORATIU MISCA b ,<br />
DORIN MANCIULA a<br />
ABSTRACT. CdS films electro<strong>de</strong>posited on ITO substrate were investigated<br />
from optical and electrical point of view. Spectra present a maximum in red<br />
domain at 734.5 nm and 732.5 nm respectively. The electro <strong>de</strong>posited films<br />
are photo sensible. Static characteristics are linear in normal conditions of<br />
temperature and the non-radiative recombination plays a small role within<br />
the photoconduction processes.<br />
Keywords: CdS electro<strong>de</strong>posited films, photoconduction<br />
INTRODUCTION<br />
Thin films of metallic chalcogeni<strong>de</strong>s represent a new field of investigation<br />
for functional <strong>de</strong>vices technologies at large scale. The importance of these<br />
layers in the construction of photo resistors, laser dio<strong>de</strong> and some integrated<br />
structures are crucial. Photoconductive CdS films were usually <strong>de</strong>posited on<br />
metallic or insulated substrates by sputtering, using mixtures of Ar-H2S as<br />
sputtering gas in a dio<strong>de</strong> system on suitable cleaned substrate [1]. Nonvacuum<br />
methods are susceptible to contamination. The electrochemical<br />
<strong>de</strong>position was reported in literature [2-4]. The major advantage is the low<br />
cost of this procedure.<br />
In this paper were analyzed some spectral and electrical properties of<br />
thin electro<strong>de</strong>posited films. All electrochemical parameters such as <strong>de</strong>position<br />
potential, cathodic current and the rate of <strong>de</strong>position were recently reported [5].<br />
The <strong>de</strong>posited CdS film has shown a good adherence to ITO substrate due to<br />
its texture and preliminary electrochemical procedures to obtain the optimum<br />
storage. Optical and microscopically inspection confirm the uniformity of electro<br />
<strong>de</strong>position.<br />
a<br />
Babe-Bolyai University, Faculty of Environmental Sciences; Romania, Cluj-Napoca, No. 4 Stefan<br />
cel Mare Street<br />
b<br />
Babe-Bolyai University, Faculty of Chemistry and Chemical Engineering, Romania, Cluj-Napoca,<br />
No. 11 Arany-Janos, e-mail: iomar@chem.ubbcluj.ro
44<br />
ROBA CARMEN, L.D. BOBOS, ANDREEA OLTEAN, I.O. MARIAN, B.R.H. MISCA, D. MANCIULA<br />
RESULT AND DISCUSSIONS<br />
The absorption of radiation, which generates the non-equilibrium<br />
carriers, leads to the appearance of additional conductivity usually call<br />
photoconductivity.<br />
Two samples with rectangular geometries, P1 (1/2 cm) and P2 (5/6<br />
mm) were investigated in or<strong>de</strong>r to <strong>de</strong>terminate the ohmic resistance of CdS<br />
film in light and dark conditions. The ohmic contacts were ma<strong>de</strong> by using<br />
Ag Degussa conductive pasta and two Cu terminals in or<strong>de</strong>r to observe the<br />
longitudinal photoconduction.<br />
Figure 1. The electro<strong>de</strong>posited sample (cross section view)<br />
Determinations carried out on two samples in dark and light<br />
conditions in absence of polarization, were obtained at small interval of time<br />
(5-10 s) and at small inci<strong>de</strong>nt flux (power <strong>de</strong>nsity 0.6 W/cm 2 ). In these<br />
conditions, it had not been observed a notable ohmic resistance variation<br />
due to the free way of photo-generated carriers or because of intercrystallite<br />
barriers if these exist. However, the small ohmic resistance values of the<br />
electro<strong>de</strong>posited (P1 and P2) film are uncommon when these are compared<br />
with commercial one (20 M Ω). This situation is generated probably by<br />
some structural <strong>de</strong>fects or un<strong>de</strong>r the influence of the material composition.<br />
Some properties (bulk resistance), can be masked by the contamination of<br />
the outermost film layer. The structural <strong>de</strong>fects perhaps act like a trap for<br />
the charge carriers.<br />
It has been noticed that the illumination time (5 - 10 s) did not influence<br />
the photo sensible layer ohmic resistance (102 Ω for (P1) and 69 Ω for (P2)).<br />
The differences between values are due to different geometry of films.<br />
A homema<strong>de</strong> lineament <strong>de</strong>vice with 5 mm diameter diaphragm was<br />
attached to the spectrophotometer. The spectrum was realized by comparing<br />
the CdS film <strong>de</strong>posited onto ITO substrate to ITO substrate free of CdS films.<br />
A large band in red domain and NIR was thus observed (Fig.2). The different
PHOTOCONDUCTIVE PROPERTIES OF CdS ELECTRODEPOSITED THIN FILMS<br />
absorbance data comes from different thickness of investigated films<br />
P1( Abs = 0.1681 at 734.5 nm) and P2( Abs = 0.1407 at 732.5 nm). A small<br />
drift appears in spectrum at P1 toward NIR (842 nm) as compaired to P2<br />
(832 nm). This observation confirms different geometry but also different<br />
superficial aggregation.<br />
A<br />
0.20 P 1<br />
0.15<br />
0.10<br />
700 800 900 1000 1100<br />
λ (nm)<br />
A<br />
0.15<br />
0.10<br />
700 800 900 1000 1100<br />
λ (nm)<br />
Figure 2. The spectral characteristics of the investigated CdS films<br />
The assertive convention of polarization was selected due to symmetry<br />
of static characteristic in connection with coordinate axis. The current -<br />
voltage <strong>de</strong>pen<strong>de</strong>nce is linear in both conditions (absence or presence of<br />
illumination) in normal temperature conditions:<br />
I = I0 + IL = (C0 + Cf Φ) U.<br />
The flux modification induces only different slope in static<br />
characteristics, where IL, I0 is the current in light and dark conditions, C0, Cf<br />
constants that are <strong>de</strong>termined by physical properties and constructive<br />
characteristics of the photo-sensible film and U the polarization tension.<br />
Also in this relation, the inci<strong>de</strong>nt flux Φ plays an important role. By using the<br />
small polarization voltage and IR filter, we were able to avoid the intense<br />
field or the excessive heating of the photo sensible film.<br />
A photo response was recor<strong>de</strong>d for 30 s illumination time at each<br />
value of polarization voltage (Fig.3). The non-radiative contribution at<br />
photoconduction phenomenon due to carrier recombination led to a difference<br />
of only 0.01 <strong>de</strong>gree for three selected wavelengths in red domain (700 nm,<br />
730 nm, 760 nm).<br />
To verify the film stability, static characteristic and the ohmic resistance<br />
of sample have been measured again after a month period. Deviations from<br />
traced spectrum have not been observed. This observation had <strong>de</strong>monstrated<br />
that aging phenomenon during this period does not appear. Because the films<br />
P 2<br />
45
46<br />
ROBA CARMEN, L.D. BOBOS, ANDREEA OLTEAN, I.O. MARIAN, B.R.H. MISCA, D. MANCIULA<br />
were kept in special enclosures, the danger of contamination was eliminated.<br />
The areas where the Ag diffusion it is possible, refers to the specific regions of<br />
the ohmic contacts. Is also possible the indium diffusion from ITO substrate to<br />
CdS layer. To observe this phenomenon, supplementary analytical investigations<br />
are necessary to be ma<strong>de</strong> in the specific zone.<br />
I (mA)<br />
50<br />
40<br />
30<br />
20<br />
10<br />
dark<br />
light<br />
0<br />
0.0 0.5 1.0 1.5 2.0 2.5 3.0<br />
U (V)<br />
Figure 3. The static characteristic of P1 film in light and dark conditions.<br />
CONCLUSIONS<br />
Two CdS films electro<strong>de</strong>posited on ITO substrate, with different<br />
rectangular geometries (2 cm 2 and 0.30 cm 2 ) were investigated from optical<br />
and electrical point of view. Spectra present a maximum in red domain. The<br />
electro <strong>de</strong>posited films are photo sensible. Static characteristics are linear<br />
in normal conditions of temperature and the non-radiative recombination<br />
plays a small role within the photoconduction processes.<br />
EXPERIMENTAL SECTION<br />
The <strong>de</strong>position process was achieved in solutions containing CdSO4<br />
and Na2S2O3 (Cd2 + /S2 O3 2- ratios of 2/1 and 200/1), at pH 3, on ITO glass<br />
previously cleaned by ultrasonnation for 15 minutes, in a 1:1 acetone-ethanol<br />
mixture.
PHOTOCONDUCTIVE PROPERTIES OF CdS ELECTRODEPOSITED THIN FILMS<br />
The ohmic resistance of electrochemical <strong>de</strong>posited film was measured<br />
with a digital ohmmeter in both dark and light conditions (the inci<strong>de</strong>nt light<br />
flux for illumination conditions was supplied by 30 W Hg source). Using the<br />
Able-Jasco V-530 spectrometer attained the spectral characteristics of the<br />
examined thin films. The static characteristics I = f (U) and the contribution<br />
of non-radiative recombination was obtained by using a digital <strong>de</strong>vice [6].<br />
Changing of temperature was observed without polarization, in monochromatic<br />
conditions. The red domain for the recombination contribution was selected<br />
with a Specol monochromator.<br />
REFERENCES<br />
1. D. B. Frazer, H. Melchior, Journal of Applied Physics, 1972, 43, 3120.<br />
2. S. Denisson, Journal of Material Chemistry, 1994, 4, 41.<br />
3. V. I. Birss, L. E. Kee, Journal of Electrochemical Society, 1986, 133, 2097.<br />
4. J. Nishino, S. Chatani, Y. Uotami, Y. Nosaka, Journal of Electrochemical Society,<br />
1999, 473, 217.<br />
5. D. Gligor, L. Muresan, L. D. Bobos, I. C. Popescu, Studia Universitatis Babes-<br />
Bolyai, Chemia, 2004, 49, 137.<br />
6. M. Barau, M. Crisan, M. Gartner, A. Jitianu, M. Zaharescu, A. Ghita, V. Cosoveanu,<br />
V. Danciu, O. I. Marian, Journal of Sol-Gel Science and Technology, 2006, 37,<br />
175.<br />
47
STUDIA UNIVERSITATIS BABE-BOLYAI, CHEMIA, LIII, 1, 2008<br />
In memoriam prof. dr. Liviu Oniciu<br />
NANO- AND MICROPARTICLE DISTRIBUTION ON SOLID<br />
AND FLEXIBLE SUBSTRATES – PART I<br />
DORIN MANCIULA a,b , IULIU-OVIDIU MARIAN b ,<br />
BARBU-RADU-HORATIU MICA b<br />
ABSTRACT. By using the self-assembling process, it is possible to generate<br />
a large number of various structural organizations in which individual elements<br />
get together into regular patterns un<strong>de</strong>r suitable conditions. Two-dimensional<br />
self-assembled networks placed on solid and flexible substrates were<br />
obtained from solutions containing nano- and micro sized polymer spheres<br />
by evaporating the solvent in proper environmental conditions. The entire<br />
procedure is uncomplicated and it has been <strong>de</strong>monstrated as readily<br />
reproducible. The parameters used for the duration of the process are as well<br />
very easy to control.<br />
Key words: nanotechnology, self-assembly, nano/microparticles<br />
INTRODUCTION<br />
Nanotechnology represents a large scientific domain and moreover a<br />
multidisciplinary field which combines varied concepts from different areas,<br />
such as supramolecular chemistry, applied physics, functional <strong>de</strong>vices,<br />
materials and colloidal science [1]. Moreover, this area is mainly centered on<br />
the study, synthesis, <strong>de</strong>sign, and characterization of nanoscale materials, which<br />
are close related to many mo<strong>de</strong>rn technologies in use today. Developments in<br />
the field of nanotechnology also serve as useful tools in other research fields<br />
such as biology, chemistry and physics [2-6]. Many materials properties<br />
change radically at small length scales. The phenomena, which occur at the<br />
nanoscale level, can lead to creation of materials that may display new<br />
properties in comparison to the properties they exhibit on a macro scale<br />
level. Many research fields are able today to study and <strong>de</strong>velop different<br />
a Babe-Bolyai University, Faculty of Environmental Sciences; Romania, Cluj-Napoca, No. 4, Stefan<br />
cel Mare Street, Postal co<strong>de</strong> 400192, Tel: +40 264-405 300, Fax: +40 264-599 444; e-mail:<br />
dimro21@googlemail.com<br />
b Babe-Bolyai University, Faculty of Chemistry and Chemical Engineering, Romania, Cluj-Napoca,<br />
No. 11 Arany-Janos, Postal co<strong>de</strong> 400028, Tel: +40 264-593833, Fax: +40 264-590 818
50<br />
D.MANCIULA, I.O. MARIAN, B.R.H. MISCA<br />
categories of materials that <strong>de</strong>monstrate distinctive properties due to their<br />
small dimensions. Carbon nanotubes [7], nanoparticles [8], nanorods [9], and<br />
various nanoscale materials [10] that can be successfully used for bulk and for<br />
medical applications, especially in nanomedicine [11] and microelectronics [12]<br />
give some common examples of such materials. In addition, a large interest<br />
now is focused on the colloid science, which has given the opportunity to<br />
enlarge the number of materials with practical relevance in the field of<br />
nanotechnology and numerous examples of nanotechnology in mo<strong>de</strong>rn use<br />
can be mentioned today. Some of the most common nanotechnological<br />
applications of different types of nano- and micro scaled materials, consists<br />
of particle insertion in cosmetics, food products, paints and different category<br />
of plastic materials which can be used for instance in food packaging, cloth<br />
making or for coating various surfaces and furthermore for producing various<br />
types of surfaces, fuel catalysts and also disinfectants. [13,14]. In this paper<br />
are presented several methods, which were used to obtain two-dimensional<br />
self-assembled networks placed on solid substrates from solutions containing<br />
nano- and micro sized polymer spheres.<br />
RESULTS AND DISCUSSION<br />
Self-assembling during solvent evaporation is a simple and low cost<br />
technique, frequently used for 2D and 3D assembly of colloidal crystals. It<br />
is possible to grow millimeter-sized arrays and to control the thickness of<br />
the array by varying the initial concentration of the suspension for each<br />
method used. The particle distribution results for each method used are<br />
presented next. The outcome generated by using the spin casting of the<br />
liquid suspension is <strong>de</strong>picted in figure 1. Good results were obtained for<br />
spheres of smaller sizes (200-500 nm) using this technique.<br />
Figure 1. Polymer bead layer prepared by spin coating<br />
on glass substrate.
NANO- AND MICROPARTICLE DISTRIBUTION ON SOLID AND FLEXIBLE SUBSTRATES – PART I<br />
For the fabrication of a two-dimensional monolayer, the solvent was<br />
evaporated in two mo<strong>de</strong>s, either by using a heating oven (65°C for 8h), or<br />
at room temperature (24h) by tilting the substrates at a small angle (2-20°)<br />
between the normal surface and gravity, to induce particle arrangement.<br />
Substrates free of impurity were used immediately after they were cleaned.<br />
For the situation of particle self-assembling by means of suspension<br />
evaporation within the heating oven, the structure of the self-assembled<br />
aggregate <strong>de</strong>pends on the rate of solvent evaporation. A slow evaporation<br />
of the solvent leads to or<strong>de</strong>red colloidal crystals (figure 2).<br />
Figure 2. Monolayer formation following the suspension evaporation<br />
on glass (left) and polystyrene (right).<br />
By tilting the substrates, the gravity acts as an additional force<br />
affecting the template and influencing the arrangement of the particles<br />
(figure 3).<br />
Figure 3. Monolayer formation following the suspension evaporation<br />
on tilted glass (left) and polystyrene (right).<br />
The spacing and the distribution of the micro spheres are influenced<br />
by the sizes and <strong>de</strong>position times of the micro beads. Longer <strong>de</strong>position<br />
times lead to a close agglomeration of the beads, especially for spheres of<br />
51
52<br />
D.MANCIULA, I.O. MARIAN, B.R.H. MISCA<br />
smaller sizes (200-500nm), without generating a monolayer of highly or<strong>de</strong>red<br />
hexagonal closely-packed micro-beads, while for spheres with wi<strong>de</strong>r diameters<br />
(3-5µ) an ‘‘island’’ agglomeration is generated. A shorter <strong>de</strong>position time is<br />
responsible for increased space between the spheres on the substrate. The<br />
higher the tilting angle is, the more <strong>de</strong>fects seen during the distribution,<br />
along with the multilayer formation. A high concentration of the suspension<br />
may also lead to <strong>de</strong>fects in multilayer formation. Therefore, a small value<br />
(max. 2% solid content in the aqueous solution/suspension) has been chosen<br />
for substrate <strong>de</strong>position via solvent evaporation.<br />
By using the dipping technique, a well-distributed monolayer of highly<br />
or<strong>de</strong>red, hexagonal, closely packed micro beads can be generated (figure 4).<br />
To achieve a good distribution, particles must be monodispersed and must<br />
be absorbed onto the substrate. Several other conditions must also be met,<br />
such as a good suspension quality, a stable atmosphere around the cell and a<br />
good substrate quality. The dipping speed has a strong influence over the<br />
monolayer formation. A high dipping speed may lead to a multilayer <strong>de</strong>position<br />
over the substrate, while a lower dipping speed might not be a<strong>de</strong>quate enough<br />
for generating a close-packed monolayer.<br />
Figure 4. Particle monolayer produced on glass<br />
by means of dip-coating process<br />
The interactions of the particles that were <strong>de</strong>posited onto the<br />
surface can be attributed to electrostatic and lateral capillary forces that are<br />
able to influence adjacent particles and cause them to be attracted to each<br />
other, forming two-dimensional arrays of <strong>de</strong>nse hexagonal packing. To form<br />
fine particle monolayer on large-sized areas, the quality of the suspension<br />
has to be also consi<strong>de</strong>red. After forming and drying, the micro-sized monolayer<br />
particle arrays display a radiant iri<strong>de</strong>scent coloring when illuminated in white<br />
light.
NANO- AND MICROPARTICLE DISTRIBUTION ON SOLID AND FLEXIBLE SUBSTRATES – PART I<br />
CONCLUSIONS<br />
Two-dimensional self-assembled networks and configurations ma<strong>de</strong><br />
of nano- and micro-sized polymer spheres may be simply obtained from a<br />
solution containing the polymer spheres. Or<strong>de</strong>red configurations are obtained<br />
by means of solvent evaporation un<strong>de</strong>r proper experimental conditions. The<br />
driving force of the process is the capillary interaction, but the basic condition<br />
for having a superior self-assembled structure into an or<strong>de</strong>red pattern is the<br />
simultaneous presence of long-range repulsive and short-range attractive<br />
forces. The self-assembly procedure can be easily influenced by external<br />
parameters and therefore the sensitivity to environmental perturbations may<br />
lead to visible changes in the final structure or even compromise it. The<br />
solvent evaporation rate must not unfold too rapidly, to avoid generating<br />
instabilities and <strong>de</strong>fects that may arise within the array. Particle concentrations<br />
and solvent composition may also play an important role in <strong>de</strong>termining<br />
particle <strong>de</strong>posit morphologies. The substrate immersion within the colloidal<br />
solution was consi<strong>de</strong>red to be the best methods for preparing a high quality<br />
and well or<strong>de</strong>red monolayer.<br />
EXPERIMENTAL SECTION<br />
As solid substrates during the experiments, microscope glass sli<strong>de</strong>s<br />
and polystyrene Petri dishes were used. For preparing the substrates, which<br />
holds the micro bead monolayer, several consecutive steps were followed.<br />
A substrate clean up has been completed in the beginning of the experiment.<br />
All glass substrates were cleaned with a solution consisting of 3:1 mixture<br />
of sulfuric acid and 30% hydrogen peroxi<strong>de</strong>, for 3h and then rinsed with <strong>de</strong>ionized<br />
water and dried. The Petri dishes were ma<strong>de</strong> from clear polystyrene<br />
and were clean and sterilized. Several procedures were afterward tested to<br />
the successful distribution of the micro beads onto the substrates.<br />
A two-dimensional monolayer of polymer beads (1µm) was prepared<br />
first by spin casting the liquid suspension onto the glass substrate at 1700<br />
rpm for 20 seconds. The next effort for the fabrication of a two-dimensional<br />
monolayer array consists of accumulating the nano/micro spheres into a<br />
closely packed arrangement, onto both a cleaned glass surface and a dirt<br />
free polystyrene substrate (Petri dish) by evaporating the suspension into a<br />
heating oven at 65 o C for 8 hours. The suspension evaporation was also<br />
completed by tilting a glass substrate at room temperature at a small angle<br />
between the normal surface and gravity. Nano- and micro particle monolayer<br />
can also be obtained by using the particle self-assemble procedure on<br />
vertical substrates, by means of solvent evaporation as the driving force<br />
behind the fabrication process.<br />
During the experiments, the following equipments and materials<br />
were used: inverted Axio Observer microscope (Zeiss), scanning electron<br />
microscope (SEM) Gemini 1530 (Zeiss), microscope sli<strong>de</strong>s (76x26mm), cover-<br />
53
54<br />
D.MANCIULA, I.O. MARIAN, B.R.H. MISCA<br />
slips (24x50mm); polyMMA micro beads (BASF): particle size 200nm and<br />
solid content of 24.5%; polystyrene-co-MMA (BASF): particle size 200nm,<br />
80% MMA, 20% styrene and 24.6% solid content; polystyrene (BASF): particle<br />
size 1µm, solid content: 9.4%; polystyrene micro spheres (Polysciences,<br />
Inc.). The concentrations of the polystyrene micro sphere solutions used for<br />
the duration of experiments are presented in table 1.<br />
Table 1.<br />
Polystyrene nano/micro spheres used during experiments<br />
Diameter (µ) Concentration (%)<br />
0.202 2.56 2.61 2.67<br />
0.465 2.62 2.65<br />
0.477 2.69<br />
0.495 2.66<br />
0.987 2.54<br />
0.989 2.60 2.69<br />
1.091 2.76<br />
1.826 2.70<br />
5.658 2.65<br />
REFERENCES<br />
1. Q.Yan, F.Liu, L.Wang, J.Y. Leea, X.S. Zhao, Journal of Material Chemistry,<br />
2006, 16, 2132.<br />
2. F. Wang, A. Lakhtakia, ‘’Selected papers on nanotechnology: Theory and<br />
mo<strong>de</strong>ling’’, SPIE Press, 2006, pp. 182.<br />
3. M.B. David, ‘’Nano-hype: The truth behind the nanotechnology’’, Prometheus<br />
Books, 2006, pp.185.<br />
4. J.D. Shanefield,’’ Organic additives and ceramic processing’’, Kluwer Aca<strong>de</strong>mic<br />
Publishers, 1996, pp. 115.<br />
5. H. Geoffrey, M. Michael,’’ Nanotechnology: Risk ethics and law’’, Earthscan<br />
Publications, 2006, pp. 3.<br />
6. A. Lakhtakia, ‘’The handbook of nanotechnology, Nanometer Structures, Theory,<br />
mo<strong>de</strong>ling, and simulation’’, SPIE Press, 2004, pp.26.<br />
7. D. Srivastava, C. Wei, K. Cho, Applied Mechanics Reviews, 2003, 56, 215.<br />
8. V.J Mohanraj, Y. Chen, Tropical Journal of Pharmaceutical Research, 2006, 5, 561.<br />
9. P.I. Wang, Y.P. Zhao, G.C. Wang, T.M. Lu, Nanotechnology, 2004,15, 218.<br />
10. B. Baretzky, M.D. Baró, G.P. Grabovetskaya, J. Gubicza, M.B. Ivanov, Revue<br />
of Advanced Materials Science, 2005, 9, 45.<br />
11. F.A. Robert, Jr., Journal of Computational and Theoretical Nanoscience, 2005,<br />
2, 1.<br />
12. A.S. Dimitrov, K. Nagayama, Langmuir, 1996, 12, 1303.<br />
13. H.M. Peter, B.H. Irene, V.S. Oleg, Journal of Nanobiotechnology, 2004, 2,12.<br />
14. F. Buentello, D. Persad, B. Erin, M. Douglas, S. Abdallah, P. Singer, PLoS<br />
Medicine, 2005, 2, 300.
STUDIA UNIVERSITATIS BABE-BOLYAI, CHEMIA, LIII, 1, 2008<br />
In memoriam prof. dr. Liviu Oniciu<br />
AMPEROMETRIC BIOSENSOR FOR ETHANOL BASED ON<br />
A PHENOTHIAZINE DERIVATIVE MODIFIED<br />
CARBON PASTE ELECTRODE<br />
DELIA GLIGOR a,* , ELISABETH CSOREGI b ,<br />
IONEL CATALIN POPESCU a<br />
ABSTRACT. A new amperometric biosensor for ethanol, based on carbon<br />
paste electro<strong>de</strong> modified with alcohol <strong>de</strong>hydrogenase (ADH), polyethylenimine<br />
(PEI) and using a phenothiazine <strong>de</strong>rivative (DDDP; 16H,18H-dibenzo[c,1]-<br />
7,9-dithia-16,18-diazapentacene) as redox mediator for NADH recycling,<br />
was <strong>de</strong>veloped. The biosensor response is the result of mediated oxidation<br />
of NADH, generated in the enzymatic reaction between ADH and ethanol<br />
(in the presence of NAD + ). The biosensor sensitivity (calculated as the ratio<br />
app -1<br />
Imax/KM ) was 0.035 mA M and the <strong>de</strong>tection limit was 0.26 mM, while<br />
the linear response range was from 0.1 to 20 mM ethanol.<br />
Keywords: amperometric biosensors, alcohol <strong>de</strong>hydrogenase, ethanol,<br />
nicotinami<strong>de</strong> a<strong>de</strong>nine dinucleoti<strong>de</strong>, phenothiazine <strong>de</strong>rivative, polyethyleneimine,<br />
modified carbon paste electro<strong>de</strong>s.<br />
INTRODUCTION<br />
Nicotinami<strong>de</strong> a<strong>de</strong>nine dinucleoti<strong>de</strong> (NAD + /NADH) <strong>de</strong>pen<strong>de</strong>nt <strong>de</strong>hydrogenases<br />
catalyze the oxidation of compounds of great interest in analysis,<br />
such as carbohydrates, alcohols and al<strong>de</strong>hy<strong>de</strong>s. Selective, sensitive and<br />
simple <strong>de</strong>vices for the monitoring of ethanol are required from different<br />
fields such as biotechnology, food and clinical analysis [1] and, consequently,<br />
a lot of biosensors for ethanol <strong>de</strong>tection were proposed [1-15].<br />
Because the direct electro-oxidation of NADH, required for its recycling<br />
in biosensor functioning, involves high overpotentials on conventional<br />
electro<strong>de</strong>s [16-18], many efforts were directed towards discovering and<br />
characterizing new efficient electrocatalysts [19,20]. Among the most<br />
frequently investigated mediating schemes are those based on the direct<br />
adsorption of electron mediators onto electro<strong>de</strong> surface to obtain modified<br />
electro<strong>de</strong>s with electrocatalytic activity for NADH oxidation [21].<br />
a,* Department of Physical Chemistry, Babes-Bolyai University, 400028 Cluj-Napoca, ROMANIA;<br />
e-mail address: ddicu@chem.ubbcluj.ro<br />
b Department of Analytical Chemistry, Lund University, P.O. Box 124, SE-22100 Lund, Swe<strong>de</strong>n
D. GLIGOR, E. CSÖREGI, I.C. POPESCU<br />
Taking advantage of their remarkable strong adsorption on graphite<br />
surface associated with high electrocatalytic efficiency, organic dyes, i.e.<br />
phenazines, phenoxazines and phenothiazines <strong>de</strong>rivatives were extensively<br />
used as electrocatalysts for NADH oxidation [22-24]. Continuing our preoccupation<br />
in this domain [13,25] and taking advantage of a new phenothiazine<br />
<strong>de</strong>rivative, 16H,18H-dibenzo[c,1]-7,9-dithia-16,18-diazapentacene (DDDP),<br />
which was successfully used to <strong>de</strong>sign efficient electrocatalytic schemes for<br />
NADH recycling [26-28], the possibility to <strong>de</strong>velop a simple and inexpensive<br />
biosensor for ethanol <strong>de</strong>termination, by immobilization of alcohol <strong>de</strong>hydrogenase<br />
and polyethylenimine (PEI) on carbon paste modified with DDDP, was<br />
investigated.<br />
RESULTS AND DISCUSSIONS<br />
1. Bioelectrocatalysis at DDDP modified carbon paste electro<strong>de</strong>s<br />
In alcohol <strong>de</strong>hydrogenase (ADH) based biosensor, the enzyme<br />
catalyzes the oxidation of ethanol to acetal<strong>de</strong>hy<strong>de</strong>, in the presence of<br />
nicotinami<strong>de</strong> a<strong>de</strong>nine dinucleoti<strong>de</strong> (NAD + ) and the reduced NADH can be<br />
<strong>de</strong>tected amperometrically, according to the following reactions:<br />
CH3-CH2-OH + NAD + ←⎯ ⎯ →<br />
ADH<br />
CH3-CHO + NADH + H + (1)<br />
NADH + Mox ⎯ → NAD + + Mred + H + (2)<br />
Mred ⎯ → Mox + 2e - + H + (3)<br />
This approach has some important characteristics for ethanol<br />
monitoring in real samples, because it is not oxygen <strong>de</strong>pen<strong>de</strong>nt and is more<br />
selective for ethanol [11].<br />
In the present case, ADH and the oxidized form of DDDP (as<br />
electrocatalyst) are both present in the carbon paste, whereas NAD<br />
56<br />
+ is<br />
dissolved into the electrolyte solution. When ethanol is ad<strong>de</strong>d to the stirred<br />
solution contacting the biosensor, the enzymatic reaction 1 occurs and<br />
NADH diffuses to the DDDP-modified carbon paste electro<strong>de</strong>, where it is<br />
catalytically oxidized back to NAD + (reaction 2). The electrochemical reoxidation<br />
of the mediator (reaction 3) yields an analytical signal proportional<br />
to the rate of ethanol oxidation, which itself is proportional to the ethanol<br />
concentration if the concentrations of the other reactants are kept constant<br />
and ADH is unsaturated. A steady state current will be achieved if the<br />
enzyme and mediator are efficiently retained in the carbon paste electro<strong>de</strong><br />
and the reaction rates of reactions 2-3 are high enough, allowing a<br />
continuous and fast recycling of NAD + .<br />
Electrical communication of the redox-active center of enzymes with<br />
an electro<strong>de</strong> surface is a fundamental element for the <strong>de</strong>velopment of<br />
amperometric biosensor <strong>de</strong>vices [30]. For this reason carbon paste was<br />
chosen as electro<strong>de</strong> material for ADH immobilization. In a previous work [28] it
AMPEROMETRIC BIOSENSOR FOR ETHANOL<br />
was <strong>de</strong>monstrated that the DDDP-modified carbon paste electro<strong>de</strong> (DDDP-<br />
CPEs) can efficiently catalyze the oxidation of NADH. The present results<br />
show that the DDDP-CPEs can also catalyze the oxidation of enzymatically<br />
generated NADH from the reaction of NAD + and ethanol catalyzed by ADH<br />
(reactions 1-3).<br />
Since NAD + and mediator concentrations are constant, the increase<br />
in the electrocatalytic current <strong>de</strong>pends only on the ethanol concentration<br />
(NADH formation), and this characteristic was used as the basis of the<br />
<strong>de</strong>velopment of a biosensor for ethanol <strong>de</strong>termination.<br />
The cyclic voltammograms recor<strong>de</strong>d for DDDP-modified carbon paste<br />
electro<strong>de</strong>, incorporating ADH, in the presence of NAD + and ethanol (results<br />
not shown) proved that the electro<strong>de</strong> is able to sustain the catalytic cycle<br />
<strong>de</strong>scribed by reactions 1-3. After addition of 10 mM NAD + and 50 mM ethanol,<br />
a good electrocatalytic effect of DDDP for the enzymatically produced<br />
NADH was clearly observed (the anodic current is enhanced and the<br />
cathodic one is diminished). Obviously, no catalytic current can be observed in<br />
the absence of NAD + and/or ethanol (results not shown).<br />
2. Influence of NAD + concentration<br />
The NAD + coenzyme also plays a major role in the biosensor<br />
mechanism (see reactions 1-3). Thus, the effect on the biosensor response<br />
was evaluated for 50 mM ethanol, at different NAD + concentrations in the<br />
electrolyte solution (results not shown). It was observed that the response<br />
increases with increasing NAD + . Based on these results, 10 mM of NAD +<br />
was employed in the <strong>de</strong>velopment of further biosensors.<br />
3. Response to ethanol of ADH-PEI-DDDP-CPE<br />
Fig. 1A presents the ADH-PEI-DDDP-CPE amperometric response<br />
to successive injections of ethanol, and gives qualitative information on the<br />
response rate, as well as on the signal stability. In or<strong>de</strong>r to diminish the<br />
mass transport effect on the biosensor response the ADH-PEI-DDDP-CPE<br />
was rotated with 500 rpm.<br />
The biosensor response time was very short, reaching of its t95% in<br />
1 minute, as observed in fig. 1A. This response time is good consi<strong>de</strong>ring<br />
that it is a carbon paste electro<strong>de</strong>.<br />
Fig. 1B shows a calibration curve obtained from 1 to 100 mM of<br />
ethanol, in 0.1 M phosphate buffer at pH 7. The values of the kinetic<br />
parameters (Imax and KM app ) were calculated by fitting the experimental data<br />
to the Michaelis-Menten equation (fig. 1B). A linear response is observed<br />
up to 20 mM ethanol.<br />
The sensitivity for ethanol (estimated as the Imax/KM app ratio) of ADH-<br />
PEI modified carbon paste based biosensor was 0.035 mA/M.<br />
57
58<br />
I / µA<br />
0.5<br />
0.0<br />
A<br />
1 mM<br />
D. GLIGOR, E. CSÖREGI, I.C. POPESCU<br />
5 mM<br />
1000 2000<br />
t / s<br />
10 mM<br />
0.0<br />
0 50 100<br />
Figure 1. (A) Amperometric response to successive additions of ethanol and (B)<br />
calibration plots for ADH-PEI-DDDP-CPE. Experimental conditions: applied potential,<br />
+430 mV vs. Ag|AgCl/KClsat; supporting electrolyte, 0.1 M phosphate buffer pH 7<br />
containing 10 mM NAD + ; rotation speed, 500 rpm.<br />
Kinetic parameters were also estimated using the Lineweaver–Burk,<br />
Hanes–Woolf and Eadie–Hoffstee linearizations of Michaelis-Menten<br />
equation (table 1). The values obtained for KM app , Imax and sensitivity are in<br />
good accordance with those obtained by Michaelis-Menten fitting (fig. 1B).<br />
This behavior was attributed to the good reproducibility of the ADH-PEI-<br />
DDDP-CPE response, reflected by small fluctuations of the experimental<br />
data involved in the calibration curve (fig. 1B).<br />
The value of KM app is higher than those observed for the free<br />
enzyme in solution (3.2 mM for dissolved ADH; Pt rotated disk electro<strong>de</strong>;<br />
using hexacyanoferrate(III) as mediator; at pH 8.8 [31]) and for immobilized<br />
enzyme in carbon paste electro<strong>de</strong> (10 mM for ADH immobilized using<br />
glutaral<strong>de</strong>hy<strong>de</strong>/bovine serum albumin cross-linking procedure, in Meldola<br />
Blue adsorbed on silica gel modified niobium oxi<strong>de</strong> [11]). As expected, the<br />
ADH immobilization lead to an increase of KM app value in comparison with<br />
the corresponding values obtained when ADH was dissolved in solution.<br />
Additionally, a small increase (of 1.5) was observed between the values of<br />
KM app for the present study and that obtained in the above example [11].<br />
These results showed that the immobilization procedure did not promote a<br />
significant change in the enzyme selectivity/activity [11].<br />
Detection limits around 0.26 mM ethanol could be estimated<br />
consi<strong>de</strong>ring a signal/noise ratio of 3.<br />
I / µA<br />
0.4<br />
0.2<br />
B<br />
Chi^2 = 2.6E-16<br />
I max = 5.4E-7 ± 0.13E-7 (A)<br />
K M = 15 ± 1 (mM)<br />
[Ethanol] / mM
AMPEROMETRIC BIOSENSOR FOR ETHANOL<br />
Kinetic parameters of DDDP-ADH-PEI-CPE biosensors.<br />
Experimental conditions: as in figure 2.<br />
Table 1.<br />
KM app (mM) Imax (µA) Sensitivity (µA M -1 ) R / no. of exp. points<br />
Lineweaver – Burk linearization<br />
17.1 ± 1.8 0.55 ± 0.02 32.2 ± 2.3 0.9942 / 13<br />
Hanes- Woolf linearization<br />
17.8 ± 1.7 0.56 ± 0.01 30.9 ± 2.4 0.9990 / 15<br />
Eadie – Hoffstee linearization<br />
18.2 ± 1.8 0.57 ± 0.02 31.3 ± 4.2 0.9886 / 13<br />
The biosensor showed a good operational stability, as verified by<br />
data from repetitive analyses recor<strong>de</strong>d over 6 h periods of continuously<br />
operating.<br />
Also, the proposed biosensor presented good storage stability,<br />
which allowed measurements with the same response, for 1-2 days, when<br />
the biosensor was stored in a refrigerator, at 4 0 C. Decreasing of response<br />
towards ethanol with 88 %, after three days of storing is due to enzyme<br />
<strong>de</strong>activation, because DDDP-CPE presents a good stability for NADH<br />
oxidation and DDDP remains immobilized in carbon paste more than a<br />
month [28].<br />
CONCLUSIONS<br />
The phenothiazine <strong>de</strong>rivative, 16H,18H-dibenzo[c,1]-7,9-dithia-16,18-<br />
diazapentacene, adsorbed on carbon paste electro<strong>de</strong> was very useful for a<br />
simple and effective way to <strong>de</strong>velop biosensors for ethanol <strong>de</strong>termination.<br />
The analytical signal is due to the electrocatalytic oxidation of<br />
enzymatically generated NADH at ADH-PEI-DDDP-carbon paste electro<strong>de</strong>s.<br />
The proposed ADH-PEI-DDDP-CPE biosensor exhibited a good sensitivity<br />
(0.035 mA/M), a fast response (t95% < 1 min.) and a linear domain of<br />
concentration up to 20 mM, as well as a good operational and storage<br />
stability.<br />
EXPERIMENTAL SECTION<br />
Materials<br />
Alcohol <strong>de</strong>hydrogenase (ADH), EC 1.1.1.1. from yeast, was obtained<br />
from Sigma (St. Louis, MO, USA). The phenothiazine <strong>de</strong>rivative, 16H,18Hdibenzo[c,1]-7,9-dithia-16,18-diazapentacene<br />
(DDDP) was synthesized according<br />
to a previously published procedure [29]. The supporting electrolyte used in<br />
the electrochemical cell was a solution of 0.1 M sodium phosphate, pH 7.0<br />
(Merck, Darmstadt, Germany).<br />
59
60<br />
D. GLIGOR, E. CSÖREGI, I.C. POPESCU<br />
Potassium chlori<strong>de</strong> was purchased from Merck (Darmstadt, Germany)<br />
and absolute ethanol (99.7 %) from Kemetyl (Stockholm, Swe<strong>de</strong>n).<br />
Polyethylenimine (PEI) and NAD + were purchased from Sigma (St. Louis,<br />
MO, USA).<br />
Preparation of the DDDP-modified carbon paste electro<strong>de</strong>s<br />
100 µl of a 0.001% (w/v) DDDP solution prepared in tetrahydrofuran<br />
(Labscan Limited, Dublin, Ireland) were ad<strong>de</strong>d to 100 mg of carbon pow<strong>de</strong>r<br />
and adsorption of the mediator was allowed to proceed in vacuum until total<br />
evaporation of the solvent. DDDP-modified carbon paste electro<strong>de</strong>s (DDDP-<br />
CPEs) were obtained by thoroughly mixing the obtained DDDP-modified<br />
carbon paste with 25 µl of paraffin oil.<br />
Preparation of the ADH-PEI-modified carbon paste electro<strong>de</strong>s<br />
To 10 mg of DDDP-modified carbon paste, 200 l solution formed<br />
by 5 mg ADH (400 U / mg) and 1 ml of 0.2 % (w/v) PEI was ad<strong>de</strong>d, and<br />
adsorption of the enzyme was allowed to proceed in vacuum until a dried<br />
carbon pow<strong>de</strong>r was obtained.<br />
The modified carbon paste was put into a cavity of an in-house ma<strong>de</strong><br />
Teflon hol<strong>de</strong>r using pyrolytic graphite in the bottom for electric contact and<br />
then screwed onto a rotating disk electro<strong>de</strong> <strong>de</strong>vice (RDE; EG&G Mo<strong>de</strong>l 636,<br />
Princeton, Applied Research, Princeton, NJ, USA). The final geometrical area<br />
of the modified carbon paste electro<strong>de</strong>s was equal to 0.071 cm 2 .<br />
Electrochemical measurements<br />
Cyclic voltammetry and rotating disk electro<strong>de</strong> experiments were<br />
carried out using a conventional three-electro<strong>de</strong> electrochemical cell. The<br />
modified carbon paste was used as working electro<strong>de</strong>, a platinum ring as<br />
counter electro<strong>de</strong> and an Ag|AgCl/KClsat as reference electro<strong>de</strong>. An electrochemical<br />
analyzer (BAS 100W, Bioanalytical Systems, West Lafayette, IN,<br />
USA) was connected to a PC microcomputer for potential control and data<br />
acquisition. For rotating disk electro<strong>de</strong> experiments an EG&G rotator<br />
(Princeton Applied Research, Princeton, NJ, USA) was used.<br />
ACKNOWLEDGEMENTS<br />
The authors thank to CNCSIS for financial support (Projects ID_512 and<br />
CNCSIS A 1319-51-2007). We gratefully acknowledge prof. Ioan Alexandru<br />
Silberg and assoc. prof. Castelia Cristea from the Department of Organic<br />
Chemistry, “Babes-Bolyai” University of Cluj-Napoca, for providing DDDP.
AMPEROMETRIC BIOSENSOR FOR ETHANOL<br />
REFERENCES<br />
1. E. Domínguez, H. L. Lan, Y. Okamoto, P. D. Hale, T. A. Skotheim, L. Gorton,<br />
Biosensors & Bioelectronics, 1993, 8, 167.<br />
2. W. J. Blae<strong>de</strong>l, R. C. Engstrom, Analytical Chemistry, 1980, 52, 1691.<br />
3. F. Y. Berna<strong>de</strong>tte, R. L. Christopher, Analytical Chemistry, 1987, 59, 2111.<br />
4. M. Somasundrum, J. V. Bannister, Journal of Chemical Society, Chemical<br />
Communications, 1993, 1629.<br />
5. A. Karyakin, O. A. Bobrova, E. A. Karyakina, Journal of Electroanalytical<br />
Chemistry, 1995, 399, 179.<br />
6. C.-X. Cai, K.-H. Xue, Y-. M. Zhou, H. Yang, Talanta, 1997, 44, 339.<br />
7. M. J. Lobo Castanon, A. J. Miranda Ordieres, P. Tunon Blanco, Biosensors &<br />
Bioelectronics, 1997, 12, 511.<br />
8. J. Razumiene, R. Meskys, V. Gureviciene, V. Laurinavicius, M. D. Reshetova, A.<br />
D. Ryabov, Electrochemistry Communications, 2000, 2, 307.<br />
9. J. Razumiene, V. Gureviciene, V. Laurinavicius, J. V. Grazulevicius, Sensors<br />
and Actuators B: Chemical, 2001, 78, 243.<br />
10. J. Razumiene, A. Vilkanauskyte, V. Gureviciene, V. Laurinavicius, N.V.<br />
Roznyatovskaya, Y. V. Ageeva, M. D. Reshetova, A. D. Ryabov, Journal of<br />
Organometallic Chemistry, 2003, 668, 83.<br />
11. A. S., Santos, R. S. Freire, L. T. Kubota, Journal of Electroanalytical Chemistry,<br />
2003, 547, 135.<br />
12. M. Niculescu, R. Mieliauskiene, V. Laurinavicius, E. Csoregi, Food Chemistry,<br />
2003, 82, 481.<br />
13. D. M.Gligor, G. L. Tur<strong>de</strong>an, L. M. Muresan, I. C. Popescu, Studia Universitatis<br />
Babes-Bolyai, Chemia, 2004, XLIX, 93.<br />
14. K. Svensson, L. Bulow, D. Kriz, M. Krook, Biosensors & Bioelectronics, 2005,<br />
21, 705.<br />
15. J. Razumiene, J. Barkauskas, V. Kubilius, R. Meskys, V. Laurinavicius,<br />
Talanta, 2005, 67, 783.<br />
16. H. Jaegfeldt, Journal of Electroanalytical Chemistry, 1980, 110, 295.<br />
17. J. Moiroux, P. J. Elving, Analytical Chemistry, 1978, 50, 1056.<br />
18. Z. Samec, P. J. Elving, Journal of Electroanalytical Chemistry, 1983, 144, 217.<br />
19. L. Gorton, E. Dominguez, Reviews in Molecular Biotechnology, 2002, 82, 371.<br />
20. L. Gorton, E. Dominguez, "Electrochemistry of NAD(P)+/NAD(P)H in Encyclopedia<br />
of Electrochemistry”, Wiley, New York, 2002.<br />
21. I. C. Popescu, E. Dominguez, A. Narvaez, V. Pavlov, I. Katakis, Journal of<br />
Electroanalytical Chemistry, 1999, 464, 208.<br />
22. L. Gorton, A. Torstensson, H. Jaegfeldt, G. Johansson, Journal of Electroanalytical<br />
Chemistry, 1984, 161, 103.<br />
23. J. Kulys, G. Gleixner, W. Schuhmann, H.-L. Schmidt, Electroanalysis, 1993, 5, 201.<br />
61
62<br />
D. GLIGOR, E. CSÖREGI, I.C. POPESCU<br />
24. L. T. Kubota, L. Gorton, Electroanalysis, 1999, 11, 719.<br />
25. F. D., Munteanu, D. Gligor, I. C. Popescu, L. Gorton, Revue Roumaine <strong>de</strong><br />
<strong>Chimie</strong>, 2005, 51, 25.<br />
26. D. Dicu, L. Muresan, I. C. Popescu, C. Cristea, I. A. Silberg, P. Brouant,<br />
Electrochimica Acta, 2000, 45, 3951.<br />
27. V. Rosca, L. Muresan, C. Cristea, I. A. Silberg, I. C. Popescu, Electrochemistry<br />
Communications, 2001, 3, 439.<br />
28. F. D. Munteanu, D. Dicu, I. C. Popescu, L. Gorton, Electronalysis, 2003, 15, 383.<br />
29. I. A. Silberg, C. Cristea, Heterocyclic Communications, 1995, 2, 117.<br />
30. E. Katz, V. Heleg-Shabtai, B. Willner, I. Willner, A. F. Buckmann, Bioelectrochemistry<br />
& Bioenergetics, 1997, 42, 95.<br />
31. M. K. Ciolkosz, J. Jordan, Analytical Chemistry, 1993, 65, 164.
STUDIA UNIVERSITATIS BABE-BOLYAI, CHEMIA, LIII, 1, 2008<br />
In memoriam prof. dr. Liviu Oniciu<br />
CARACTÉRISATION OPÉRATIONNELLE D’UN BIOCAPTEUR<br />
AMPÉROMÉTRIQUE POUR LA DÉTECTION DE L’ANION<br />
NITRATE<br />
ANA-MARIA TODEA, LIANA MARIA MUREAN,<br />
IONEL CATALIN POPESCU *<br />
RÉSUMÉE. L’étu<strong>de</strong> a été centré sur le développement d’un biocapteur<br />
ampérométrique pour la détection <strong>de</strong> l’anion nitrate et a envisagé<br />
l’amélioration <strong>de</strong> la stabilité du biocapteur par l’utilisation d’une matrice<br />
enzymatique composite. Ainsi, sur une première couche polymérique, obtenue<br />
par l’électropolymérisation “in situ” d’un dérivé pyrrolique amphiphilique du<br />
viologène, a été déposée l’enzyme (nitrate réductase) immobilisée par<br />
adsorption sur une argile hydrophilique (laponite). Finalement, une <strong>de</strong>rnière<br />
couche polymérique a été <strong>de</strong>posée par l’électropolymerization d’un dérivé<br />
pyrrolique-viologène soluble dans l’eau. La limite <strong>de</strong> détection du biocapteur<br />
est 0,5 M, tandis que sa sensibilité, calculée <strong>de</strong> la pente <strong>de</strong> la région<br />
linéaire, est <strong>de</strong> 37,7 mA M -1 cm 2 app<br />
. La valeur assez petite <strong>de</strong> KM (0.29 mM),<br />
déterminée par modélisation <strong>de</strong> la dépendance Michaelis-Menten, indique<br />
que l’argile utilisée offre un milieu biocompatible avec l’enzyme.<br />
Mots clef: biocapteur ampérométrique, anion nitrate<br />
INTRODUCTION<br />
Au cours <strong>de</strong>s <strong>de</strong>rnières années, la détection électrochimique <strong>de</strong>s<br />
espèces chimiques d’intérêt dans la protection <strong>de</strong> l’environnement a retenu<br />
l’attention <strong>de</strong> nombreux chercheurs, due à ses caractéristiques très attrayantes<br />
au niveau du rapport performances (sensibilité, limite <strong>de</strong> détection, sélectivité,<br />
temps <strong>de</strong> réponse, robustesse etc.) / efforts <strong>de</strong> réalisation (simplicité, coût<br />
réduit, versatilité etc.). De plus, le couplage <strong>de</strong>s transducteurs électrochimiques<br />
(potentiométriques et surtout ampérométriques), réalisés à base d’électro<strong>de</strong>s<br />
modifiées, avec <strong>de</strong>s éléments <strong>de</strong> reconnaissance biologique (<strong>de</strong> nature<br />
métabolique ou immunospécifique) a donné lieu à l’apparition d’un outil très<br />
performant, le biocapteur électrochimique (voir, par ex. [1]).<br />
* Département <strong>de</strong> <strong>Chimie</strong> Physique, Université Babe-Bolyai, 11 Rue Arany Janos, 400028<br />
Cluj-Napoca, Roumanie; cpopescu@chem.ubbcluj.ro
64<br />
A.M. TODEA, L.M. MUREAN, I.C. POPESCU<br />
Des biocapteurs pour l’anion nitrate ont été fabriqués par<br />
l’incorporation <strong>de</strong> la nitrate réductase (NR) dans <strong>de</strong>s différentes matrices<br />
polymériques [2, 3]. Malgré les caractéristiques analytiques très intéressantes<br />
<strong>de</strong> ces dispositifs, leur utilisation est fortement diminuée en raison <strong>de</strong> leur<br />
instabilité fonctionnelle, essentiellement déterminée par la fragilité du récepteur<br />
biologique [4].<br />
Notre étu<strong>de</strong>, centré sur le développement d’un biocapteur pour la<br />
détection <strong>de</strong> l’anion nitrate par l’immobilisation <strong>de</strong> la nitrate réductase dans<br />
une matrice composite, a envisagé l’amélioration <strong>de</strong> la stabilité du biocapteur<br />
par l’utilisation combinée <strong>de</strong> l’électropolymérisation “in situ” <strong>de</strong> <strong>de</strong>ux dérivés<br />
pyrroliques (Schème 1) et d’une argile (laponite). Laponite est un matériel<br />
avec une gran<strong>de</strong> stabilité thermique, mécanique et chimique, ayant <strong>de</strong>s<br />
propriétés remarquables d’échangeurs d’ions et qui, suite à sa structure<br />
particulière, permet l’obtention <strong>de</strong> vitesses élevées <strong>de</strong> diffusion du substrat,<br />
lors qu’il est présent dans l’architecture d’une matrice enzymatique [5].<br />
Le laponite a été employée avec succès dans la construction <strong>de</strong>s<br />
biocapteurs ampérométriques pour la détection <strong>de</strong> glucose [6], <strong>de</strong> l’anion<br />
NO3 - [7] et pour la construction <strong>de</strong>s biocapteurs conductimétriques [8].<br />
D’autre part, les dérives polypyrroliques-viologène assurent simultanément<br />
l’immobilisation <strong>de</strong> l’enzyme, le contact électrique avec le matériel électrodique<br />
[7, 9 -11] et la création d’un microenvironnement favorable pour augmenter<br />
la durée <strong>de</strong> vie du récepteur biologique.<br />
RESULTATS ET DISCUSSION<br />
Le biocapteur a été caractérisé par voltammétrie hydrodynamique<br />
cyclique en tampon TRIS 0,1 M (pH 7,5), dans le domaine <strong>de</strong> potentiel -0,7 -<br />
-0,3 V vs. Ag/AgCl. Les voltammogrammes typiques obtenues pour le biocapteur<br />
poly 1 / NR-laponite / poly 2, en absence et en présence <strong>de</strong> l’anion nitrate<br />
pour différentes concentrations, sont présentées dans la figure 2.<br />
Comme on peut voir dans la figure 2, en absence <strong>de</strong>s nitrates on<br />
obtient une on<strong>de</strong> à caractère quasi-réversible, correspondant au couple<br />
MV 2+ /MV + ( 0 ’= 0,55 V / Ag/AgCl/KCl3M). Par contre, en présence <strong>de</strong><br />
différentes concentrations <strong>de</strong> l’anion nitrate une augmentation prononcée<br />
du courrant cathodique a été mise en évi<strong>de</strong>nce, en parallèle avec la<br />
diminution progressive du courrant anodique. Ce comportement est la<br />
preuve directe <strong>de</strong> l’activité bioélectrocatalytique <strong>de</strong> l’électro<strong>de</strong> poly 1 / NRlaponite<br />
/ poly 2 pour la réduction <strong>de</strong> l’anion nitrate.<br />
Le comportement électrocatalytique du biocapteur met en évi<strong>de</strong>nce<br />
un très bon contact électrique entre le centre redox <strong>de</strong> la NR et la surface <strong>de</strong><br />
l’électro<strong>de</strong> <strong>de</strong> travail, par l’intermédiaire <strong>de</strong>s groupes viologène <strong>de</strong> la<br />
matrice polymérique. À la fois, celui-ci prouve l’efficacité <strong>de</strong> la communication
CARACTÉRISATION OPÉRATIONNELLE D’UN BIOCAPTEUR AMPÉROMÉTRIQUE …<br />
I / µµA<br />
4<br />
0<br />
-4<br />
-8<br />
-12<br />
-0.7 -0.6 -0.5 -0.4 -0.3<br />
E / V vs. Ag/AgCl/KCl 3M<br />
Figure 2. Réponse voltammétrique du biocapteur poly 1 / NR-laponite / poly 2 en<br />
-<br />
absence (•) et en présence <strong>de</strong> NO3 : (∆) 0,25 mM; () 5 mM. Conditions expérimentales:<br />
tampon TRIS 0,1 M (pH 7,5); vitesse <strong>de</strong> balayage, 5 mV/s; 1000 rpm; 30 0 C.<br />
électrique entre le film <strong>de</strong> poly 1, en contact avec la surface <strong>de</strong> l’électro<strong>de</strong><br />
et le polymère poly 2, qui est incorporé dans l’argile. Par conséquent, le<br />
schéma <strong>de</strong> la détection bioampèrométrique <strong>de</strong> l’anion nitrate sur l’électro<strong>de</strong><br />
poly 1 / NR-laponite / poly 2 est la suivante:<br />
2V +• + NO3 ¯ + H2O<br />
⎯→ ⎯NR<br />
+ − electro<strong>de</strong> +<br />
2V + 2e<br />
⎯⎯⎯⎯<br />
→2V<br />
2<br />
2V 2+ + NO2 - + 2OH ¯<br />
L’augmentation du courrant cathodique, due á la réduction du nitrates<br />
à nitrite, a permis le traçage d’une courbe <strong>de</strong> calibration, basée sur <strong>de</strong>s<br />
mesures voltammétriques (figure 3). On peut constater facilement l’allure<br />
typique correspondant à une cinétique Michaelis-Menten. Les paramètres<br />
cinétiques caractéristiques (Imax et KM) ont été estimés à l’ai<strong>de</strong> du logiciel<br />
Origin (figure 3).<br />
65
66<br />
|∆I pc | / µµA<br />
A.M. TODEA, L.M. MUREAN, I.C. POPESCU<br />
4<br />
3<br />
2<br />
1<br />
Chi^2 = 0.02884<br />
R^2 = 0.98684<br />
I max = 3.97 ± 0.12<br />
K M = 0.29 ± 0.03<br />
0<br />
0 1 2 3 4 5<br />
-<br />
[NO ] / mM<br />
3<br />
-<br />
Figure 3. Courbe <strong>de</strong> calibration pour le dosage <strong>de</strong> NO3 par voltammétrie hydrodynamique<br />
cyclique en utilisant le biocapteur poly 1 / NR-laponite / poly 2.<br />
Conditions expérimentales: domaine <strong>de</strong> potentiel, -0,7 - -0,3 V vs. Ag/AgCl;<br />
tampon, TRIS 0,1 M (pH 7,5); 30 0 C; vitesse <strong>de</strong> balayage, 5 mV/s; 1000 rpm.<br />
Comme on peut observer dans la figure 4 la réponse du biocapteur<br />
est linéaire jusqu’à la concentration <strong>de</strong> 0.15 mM NO3 - . Les paramètres<br />
correspondant à la dépendance linéaire entre ∆Ipc et [NO3 - ] sont marqués<br />
dans la figure 4. La limite <strong>de</strong> détection est 0,5 M, tandis que sa sensibilité,<br />
calculée <strong>de</strong> la pente <strong>de</strong> la région linéaire, est <strong>de</strong> 37,7 mA M -1 cm 2 .<br />
∆I pc / µA<br />
1.2<br />
1.0<br />
0.8<br />
0.6<br />
0.4<br />
0.2<br />
y = (-0.02 ± 0.01) + (7.41 ± 0.17)*x<br />
R = 0.9978; N = 10<br />
0.0<br />
0 30 60 90 120 150<br />
-<br />
[NO ] / µM<br />
3<br />
Figure 4. Domaine linéaire <strong>de</strong> la courbe <strong>de</strong> calibration pour le dosage<br />
-<br />
<strong>de</strong> NO3 avec le biocapteur poly 1 / NR-laponite / poly 2.<br />
Conditions expérimentales: comme en figure 3.
CARACTÉRISATION OPÉRATIONNELLE D’UN BIOCAPTEUR AMPÉROMÉTRIQUE …<br />
La valeur assez petite <strong>de</strong> KM app , déterminée par modélisation <strong>de</strong> la<br />
dépendance Michaelis-Menten <strong>de</strong> la pente <strong>de</strong> la représentation linéaire<br />
1/Ip = f(1/c) indique le fait que l’argile offre un milieu biocompatible avec NR.<br />
Le caractère hydrophile du laponite et l’absence <strong>de</strong>s réactions chimiques<br />
pendant l’immobilisation <strong>de</strong> l’enzyme préviennent la dénaturation <strong>de</strong> la NR.<br />
Une étu<strong>de</strong> préliminaire <strong>de</strong> la stabilité du biocapteur indique une<br />
maintenance <strong>de</strong> 100% <strong>de</strong> la réponse pendant 48 heures. L’efficacité du<br />
biocapteur diminue jusqu'à 80,2 % après 72 heures et jusqu'à 68 % après<br />
96 heures. La diminution du signal est due à la perte <strong>de</strong> viologène et à la<br />
dénaturation <strong>de</strong> l’enzyme.<br />
CONCLUSIONS<br />
Les recherches ont conduit à l’obtention d’un biocapteur, poly 1/NRlaponite/poly<br />
2, pour l’anion NO3 - , basé sur une matrice enzymatique<br />
composite.<br />
Le comportement électrocatalytique du biocapteur poly 1/NR-laponite/<br />
poly 2 met en évi<strong>de</strong>nce un bon contact électrique entre le centre redox <strong>de</strong><br />
l’enzyme immobilisée et la surface <strong>de</strong> l’électro<strong>de</strong> en carbone vitreux.<br />
L’efficacité <strong>de</strong> la communication électrique entre le film du polymère 1, en<br />
contact avec la surface <strong>de</strong> l’électro<strong>de</strong> et le polymère 2, qui se trouve incorporé<br />
dans l’argile, se reflète dans les valeurs <strong>de</strong>s paramètres bioélectroanalytiques<br />
qui se situent parmi les meilleurs dans le domaine.<br />
SECTION EXPERIMENTALE<br />
Le dispositif experimental<br />
Les étu<strong>de</strong>s électrochimiques ont utilisé un potentiostat (AUTOLAB 100,<br />
ECOchemie, Utrecht, Pays Bas) et une cellule électrochimique thermostatée,<br />
á trois électro<strong>de</strong>s: l’électro<strong>de</strong> <strong>de</strong> travail en carbone vitreux ( = 5mm);<br />
l’électro<strong>de</strong> auxiliaire en fil d’Ag; l’électro<strong>de</strong> <strong>de</strong> référence, Ag/AgCl/KCl3M.<br />
Préparation <strong>de</strong> l’électro<strong>de</strong> modifiée<br />
La métho<strong>de</strong> d’immobilisation comporte <strong>de</strong>ux étapes: (i) l’immobilisation<br />
<strong>de</strong> l’enzyme (nitrate réductase, NR) dans une argile hydrophilique (laponite),<br />
déposée sur une couche polymèrique du médiateur redox, obtenue par<br />
l’électropolymerisation d’un dérivé pyrrolique-viologène amphiphilique<br />
(monomère 1; n = 12); (ii) la déposition sur la couche précé<strong>de</strong>nte d’une<br />
couche polymèrique, préparée par l’électropolymerisation d’un dérivé<br />
pyrrolique- viologène soluble dans l’eau (monomère 2) (Schema 1).<br />
L’électro<strong>de</strong> en carbone vitreux a été polie avec <strong>de</strong> la pâte <strong>de</strong> diamant et<br />
nettoyée par ultrasonnage pendant 20 minutes plongée dans l’eau distillée.<br />
Par suite, sur la surface <strong>de</strong> l’électro<strong>de</strong> on a déposé 20 l <strong>de</strong> solution 5mM du<br />
monomère 1, dispersé dans l’eau distillée par ultrasonnage; puis, le solvant a<br />
été évaporé sous vi<strong>de</strong>. L’électro<strong>de</strong> ainsi modifiée a été transférée dans une<br />
67
68<br />
A.M. TODEA, L.M. MUREAN, I.C. POPESCU<br />
cellule contenant une solution aqueuse 0,1 M <strong>de</strong> LiClO4 et l’electropolymérisation<br />
du monomère 1 a été réalisé par électrolyse potentiostatique (0,8 V vs.<br />
Ag/AgCl/KCl3M) pendant 15 minutes, sous argon.<br />
Schema 1<br />
Séparément, on a préparé une suspension colloïdale <strong>de</strong> laponite en<br />
eau bidistillée et 33 l <strong>de</strong> ce mélange (contenant 22 g laponite et 22 g NR)<br />
ont été déposés sur la couche polymérique 1 (poly 1). Après l’évaporation sous<br />
vi<strong>de</strong> <strong>de</strong> l’eau et la formation d’un film adhèrent <strong>de</strong> NR-laponite sur la première<br />
couche polymérique, par l’électropolymérisation oxydative potentiostatique<br />
(0,8 V vs. Ag/AgCl/KCl3M) d’un dérivé pyrrolique-viologène soluble dans l’eau<br />
(monomère 2), à partir d’une solution 5 mM, contenant 0.1 M LiCl4, une<br />
<strong>de</strong>rnière couche polymérique (poly 2) a été déposée sur l’électro<strong>de</strong> modifiée.<br />
La structure finale <strong>de</strong> l’électro<strong>de</strong> modifiée est représentée schématiquement<br />
dans la figure 1.<br />
Laponite / NR / poly 2<br />
poly 1<br />
Figure 1. Représentation schématique <strong>de</strong> l’électro<strong>de</strong> modifiée<br />
(V 2+ , viologène; , nitrate réductase; , polymère).<br />
REMERCIEMENTS<br />
Les auteurs remercient Dr. Serge Cosnier et Dr. Christine Mousty (Laboratoire<br />
d’Electrochimie Organique et <strong>de</strong> Photochimie Redox, UMR CNRS 5630, Institut<br />
<strong>de</strong> <strong>Chimie</strong> Moléculaire, FR CNRS 2607, Université Joseph Fourier, Grenoble)<br />
pour les produits chimiques utilisés pour la construction du biocapteurs et pour<br />
l’accueil <strong>de</strong> Mlle To<strong>de</strong>a dans leur laboratoire.<br />
(1)<br />
(2)
CARACTÉRISATION OPÉRATIONNELLE D’UN BIOCAPTEUR AMPÉROMÉTRIQUE …<br />
BIBLIOGRAPHIE<br />
1. F. W. Scheller, F. Schubert, J. Fedrowitz (eds.), “Frontiers in Biosensorics I“,<br />
Birkhauser Verlag, Basel, 1997, chapitre 4, pp. 49.<br />
2. L. M. Moretto, P. Ugo, M. Zanata, P. Guerriero, C. R. Martin, Analytical Chemistry,<br />
1998, 70, 2163.<br />
3. S. Cosnier, C. Innocent, Y. Jouanneau, Analytical Chemistry, 1994, 66, 3198.<br />
4. G. L. Tur<strong>de</strong>an, S. E. Stanca, I. C. Popescu, “Biosenzori amperometrici”, Presa<br />
Universitara Clujeana, 2005, chapitre 2, pp. 15.<br />
5. S. Cosnier, K. Le Lous, Journal of Electroanalytical Chemistry, 1996, 406, 243.<br />
6. S. Poyard, C. Martelet, N. Jaffrezic-Renault, S. Cosnier, P. Labbe, Sensors and<br />
Actuators B, 1999, 58, 380.<br />
7. S. Da Silva, D. Shan, S. Cosnier, Sensors and Actuators B, 2004, 103, 397.<br />
8. A. Senillou, N. Jaffrezic, C. Martelet, S. Cosnier, Analytica Chimica Acta, 1999,<br />
401, 117.<br />
9. S. Cosnier, B. Galland, C. Innocent, Journal of Electroanalytical Chemistry, 1997,<br />
433, 113.<br />
10. S. Cosnier, C. Gondran, A. Senillou, Synthetic Metals, 1999, 102, 1366.<br />
11. G. Ramsay, S. M. Wolpert, Analytical Chemistry, 1999, 71, 504.<br />
69
STUDIA UNIVERSITATIS BABE-BOLYAI, CHEMIA, LIII, 1, 2008<br />
In memoriam prof. dr. Liviu Oniciu<br />
AMPEROMETRIC BIOSENSORS FOR GLUCOSE AND ETHANOL<br />
DETERMINATION IN WINE USING FLOW INJECTION ANALYSIS<br />
LAURA MUREAN a, b, *, KINGA JUDITH ZOR b , MIHAELA NISTOR b ,<br />
ELISABETH CSÖREGI b , IONEL CTLIN POPESCU a<br />
ABSTRACT. Reagentless amperometric biosensors for glucose and ethanol<br />
were <strong>de</strong>veloped and successfully applied for monitoring glucose and ethanol<br />
concentrations in wine during the fermentation process. The glucose biosensor<br />
was based on commercially available glucose oxidase and horseradish<br />
peroxidase co-immobilized on solid graphite using Os(II)-redox hydrogel<br />
(RH) [1]. In the case of ethanol biosensor, the quinohemoprotein <strong>de</strong>pen<strong>de</strong>nt<br />
alcohol <strong>de</strong>hydrogenase was immobilized on the graphite electro<strong>de</strong> surface<br />
using the same RH [2]. Both biosensors were operated at low applied<br />
potentials (-50 mV vs. Ag/AgCl, KCl 0.1 M for glucose biosensor, and +250 mV<br />
vs. Ag/AgCl, KCl 0.1 M for ethanol biosensor), where biases from interferences<br />
are minimal. The bioelectroanalytical parameters, estimated from flow injection<br />
analysis measurements, were found as follows: sensitivity, 0.73 ± 0.01 A mM -1<br />
for glucose and 0.45 ± 0.01 A mM -1 for ethanol; linear range up to 1 mM<br />
in both cases; <strong>de</strong>tection limit, 7.0 M for glucose and 8.9 M for ethanol.<br />
The results for real samples were found in good agreement with those<br />
reported by Barsan et al. [3].<br />
Keywords: amperometric biosensors; ethanol; flow injection analysis;<br />
glucose; wine.<br />
INTRODUCTION<br />
The measurement of ethanol and glucose plays an important role<br />
in the control of wine fermentation process and for assesing the quality of<br />
the final product. Methods commonly used for their <strong>de</strong>termination like<br />
chromatography [4], spectrophotometry [5] or enzymatic test-kits [6] require<br />
long analysis times, complex instrumentation, high costs or tedious sample<br />
treatment. These drawbacks can be avoi<strong>de</strong>d using amperometric biosensors<br />
due to their characteristics as high selectivity, low cost, relative simple<br />
preparation and good stability [7].<br />
a<br />
Department of Physical Chemistry, Babes-Bolyai University, 400028 Cluj-Napoca, Romania<br />
* e-mail address: lamur@chem.ubbcluj.ro<br />
b<br />
Department of Analytical Chemistry, Lund University, 22100 Lund, Swe<strong>de</strong>n
72<br />
L. MURESAN, K.J. ZOR, M. NISTOR, E. CSÖREGI, I.C. POPESCU<br />
PQQ-<strong>de</strong>pen<strong>de</strong>nt <strong>de</strong>hydrogenases are attractive due to their oxygen<br />
in<strong>de</strong>pen<strong>de</strong>nce and to the fact that display a direct electron transfer between<br />
their active center and certain electro<strong>de</strong>s [8, 9]. Quinohemoprotein <strong>de</strong>pen<strong>de</strong>nt<br />
alcohol <strong>de</strong>hydrogenase (PQQ-ADH)-based biosensors were previously<br />
reported for the <strong>de</strong>tection of ethanol in alcoholic beverages [2, 10].<br />
Oxidases are usually more stable than <strong>de</strong>hydrogenases and their<br />
use imply the monitoring of hydrogen peroxi<strong>de</strong> produced by the enzymatic<br />
reaction at applied potential higher than 500 mV vs. Ag/AgCl, KCl 0.1 M. The use<br />
of redox mediators immobilized on the electro<strong>de</strong> surface [11] is beneficial in<br />
or<strong>de</strong>r to overcome the use of such high applied potentials.<br />
The properties of osmium redox polymers allow besi<strong>de</strong>s coimmobilization<br />
with the enzyme on the electro<strong>de</strong> surface, the use of low<br />
applied potentials for biosensor operation [12]. Thus, such biosensors are<br />
reagentless and less prone to interferences.<br />
The aim of this work was to <strong>de</strong>velop simple and low cost reagentless<br />
enzyme biosensors based on PQQ-ADH and glucose oxidase (GOx),<br />
respectively, for monitoring of key analytes in wine during the fermentation<br />
process. Os(II)-redox hydrogel was used for “wiring” the enzymes and the<br />
electro<strong>de</strong> and the whole mixture was cross-linked with poly(ethylene glycol)<br />
diglycidyl ether (PEGDGE) [13]. The biosensors present good reproducibility<br />
and their use has the advantage of requiring minimum sample treatment<br />
(dilution).<br />
This work represents a part of a training session taking place at<br />
Fattoria <strong>de</strong>i Barbi, Montalcino, Italy, where several analytes of interest such<br />
as glucose and ethanol were analyzed by alternative techniques.<br />
RESULTS AND DISCUSSIONS<br />
I. Electrochemical behavior of the modified electro<strong>de</strong>s<br />
The <strong>de</strong>tection principle of glucose and ethanol biosensors is presented<br />
in figure 1.<br />
The bienzyme system, presented in figure 1A, on one hand ensures<br />
a high selectivity of the measurements because at the low applied potential<br />
(-50 mV vs. Ag/AgCl, KCl 0.1 M) biases from interferences are minimal, and<br />
on the other hand, offers an increased sensitivity due to the presence of RH<br />
which mediates the electron transfer between HRP and the graphite electro<strong>de</strong>.<br />
The monoenzyme system used for ethanol <strong>de</strong>tection (figure 1B) is<br />
based on the electrical connection of PQQ-ADH to graphite electro<strong>de</strong>, via<br />
RH. The bioelectrocatalytic cycle is closed by electrochemical oxidation of<br />
Os(II) to Os(III) at a low applied positive potential (+250 mV vs. Ag/AgCl,<br />
KCl 0.1 M).
AMPEROMETRIC BIOSENSORS FOR GLUCOSE AND ETHANOL DETERMINATION IN WINE …<br />
A<br />
|I p | / µA<br />
Electro<strong>de</strong><br />
e- e- e- -50 mV<br />
vs.<br />
Ag/AgCl<br />
B<br />
Electro<strong>de</strong><br />
e- e- Os3+ Os3+ Os3+ Os2+ Os2+ Os2+ +250 mV<br />
vs. Ag/AgCl<br />
Os2+ Os2+ HRPred<br />
HRP ox<br />
GOx red<br />
GOx ox<br />
Gluconic<br />
acid<br />
Glucose Glucose<br />
Figure 1. Detection principle for (A) glucose and (B) ethanol biosensors.<br />
5<br />
4<br />
3<br />
2<br />
1<br />
A<br />
I max = (4.93 ± 0.30) µA<br />
K M = (0.79 ± 0.14) mM<br />
Chi 2 = 5.14*10 4 , R 2 = 0.9825<br />
0<br />
0 2 4 6 8 10<br />
[Glucose] / mM<br />
Figure 2. (A) Calibration curve and (B) linear range for glucose biosensor.<br />
Experimental conditions: flow rate, 0.5 ml min -1 ; supporting electrolyte,<br />
0.1 M phosphate buffer containing 0.1 M KCl, pH 7.2; applied potential,<br />
–50 mV vs. Ag/AgCl, KCl 0.1 M.<br />
O 2<br />
H 2 O 2<br />
H 2 O<br />
Os3+ Os Acetal<strong>de</strong>hy<strong>de</strong><br />
3+ Acetal<strong>de</strong>hy<strong>de</strong><br />
PQQ-ADH red<br />
PQQ-ADH PQQ-ADHox ox<br />
I P / nA<br />
800 B<br />
600<br />
400<br />
200<br />
Ethanol<br />
0<br />
0 250 500 750 1000<br />
[Glucose] / µM<br />
73
74<br />
L. MURESAN, K.J. ZOR, M. NISTOR, E. CSÖREGI, I.C. POPESCU<br />
In or<strong>de</strong>r to investigate their electrochemical behavior, the prepared<br />
biosensors were integrated in a FIA system. Amperometric measurements<br />
were performed by injecting constant volumes of increasing substrate<br />
concentrations and recording the corresponding peak currents. As expected,<br />
both enzymes presented the Michaelis-Menten behavior. A calibration curve<br />
for glucose is presented in figure 2A. The kinetic parameters were found<br />
as: Imax = (4.93 ± 0.30) A and KM = (0.79 ± 0.14) mM. The linear range of<br />
the calibration curve is presented in figure 2B. The error bars stand for<br />
standard <strong>de</strong>viation, estimated for 6 enzyme electro<strong>de</strong>s.<br />
The corresponding bioelectroanalytical parameters are synthesized<br />
in table 1.<br />
The same procedure was followed for the ethanol biosensors and<br />
the calibration curve is presented in figure 3. The kinetic parameters estimated<br />
from the calibration curve were: Imax = (2.25 ± 0.01) A and KM = (4.05 ±<br />
0.05) mM. As can be seen from figure 3B, small error bars indicate a quite<br />
good reproducibility of the results (standard <strong>de</strong>viation calculated as the mean<br />
of three in<strong>de</strong>pen<strong>de</strong>nt measurements). The ethanol biosensor characteristics<br />
are summarized in table 1.<br />
|I p | / µµA<br />
1.6<br />
1.2<br />
0.8<br />
0.4<br />
0.0<br />
A<br />
I max = (2.25 ± 0.01) µA<br />
K M = (4.05 ± 0.05) mM<br />
Chi 2 = 12.90, R 2 = 0.9999<br />
0 2 4 6 8 10<br />
[Ethanol] / mM<br />
0<br />
0 250 500 750 1000<br />
Figure 3. (A) Calibration curve and (B) linear range for ethanol biosensor.<br />
Experimental conditions: flow rate, 0.5 ml min -1 ; supporting electrolyte,<br />
0.1 M acetate buffer containing 1 mM CaCl2, pH 6.2; applied potential,<br />
+250 mV vs. Ag/AgCl, KCl 0.1 M.<br />
The results are within the limits reported in the literature for different<br />
kind of glucose and ethanol biosensors. Good reproducibility, large linear<br />
range and relatively low <strong>de</strong>tection limits make the <strong>de</strong>veloped biosensors<br />
suitable for applications in real samples.<br />
I p / nA<br />
500 B<br />
400<br />
300<br />
200<br />
100<br />
[Ethanol] / µM
AMPEROMETRIC BIOSENSORS FOR GLUCOSE AND ETHANOL DETERMINATION IN WINE …<br />
Table 1.<br />
Bioelectroanalytical parameters for glucose and ethanol biosensors.<br />
Experimental conditions: see figures 2 and 3.<br />
Biosensor<br />
Sensitivity**<br />
(A mM -1 )<br />
Linear range<br />
(µM)<br />
Detection limit***<br />
(µM)<br />
R / N<br />
Glucose 0.73 ± 0.01* up to 1000 7.0 0.9997 / 11<br />
Ethanol 0.45 ± 0.01* up to 1000 8.9 0.9986 / 8<br />
* standard <strong>de</strong>viation for 6 (glucose) or 3 (ethanol) measurements.<br />
** calculated as the slope of the linear range.<br />
*** estimated for signal / noise ratio equal to 3.<br />
II. Real samples measurements<br />
After the biosensors were calibrated, measurements were performed<br />
in wine samples, collected at different fermentation times from a winery.<br />
Thus, the real samples were diluted (1:10000 for glucose and 1:400 for<br />
ethanol <strong>de</strong>termination) in the corresponding buffers in or<strong>de</strong>r to get the<br />
response in the linear range of the calibration curves, and injected in the<br />
flow line. The results were expressed in g l -1 and represented as function of<br />
time elapsed from the beginning of sampling. As observed in figure 4, in 27<br />
h from the beginning of the sampling (51 h from the beginning of the<br />
fermentation process), the glucose concentration <strong>de</strong>creased with 32.9 %,<br />
while ethanol concentration increased with 4.5 %.<br />
[Glucose] / g l -1<br />
120<br />
110<br />
100<br />
90<br />
80<br />
0<br />
0 5 10 15 20 25 30<br />
Time / h<br />
8<br />
6<br />
[Ethanol] / g l -1<br />
4<br />
2<br />
Figure 4. Variation in the glucose<br />
and ethanol concentrations during<br />
the alcoholic fermentation. Symbols:<br />
glucose; ethanol. Experimental<br />
conditions: see figures 2 and 3. Obs:<br />
The first sample was collected after<br />
24 h from the beginning of the<br />
fermentation process.<br />
The results were similar to those obtained with a biosensor based<br />
on GOx-poly(neutral) red-BSA-GA adsorbed on carbon-film electro<strong>de</strong> as<br />
well as with those found by HPLC on analysis of the same samples [3]. The<br />
75
76<br />
L. MURESAN, K.J. ZOR, M. NISTOR, E. CSÖREGI, I.C. POPESCU<br />
observed differences are not significant and can be due to the different<br />
conservation conditions of the samples before being analyzed.<br />
CONCLUSIONS<br />
Bi- and monoenzyme biosensors for glucose and ethanol <strong>de</strong>tection,<br />
based on GOx-HRP and PQQ-ADH, respectively, were <strong>de</strong>veloped and used<br />
in an off-line FIA system for wine fermentation monitoring.<br />
The analytical parameters for both types of sensors were estimated<br />
from amperometric calibrations in flow injection mo<strong>de</strong>. The biosensors<br />
presented good reproducibility and were successfully applied for analysis of<br />
glucose and ethanol during fermentation of wine.<br />
EXPERIMENTAL SECTION<br />
Reagents and solutions<br />
Glucose oxidase from Aspergillus niger (EC 1.1.3.4.), PQQ <strong>de</strong>pen<strong>de</strong>nt<br />
alcohol <strong>de</strong>hydrogenase from Gluconobacter sp. 3.3 and horseradish<br />
peroxidase (HRP) (EC 1.11.1.7) were purchased from Sigma-Aldrich (Poole,<br />
UK), while poly(ethylene glycol) diglycidyl ether was supplied from Polysciences<br />
(Warrington, PA, USA).<br />
Poly(1-vinylimidazole) complexed with Os (4,4’-dimethylbipyridine)2Cl<br />
(PVI10dmeOs) (figure 5) was prepared accordingly to a previously published<br />
procedure [12].<br />
D(+) glucose anhydrous from Sigma-Aldrich (Poole, UK) and absolute<br />
ethanol 99.7% from Solveco Chemicals AB (Swe<strong>de</strong>n) were used to prepare<br />
the standard solutions necessary for the sensor calibrations.<br />
Acetic acid glacial 99% from Sigma-Aldrich (Poole, UK), sodium<br />
acetate <strong>de</strong>hydrate and calcium chlori<strong>de</strong> <strong>de</strong>hydrate from Merck (Darmstadt,<br />
Germany) were used to prepare 0.1 M acetate buffer containing 1 mM CaCl2<br />
(pH 6.2). Disodium hydrogen phosphate <strong>de</strong>hydrate, sodium dihydrogen<br />
phosphate and potassium chlori<strong>de</strong> purchased from Merck (Darmstadt,<br />
Germany), were utilized to prepare the 0.1 M phosphate buffer containing<br />
0.1 M KCl (pH 7.2). All reagents were of analytical gra<strong>de</strong> and used as<br />
received. If not otherwise indicated, the solutions were prepared in purified<br />
water obtained from a Milli-Q system (Millipore, Bedford, MA, USA).<br />
Biosensors preparation<br />
Consi<strong>de</strong>ring the good properties reported for the redox hydrogelbased<br />
biosensors, amperometric biosensors for the <strong>de</strong>tection of glucose<br />
and ethanol were <strong>de</strong>veloped accordingly to a previously <strong>de</strong>scribed method<br />
[2, 10].
AMPEROMETRIC BIOSENSORS FOR GLUCOSE AND ETHANOL DETERMINATION IN WINE …<br />
Prior to the modification,<br />
rods of spectroscopic<br />
graphite (Ringsdorff-Werke<br />
GmbH, Bonn-Bad, Germany,<br />
type RW001, 3.05 mm diameter)<br />
were mechanically<br />
polished on a wet fine emery<br />
paper (Tufback, Durite P1200,<br />
Allar, Sterling Heights, MI).<br />
The electro<strong>de</strong>s were rinsed<br />
with distilled water before<br />
coating them with 5 µL of<br />
enzyme mixtures, prepared<br />
as <strong>de</strong>scribed below.<br />
A mixture containing<br />
2.9 mg ml -1 GOx, 0.7 mg ml -1<br />
HRP, 1.15 mg ml -1 PVI10–<br />
dmeOs, and 0.3 mg ml -1<br />
PEGDGE (freshly prepared aqueous solution and used within 15 min) was<br />
used to prepare the glucose biosensors.<br />
PQQ-ADH from Gluconobacter was previously reported as bioselective<br />
receptor for ethanol biosensor [9]. A mixture containing 1.7 mg ml -1 PQQ-ADH,<br />
2.2 mg ml -1 PVI10–dmeOs, and 0.55 mg ml -1 Figure 5. Structure of the Os(II)-redox hydrogel.<br />
PEGDGE (freshly prepared<br />
aqueous solution and used within 15 min) was used for the preparation of<br />
ethanol biosensors. The composition of the modified electro<strong>de</strong>s is given in<br />
table 2.<br />
Table 2.<br />
The composition of enzyme matrix.<br />
Type of<br />
biosensor<br />
Composition (%)<br />
Glucose GOx-HRP-PVI10dmeOs-PEGDGE 57 : 14.2 : 22.8 : 6<br />
Ethanol PQQ-ADH-PVI10dmeOs-PEGDGE 37.5 : 50 : 12.5<br />
The electro<strong>de</strong>s were left to dry at room temperature and kept at + 4 0 C<br />
until tested.<br />
If not otherwise indicated, the presented results are average values<br />
of three equally prepared electro<strong>de</strong>s.<br />
Real samples preparation<br />
Must during fermentation (Fattoria <strong>de</strong>i Barbi, Montalcino, Italy, 2005)<br />
was monitored during a period of 27 hours, by analyzing the glucose and<br />
77
78<br />
L. MURESAN, K.J. ZOR, M. NISTOR, E. CSÖREGI, I.C. POPESCU<br />
ethanol concentrations with the <strong>de</strong>veloped biosensors in an off-line flow<br />
injection analysis (FIA) system. Taking into account that the concentration<br />
of the measured compounds is outsi<strong>de</strong> the working range of the sensors,<br />
dilution of the samples was necessary before injecting them into the FIA<br />
system. The samples were diluted 1:10000 (v/v) for glucose <strong>de</strong>termination<br />
and 1:400 (v/v) for ethanol <strong>de</strong>termination with the corresponding buffer<br />
solutions.<br />
Electrochemical measurements<br />
A mono-line FIA set-up consisting of a manual injection valve (Valco<br />
Instruments Co. Inc., Houston, TX, USA) with an injection loop of 100 µL, a<br />
peristaltic pump (Alitea AB, Stockholm, Swe<strong>de</strong>n), a wall-jet electrochemical<br />
cell, a potentiostat (Zäta-Elektronik, Höör, Swe<strong>de</strong>n) and a single channel<br />
recor<strong>de</strong>r (Mo<strong>de</strong>l BD 111, Kipp & Zonen, Delft, The Netherlands) was employed<br />
to operate the amperometric biosensors. The working electro<strong>de</strong>s were the<br />
enzyme-modified graphite electro<strong>de</strong>s, the reference electro<strong>de</strong> a Ag/AgCl,<br />
KCl 0.1 M and the counter electro<strong>de</strong> a Pt wire. The system was operated at a<br />
constant potential of -50 mV vs. Ag/AgCl, KCl 0.1 M in the case of glucose<br />
biosensor and +250 mV vs. Ag/AgCl, KCl 0.1 M in the case of ethanol<br />
biosensor.<br />
ACKNOWLEDGMENTS<br />
The European Commission (NovTech project, contract no: HPRN-CT-2002-<br />
00186) and research grant CNCSIS (267/2007-2008) are acknowledged for<br />
financial support, and Fattoria <strong>de</strong>i Barbi, Montalcino, Italy for providing the<br />
wine samples.<br />
REFERENCES<br />
1. L. Gorton, G. Bremle, E. Csöregi, G. Jönsson-Pettersson, B. Persson, Analytica<br />
Chimica Acta, 1991, 249, 43.<br />
2. M. Niculescu, R. Mieliauskiene, V. Laurinavicius, E. Csöregi, Food Chemistry,<br />
2003, 82, 481.<br />
3. M. M. Bârsan, J. Klincar, M. Batic, C. M. A. Brett, Talanta, 2007, 71, 1893.<br />
4. R. Vonach, B. Lendl, R. Kellner, Journal of Chromatography A, 1998, 824, 159.<br />
5. N. Choengchan, T. Mantima, P. Wilairat, P. K. Dasgupta, S. Motomizu, D.<br />
Nacapricha, Analytica Chimica Acta, 2006, 579, 33.<br />
6. A. K. Sarker, H. Ukeda, D. Kawana, M. Sawamura, Food Research International,<br />
2001, 34, 393.<br />
7. M. I. Prodromidis, M. I. Karayannis, Electroanalysis, 2002, 14, 241.
AMPEROMETRIC BIOSENSORS FOR GLUCOSE AND ETHANOL DETERMINATION IN WINE …<br />
8. A. Ramanavicius, K. Habermuller, E. Csöregi, V. Laurinavicius, W. Schuhmann,<br />
Analytical Chemistry, 1999, 71, 3581.<br />
9. J. Razumiene, M. Niculescu, A. Ramanavicius, V. Laurinavicius, E. Csöregi,<br />
Electroanalysis, 2002, 14, 43.<br />
10. M. Niculescu, T. Erichsen, V. Sukharev, Z. Kerenyi, E. Csöregi, W. Schuhmann,<br />
Analytica Chimica Acta, 2002, 463, 39.<br />
11. L. Gorton, E. Dominguez, Reviews in Molecular Biotechnology, 2002, 82, 371.<br />
12. T. J. Ohara, R. Rajagopalan, A. Heller, Analytical Chemistry, 1994, 66, 2451.<br />
13. R. Antiochia, L. Gorton, Biosensors & Bioelectronics, 2007, 22, 2611.<br />
79
STUDIA UNIVERSITATIS BABE-BOLYAI, CHEMIA, LIII, 1, 2008<br />
In memoriam prof. dr. Liviu Oniciu<br />
PASTED NICKEL ELECTRODES FOR ALKALINE BATTERIES<br />
ELEONORA MARIA RUS a , DELIA MARIA CONSTANTIN a ,<br />
GEORGETA ARLUNG b<br />
ABSTRACT. Pasted nickel electro<strong>de</strong>s for alkaline batteries were prepared<br />
by <strong>de</strong>position of the electrodic mixture slurry (active material, conductive<br />
additives and bin<strong>de</strong>r) on nickel foam substrate and on nickelated iron grid,<br />
respectively.The electrochemical behaviour of these electro<strong>de</strong>s in 6N KOH<br />
electrolyte has been investigated by cyclic voltammetry and performance<br />
curves. From cyclic voltammograms were <strong>de</strong>termined the electrochemical<br />
processes that occur on the electro<strong>de</strong>s in normal conditions, at overcharge and<br />
overdischarge.The coulombic efficiencies, calculated from charge-discharge<br />
curves in galvanostatic regime, <strong>de</strong>monstrated the better performance of pasted<br />
electro<strong>de</strong>s on nickel foam substrate.<br />
Key words: Pasted nickel electro<strong>de</strong>s, coulombic efficiencies, charge-discharge<br />
curves, Cyclic Voltammetry.<br />
INTRODUCTION<br />
The structural and electrochemical characteristics of a given catho<strong>de</strong><br />
material have a great influence on the performance of electrochemical power<br />
sources. Nickel hydroxi<strong>de</strong> is a successful catho<strong>de</strong> material used in Ni-Cd, Ni-Zn,<br />
Ni-Fe, Ni-H2 and in the more environmentally friendly Ni-MH systems [1-3].<br />
Nickel based alkaline batteries are attractive since the nickel electro<strong>de</strong><br />
can be fabricated with very large surface areas which lead to high capacities<br />
and high current <strong>de</strong>nsities. The electrolyte does not enter into the electro<strong>de</strong><br />
reaction so that conductivity stays at a high level throughout the usable capacity<br />
of the battery. In addition, the nickel active material is insoluble in KOH<br />
electrolyte which leads to longer life and better abuse tolerance. Only a<br />
proton is involved in the charge/discharge reaction leading to very small<br />
<strong>de</strong>nsity changes and improved mechanical stability of the electro<strong>de</strong> during<br />
cycling. Also, the gravimetric and volumetric energy <strong>de</strong>nsities are very good<br />
for the nickel electro<strong>de</strong> [4, 5].<br />
a Babe-Bolyai University, Faculty of Chemistry and Chemical Engineering, 11 Arany Janos St.<br />
Cluj-Napoca 400024, Romania, norus@chem.ubbcluj.ro<br />
b University of Agricultural Sciences and Veterinary Medicine, 3-5 Manastur St. 400509 Cluj-Napoca,<br />
Romania
82<br />
ELEONORA MARIA RUS, DELIA MARIA CONSTANTIN, GEORGETA ARLUNG<br />
The processes that take place during charge-discharge of the nickel<br />
electro<strong>de</strong> are represented by the equation:<br />
NiOOH + H2O + e - ⇔ Ni(OH)2 + HO - ; ε 0 = 0.490 V/NHE (1)<br />
The active material of the nickel electro<strong>de</strong> consists of Ni(II) hydroxi<strong>de</strong><br />
in discharged state and Ni(III) oxihydroxi<strong>de</strong> in charged state.<br />
There are two primary commercial technologies for manufacturing<br />
nickel electro<strong>de</strong>s (which have been in existence for some 100 years): sintering<br />
and pasting.<br />
A sintered electro<strong>de</strong> consists of a substrate, a porous Ni plaque<br />
sintered on the substrate, and an active mass of nickel hydroxi<strong>de</strong> filled in<br />
the pores of the plaque. Sintered electro<strong>de</strong>s are characterized by high rate<br />
capability, good longevity, long-term storage, and low self-discharge. The<br />
electro<strong>de</strong> is wi<strong>de</strong>ly used in portable NiCd and NiMH batteries and is highly<br />
preferred for high drain-rate applications.<br />
Pasted electro<strong>de</strong>s, however, are gaining in popularity due to a reduced<br />
complexity in mass production, higher specific capacity, and lower environmental<br />
concerns. The performance of NiMH batteries using pasted nickel electro<strong>de</strong>s<br />
has advanced quickly and even the power <strong>de</strong>nsity is approaching and<br />
outperforming those with sintered electro<strong>de</strong>s. A pasted electro<strong>de</strong> is ma<strong>de</strong><br />
by pasting a slurry of active mass that contains nickel hydroxi<strong>de</strong>, additives and<br />
bin<strong>de</strong>r materials into a porous substrate followed by drying and calendaring<br />
to finish the electro<strong>de</strong> [6, 7].<br />
In our paper, the electrochemical behaviour of pasted nickel electro<strong>de</strong>s<br />
prepared by us on nickel foam substrate and on nickelated iron grid,<br />
respectively, is presented.<br />
RESULTS AND DISCUSSION<br />
Cyclic Voltammetry<br />
The voltammograms recor<strong>de</strong>d on a nickel plate in 6N KOH at different<br />
potential sweep rates are shown in Fig. 1.<br />
The potential was scanned between the values at which oxygen<br />
evolution reaction (OER) and hydrogen evolution reaction (HER) occurred.<br />
Previously, the surface of the electro<strong>de</strong> was electrochemically treated by<br />
cathodic polarization at -1.1V for 5 minutes. The stabilized form of voltammograms<br />
was obtained, at v = 20 mV/s, only after 8 oxidation-reduction cycles.<br />
This stabilized pro<strong>file</strong> of voltammograms corresponds to obtaining of<br />
some reproductible discharge capacities of electro<strong>de</strong>s in batteries.<br />
In the anodic sweep at ε = - 0.550 V, the formation of Ni(OH)2 (peak<br />
A) takes place which at potentials between 0.530 - 0.630 V is oxidized to<br />
NiOOH (peak B). OER begins at 0.700 - 0.750 V, <strong>de</strong>pending of sweep rates.
PASTED NICKEL ELECTRODES FOR ALKALINE BATTERIES<br />
In the cathodic sweep, the reduction of NiOOH to Ni(OH)2 (peak C)<br />
occurs at potentials between 0.300 - 0.400 V, while the reduction of Ni(OH)2 to<br />
Ni is not observable because of HER.<br />
ε ε<br />
' a , p + c, p<br />
The average potential, ε = , and the difference of peak<br />
positions, ∆εp=εa,p-εc,p of NiOOH / Ni(OH)2 couple, was calculated from anodic<br />
and cathodic peak potential values , for all the sweep rates.<br />
Figure 1. Cyclic voltammograms of nickel plate electro<strong>de</strong> in 6N KOH at<br />
v = 50 mV/s (1), v = 30 mV/s (2) and v = 20 mV/s (3)<br />
The efficiency of processes was estimated from the anodic and<br />
cathodic peak currents ratio values (Ic,p / Ia,p ) (table 1).<br />
It was observed that the reversibility of oxidation-reduction processes<br />
estimated from ∆εp values is better as the sweep rates are smaller. The<br />
anodic and cathodic peak currents (Ia,p and Ic,p) are higher as sweep rates<br />
increase. The Ic,p / Ia,p ratio increases when sweep rate <strong>de</strong>creases.<br />
The stabilized form of voltammograms for pasted nickel electro<strong>de</strong>s<br />
on nickelated iron grid and on nickel foam substrate, obtained after 5<br />
oxidation-reduction cycles, for three sweep rates, are presented in figure 2<br />
and figure 3.<br />
Figure 2 shows that in the anodic sweep the peak B, corresponding<br />
to the charge process, is not observable because of OER (overcharge<br />
process) which take place at more negative potentials. But, the peak C<br />
recor<strong>de</strong>d in the cathodic sweep is associated with the reduction of NiOOH<br />
formed in anodic sweep concomitantly with O2 evolution.<br />
2<br />
83
84<br />
ELEONORA MARIA RUS, DELIA MARIA CONSTANTIN, GEORGETA ARLUNG<br />
Figure 2. Cyclic voltammograms of pasted nickel electro<strong>de</strong> on nickelated<br />
iron grid in 6N KOH at v = 50 mV/s (1), v = 30 mV/s (2) and v = 20 mV/s (3)<br />
Figure 3. Cyclic voltammograms of pasted nickel electro<strong>de</strong> on nickel foam substrate<br />
in 6N KOH at v = 50 mV/s (1), v = 30 mV/s (2) and v = 20 mV/s (3)<br />
For an efficient charge of the pasted nickel electro<strong>de</strong> on grid support,<br />
the oxygen evolution must be minimized.<br />
The voltammograms presented in figure 3 show that OER occurs at<br />
more positive potential so that the charge process of electro<strong>de</strong> is better.<br />
Thus, using nickel foam as support, the performance of pasted nickel<br />
electro<strong>de</strong>s in alkaline batteries is enhanced by minimizing of the parasitic O2<br />
evolution reaction and by improving the charge process, compared to<br />
electro<strong>de</strong>s on grid support.
PASTED NICKEL ELECTRODES FOR ALKALINE BATTERIES<br />
The results of cyclic voltammetry measurements of tested electro<strong>de</strong>s<br />
related to the peak B and C are tabulated in Table 1.<br />
Table 1.<br />
Cyclic voltammetry measurements of tested electro<strong>de</strong>s in 6N KOH at 20 mV/s<br />
Electro<strong>de</strong><br />
εa,p(B)<br />
(V)<br />
εc,p(C)<br />
(V)<br />
∆εp<br />
(V)<br />
ε’<br />
(V)<br />
Ia,p(B)<br />
(µA)<br />
Ic,p(C)<br />
(µA)<br />
Ni plate 0.529 0.408 0.121 0.468 6.6 5.8 0.97<br />
Grid support - 0. 308 - - - 6 -<br />
Foam support 0.700 0.307 0.393 0.503 2.7 2.2 0.81<br />
Ic,p / Ia,p<br />
For pasted nickel electro<strong>de</strong> on foam support, the Ic,p / Ia,p ratio value<br />
<strong>de</strong>monstrates that the charge recovered on the cathodic sweep was very<br />
close with that of the previous anodic sweep, suggesting the high efficiency<br />
of processes.<br />
Galvanostatic Charge-Discharge Curves<br />
The discharge curves of tested electro<strong>de</strong>s are shown in Fig. 4 and<br />
Fig. 5.<br />
E B<br />
[ V ]<br />
1 . 6<br />
1 . 4<br />
1 . 2<br />
1 . 0<br />
0 . 8<br />
0 . 6<br />
0 . 4<br />
0 . 2<br />
0 . 0<br />
I = 1 0 m A<br />
I = 2 0 m A<br />
I = 4 0 m A<br />
0 1 2 3 4 5<br />
T i m e [ h ]<br />
Figure 4. Discharge curves for pasted nickel electro<strong>de</strong> on nickelated iron grid at<br />
three discharge rates.<br />
The charge capacities, Ccharge, correspond to charging for 4h at I =<br />
15 mA and the discharge capacities were <strong>de</strong>termined from the plateaus of<br />
the discharge curves. The coulombic efficiencies rF, calculated from the<br />
charge-discharge characteristics, are presented in table 2.<br />
85
86<br />
ELEONORA MARIA RUS, DELIA MARIA CONSTANTIN, GEORGETA ARLUNG<br />
E B<br />
[ V ]<br />
1 .6<br />
1 .4<br />
1 .2<br />
1 .0<br />
0 .8<br />
0 .6<br />
0 .4<br />
I = 1 0 m A<br />
I = 2 0 m A<br />
I = 4 0 m A<br />
0 1 2 3 4 5 6<br />
T im e [h ]<br />
Figure 5. Discharge curves for pasted nickel electro<strong>de</strong> on nickel foam support at<br />
three discharge rates.<br />
Coulombic efficiencies of tested electro<strong>de</strong>s<br />
Electro<strong>de</strong> Ccharge<br />
Idischarge<br />
tdischarge<br />
Cdischarge<br />
rF<br />
(%)<br />
(mAh) (mA) (h) (mAh)<br />
60 10 4.08 40.8 68.00<br />
Grid 60 20 1.66 33.2 55.33<br />
support 60 40 0.70 28.0 46.66<br />
60 10 5.16 51.6 86.00<br />
Foam 60 20 2.15 43.0 71.66<br />
support 60 40 0.92 36.8 61.33<br />
Table 2.<br />
It is obvious that the discharge capacities and coulombic efficiencies<br />
of the pasted nickel electro<strong>de</strong>s on nickel foam support are substantially<br />
increased compared to the electro<strong>de</strong>s on nickelated iron grid.<br />
The pasted nickel electro<strong>de</strong>s on nickel foam support can be recomen<strong>de</strong>d<br />
for successful utilization as catho<strong>de</strong>s in alkaline batteries due to their<br />
electrochemical characteristics.<br />
CONCLUSIONS<br />
Two types of pasted nickel electro<strong>de</strong>s were realized by <strong>de</strong>position of<br />
the electrodic mixture slurry consisting of NiOOH as active material, nickel<br />
pow<strong>de</strong>r and graphite as conductive additives and polyvinyl alcohol as<br />
bin<strong>de</strong>r on nickel foam substrate and on nickelated iron grid, respectively.
PASTED NICKEL ELECTRODES FOR ALKALINE BATTERIES<br />
The electrochemical behaviour of these electro<strong>de</strong>s in 6N KOH<br />
electrolyte has been investigated by cyclic voltammetry and charge-discharge<br />
curves in galvanostatic regime, at room temperature.<br />
It was established that both electro<strong>de</strong>s require five charge-discharge<br />
cycles to achieve a stabilized capacity, corresponding to formation process.<br />
The charge process of nickel electro<strong>de</strong>s occurs in competition with<br />
OER and for an efficient charge of pasted nickel electro<strong>de</strong>s the oxygen<br />
evolution must be minimized.<br />
Using nickel foam as support, the performance of pasted nickel<br />
electro<strong>de</strong>s in alkaline batteries is enhanced by minimizing of the parasitic<br />
O2 evolution reaction and by improving the charge process, compared to<br />
electro<strong>de</strong>s on grid support.<br />
The pasted nickel electro<strong>de</strong>s on nickel foam support can be recommen<strong>de</strong>d<br />
for successful utilization as catho<strong>de</strong>s in alkaline batteries due to their<br />
electrochemical characteristics.<br />
EXPERIMENTAL SECTION<br />
Pasted nickel electro<strong>de</strong>s for alkaline batteries were prepared by the<br />
following important steps:<br />
♦ preparation of active material;<br />
♦ preparation of electrodic mixture;<br />
♦ realization of electro<strong>de</strong>s.<br />
Active material was prepared in the charged form by chemical<br />
precipitation of Ni(OH)2 from a NiSO4.7H2O solution with a KOH solution<br />
followed by a chemical oxidation of Ni(OH)2 to NiOOH [8].<br />
The prepared electrodic mixture consists of NiOOH as active<br />
material, nickel pow<strong>de</strong>r and graphite as conductive additives and polyvinyl<br />
alcohol as bin<strong>de</strong>r. Two types of electro<strong>de</strong>s were realized by <strong>de</strong>positon of<br />
the electrodic mixture slurry on nickel foam substrate and on nickelated iron<br />
grid, respectively.<br />
The electrochemical behaviour of these electro<strong>de</strong>s in 6N KOH<br />
electrolyte has been investigated by cyclic voltammetry and charge-discharge<br />
curves in galvanostatic regime, at room temperature.<br />
The cyclic voltammetry experiments were performed by means of an<br />
Wenking HP 72 potentiostat, a PV2 programmer Meinsberg type, a MV 87<br />
Pracitronic digital milivoltmeter and a NE 230 X-Y recor<strong>de</strong>r. A platinum wire<br />
as counter electro<strong>de</strong> and a saturated calomel electro<strong>de</strong> (SCE) as reference<br />
were used.<br />
The charge-discharge curves were performed in a half-cell consisting<br />
of pasted nickel electro<strong>de</strong> as working electro<strong>de</strong>, a nickel plate as counter<br />
electro<strong>de</strong> and a SCE as reference electro<strong>de</strong>. All the potentials given in this<br />
paper are referred to SCE.<br />
87
88<br />
ELEONORA MARIA RUS, DELIA MARIA CONSTANTIN, GEORGETA ARLUNG<br />
REFERENCES<br />
1. L. Oniciu, Eleonora Maria Rus, Surse electrochimice <strong>de</strong> putere, Ed. Dacia, Cluj-<br />
Napoca, 1987, chapter 7.<br />
2. B. Paxton, J. Newman, Journal of Electrochemical Society, 1997, 144, 3818.<br />
3. J. Desilvestro, O. Haas, Journal of Electrochemical Society, 1990, 137, 5c.<br />
4. A. Forrest, Mo<strong>de</strong>rn Battery Technology, Center for Professional Advancement,<br />
Trumbore ed., 1995, chapter 2.<br />
5. D. Noreus, Substitution of Rechargeable Ni-Cd Batteries, Stockholm University,<br />
2000, 1.<br />
6. J. J. C. Kopera, Insi<strong>de</strong> the Nickel Metal Hydri<strong>de</strong> Battery, Cobasys, 25 June 2004,<br />
www.cobasys.com.<br />
7. V. Srinivasan, B. C. Cornilsen, J. W. Weidner, Journal of Solid State Electrochemistry,<br />
2005, 9, 61.<br />
8. Delia Maria Constantin, Eleonora Maria Rus, Silvia Fenic, Producerea, transportul<br />
i utilizarea energiei, 2000, XIX, 70.
STUDIA UNIVERSITATIS BABE-BOLYAI, CHEMIA, LIII, 1, 2008<br />
In memoriam prof. dr. Liviu Oniciu<br />
STRUCTURE, MORPHOLOGY AND ELECTROCHEMICAL<br />
PROPERTIES OF HIGH SURFACE AREA COPPER ELECTRODES<br />
OBTAINED BY THERMAL SPRAYING TECHNIQUES<br />
ANDREA KELLENBERGER a , N. VASZILCSIN a , N. DUEANU a ,<br />
M.L. DAN a , WALTRAUT BRANDL b<br />
ABSTRACT. Three types of high surface area copper electro<strong>de</strong>s were<br />
prepared by thermal spraying techniques. CuAl electro<strong>de</strong>s were obtained<br />
by thermal arc spraying of two different wires (Cu and Al) followed by the<br />
alkaline dissolution of aluminum. Cu wire and Cu pow<strong>de</strong>r electro<strong>de</strong>s were<br />
obtained by combustion spraying of copper wires and pow<strong>de</strong>rs, respectively.<br />
Several methods have been used to characterize the electro<strong>de</strong>s, including<br />
scanning electron microscopy, energy dispersive X-ray analysis and X-ray<br />
diffraction. The electrocatalytic activity of the electro<strong>de</strong>s was evaluated based<br />
on the steady-state polarization curves and electrochemical impedance data.<br />
It has been found that the structure of the prepared electro<strong>de</strong>s <strong>de</strong>pends to<br />
a great extent on the <strong>de</strong>position method, i.e. combustion spraying gives<br />
<strong>de</strong>posits with higher surface roughness and porosity. Decreasing the particles<br />
size leads to the increase of the porosity and surface roughness and also<br />
to the increase of the copper oxi<strong>de</strong> content.<br />
Keywords: high surface area electro<strong>de</strong>s, thermal spraying, electrocatalysis,<br />
electrochemical impedance spectroscopy<br />
INTRODUCTION<br />
Electrochemistry has been often seen as a potential route for the<br />
<strong>de</strong>velopment of environmentally friendly and sustainable methods for energy<br />
generation and organic synthesis [1]. However, an important issue is the<br />
increase of the rate of electrochemical reactions, which is equivalent to the<br />
reduction of the overpotential. There are two important methods which may<br />
be applied in<strong>de</strong>pen<strong>de</strong>ntly or combined to attain this purpose: the increase<br />
of the electro<strong>de</strong> real surface area and the increase of the electro<strong>de</strong> intrinsic<br />
activity. The real surface area may be enlarged by appropriate preparation<br />
a “Politehnica” University of Timioara, Faculty of Industrial Chemistry and Environmental<br />
Engineering, 300006 – Timisoara, P-ta Victoriei 2, Romania<br />
b University of Applied Sciences Gelsenkirchen, Material Science Department, Nei<strong>de</strong>nburger<br />
Str. 10, 45877 – Gelsenkirchen, Germany
ANDREA KELLENBERGER, N. VASZILCSIN, N. DUEANU, M.L. DAN, WALTRAUT BRANDL<br />
methods such as composite coating [2-4], pow<strong>de</strong>r pressing [5-7] or thermal<br />
spray [8-11], whereas the electrocatalytic activity is increased by doping [12]<br />
or surface modification.<br />
High surface area electro<strong>de</strong>s have found numerous applications in<br />
electrocatalysis, especially for the gas evolution / consumption reactions<br />
such as: hydrogen evolution reaction (HER), hydrogen oxidation reaction<br />
(HOR) and oxygen reduction reaction (ORR), in some organic reduction<br />
reactions, in batteries and fuel cells [13].<br />
Consi<strong>de</strong>rable research has been done in the past years on performant<br />
hydrogen catho<strong>de</strong>s with low hydrogen overpotential. The major application<br />
for such catho<strong>de</strong>s is the alkaline water electrolysis and alkaline chlori<strong>de</strong><br />
electrolysis. The activity for the hydrogen evolution reaction can be substantially<br />
improved by increasing the surface area of the electro<strong>de</strong> [14].<br />
The aim of this work is to study the influence of the structure and<br />
morphology on the electrochemical activity of high surface area copper<br />
electro<strong>de</strong>s. The method used in this study to prepare the electro<strong>de</strong>s is the<br />
thermal spray <strong>de</strong>position of an electroactive coating based on copper on a<br />
conducting carbon-stel support.<br />
RESULTS AND DISCUSSION<br />
SEM and EDX studies<br />
The SEM micrographs taken for the surface of the electro<strong>de</strong>s and<br />
the OM micrographs taken for the cross-section of the electro<strong>de</strong>s are shown in<br />
Figures 1-3.<br />
Figure 1. CuAl electro<strong>de</strong> after leaching;<br />
(a) surface, magnitu<strong>de</strong> 100×; (b) cross-section, magnitu<strong>de</strong> 50 ×<br />
The CuAl electro<strong>de</strong> shows a high irregular and rough structure,<br />
characterized by the formation of wi<strong>de</strong> pores in the structure after the<br />
dissolution of aluminum. The cross section image reveals a complex layered<br />
structure with interlamelar porosity and inclusion of voids and oxi<strong>de</strong> particles.<br />
The dimension of pores varies in a large range between 70 – 200 µm.<br />
90
STRUCTURE, MORPHOLOGY AND ELECTROCHEMICAL PROPERTIES OF HIGH SURFACE AREA …<br />
Figure 2. Copper wire electro<strong>de</strong>;<br />
(a) surface, magnitu<strong>de</strong> 100×; (b) cross-section, magnitu<strong>de</strong> 50 ×<br />
Figure 3. Copper pow<strong>de</strong>r electro<strong>de</strong>;<br />
(a) surface, magnitu<strong>de</strong> 100×; (b) cross-section, magnitu<strong>de</strong> 50 ×<br />
The Cu wire and Cu pow<strong>de</strong>r electro<strong>de</strong>s show a much more regular<br />
structure and a uniform distribution of the pore sizes. The surface of the Cu<br />
wire electro<strong>de</strong> is characterized by the presence of molten droplets flattened<br />
during the impact with the substrate. The diameter of pores varies between<br />
50 – 70 µm. In the case of Cu pow<strong>de</strong>r electro<strong>de</strong>s spherical shaped particles<br />
are present on the surface and the pore diameter is 10 – 30 µm.<br />
The Energy Dispersive X-Ray analysis allows a semi-quantitative<br />
<strong>de</strong>termination of the element composition of the coatings. The composition<br />
of the copper electro<strong>de</strong>s is given in Table 1.<br />
Results of the EDX analysis of the copper electro<strong>de</strong>s.<br />
Table 1.<br />
Electro<strong>de</strong> CuAl Cu wire Cu pow<strong>de</strong>r<br />
Composition Cu wt% Al wt% O wt% Cu wt% Al wt% Cu wt% Al wt%<br />
As sprayed<br />
Leached<br />
67.5<br />
88.7<br />
19.2<br />
1.6<br />
13.3<br />
9.7<br />
82.9 17.1 88.8 11.2<br />
91
ANDREA KELLENBERGER, N. VASZILCSIN, N. DUEANU, M.L. DAN, WALTRAUT BRANDL<br />
Before leaching, the CuAl electro<strong>de</strong> has a relatively high content of<br />
aluminum which <strong>de</strong>creases more than tenfold after leaching. In all cases<br />
oxygen was also <strong>de</strong>tected, indicating a certain <strong>de</strong>gree of oxidation of the<br />
copper electro<strong>de</strong>s. Comparing the oxygen content of the electro<strong>de</strong>s the<br />
oxidation <strong>de</strong>gree can be <strong>de</strong>termined. Based on this values it has been<br />
calculated that the oxidation <strong>de</strong>gree of Cu pow<strong>de</strong>r electro<strong>de</strong>s is 1.53 times<br />
higher than that of Cu wire electro<strong>de</strong>s.<br />
X-Ray Diffraction was used to <strong>de</strong>termine the phases obtained during<br />
the <strong>de</strong>position process. The diffraction patterns of the CuAl coating (here<br />
not shown) before leaching shows the presence of the aluminum. After the<br />
dissolution of the aluminum only the peaks corresponding to copper appear.<br />
The diffraction patterns of the Cu wire and Cu pow<strong>de</strong>r electro<strong>de</strong>s<br />
reveal the presence of the copper oxi<strong>de</strong>, formed during the thermal spray<br />
process. As a representative example the X-ray spectra for the Cu pow<strong>de</strong>r<br />
electro<strong>de</strong> are given in Figure 4.<br />
Figure 4. Diffraction patterns of the Cu pow<strong>de</strong>r electro<strong>de</strong>.<br />
In both cases the RX spectra shows the characteristic peaks of<br />
Cu2O at diffraction angles equal to 2 = 36.52; 42.49; 61.45 for Cu wire and<br />
2 = 36.51; 42.46; 61.47 for Cu pow<strong>de</strong>r respectively. The height of the first<br />
peak may offer quantitative information about the oxidation <strong>de</strong>gree of the<br />
electro<strong>de</strong>s. Thus, it has been obtained a 1.66 higher oxidation <strong>de</strong>gree of<br />
the Cu pow<strong>de</strong>r electro<strong>de</strong> as compared with the Cu wire electro<strong>de</strong>. This<br />
value is in good agreement with that calculated from EDX data.<br />
Electrochemical measurements<br />
The electrochemical activity of the prepared electro<strong>de</strong>s was compared<br />
with that of a smooth copper electro<strong>de</strong>. The steady state polarization curves<br />
recor<strong>de</strong>d in NaOH solution are given in Figure 5. At low current <strong>de</strong>nsity a<br />
92
STRUCTURE, MORPHOLOGY AND ELECTROCHEMICAL PROPERTIES OF HIGH SURFACE AREA …<br />
<strong>de</strong>polarization of approximately 200 mV was found for the Cu pow<strong>de</strong>r electro<strong>de</strong><br />
compared with the smooth copper electro<strong>de</strong>. However, at higher current<br />
<strong>de</strong>nsities the <strong>de</strong>polarization reduces to 100 mV, probably due to the occlusion<br />
of pores by hydrogen bubbles due to the intensification of the HER at more<br />
negative overpotential.<br />
Figure 5. Current-potential curves in 1M NaOH solution at 21 o C. Scan rate 1 mV/s.<br />
EIS measurements were performed on the high surface area copper<br />
electro<strong>de</strong>s at electro<strong>de</strong> potentials located in the hydrogen evolution region.<br />
Complex plane plots for the smooth Cu, CuAl, Cu wire and Cu pow<strong>de</strong>r<br />
electro<strong>de</strong>s at −1.2 V are given in Figure 6.<br />
In all four cases the shape of the impedance spectra corresponds to<br />
a <strong>de</strong>pressed semicircle in the studied frequency range. The experimental<br />
impedance data were fitted to an electrical equivalent circuit consisting of<br />
the solution resistance RS in series with a parallel connection between a<br />
constant phase element CPE and the charge transfer resistance Rct [15,16].<br />
The total impedance of this mo<strong>de</strong>l is equal to:<br />
S<br />
( ( ) ) 1<br />
− 1 −<br />
R + T j<br />
Z = R + ω (1)<br />
ct<br />
where T is a parameter related to the double layer capacitance and φ is the<br />
constant phase angle parameter. The double layer capacitance is given by<br />
[17]:<br />
φ<br />
dl<br />
( ) φ<br />
− 1 −1<br />
1−<br />
R + R<br />
T = C<br />
(2)<br />
S<br />
ct<br />
93
ANDREA KELLENBERGER, N. VASZILCSIN, N. DUEANU, M.L. DAN, WALTRAUT BRANDL<br />
Figure 6. Nyquist plots obtained in 1M NaOH solution at 21 o C. Symbols are experimental<br />
data and continuous lines are fitted data by the Levenberg-Marquardt procedure.<br />
The values of the circuit elements obtained by mo<strong>de</strong>ling the<br />
experimental data are given in Table 2.<br />
Tabel 2.<br />
Impedance data obtained in 1 M NaOH solution for the studied copper electro<strong>de</strong>s.<br />
Electro<strong>de</strong> RS [ cm -2 ] Rct [ cm -2 ] Cdl [F cm -2 ] Rf<br />
Cu smooth 1.88 753 0.187⋅10 -3<br />
CuAl 1.90 14.1 13.8⋅10 -3<br />
Cu wire 1.67 5.08 14.7⋅10 -3<br />
Cu pow<strong>de</strong>r 1.92 1.85 17.210 -3<br />
7.5<br />
552<br />
588<br />
692<br />
The surface roughness factor Rf of the prepared electro<strong>de</strong>s was<br />
<strong>de</strong>termined from the ratio of the double layer capacitance values and the<br />
double layer capacitance of a smooth copper electro<strong>de</strong>. Assuming a value<br />
of 25⋅10 -6 F cm -2 suggested in the literature for the double layer capacity of<br />
a smooth electro<strong>de</strong>, the highest surface area has been obtained for the Cu<br />
pow<strong>de</strong>r electro<strong>de</strong>, followed by the Cu wire electro<strong>de</strong>.<br />
CONCLUSIONS<br />
Thermal spraying is a suitable method to obtain porous structures<br />
with high surface area. The CuAl electro<strong>de</strong>s present a rough surface with large<br />
pores, with a diameter between 70 – 200 µm. The Cu wire and Cu pow<strong>de</strong>r<br />
electro<strong>de</strong>s reveal also a porous structure but the pores are much smaller,<br />
i.e. between 50 – 70 µm for the wire sprayed electro<strong>de</strong>s and 10 – 30 µm for<br />
the pow<strong>de</strong>r sprayed electro<strong>de</strong>s.<br />
94
STRUCTURE, MORPHOLOGY AND ELECTROCHEMICAL PROPERTIES OF HIGH SURFACE AREA …<br />
The shift of the current-potential curves to lower overpotentials,<br />
comparatively to a smooth copper electro<strong>de</strong>, is to be attributed to the<br />
surface area enhancement effect.<br />
The values of the roughness factor <strong>de</strong>termined from the impedance<br />
data are in good agreement with the increase of the porosity observed from<br />
the SEM and OM micrographs. The <strong>de</strong>crease of the charge transfer resistance<br />
values is consistent with the increase of the current <strong>de</strong>nsities obtained by<br />
polarisation measurements.<br />
Based on the steady-state polarisation and impedance measurements,<br />
improved electrocatalytic activities for the hydrogen evolution reaction are<br />
attributed to the increase of the real surface of the electro<strong>de</strong>s.<br />
EXPERIMENTAL SECTION<br />
Electro<strong>de</strong> preparation<br />
The high surface area copper electro<strong>de</strong>s were prepared by thermal arc and<br />
combustion spraying of three different types of materials: CuAl alloy wire,<br />
Cu wire and Cu pow<strong>de</strong>r.<br />
The CuAl electro<strong>de</strong> was prepared by thermal arc spraying of a CuAl wire<br />
(92% Cu, 8% Al) with a diameter of 1.6 mm. The operating parameters<br />
were set to: arc current 200 A, arc voltage 30 V and gas pressure 3 bars.<br />
After <strong>de</strong>positon the coating was activated by alkaline leaching of the Al in<br />
1M NaOH at 80 o C for 120 min.<br />
The Cu wire and Cu pow<strong>de</strong>r electro<strong>de</strong>s were obtained by combustion spraying<br />
of copper wire (Cu 99.8%) with the diameter of 1.6 mm and copper pow<strong>de</strong>r<br />
with the particle size -90 +45 m (-170 +325 mesh) respectively. The <strong>de</strong>position<br />
was performed with an oxyacetylene torch and with air as atomizing gas<br />
(pressure 3 bars).<br />
In all cases, as a support for the electroactive coating a carbon steel plate<br />
with the dimensions of 100×300×3 mm was used. Prior to the <strong>de</strong>position<br />
the substrate was <strong>de</strong>greased and san<strong>de</strong>d with corundum in or<strong>de</strong>r to assure<br />
an a<strong>de</strong>quate adherence.<br />
Electro<strong>de</strong> characterization<br />
The surface morphology of the electro<strong>de</strong>s was investigated by scanning<br />
electron microscopy (SEM) with a Philips XL 30 ESEM microscope operating<br />
at 20 kV and by optical microscopy (OM) using a LEICA D MR/M microscope.<br />
The elemental composition was <strong>de</strong>termined by Energy dispersive X-Ray<br />
analysis (EDX) coupled with the scanning electron microscopy. For the phase<br />
composition X-Ray diffraction spectra were registered with a Philips X’pert<br />
diffractometer using the Cu-K radiation.<br />
95
ANDREA KELLENBERGER, N. VASZILCSIN, N. DUEANU, M.L. DAN, WALTRAUT BRANDL<br />
Electrochemical measurements<br />
The electrocatalytic activity of the copper electro<strong>de</strong>s was investigated towards<br />
the hydrogen evolution reaction. Steady state current-potential curves were<br />
recor<strong>de</strong>d with a VoltaLab 21 potentiostat in 1 mol L -1 NaOH solution with a<br />
scan rate of 1mV s -1 . A conventional three-electro<strong>de</strong> electrochemical cell was<br />
used with a platinum counterelectro<strong>de</strong> and a saturated calomel electro<strong>de</strong> as<br />
reference. The iR drop between the electro<strong>de</strong> surface and solution was<br />
minimized using a Haber-Luggin capillary, placed at about 1 mm of the surface.<br />
Electrochemical impedance spectroscopy (EIS) was applied to <strong>de</strong>termine<br />
the surface roughness of the electro<strong>de</strong>s. Impedance spectra in the frequency<br />
range 1 kHz to 10 mHz were recor<strong>de</strong>d using a Solartron Instruments 1287<br />
Potentiostat and a 1255B Frequency Response Analyzer. The experimental<br />
data were fitted to the equivalent circuit by a complex non-linear least squares<br />
(CNLS) Levenberg-Marquard procedure using the ZView-Scribner Associates<br />
Inc. software.<br />
REFERENCES<br />
1. M. A. Matthews, Pure and Applied Chemistry, 2001, 73, 1305.<br />
2. H. J. Miao, D. L. Piron, Electrochimica Acta, 1993, 38, 1079.<br />
3. Y. Choquette, L. Brossard, A. Lasia, H. Menard, Electrochimica Acta, 1991, 35, 1251.<br />
4. Y. Choquette, L. Brossard, A. Lasia, H, Menard, Journal of the Electrochemical<br />
Society, 1990, 137, 1723.<br />
5. P. Los, A. Rami, A. Lasia, Journal of Applied Electrochemistry, 1993, 23, 135.<br />
6. C. Hitz, A. Lasia, Journal of Electroanalytical Chemistry, 2001, 500, 213.<br />
7. R. P. Simpraga; B. E. Conway, Electrochimica Acta, 1998, 43, 3045.<br />
8. D. Miousse, A. Lasia, V. Borck, Journal of Applied Electrochemistry, 1995, 25, 592.<br />
9. G. Schiller, R. Henne, V. Borck, Journal of Thermal Spray Technology, 1995, 4, 185.<br />
10. J. Fournier, D. Miousse, J. G. Legoux, International Journal of Hydrogen Energy,<br />
1999, 24, 519.<br />
11. L. Birry, A. Lasia, Journal of Applied Electrochemistry, 2004, 34, 735.<br />
12. T. Kenjo, Electrochimica Acta, 1988, 33, 41.<br />
13. “Fuel Cell Handbook” by EG&G Technical Services (Seventh Edition), 2004.<br />
14. a) A. Kellenberger, N. Vaszilcsin, W. Brandl, N. Duteanu, International Journal of<br />
Hydrogen Energy, 2007, 32, 3258; b) A. Kellenberger, N. Vaszilcsin, W. Brandl,<br />
Journal of Solid State Electrochemistry, 2007, 11, 84; c) N. Vaszilcsin, W. Brandl,<br />
A. Kellenberger, D. Toma, Chemical Bulletin of Polytechnic University Timioara,<br />
1998, 43, 330.<br />
15. L. Chen, A. Lasia, Journal of the Electrochemical Society, 1991, 138, 3321.<br />
16. L. Birry, A. Lasia, Journal of Applied Electrochemistry, 2004, 34, 735.<br />
17. G. J. Brug, A. L. G Van Der Ee<strong>de</strong>n, M. Sluyters-Rehbach, J. H. Sluyters, Journal of<br />
Electroanalytical Chemistry, 1984, 176, 275.<br />
96
STUDIA UNIVERSITATIS BABE-BOLYAI, CHEMIA, LIII, 1, 2008<br />
In memoriam prof. dr. Liviu Oniciu<br />
ELECTRODEPOSITION OF SOME HEAVY METALS ON<br />
RETICULATED VITREOUS CARBON ELECTRODE<br />
SORIN-AUREL DORNEANU * , BEKE FERENCZ-LÁSZLÓ, PETRU ILEA<br />
ABSTRACT. Nowadays, the damage of the environment quality has reached<br />
alarming levels requiring severe measures for stopping this process. In or<strong>de</strong>r<br />
to harmonise with the maximum admitted concentrations (MAC) of heavy<br />
metal ions (HMIs) in the discharged effluents, the electrochemical procedures<br />
represent a clean, flexible and efficient alternative of <strong>de</strong>contamination. In<br />
this context, the present paper <strong>de</strong>scribes the results of our researches<br />
concerning the electroextraction of heavy metals from synthetic diluted<br />
solutions. Starting from simple or complex solutions with initial HMI contents of<br />
10 ppm (parts per million), the MAC can be reached after 90 min. of<br />
electrolysis in a continuous flow electrochemical reactor equipped with a<br />
three-dimensional (3D) electro<strong>de</strong> ma<strong>de</strong> of reticulated vitreous carbon.<br />
Keywords: electro<strong>de</strong>position, heavy metal ions, reticulated vitreous carbon<br />
electro<strong>de</strong>, waste waters<br />
INTRODUCTION<br />
Many manufacturing sectors like galvanotechnical, metallurgical,<br />
electronic or chemical industries produce huge quantities of high pollutant<br />
residual waste waters containing HMIs. At the end of the past century, the<br />
production of hazardous wastes was estimated, as <strong>de</strong>scribed in Table 1, at<br />
about 7000 millions tons/year, from millions tons/year are generated only in<br />
the European Community [1].<br />
Table 1.<br />
Estimated global production of industrial wastes [1]<br />
Manufacturing sectors Contained metals Quantity (tons/year)<br />
Electronic As, Cr, Hg, Se, Ni, Cu 1200000<br />
Mineral oil and coal As, Pb, V, Cd, Ni, Zn 1200000<br />
Mining and metallurgy Hg, Cr, Cu, As, Zn, Pb 390000<br />
Agriculture Mg, As, Cu 1400000<br />
Metals’ Processing Cr, Co, Ni, Fe 240000<br />
Others 720000<br />
* Department of Physical Chemistry, “Babes-Bolyai” University, 11 Arany Janos, 400028 Cluj-<br />
Napoca, Romania; dorneanu@chem.ubbcluj.ro
98<br />
S.A. DORNEANU, F.L. BEKE, P. ILEA<br />
The recycling of heavy metals represents an economical and<br />
ecological solution for the treatment of these huge quantities of wastes. The<br />
liquid effluents containing HMIs, resulted from the metals processing<br />
industry, can be electrochemically treated in or<strong>de</strong>r to extract the metals by<br />
means of the cathodic <strong>de</strong>position: M z+ + ze – M. The recovery of pure<br />
metals represents the main advantage of the electro<strong>de</strong>position.<br />
Depending on the HMIs’ concentrations, the heavy metals recovery<br />
from waste waters by electro<strong>de</strong>position can be done in different manners.<br />
For high concentrations (over few grams per litter), two-dimensional catho<strong>de</strong>s<br />
can be used and the content of HMIs can be reduced with one or<strong>de</strong>r of<br />
magnitu<strong>de</strong>. The resulting effluent can be reused in the process or it can be<br />
introduced in a new stage of chemical or electrochemical <strong>de</strong>contamination.<br />
For low HMIs’ concentrations, un<strong>de</strong>r hundreds milligrams per litter, 3D<br />
electro<strong>de</strong>s can be used and the content of HMIs can be reduced to levels<br />
that allow the discharge of the effluents in environment.<br />
The 3D electro<strong>de</strong>s are generally ma<strong>de</strong> from carbonaceous materials,<br />
among witch the reticulated vitreous carbon (RVC), having the best<br />
performances, is the mainly used material. The RVC is ma<strong>de</strong> exclusively from<br />
vitreous carbon and has an open honeycomb-shaped structure, conferring to<br />
the material a small electric resistance, a high porosity and a high specifically<br />
surface area. It is produced at different <strong>de</strong>grees of porosity between 10 and<br />
100 pores per inch (ppi), having a pores’ fraction between 90 and 97% [2].<br />
At pH = 7, the RVC electrochemical stability domain is ranged between -1.2<br />
and +1.0 V vs. SCE. In the absence of Cl – ions and <strong>de</strong>pending on the pH<br />
value, the anodic limit corresponds to the water <strong>de</strong>composition to oxygen;<br />
the useful cathodic potential domain is limited by the reduction reaction of the<br />
hydrogen (rrH) and can be exten<strong>de</strong>d to more negative values by <strong>de</strong>position of<br />
a Hg thin layer on the RVC surface [3].<br />
Concerning the use of RVC for the heavy metals recovery from<br />
waste waters, the literature presents many studies [4-12], but, in the majority<br />
of them, the composition of the aqueous solutions was modified by adding<br />
of concentrated supporting electrolytes in or<strong>de</strong>r to increase the electrolyte<br />
conductivity.<br />
In this paper, we present our results concerning the electroextraction<br />
of heavy metals from synthetic diluted solutions by using RVC. Simple or<br />
complex solutions with initial HMIs contents of 10 ppm were prepared using<br />
diluted HNO3. The specific electro<strong>de</strong>position potentials were evaluated by cyclic<br />
voltametry (CV) and the prepared solutions were electrolysed potentiostatically<br />
in a continuous flow electrochemical reactor (ER), equipped with a 3D RVC<br />
electro<strong>de</strong>. The residual concentrations of HMIs were measured by atomic<br />
adsorption spectroscopy (AAS).
ELECTRODEPOSITION OF SOME HEAVY METALS ON RETICULATED VITREOUS CARBON ELECTRODE<br />
RESULTS AND DISCUSSION<br />
CV studies<br />
Arming to evaluate the possibilities of the HMIs’ electroextraction<br />
from extremely diluted electrolytes, preliminary studies were completed by<br />
CV in mono-elemental solutions. The measurements were performed at a<br />
scan rate of 50 mV/s, all the solutions being <strong>de</strong>aerated by nitrogen bubbling<br />
in or<strong>de</strong>r to eliminate the interferences due to the oxygen electroreduction.<br />
For each studied HMI, the working electro<strong>de</strong> compartment was firstly filled<br />
with 5 mL of 10 mM HNO3 and the voltamogram of the supporting electrolyte<br />
was recor<strong>de</strong>d. After this, 1, 1, and respectively 3 mL of 10 mg/L dissolved<br />
metal solutions in 10 mM HNO3 were ad<strong>de</strong>d successively (resulting HMI’s<br />
concentrations of 1.66, 2.85 and 5 ppm, respectively) and the corresponding<br />
voltamograms were recor<strong>de</strong>d. Two examples of the acquired curves in 1.66<br />
and 5 ppm HMIs’ solutions during the cathodic scan are presented in<br />
Figure 1.<br />
I / µµ A<br />
0<br />
-200<br />
-400<br />
-600<br />
-800<br />
f<br />
a<br />
g<br />
e<br />
c<br />
b<br />
d<br />
[Me] = 1.66 ppm<br />
-2.0 -1.6 -1.2 -0.8<br />
E / V/Ag/AgCl/KCl sat<br />
I / µ A<br />
0<br />
-200<br />
-400<br />
-600<br />
f<br />
a<br />
g<br />
c<br />
-2.0 -1.6 -1.2 -0.8<br />
E / V/Ag/AgCl/KCl sat<br />
e<br />
b<br />
d<br />
[Me] = 5 ppm<br />
Figure 1. Recor<strong>de</strong>d curves by CV in 1.66 and 5 ppm of corresponding HMIs<br />
solutions during the cathodic scan: a – supporting electrolyte only; b – Cd; c – Co;<br />
d – Cu; e – Ni; f – Pb; g – Zn. (anodic polarization curves are not presented)<br />
As it can be seen from Figure 1, excepting the Pb case, where the<br />
electro<strong>de</strong>posited metal blokes the rrH, the HMIs’ additions induce increases<br />
of the cathodic currents even at the 1.66 ppm concentration level. Moreover,<br />
the increase of the HMIs’ concentrations shifts the start of the net cathodic<br />
current to more positive potential values, suggesting that the heavy metal<br />
electro<strong>de</strong>position process starts before the rrH. Unfortunately, an optimal<br />
electro<strong>de</strong>position potential cannot be evaluated by CV studies due the fact that<br />
the rrH occurs simultaneously with the heavy metal electro<strong>de</strong>position process.<br />
99
100<br />
S.A. DORNEANU, F.L. BEKE, P. ILEA<br />
Electro<strong>de</strong>position studies<br />
The studies concerning the heavy metal electro<strong>de</strong>position from monoelemental<br />
or complex solutions were performed using electrolyte volumes<br />
of 250 or 350 mL, respectively. At 5, 10, 15, 20, 25, 30, 35, 40, 45, 50, 55,<br />
60, 70 and 90 minutes after the experiments’ begin, aliquots of 3 or 10 mL<br />
respectively, were sampled from the overflow outlet and were analysed by<br />
AAS. During the experiments, the working electro<strong>de</strong> current (IW.E.), the<br />
counter-electro<strong>de</strong> potential (EC.E.) and the cell voltage (EC) were also recor<strong>de</strong>d,<br />
allowing us to estimate the current efficiency (ηC) and the specific electricity<br />
consumption (WS).<br />
Single metal electro<strong>de</strong>position results<br />
Figure 2 presents two examples of recor<strong>de</strong>d signals during the<br />
electroextraction of Cu and Ni from the corresponding mono-elemental<br />
solutions at working electro<strong>de</strong> potentials (EW.E.) of – 200 mV and -1200 mV<br />
respectively, in rapport with the previously mentioned reference electro<strong>de</strong>.<br />
Based on the recor<strong>de</strong>d data and the AAS results, the final parameters (as<br />
presented in Table 2) were evaluated after 90 min. of electrolysis<br />
E C.E., C / V<br />
I W.E. / mA<br />
1.6<br />
1.2<br />
0.8<br />
-10<br />
-20<br />
E C<br />
E C.E.<br />
I W.E.<br />
[Cu] 0 = 10 ppm<br />
E W.E. = - 200 mV/Ref 1<br />
-30<br />
0 10 20 30 40 50 60 70 80 90<br />
t / min.<br />
E C.E., C / V<br />
I W.E. / mA<br />
16<br />
12<br />
8<br />
4<br />
0<br />
-600<br />
-800<br />
-1000<br />
-1200<br />
E C<br />
E C.E.<br />
[Ni] 0 = 10 ppm<br />
E W.E. = - 1200 mV/Ref 1<br />
I W.E.<br />
-1400<br />
0 10 20 30 40 50 60 70 80 90<br />
t / min.<br />
Figure 2. Recor<strong>de</strong>d signals during the electroextraction of Cu and Ni from the<br />
corresponding mono-elemental solutions.<br />
Estimated final parameters after 90 min. of electrolysis<br />
Metal Residual concentration ηC WS<br />
Cu 0.09 ppm 24.2 % 0.043 kWh m -3<br />
Ni 0.29 ppm 0.16 % 44.2 kWh m -3<br />
Table 2.
ELECTRODEPOSITION OF SOME HEAVY METALS ON RETICULATED VITREOUS CARBON ELECTRODE<br />
As it can be seen from Figure 2 and Table 2, the recor<strong>de</strong>d signals<br />
and also the ηC and the WS present acceptable values in the case of Cu,<br />
but <strong>de</strong>gra<strong>de</strong> significantly for the Ni electro<strong>de</strong>positions due to the parallel rrH<br />
process. The evolution of HMIs’ concentrations during their electroextraction<br />
from the corresponding mono-elemental solutions is presented in Figure 3.<br />
[Me] / ppm<br />
10<br />
8<br />
6<br />
4<br />
2<br />
0<br />
0 10 20 30 40 50 60 70 80 90<br />
t / min.<br />
Figure 3. The evolution of studied HMIs’ concentrations during their<br />
electroextraction from the corresponding mono-elemental solutions<br />
As it can be see from Figure 3, excepting the Zn case, all the<br />
concentrations of the studied HMIs quickly <strong>de</strong>crease during the first hour of<br />
their electroextraction from the corresponding mono-elemental solutions. The<br />
residual concentrations values ([Me]Res. Mono, presented in Table 3, together<br />
with the values of the applied working electro<strong>de</strong> potentials, EW.E. Mono) are<br />
similar with the MAC levels [13].<br />
Simultaneous metals electro<strong>de</strong>position results<br />
The evolution of studied HMIs’ concentrations during their electroextraction<br />
from the complex multi-elemental solution is presented in Figure<br />
4 and the residual HMIs’ concentration values ([Me]Res. Multi) are presented in<br />
Table 3.<br />
Table 3.<br />
Comparison of the HMIs’ electro<strong>de</strong>position parameters from<br />
mono and multi-elemental solutions<br />
Metal Cd Co Cu Ni Pb Zn<br />
EW.E. Mono / V - 0.8 - 1.1 - 0.2 - 1.2 -0.6 -1.2<br />
[Me]Res. Mono / ppm 0.51 1.52 0.09 0.29 0.12 4.63<br />
[Me]Res. Multi / ppm 0.60 1.01 0.006 1.06 0.40 1.76<br />
MAC / ppm 0.30 - 0.20 1.00 0.50 1.00<br />
Cd<br />
Co<br />
Cu<br />
Ni<br />
Pb<br />
Zn<br />
101
102<br />
[Me] / ppm<br />
12<br />
10<br />
8<br />
6<br />
4<br />
2<br />
0<br />
S.A. DORNEANU, F.L. BEKE, P. ILEA<br />
Cd<br />
Co<br />
Cu<br />
Ni<br />
Pb<br />
Zn<br />
0 10 20 30 40 50 60 70 80 90<br />
t / min.<br />
Figure 4. The concentrations evolution of studied HMIs during their electroextraction<br />
from the complex multi-elemental solution on RVC electro<strong>de</strong><br />
polarised at -1100 mV vs. Ag/AgCl/KClsat reference electro<strong>de</strong>s<br />
As it can be observed from Figure 4 and Table 3, the [Me]Res. Multi<br />
evaluated after the HMIs electro<strong>de</strong>position from multi-elemental solutions<br />
<strong>de</strong>crease for Co, Cu and Zn and increase for Cd, Ni and Pb. Moreover, it is<br />
worth to note that the [Me]Res. Multi values for Cu, Ni and Pb are very similar<br />
with the MAC levels.<br />
CONCLUSIONS<br />
The results of our researches concerning the electroextraction of<br />
some heavy metals (Cu, Co, Cd, Ni, Pb and Zn) from diluted solutions allow<br />
us to formulate the following conclusions:<br />
• the electroextraction of Cu, Ni and Pb from extremely diluted<br />
solutions allows to achieve directly the MAC levels;<br />
• for Cd and Zn, the obtained residual concentrations are in close<br />
proximity to the MAC levels;<br />
• the mixture of studied HMIs doesn’t obstruct the components<br />
electro<strong>de</strong>position, the individual residual concentrations being similar with<br />
the obtained ones in mono-elemental solutions;<br />
• surprisingly, for Zn, the residual concentration after the electro<strong>de</strong>position<br />
from multi-elemental solution is smaller that the obtained one<br />
after the electro<strong>de</strong>position from mono-elemental solution;<br />
• this preliminary results prove the feasibility of the electrochemical<br />
<strong>de</strong>contamination of the heavy metal polluted waste waters, but, in the same<br />
time, they require further researches in or<strong>de</strong>r to optimise the experimental<br />
parameters and also to validate the results using real waste waters.
ELECTRODEPOSITION OF SOME HEAVY METALS ON RETICULATED VITREOUS CARBON ELECTRODE<br />
EXPERIMENTAL SECTION<br />
Reagents<br />
The all solutions were prepared starting from mono-elemental AAS<br />
standard solutions (Merck) of Cd, Co, Cu, Ni, Pb and Zn, each one containing<br />
1 g/L of dissolved metal and 0.5 M HNO3. All prepared mono-elemental<br />
solutions contained 10 mg/L of the corresponding dissolved metal and 10 mM<br />
HNO3. The tested complex solution contained 10 mg/L of each mentioned<br />
metal and 30 mM HNO3. In or<strong>de</strong>r to achieve the <strong>de</strong>sired compositions, 63 %<br />
HNO3 solution (Merck, p.a.) and double-distilled water were also used.<br />
Experimental setups<br />
For CV measurements, a three-compartment glass electrochemical<br />
cell was used. A vitreous carbon disc ( = 3 mm), an Ag/AgCl/KClsat system<br />
and a Pt wire ( = 0.8 mm, L = 15 mm) were utilized as working, reference<br />
and counter electro<strong>de</strong>, respectively. The LabView 6.1 software and a PCI<br />
6024 E data acquisition board (National Instruments, USA) were also used<br />
for driving a computer controlled home-ma<strong>de</strong> potentiostat.<br />
The electro<strong>de</strong>position measurements were completed using the<br />
experimental setup <strong>de</strong>scribed in Figure 5.<br />
1<br />
2<br />
5<br />
9<br />
10<br />
Figure 5. Experimental setup for the heavy metals electro<strong>de</strong>position:<br />
1 – uncompartmented ER; 2 - peristaltic pump; 3 – electrolyte tank;<br />
4 – computer controlled potentiostat; 5 – drilled diaphragm for flow<br />
uniforming; 6 – graphite bar ano<strong>de</strong>s; 7 – RVC catho<strong>de</strong>; 8 – overflow<br />
outlet; 9 – catho<strong>de</strong> reference electro<strong>de</strong>; 10 – ano<strong>de</strong> reference electro<strong>de</strong>.<br />
6<br />
7<br />
8<br />
4<br />
3<br />
103
104<br />
S.A. DORNEANU, F.L. BEKE, P. ILEA<br />
The second experimental setup inclu<strong>de</strong>s a home-ma<strong>de</strong> plexiglas<br />
uncompartmented ER, a Reglo-Digital peristaltic pump (Ismatec, Switzerland)<br />
and a HP72 potentiostat (Wenking, Germany). A 100 ppi RVC parallelepiped<br />
(L x W x H = 48 mm x 24 mm x 30 mm) was used as catho<strong>de</strong> and four<br />
graphite cylindrical bars ( = 12 mm, L = 30 mm) were utilised as counterelectro<strong>de</strong>s.<br />
Two Ag/AgCl/KClsat reference electro<strong>de</strong>s were used to record<br />
the catho<strong>de</strong>’s and ano<strong>de</strong>’s potentials during the electro<strong>de</strong>position. In or<strong>de</strong>r<br />
to assure a laminar and uniform electrolyte flow, a drilled PVC diaphragm was<br />
fixed between the inlet port and the electro<strong>de</strong>s compartment. The overflow<br />
outlet maintains a constant electrolyte level insi<strong>de</strong> of the ER, allowing also<br />
periodical electrolyte sampling for the HMIs’ content analysis.<br />
The AAS measurements were completed with an Avanta PM<br />
spectrometer (GBC, Australia). The LabView 6.1 software and a PCI 6024<br />
E board (National Instruments, USA) were used to drive the HP72 potentiostat<br />
and for data acquisition. During the heavy metals electro<strong>de</strong>position<br />
experiments, the peristaltic pump assures a constant electrolyte flow rate of<br />
46 mL/min.<br />
REFERENCES<br />
1. F. Veglio, R. Quaresima, P. Fornari, Waste Mangement, 2003, 23, 245.<br />
2. J.M. Friedrich, C. Ponce-<strong>de</strong>-Leon, G.W. Rea<strong>de</strong>, F.C. Walsh, Journal of<br />
Electroanalytical Chemistry, 2004, 561, 203.<br />
3. J. Wang, Electrochimica Acta, 1981, 26, 1721.<br />
4. M. Lee, J.-G. Ahn, J.-W. Ahn, Hydrometallurgy, 2003, 70, 23.<br />
5. I. Whyte, PhD Thesis, Southampton University, 1991.<br />
6. D. Pletcher, I. Whyte, F.C. Walsh, Journal of Applied Electrochemistry, 1991,<br />
21, 667.<br />
7. D. Pletcher, I. Whyte, F.C. Walsh, Journal of Applied Electrochemistry, 1993,<br />
23, 82.<br />
8. C. Ponce <strong>de</strong> Leoon, D. Pletcher, Electrochimica Acta, 1996, 41, 533.<br />
9. J.Y. Choi, D.S. Kim, Journal of Hazardous Materials, 2003, B99, 147.<br />
10. C. Lupi, M. Pasquali, A. Dell’Era, Minerals Engineering, 2006, 19, 1246.<br />
11. M. Lanza, V. Bertazzoli, Journal of Applied Electrochemistry, 2000, 30, 61.<br />
12. A. Dutra, A. Espiinola, P. Borges, Minerals Engineering, 2000, 13, 1139.<br />
13. Romanian Government Decision no. 352 from 11.05.2005.
STUDIA UNIVERSITATIS BABE-BOLYAI, CHEMIA, LIII, 1, 2008<br />
In memoriam prof. dr. Liviu Oniciu<br />
ELECTROCHEMISTRY OF IRON (III) PROTOPORPHYRIN (IX)<br />
SOLUTION AT GRAPHITE ELECTRODE<br />
GRAZIELLA LIANA TURDEAN a , CAMELIA FRCA b ,<br />
AMELIA F. PALCU c , MARINELLA S. TURDEAN d<br />
ABSTRACT. Cyclic voltammmetry was used to investigate the electrochemical<br />
properties of iron (III) protoporphyrin (IX) (hemin, Fe(III)P) dissolved in TRIS<br />
buffer at a graphite electro<strong>de</strong>. A quasi-reversible single electron transfer<br />
attributed to the Fe(III)P/Fe(II)P redox process controlled by diffusion was<br />
i<strong>de</strong>ntified. The pH influence on the electrochemical activity of hemin and its<br />
electrocatalytic behaviour towards nitrite reduction was also investigated<br />
and <strong>de</strong>monstrated.<br />
Keywords: iron (III) protoporphyrin (IX), nitrite, cyclic voltammetry.<br />
INTRODUCTION<br />
Nitrite is an important source of nitrogen in green plants and its<br />
complete reduction to ammonia involves the overall transfer of six electrons [1].<br />
The reduction of nitrate and nitrite has gained renewed attention in view of its<br />
relevance to pollution control due to excessive use in fertilizers, <strong>de</strong>tergents,<br />
industrial processes and food technologies. Also, the control of water quality is<br />
important to avoid contamination of food produced when water is used as a<br />
raw material. Electrochemical reduction catalysis can be advantageously<br />
applied to the treatment of industrial wastewater, whereby nitrate species<br />
are transformed into harmless reduction products from various cathodic<br />
materials and solutions of different compositions. Generally, however, the<br />
electrochemical reactions of interest have been found to proceed at potentials<br />
substantially more negative than their thermodynamic values with low current<br />
<strong>de</strong>nsity, providing evi<strong>de</strong>nce that their energies of activation are very high [2].<br />
Organo-iron <strong>de</strong>rivatives have been i<strong>de</strong>ntified as intermediates in<br />
several biological processes. The main motivation for the investigation of<br />
iron-porphyrins’ redox properties has been to establish their correlation with<br />
a Babes-Bolyai” University, Faculty of chemistry and chemical engineering, Department of Physical<br />
Chemistry, Arany Janos St. 11, 400028 Cluj-Napoca, Romania, gtur<strong>de</strong>an@chem.ubbcluj.ro<br />
b Colegiul tehnic “Napoca”, str. Taberei nr. 3, 400512 Cluj-Napoca, Romania<br />
c Liceul Teoretic "Mihai Veliciu" Chisineu-Cris, str. Primaverii nr. 3-5, 315100 Chisineu-Cris, jud. Arad<br />
d “Dimitrie Cantemir” Christian University, Splaiul Unirii no. 176, 050099 Bucharest, Romania
GRAZIELLA LIANA TURDEAN, CAMELIA FRCA, AMELIA F. PALCU, MARINELLA S. TURDEAN<br />
structure–function relationships of complex homoproteins. Due to electrochemical<br />
reversibility of iron-porphyrin <strong>de</strong>rivatives, they can be used as<br />
electron transfer mediator for modification of different electro<strong>de</strong> materials,<br />
and preparations of chemically modified electro<strong>de</strong>s with these compounds<br />
have received great interest in the field of electroanalysis. Different supporting<br />
carbon materials have been used to disperse and stabilize electron transfer<br />
mediators, due to their low background currents, wi<strong>de</strong> potential windows,<br />
chemical inertness and low costs [3]. Iron-porphyrins are also well recognized<br />
for their excellent electrocatalytic properties toward the <strong>de</strong>tection of many<br />
important analytes, such as nitric oxi<strong>de</strong> [4], neurotransmitters [5], O2 [6],<br />
hydrogen peroxi<strong>de</strong> [7], nitrite [8], superoxi<strong>de</strong> [9], sulfur oxoanions [10],<br />
tryptophan and its <strong>de</strong>rivatives [11 - 12].<br />
Hemin (iron protoporphyrin IX) (Fe(III)P ) is a naturally occurring ironporphyrin<br />
complex possessing catalytic function [7] and as consequence is the<br />
active center of the family of heme-proteins, such as b-type cytochromes,<br />
peroxidase, myoglobin and hemoglobin [9, 13]. Its capacity to mimics the<br />
catalytic properties of enzymes lead to an intensive research activity of this<br />
small molecule. Hemin dissolved in an aqueous solution, adsorbed on an<br />
electro<strong>de</strong> surface [14] or immobilized on ion-exchange resins, zeolites, silica,<br />
clays, in polymer or lipid film on an electro<strong>de</strong> surface was studied from<br />
electrochemically point of view [15, 16]. Also, it was used as catalyst for<br />
dioxigen [6, 17 - 18], nitrite [1], hydrogen peroxi<strong>de</strong> [19].<br />
The aim of this paper was a fully electrochemically characterization<br />
of the hemin in solution and the i<strong>de</strong>ntification of its capacity to electrocatalyse<br />
the nitrite reduction.<br />
RESULTS AND DISCUSSION<br />
Electrochemical behaviour of hemin on graphite electro<strong>de</strong><br />
Figure 1A shows a set of cyclic voltammograms obtained at different<br />
scan rates, when the graphite electro<strong>de</strong> was immersed in the hemin solution.<br />
A well formed and similarly shaped pairs of peaks corresponding to the<br />
single electron transfer into the Fe(III)P/Fe(II)P redox couple is observed at<br />
Ep,a = Ep,c = -0.42 V vs. Ag/AgCl, KClsat (∆Ep = 0), only at 10 mVs<br />
106<br />
-1 as in the<br />
case of the reversible processes. The variation of the scan rate between<br />
100 and 1000 mVs -1 leads to an exponentially increasing of peak separation<br />
∆Ep (calculated as Epa - Epc), as it is observed for the quasi-reversible systems<br />
controlled by diffusion (figure 1B).<br />
At scan rates ranging from 100 - 1000 mVs -1 the peaks currents (Ip)<br />
increase linearly with the scan rate (v) and not with v 1/2 (slope of log Ip vs.<br />
log v between 0.85 and 1). This indicates that the redox reaction is a surface<br />
process, due to the slow adsorption of the hemin on the electro<strong>de</strong> surface<br />
during the measurements.
(A)<br />
µ<br />
ELECTROCHEMISTRY OF IRON (III) PROTOPORPHYRIN (IX) SOLUTION AT GRAPHITE ELECTRODE<br />
<br />
<br />
<br />
<br />
<br />
<br />
<br />
<br />
<br />
<br />
<br />
<br />
<br />
<br />
<br />
<br />
<br />
Figure 1. Cyclic voltammograms of 0.5 mM<br />
Fe(III)P solution at a graphite electro<strong>de</strong> (A).<br />
The influence of the scan rate on the peak<br />
potentials (B) and on the peak current (C).<br />
Experimental conditions: electrolyte, 0.05 M<br />
TRIS buffer (pH 8) solution; starting potential,<br />
-0.85 V vs. Ag/AgCl, KClsat, <strong>de</strong>oxygenated<br />
solution.<br />
(B)<br />
<br />
(C)<br />
µ µ<br />
<br />
<br />
<br />
<br />
<br />
<br />
<br />
<br />
<br />
<br />
<br />
<br />
<br />
<br />
<br />
<br />
<br />
<br />
<br />
<br />
<br />
<br />
<br />
<br />
<br />
<br />
<br />
The effect of pH on the electrochemical behavior of hemin on<br />
graphite electro<strong>de</strong> was studied in different buffer solutions (pH 6.5 - 10) in<br />
the absence of oxygen. The pairs of well-<strong>de</strong>fined redox peaks of hemin are<br />
strong pH <strong>de</strong>pen<strong>de</strong>nt. The current intensity of peaks has a maximum value<br />
in the range pH 8-8.5, in spite of the potential scan rate (Figure 2).<br />
Both reduction and oxidation peak potentials of Fe(III)P/Fe(II)P<br />
redox couple shifted negatively with an increase in pH (results not shown).<br />
The pH <strong>de</strong>pen<strong>de</strong>ncies of the formal peak potentials in the studied pH range<br />
can be expressed as follows: E 0 = -38,55 − 47.95pH (R = 0.995, n = 7, v =<br />
300 mVs -1 ) or E 0 = -70.82 − 44.27pH (R = 0.995, n = 8, v = 500 mVs -1 ). (The<br />
formal potential is the mean between Epa and Epc).<br />
As observed in similar cases [12, 16] the slopes of E 0 ’ - pH <strong>de</strong>pen<strong>de</strong>nce<br />
are reasonably close to the theoretical value of −59.1 mV pH −1 at 25 0 C for<br />
a reversible one proton coupled with one electron redox reaction process in<br />
accordance with the following equation:<br />
(H2O)(OH)Fe(III)P + H + + e − (H2O)2Fe(II)P (1)<br />
107
GRAZIELLA LIANA TURDEAN, CAMELIA FRCA, AMELIA F. PALCU, MARINELLA S. TURDEAN<br />
µ µ<br />
108<br />
<br />
<br />
<br />
<br />
<br />
<br />
<br />
<br />
<br />
<br />
<br />
<br />
<br />
<br />
<br />
<br />
<br />
Figure 2. The current peak and<br />
the formal peak potential <strong>de</strong>pen<strong>de</strong>nces<br />
on the pH of Fe(III)P solution.<br />
Experimental conditions: see<br />
figure 1.<br />
It is possible that the pH <strong>de</strong>pen<strong>de</strong>ncy of E o ’ of Fe(III)P is due to<br />
changes in the ligation of the metal. In weak acidic and neutral pH range,<br />
the iron is coordinated to water molecules and hydroxyl ions. At basic pH, it<br />
is difficult to assign a mechanism for the proton/electron transfer coupling. If<br />
we consi<strong>de</strong>r a low surface coverage of the Fe(III)P on the electro<strong>de</strong>, we can<br />
assume that there is small interaction between adjacent porphyrins. In this<br />
case the formation of monomeric Fe(III)P(OH)2 would explain the coupling<br />
between electron and proton transfer [16].<br />
Due to stability, electrochemical reversibility and high electron transfer<br />
rate constant of Fe(III)/Fe(II) redox couple at graphite electro<strong>de</strong>, it can be used<br />
as a mediator to shuttle electrons between electro<strong>de</strong>s and analyte molecules.<br />
To assess the electrocatalytic properties of hemin, its electrocatalytic activity<br />
towards nitrite reduction was examinated. In or<strong>de</strong>r to test this ability of the<br />
studied molecule, cyclic voltammograms were obtained in the presence<br />
and absence of nitrite and/or hemin in Tris buffer solution (pH 8).<br />
As shown in figure 3, in the presence of hemin and different<br />
concentrations of nitrite, a cathodic peak at ~ -0.8 V accompanied by a current<br />
increasing, indicates a strong catalytic activity of hemin toward these analyte.<br />
At the bare surface of the graphite electro<strong>de</strong>, in the absence of hemin and<br />
in the presence of nitrite no response was observed. The same behavior<br />
was observed for the electroreduction of chlorate and iodate at multi-walled<br />
carbon nanotubes (MWCNTs) and Fe(III)P-MWCNTs-modified electro<strong>de</strong>s [12].<br />
Casella and al. [2] have <strong>de</strong>monstrated that a positive value of the<br />
switch potential (~ 0.5 V) is important for the appearance of the nitrite<br />
reduction peak. So it can be consi<strong>de</strong>red that the over all reduction process<br />
involves a preliminary adsorption process of analyte on the electro<strong>de</strong> surface,<br />
and the adsorbed complex un<strong>de</strong>rgoes a subsequent multi-step reduction<br />
process in the negative region of potentials between –0.3 and –1.3 V.
ELECTROCHEMISTRY OF IRON (III) PROTOPORPHYRIN (IX) SOLUTION AT GRAPHITE ELECTRODE<br />
µ<br />
<br />
<br />
<br />
<br />
<br />
<br />
<br />
<br />
<br />
<br />
<br />
<br />
<br />
<br />
<br />
<br />
<br />
<br />
<br />
Figure 3. Electrocatalytic effect of<br />
0.5 mM Fe(III)P on the nitrite reduction.<br />
Experimental conditions: electrolyte,<br />
0.05 M TRIS buffer (pH 8) solution;<br />
scan rate, 20 mVs -1 ; starting potential,<br />
-1.3 V vs. Ag/AgCl, KClsat;<br />
<strong>de</strong>oxygenated solution.<br />
These fore, in all the reported studies [20 -22], it was suggested that<br />
the first step of the catalytic process at pH 7.4, involves the formation of an<br />
iron-nitrosyl complex as a consequence of the metal-centered Fe(III)P/Fe(II)P<br />
reduction followed by nitrite binding, according to equations 2-3:<br />
Fe(III)P + e - → Fe(II)P (2)<br />
Fe(II)P + HONO + H + → [Fe(II)P(NO + )] + + H2O (3)<br />
These steps are then followed by the reduction of the iron-nitrosyl<br />
adduct, according to equation 4:<br />
[Fe(II)P(NO + )] + +e - → [Fe(II)P(NO•)] (4)<br />
It should be noted that no clear evi<strong>de</strong>nce to fully characterize the<br />
above-cited reduction process and no accurate overall catalytic process<br />
was established in the literature. Only a few attempts were reported to mo<strong>de</strong>l a<br />
probable mechanism of reduction of nitrite to ammonia by iron porphyrins [1].<br />
CONCLUSIONS<br />
The electrochemical investigation by cyclic voltammetry of the iron (III)<br />
protoporphyrin (IX) reveals a quasi-reversible behaviour, corresponding to a<br />
one-electron transfer redox process at a graphite electro<strong>de</strong>. The influence of<br />
the buffer pH on the peak current and E o ’ of hemin was also, investigated.<br />
The electrocatalytic ability of hemin towards nitrite reduction was<br />
evi<strong>de</strong>nced by recording cyclic voltammograms on graphite electro<strong>de</strong> in the<br />
presence and absence of nitrite in buffer solution. A <strong>de</strong>crease in overpotential<br />
and enhancement of peak current for nitrite reduction indicates strong<br />
catalytic activity of porphyrin toward these analyte.<br />
109
GRAZIELLA LIANA TURDEAN, CAMELIA FRCA, AMELIA F. PALCU, MARINELLA S. TURDEAN<br />
EXPERIMENTAL SECTION<br />
Reagent and materials<br />
Iron (III) protoporphyrin (IX) chlori<strong>de</strong>, NaNO2, HCl, NaOH and TRIS<br />
chlori<strong>de</strong> were purchase from Sigma. All reagents were of analytical gra<strong>de</strong><br />
and were used as received, without further purification.<br />
A 0.5 mM stock solution was prepared by dissolving the appropriate<br />
amount of hemin in 0.05 M TRIS chlori<strong>de</strong> buffer (pH 10.5). A 1M nitrite<br />
solution was prepared in above 0.05 M TRIS. The pH adjustment of solution<br />
was achieved by using HCl and NaOH. Deionized water was used for preparing<br />
all solutions.<br />
Apparatus<br />
Cyclic voltammetric investigations were carried out on a computer<br />
controlled AMEL 433 trace analyser (AMEL, Milan, Italy).<br />
All measurements were done using a standard single-compartment<br />
three electro<strong>de</strong> cell equipped with a platinum counter electro<strong>de</strong>, an Ag/AgCl,<br />
KClsat reference electro<strong>de</strong> (Radiometer, France) and a spectral graphite (3 mm<br />
diameter) (Ringsdorff-Werke, Gmbh, Bonn-Bad Go<strong>de</strong>sberg, Germany) working<br />
electro<strong>de</strong>. The surface of the graphite electro<strong>de</strong> was polished with 600, 1000,<br />
and 2000, grit SiC emery paper, washed with water and then sonicated in<br />
water. All experiments were performed at room temperature. The oxygen<br />
was purged from the electrolyte solutions by bubbling with high purified<br />
argon and all experiments are done un<strong>de</strong>r this inert atmosphere.<br />
ACKNOWLEDGEMENTS<br />
The author thank to the CNCSIS-Romania Grant (A-34-1529-2007) for financial<br />
support.<br />
110<br />
REFERENCES<br />
1. D. Mimica, J. H. Zagal, F. Bedioui, Journal of Electroanalytical Chemistry, 2001,<br />
497, 106.<br />
2. I. G. Casella, M. Gatta, Journal of Electroanalytical Chemistry, 2004, 568, 183.<br />
3. F. Valentini, A. Amine, S. Olanducci, M.L. Terranova, G. Palleschi, Analytical<br />
Chemistry, 2003, 75, 5413.<br />
4. Y. Chi, J. Chen, M. Miyake, Electrochemical Communications, 2005, 7, 1205.<br />
5. B. Duong, R. Arechabaleta, N.J. Tao, Journal of Electroanalytical Chemistry,<br />
1998, 447, 63.<br />
6. N. Zheng, Y. Zeng, P.G. Osborne, Y. Li, W. Chang, Z. Wang, Journal of Applied<br />
Electrochemistry, 2002, 32, 129.
ELECTROCHEMISTRY OF IRON (III) PROTOPORPHYRIN (IX) SOLUTION AT GRAPHITE ELECTRODE<br />
7. Y.-L. Zhang, C.-X. Zhang, H.-X. Shen, Electroanalysis, 2001, 13, 1431.<br />
8. W. J. R. Santos, A. L. Sousa, R. C. S. Luz, F. S. Damos, L. T. Kubota, A. A.<br />
Tanaka, S. M. C. N. Tanaka, Talanta, 2006, 70, 588.<br />
9. J. Chen, U. Wollenberger, F. Lisdat, B. Ge, F.W. Scheller, Sensors & Actuators<br />
B, 2000, 70, 115.<br />
10. S. M. Chen, Inorganica Chimica Acta, 1996, 244, 155.<br />
11. C. G. Nan, Z. Z. Fena, W. X. Li, D. J. Ping, C. H. Qin, Analytica Chimica Acta,<br />
2002, 452, 245.<br />
12. A. Salimi, H. MamKhezri, R. Hallaj, S. Zandi, Electrochimica Acta, 2007, 52, 6097.<br />
13 J.-S. Ye, Y. Wen, W. D. Zhang, H.-F. Cui, L. M. Gan, G. Q. Xu, F.-S. Sheu,<br />
Journal of Electroanalytical Chemistry, 2004, 562, 241.<br />
14. P. Bianco, J. Haladjian, K. Draoui, Journal of Electroanalytical Chemistry, 1990,<br />
279, 305.<br />
15. T. Sagara, S. Takeuchi, K-i. Kumazaki, N. Nakashima, Journal of Electroanalytical<br />
Chemistry, 1995, 396, 525.<br />
16. D. L. Pilloud, X. Chen, P.L. Dutton, C. C. Moser, Journal of Physical Chemistry,<br />
2000, 104, 2868.<br />
17. J.-S. Ye, Y. Wen, W. D. Zhang, H.-F. Cui, L. M. Gan, G. Q. Xu, F.-S. Sheu,<br />
Journal of Electroanalytical Chemistry, 2004, 562, 241.<br />
18. L. Zhang, G.-C. Zhao, X.-W. Wei, Z.-S. Yang, Chemical Letters, 2004, 33, 86.<br />
19. T. Lotzbeyer, W. Schuhmann, H-L. Schmidt, Bioelectrochemistry & Bioenergetics,<br />
1997, 42, 1.<br />
20. S. Trevin, F. Bedioui, J. Devynck, Journal of Electroanalytical Chemistry, 1996,<br />
408, 261.<br />
21. S. Trevin, F. Bedioui, J. Devynck, Talanta, 1996, 43, 303.<br />
22. D. Mimica, J.H. Zagal, F. Bedioui, Electrochemical Communications, 2001, 3, 435.<br />
111
STUDIA UNIVERSITATIS BABE-BOLYAI, CHEMIA, LIII, 1, 2008<br />
In memoriam prof. dr. Liviu Oniciu<br />
NEW [4.4.4.4]CYCLOPHANE AS IONOPHORE<br />
FOR ION-SELECTIVE ELECTRODES<br />
LIDIA VARVARI, IONEL CATALIN POPESCU * ,<br />
SORIN AUREL DORNEANU<br />
ABSTRACT. A new cyclophane <strong>de</strong>rivative (M7F2) was tested as ionophore<br />
for ion-selective electro<strong>de</strong>s (ISE), based on PVC membrane. Two types of<br />
ISE membranes were prepared and compared: one with, and one without<br />
potassium tetrakis(4-clorophenyl)borate as ionic additive. Potentiometric tests<br />
were performed in calcium, magnesium, sodium and potassium standard<br />
solutions. The best response was obtained for calcium, i.e., lowest <strong>de</strong>tection<br />
limit, highest linear range and a quasi-nernstian slope. The investigated<br />
cyclophane ISE showed comparable analytical performances.<br />
Keywords: cyclophane, PVC-based ISE, calcium ISE<br />
INTRODUCTION<br />
Ion-selective electro<strong>de</strong>s (ISE) are well-known for their wi<strong>de</strong> applications<br />
in important fields such as clinical, food and environmental chemistry [1].<br />
For example, it is estimated that over a billion clinical analyses are performed<br />
annually in laboratories all over the world using ISE [2].<br />
ISE are usually ma<strong>de</strong><br />
of a polymer matrix incorporating<br />
an ionophore. Macrocyclic<br />
compounds are the most<br />
frequently used ionophores;<br />
they selectively bind different<br />
ions by entrapping them in<br />
their cavity. The selectivity of<br />
the membrane is thus strongly<br />
influenced by the size match<br />
between the ion and the host<br />
cavity. Many cyclophane <strong>de</strong>-<br />
Figure 1. The structure of M7F2 ionophore<br />
rivatives are successfully used<br />
as ionophores [3, 4].<br />
* Department of Physical Chemistry, Babes-Bolyai University, 400028 Cluj-Napoca, Romania,<br />
cpopescu@chem.ubbcluj.ro
114<br />
L. VARVARI, I.C. POPESCU, S. A. DORNEANU<br />
This paper aims at testing a newly synthesized [4.4.4.4]cyclophane<br />
as ionophore for cation-selective membranes. Its name, 5,5,10,10,22,22,27,27tetrakis[3',3'-dimethyl-1',5'-dioxapentan-1',5'-diyl]-2,13,19,30-tetraoxo-3,12,20,29tetraoxapenta-cyclo[29.3.2<br />
6,9 .2 23,26 .1 14,18 .1 1,31 ]tetracontan-1 40 ,6,8,14,16,18 37 ,23 38 ,<br />
24,26 39 ,31,33-do<strong>de</strong>caene is abbreviated as M7F2. The structure of the<br />
ionophore is shown in Figure 1.<br />
RESULTS AND DISCUSSION<br />
I. Calibration curves for Ca 2+ , Mg 2+ , Na + , K +<br />
An example of calibration curves obtained for both types of prepared<br />
membranes, in presence of different concentrations of calcium ion, is<br />
shown in Figure 2. The calculated values of the corresponding slopes and<br />
<strong>de</strong>tection limits (DL) are presented in Table 1. All values represent the<br />
average of three measurements, performed successively with three<br />
electro<strong>de</strong>s, in the same working conditions.<br />
E / mV vs. SCE<br />
0<br />
-30<br />
-60<br />
-90<br />
electro<strong>de</strong> 1<br />
electro<strong>de</strong> 2<br />
electro<strong>de</strong> 3<br />
(A)<br />
-5 -4 -3 -2 -1<br />
log aCa 2+<br />
E / mV vs. SCE<br />
120<br />
90<br />
60<br />
30<br />
electro<strong>de</strong> 1<br />
electro<strong>de</strong> 2<br />
electro<strong>de</strong> 3<br />
(B)<br />
-6 -5 -4 -3 -2<br />
log aCa 2+<br />
Figure 2. Calibration curves obtained in presence of Ca 2+ solution for the<br />
membrane with (A) and without ionic additive (B)<br />
Values of slope and DL for the membranes with and without ionic additive<br />
Ion<br />
Membrane<br />
type<br />
With ionic<br />
additive<br />
Without ionic<br />
additive<br />
Slope<br />
(mV/pion)<br />
DL (mM)<br />
Table 1.<br />
Ca 2+ Mg 2+ Na + K + Ca 2+ Mg 2+ Na + K +<br />
26.8 ±<br />
1.1<br />
29.0 ±<br />
2.0<br />
32.6 ±<br />
5.2<br />
5.2 ±<br />
0.4<br />
39.8 ±<br />
5.4<br />
57.7 ±<br />
7.0<br />
39.3 ±<br />
4.9<br />
37.0 ±<br />
5.1<br />
1.92*<br />
-2<br />
*10<br />
5.42 8.62<br />
1.23*<br />
*10 -1<br />
2.22*<br />
-2<br />
*10<br />
-<br />
3.02*<br />
-1<br />
10<br />
4.00
NEW [4.4.4.4]CYCLOPHANE AS IONOPHORE FOR ION-SELECTIVE ELECTRODES<br />
From Table 1 it can be noticed that both prepared membranes<br />
presented potentiometric response to the tested cations. For calcium, both<br />
membranes present a nernstian slope (S) of about 28 mV/<strong>de</strong>ca<strong>de</strong>, the<br />
lowest DL ( 2*10 -5 M) and a large linear range ( 4 <strong>de</strong>ca<strong>de</strong>s). For all other<br />
tested ions, significantly higher DL were obtained. In presence of K + , both<br />
membranes presented un<strong>de</strong>rnernstian response. A nernstian response was<br />
also obtained for Mg 2+ and Na + using the membrane with, and without ionic<br />
additive, respectively.<br />
II. Study of the ionic interference<br />
Based on DL and sensitivity results, calcium was chosen as primary<br />
ion. Concentrations of interfering ion (Mg 2+ , Na + , and K + ) varied up to 0.5 M,<br />
while calcium was kept at a constant concentration of 5 mM.<br />
Figure 3 shows an example of calibration curve obtained during the<br />
interference study carried out in presence of variable sodium concentration.<br />
Table 2 lists the average values of the potentiometric selectivity coefficients.<br />
E / mV vs. SCE<br />
150<br />
120<br />
90<br />
60<br />
electro<strong>de</strong> 1<br />
electro<strong>de</strong> 2<br />
electro<strong>de</strong> 3<br />
(A)<br />
-6 -4 -2 0<br />
log a Na +<br />
E / mV vs. SCE<br />
180<br />
160<br />
140<br />
120<br />
100<br />
electro<strong>de</strong> 1<br />
electro<strong>de</strong> 2<br />
electro<strong>de</strong> 3<br />
(B)<br />
-6 -4 -2 0<br />
log aNa +<br />
Figure 3. Calibration curves obtained for Na + in presence of constant Ca 2+<br />
concentration (5 mM), for the membrane with (A) and without ionic additive (B)<br />
Table 2.<br />
Values of selectivity coefficients for the two membranes, with Ca 2+<br />
as primary ion (5 mM) and Mg 2+ , Na + , K + as interfering ions<br />
logK pot Interferent<br />
Membrane<br />
type<br />
Mg<br />
A, B<br />
2+<br />
Na +<br />
K +<br />
With ionic additive -0.38 ± 0.05 2.23 ± 0.24 4.64 ± 0.48<br />
Without ionic additive -0.32 ± 0.14 1. 43 ± 0.04 1.34 ± 0.02<br />
115
L. VARVARI, I.C. POPESCU, S. A. DORNEANU<br />
The lowest interference with respect to Ca 2+ is observed in the case<br />
of Mg 2+ , which is a remarkable fact, taking into account the usually high<br />
interference between the two ions [8]. For the ionic additive-free membrane,<br />
logK pot Ca,Mg was -0.32, and for the other one it was -0.38.<br />
The positive values of logK pot Ca,Na and logK pot Ca,K suggest a high<br />
sensitivity towards Na + and K + at the chosen concentration of Ca 2+ . In the<br />
case of the membrane with ionic additive, the high value logK pot Ca,K can be<br />
due to the high amount of potassium ions introduced in the membrane<br />
through the ionic additive. In or<strong>de</strong>r to improve the estimated selectivity,<br />
additional tests should be performed at different concentrations of primary<br />
and/or interfering ions, <strong>de</strong>pending on the prospective applications of the<br />
ISE. For example, in some mineral waters where sodium and magnesium<br />
are ten times less concentrated than calcium, the concentration of the last<br />
one can be successfully measured using ISE based on the M7F2 compound.<br />
III. Study of repeatability<br />
Both the inter-electro<strong>de</strong> and inter-measurements repeatability were<br />
estimated and two examples of representative results are presented in Figure 4.<br />
The first case shows the mean values of the response recor<strong>de</strong>d with the same<br />
electro<strong>de</strong> (based on ionic additive-free membrane) during three successive<br />
tests performed for Ca 2+ in the same working conditions. The second figure<br />
shows the mean value of the responses for three similar electro<strong>de</strong>s (with<br />
additive-free membrane), recor<strong>de</strong>d simultaneously in Na + solutions. In both<br />
cases, a good repeatability was obtained, in spite of a relatively high<br />
dispersion observed at low concentrations. This dispersion is due to the high<br />
level of the electric noise caused by the absence of supporting electrolyte.<br />
E / mV vs. SCE<br />
120<br />
100<br />
80<br />
60<br />
(A)<br />
-6 -5 -4 -3 -2<br />
log aCa 2+<br />
-4 -3 -2 -1<br />
Figure 4. Mean value and standard <strong>de</strong>viation of three measurements successively<br />
performed in Ca<br />
116<br />
2+ solution with the same electro<strong>de</strong> (based on the additive-free<br />
membrane) and in the same working conditions (A), and for simultaneous<br />
measurements performed with three similar electro<strong>de</strong>s in Na + solution (B)<br />
E / mV vs. SCE<br />
180<br />
150<br />
120<br />
90<br />
60<br />
log aNa +<br />
(B)
NEW [4.4.4.4]CYCLOPHANE AS IONOPHORE FOR ION-SELECTIVE ELECTRODES<br />
CONCLUSIONS<br />
This study aimed at characterizing the M7F2 cyclophane as ionophore<br />
for ISE based on two types of PVC membranes prepared with and without<br />
an ionic additive, respectively. A good <strong>de</strong>tection limit ( 2*10 -5 M), a wi<strong>de</strong><br />
linear range (about four <strong>de</strong>ca<strong>de</strong>s) and a quasi-nernstian slope ( 28 mV/<strong>de</strong>ca<strong>de</strong>)<br />
were obtained for Ca 2+ in the case of both types of investigated membranes.<br />
The electro<strong>de</strong>s also showed potentiometric response to other ions (Mg 2+ , Na + ,<br />
K + ) but their analytical parameters were poorer than those obtained for calcium.<br />
It is worth to mention that the best selectivity against Ca 2+ was obtained<br />
for Mg 2+ , the values of the logarithm of the selectivity coefficient being -0.38<br />
and -0.32 for the membrane with, and without ionic additive, respectively.<br />
A good repeatability was obtained both for inter-measurements and<br />
inter-electro<strong>de</strong> tests.<br />
EXPERIMENTAL SECTION<br />
Materials<br />
The M7F2 ionophore was synthesized [5, 6] in the research team of<br />
prof. Ion Grosu from the OCD of our faculty. All reagents used were of analytical<br />
gra<strong>de</strong>. Calcium chlori<strong>de</strong>, lithium acetate, 2-nitrophenyloctylether (NPOE), high<br />
molecular weight polyvinyl chlori<strong>de</strong> (PVC), tetrahydrofurane (THF) and potassium<br />
tetrakis(4-clorophenyl)borate (KTkClPB) were purchased from Fluka (Darmstadt,<br />
Germany). Potassium chlori<strong>de</strong> was from Rie<strong>de</strong>l-<strong>de</strong>Haën (Darmstadt, Germany),<br />
magnesium chlori<strong>de</strong> was purchased from Chimopar (Bucharest, Romania)<br />
and sodium chlori<strong>de</strong> was from Merck (Darmstadt, Germany).<br />
Membrane preparation<br />
Two types of membranes were investigated: (i) the first contained<br />
0.7% (w/w) M7F2 as ionophore, 0.3% (w/w) KTkClPB as ionic additive,<br />
33% (w/w) PVC as polymer matrix and 66% (w/w) NPOE as plasticizer; (ii)<br />
the second membrane had the same composition excepting that it was<br />
prepared without ionic additive and the percent of ionophore was 1% (w/w).<br />
Each membrane weighted 0.3 g.<br />
Membranes were prepared according to the following procedure.<br />
The ionophore, ionic additive, plasticizer and polymer matrix were successively<br />
dissolved in THF, un<strong>de</strong>r stirring. After dissolution, the mixture was poured into<br />
a glass cylin<strong>de</strong>r, in THF atmosphere, in or<strong>de</strong>r to avoid pores formation. The<br />
membranes were dried and stored in dark. Before use they were conditioned<br />
for at least 24 hours in the solution containing the cation to be <strong>de</strong>termined.<br />
Experimental setup<br />
Measurements were performed using a PC-controlled setup [7]. The<br />
system control, as well as data acquisition were performed using LabView<br />
5.1. Data treatment was done by using the Origin 5.0 software.<br />
117
118<br />
L. VARVARI, I.C. POPESCU, S. A. DORNEANU<br />
Two lots of three electro<strong>de</strong>s (based on the two types of investigated<br />
membranes) were prepared by fixing an 8 mm diameter disc membrane at<br />
the bottom end of a plastic syringe body. As internal reference, a Ag/AgCl<br />
system was used. The inner electrolytes contained the same ion as the test<br />
solution, at a concentration of 5 mM. The similar electro<strong>de</strong>s were tested<br />
simultaneously, and each measurement was repeated three times in the<br />
same working conditions. A double-junction saturated calomel electro<strong>de</strong><br />
was used as external reference. The external liquid junction was filled with<br />
CH3COOLi 0.1 M.<br />
Experimental procedure<br />
The experimental consisted in two main parts: in the first one, the<br />
potentiometric response of the two types of the prepared membranes was<br />
recor<strong>de</strong>d for Ca 2+ , Mg 2+ , Na + , and K + using separate solutions, and the<br />
corresponding calibration curves were drawn. In the second part, the ionic<br />
interference between Ca 2+ and different common cations was examined.<br />
Potentiometric measurements were performed in batch mo<strong>de</strong>, using<br />
the standard addition method for the preparation of standard solutions. For<br />
the interference study, the method of constant primary ion concentration<br />
was used: the primary ion concentration was constant, while increasing<br />
concentrations of the interfering ion were ad<strong>de</strong>d.<br />
ACKNOWLEDGEMENTS<br />
The authors are grateful to prof. dr. Ion Grosu from the Organic<br />
Chemistry Department for providing cyclophane M7F2.<br />
REFERENCES<br />
1. E. Bakker, D. Diamond, A. Lewenstam, E. Pretsch, Analytica Chimica Acta,<br />
1999, 393, 11.<br />
2. E. Bakker, P. Buhlmann, E. Pretsch, Chemical Reviews, 1997, 97, 3083.<br />
3. E. M. Vazquez, J. Bobacka, A. Ivaska, J. Solid State Electrochemistry, 2005, 9,<br />
865.<br />
4. R. Ludwig, N. Dzung, Sensors, 2002, 2, 397.<br />
5. N. Bogdan, I. Grosu, E. Condamine, L. Toupet, Y. Ramon<strong>de</strong>nc, I. Silaghi-<br />
Dumitrescu, G. Ple, E. Bogdan, European Journal of Organic Chemistry, 2007,<br />
28, 4674.<br />
6. N. Bogdan, PhD Thesis, 2006.<br />
7. S. A. Dorneanu, V. Coman, I. C. Popescu, P. Fabry, Sensors and Actuators B,<br />
2005, 105, 521.<br />
8. K. Suzuki, K. Watanabe, Y. Matsumoto, M. Kobayashi, S. Sato, D. Siswanta, H.<br />
Hisamoto, Analytical Chemistry, 1995, 67, 324.
STUDIA UNIVERSITATIS BABE-BOLYAI, CHEMIA, LIII, 1, 2008<br />
In memoriam prof. dr. Liviu Oniciu<br />
ELECTROCHEMICAL INVESTIGATION OF SILVER / SILVER ION<br />
COUPLE REVERSIBILITY IN CHOLINE CHLORIDE - UREA<br />
BASED IONIC LIQUID<br />
LIANA ANICAI a , ANCA COJOCARU b , ANDREEA FLOREA a ,<br />
TEODOR VISAN b<br />
ABSTRACT. Cyclic voltammetry and electrochemical impedance spectroscopy<br />
were used for studying both cathodic and anodic processes on Pt electro<strong>de</strong> in<br />
an ionic liquid as electrolyte support at 70 0 C temperature. Air and water stable<br />
solutions containing Ag + ion (0.14M, 0.282M and 0.565M AgNO3) are<br />
based on choline chlori<strong>de</strong> (ChCl) and urea (1: 2) mixtures. Voltammograms<br />
were recor<strong>de</strong>d using scan rates in 10-200 mV/s range. It is shown that the<br />
Ag + /Ag couple on Pt electro<strong>de</strong> exhibits almost reversible behavior in ChClurea<br />
electrolyte support at 70 0 C, with diffusion control of cathodic process<br />
and a stripping anodic process. The diffusion coefficient of Ag + ion was<br />
estimated. Impedance of Pt electro<strong>de</strong> has been measured as a function of<br />
frequency for different overpotential values in the region of beginning and<br />
current peak Ag <strong>de</strong>position. The non-uniformity of Ag <strong>de</strong>posited surface is<br />
one of the main factors <strong>de</strong>termining the <strong>de</strong>pressed shape of the impedance<br />
semicircle in Nyquist spectra. The values of fitting parameters for impedance<br />
data were calculated and the simulated curves have agreed with the<br />
experimental ones. Consi<strong>de</strong>rations regarding the use of Ag/Ag + ion couple<br />
as reference electro<strong>de</strong> in electrochemical experiments with ChCl based<br />
ionic liquids are ma<strong>de</strong>.<br />
INTRODUCTION<br />
Room temperature (or ambient temperature) ionic liquids based on<br />
choline chlori<strong>de</strong> (ChCl) are of interest for last years. The preparation and<br />
applications of this new class of ionic liquids containing a quaternary ammonium<br />
salt (ChCl chemical compound is 2 hydroxy-ethyl-trimethyl-ammonium) mixed<br />
with hydrogen bond donor species, as ami<strong>de</strong>s, carboxylic acids, ethylene glycol<br />
etc., were <strong>de</strong>scribed first by Abbott et al. [1-3]. Among the electrochemical<br />
applications, these ionic liquids can be used for the <strong>de</strong>position of a range of<br />
metal coatings [4-6] including Zn, Cr, Sn, Cu, Ag at high current efficiency;<br />
also, they are well suited for metal electropolishing [7].<br />
a Petromservice SA, Division of Ecological Technologies Development, Bucharest, Romania<br />
b Department of Applied Physical Chemistry and Electrochemistry, University Politehnica<br />
Bucharest, Calea Grivitei 132, 010737-Bucharest, Romania
120<br />
LIANA ANICAI, ANCA COJOCARU, ANDREEA FLOREA, TEODOR VISAN<br />
Recently, we reported some data [8] about cyclic voltammetry<br />
experiments and <strong>de</strong>monstrated that the Ni electro<strong>de</strong>position process in<br />
ChCl - urea and ChCl - malonic acid systems as ionic liquids represents an<br />
environmentally friendly alternative for the classic electro<strong>de</strong>position techniques<br />
in aqueous solutions which are used in present at industrial scale. The new<br />
proposed technique is an ecological procedure because the ionic liquid is<br />
air and moisture stable and its components are both common chemical<br />
compounds: chlori<strong>de</strong> choline, which is used for chicken feed as vitamin B4<br />
and urea, which is a common fertilizer.<br />
The electro<strong>de</strong>position of silver as pure metal or its alloys is a<br />
technological process involved in a variety of finishing processes, an example<br />
being in electronics for the manufacture of printed circuit boards. Also, the<br />
electro<strong>de</strong>position and electrodissolution of silver in aqueous solutions were<br />
extensively studied in the past years in relation to silver recovery from<br />
photographic wastes. Silver <strong>de</strong>posits can be obtained from aqueous solutions<br />
in various conditions regarding composition, structure, aesthetic aspect,<br />
thickness and <strong>de</strong>position rate. Obviously, a better approach of the silver<br />
electro<strong>de</strong>position kinetics was achieved by <strong>de</strong>termining the diffusion and<br />
kinetic parameters and also establishing the mechanism of electro<strong>de</strong> process.<br />
The study of the mechanism of cathodic process of silver ion in thiosulphate<br />
aqueous solution performed by Gonnissen et al. [9] is an example. However,<br />
regarding the electrochemistry of silver in ionic liquids we found out that it is a<br />
lack of information about the electro<strong>de</strong> process kinetics and diffusion.<br />
The present paper aimed to illustrate the electrochemical reversibility<br />
of Ag/Ag + ion couple in choline chlori<strong>de</strong> - urea mixture as ionic liquid by<br />
showing the similar electrochemical behavior as in aqueous solutions or molten<br />
salts. To the authors knowledge, cyclic voltammetry and electrochemical<br />
impedance spectroscopy for Ag <strong>de</strong>position and dissolution on Pt inert<br />
electro<strong>de</strong> in such ionic liquids have not been applied, yet. The obtained<br />
value of diffusion coefficient of Ag + ion may also be compared with other<br />
similar values in different electrolytes. Moreover, since we have used a quasireference<br />
electro<strong>de</strong> consisting in a silver wire immersed in the investigated<br />
ionic liquid, the results may allow us to make some consi<strong>de</strong>rations regarding<br />
the use of Ag / Ag + ion couple as reference electro<strong>de</strong> in ionic liquids.<br />
RESULTS AND DISCUSSION<br />
The electrochemical experiments were carried out firstly in supporting<br />
electrolyte consisting in choline chlori<strong>de</strong> - urea mixtures (1: 2, in moles) as<br />
binary ionic liquids, in or<strong>de</strong>r to know the potential window and potentially<br />
electrochemical reactions occurring on Pt electro<strong>de</strong>. Also, in our preliminary<br />
<strong>de</strong>terminations with gradually additions of AgNO3 in the above ionic liquid
ELECTROCHEMICAL INVESTIGATION OF SILVER / SILVER ION COUPLE REVERSIBILITY …<br />
we found out a <strong>de</strong>crease in the specific electrical conductivity at a constant<br />
temperature for concentrated solutions, whereas the increase of temperature<br />
leads in all systems to an important increase in conductivity.<br />
Cyclic voltammetry measurements<br />
Cyclic voltammetry curves were recor<strong>de</strong>d for studying both cathodic<br />
and anodic processes on Pt electro<strong>de</strong> in pure ionic liquid as electrolyte<br />
support at 70 0 C constant temperature using scan rates in 10-200mV/s range.<br />
An example of typical cyclic voltammogram recor<strong>de</strong>d in choline<br />
chlori<strong>de</strong> – urea mixture (1: 2, in moles) at 70 0 C is shown in Fig. 1, indicating<br />
a potential window on Pt electro<strong>de</strong> from about +1.4 V to –1.2 V (electro<strong>de</strong><br />
potentials vs. Ag quasi reference). During the cathodic scan the current<br />
<strong>de</strong>nsity was lower than 0.5 mAcm -2 . It is worth to mention that on the cathodic<br />
branch of voltammograms two consecutive reduction waves appear at<br />
potentials around –0.35 V and –0.8 V, respectively, with a current amplitu<strong>de</strong><br />
that increases at faster scan rates.<br />
I, mA<br />
1<br />
0<br />
-1<br />
-2<br />
-3<br />
-4<br />
-1,6 -1,4 -1,2 -1,0 -0,8 -0,6 -0,4 -0,2 0,0 0,2 0,4 0,6 0,8 1,0 1,2 1,4 1,6<br />
E, V vs Ag<br />
Figure 1. Cyclic voltammogram for Pt electro<strong>de</strong> (0.5 cm 2 ) in choline<br />
chlori<strong>de</strong> - urea mixture (1: 2, in moles) at 70 0 C; 10 mV/s scan rate.<br />
It was consi<strong>de</strong>red that the existence of such waves with limiting<br />
currents less than 1 mAcm<br />
121<br />
-2 is due to the presence of small amounts of H +<br />
ion in binary ionic liquid, resulted by dissociation of water molecules that<br />
surely are present in our experiments. In anodic direction, the current is<br />
almost zero in -0.9 ÷ +1.2 V potential range, with a continuous increasing at<br />
more positive values.
122<br />
LIANA ANICAI, ANCA COJOCARU, ANDREEA FLOREA, TEODOR VISAN<br />
We performed voltammetric measurements in air and water stable<br />
solutions containing concentrations of Ag + ion of 0.14M, 0.282M, 0.565M<br />
AgNO3, respectively, and choline chlori<strong>de</strong> (ChCl) with urea (1: 2) mixture as<br />
electrolyte. Figures 2-4 show cyclic voltammograms recor<strong>de</strong>d with various<br />
scan rates at 70 0 C constant temperature, in the same potential range.<br />
Starting from the stationary potential (0V vs. Ag quasi reference electro<strong>de</strong>),<br />
all figures show clearly the beginning of cathodic <strong>de</strong>position process with a<br />
current peak located at electro<strong>de</strong> potentials in the range -0.1 ÷ -0.3V,<br />
followed by a quite large potential region of limiting currents.<br />
i / mA<br />
16<br />
14<br />
12<br />
10<br />
8<br />
6<br />
4<br />
2<br />
0<br />
-2<br />
-4<br />
-6<br />
-8<br />
v = 200 mV/s<br />
v = 100 mV/s<br />
v = 50 mV/s<br />
v = 20 mV/s<br />
v = 10 mV/s<br />
-0.6 -0.5 -0.4 -0.3 -0.2 -0.1 0.0 0.1 0.2 0.3 0.4 0.5 0.6 0.7 0.8<br />
E / V vs Ag<br />
Figure 2. Cyclic voltammogram for 0.14M AgNO3 in ChCl+urea (1:2)<br />
with Pt electro<strong>de</strong> (0.5 cm 2 ) at various scan rates, 70 0 C.<br />
In experiments with a further polarizing the Pt electro<strong>de</strong> (not shown), a<br />
continuous increasing of cathodic current at more negative potentials,<br />
generally more negative than -1.2V, was recor<strong>de</strong>d, proving a supplementary<br />
process of ionic liquid solvent together with the massive <strong>de</strong>position of Ag on<br />
working electro<strong>de</strong>. In all voltammograms, by returning the electro<strong>de</strong> potential<br />
in the anodic direction, a single well pronounced peak was obtained, with a<br />
peak potential situated at +0.2 ÷ +0.4V. This clearly seen anodic peak<br />
having the increasing amplitu<strong>de</strong> for higher concentrations and scan rates is<br />
surely due to the silver stripping process onto the platinum electro<strong>de</strong>. Next<br />
increasing of current at potentials more positively than +1.2V (not shown,<br />
too) was attributed to the anodic process of supporting electrolyte, being<br />
probably the chlorine evolution.
ELECTROCHEMICAL INVESTIGATION OF SILVER / SILVER ION COUPLE REVERSIBILITY …<br />
i / mA<br />
20<br />
15<br />
10<br />
5<br />
0<br />
-5<br />
200 mV/s<br />
100 mV/s<br />
20 mV/s<br />
10 mV/s<br />
-10<br />
-0.6 -0.4 -0.2 0.0 0.2 0.4 0.6 0.8<br />
E / V vs Ag<br />
Figure 3. Cyclic voltammogram for 0.282M AgNO3 in ChCl+urea (1:2)<br />
with Pt electro<strong>de</strong> (0.5 cm 2 ) at various scan rates, 70 0 C.<br />
Referring to the silver electro<strong>de</strong>position and electrodissolution, it is<br />
worth to note that for each silver ion concentration, the increase of scan<br />
rate entails the increase of both cathodic and anodic peak currents.<br />
However, it was remarked the gradual shift of peak potentials in cathodic<br />
and anodic direction, respectively (ie an increase of Ep difference by<br />
increasing scan rate). An explanation would be the IR ohmic drop owing to<br />
the gradually diminishing of electrical conductivity of ionic media by adding<br />
AgNO3 amounts in ChCl+urea ionic liquid.<br />
I, mA<br />
20<br />
10<br />
0<br />
-10<br />
v = 200 mV/s<br />
v = 100 mV/s<br />
v = 50 mV/s<br />
v = 10 mV/s<br />
-20<br />
-0,6 -0,4 -0,2 0,0 0,2 0,4 0,6 0,8<br />
E, V vs Ag<br />
Figure 4. Cyclic voltammogram for 0.565M AgNO3 in ChCl+urea (1:2)<br />
with Pt electro<strong>de</strong> (0.5 cm 2 ) at various scan rates, 70 0 C.<br />
123
124<br />
LIANA ANICAI, ANCA COJOCARU, ANDREEA FLOREA, TEODOR VISAN<br />
This phenomenon, already noticed in our conductivity measurements,<br />
is related to the existence of ionic complexes (in form of chlori<strong>de</strong> complex<br />
ions) between choline chlori<strong>de</strong> and urea as components of ionic electrolyte.<br />
We consi<strong>de</strong>r new bonds formation with introduced silver ions, which become<br />
chlori<strong>de</strong> ionic complexes. According to the mechanism suggested by<br />
Gonnissen [9], the silver <strong>de</strong>position involves these complexated silver ions,<br />
with the following scheme:<br />
AgLn ⇔ AgL + (n-1) L (1)<br />
AgL + e − ⇔ Ag + L (2)<br />
The symbol L means the ligand present in the electrolyte, ie choline<br />
chlori<strong>de</strong> as component in our system.<br />
Thus, the reaction follows a chemical-electrochemical (CE) mechanism.<br />
The first chemical reaction is a rapid process, so that it does not affect the<br />
overall reaction rate. It involves the partial <strong>de</strong>complexation of AgLn species<br />
in the bulk of solution, consi<strong>de</strong>red as an equilibrium reaction, this being too<br />
fast to be <strong>de</strong>tected. Then, AgL intermediate species are reduced at the<br />
electro<strong>de</strong> in the electrochemical step with a reversible single electron transfer.<br />
The results of our investigations suggest for the cathodic process to be<br />
diffusion controlled, especially for more diluted ionic liquids and for small scan<br />
rates, where the IR ohmic contribution in Ep separation may be not important.<br />
i p / mA<br />
18<br />
16<br />
14<br />
12<br />
10<br />
8<br />
6<br />
4<br />
2<br />
0.14M AgNO 3<br />
0.282M AgNO 3<br />
0.565M AgNO 3<br />
0<br />
0,0 0,1 0,2 0,3 0,4 0,5<br />
v 1/2 / (V/s) 1/2<br />
Figure 5. Cathodic peak current (ip) vs. square root of the scan rate (v 1/2 )<br />
for the three Ag + concentrations in ChCl+urea (1:2);<br />
Pt electro<strong>de</strong> (0.5cm 2 ), 70 0 C.
ELECTROCHEMICAL INVESTIGATION OF SILVER / SILVER ION COUPLE REVERSIBILITY …<br />
i p / v 1/2<br />
0,04<br />
0,03<br />
0,02<br />
0,01<br />
0,00<br />
0,0 0,1 0,2 0,3 0,4 0,5 0,6<br />
Ag concentration, M<br />
Figure 6. The ip / v 1/2 -c <strong>de</strong>pen<strong>de</strong>nce for cathodic silver <strong>de</strong>position in ChCl+urea<br />
ionic liquid; Pt electro<strong>de</strong> (0.5cm 2 ), 70 0 C.<br />
A quantitative analysis of the CVs varying both scan rate (v) and<br />
Ag + concentration (c) is presented in Figs 5 and 6. These figures show that<br />
the cathodic peak current (ip) is almost linearly proportional to square root<br />
of the scan rate (v 1/2 ); this invariance of current function ip/v 1/2 with scan rate<br />
accompanied by a linear ip / v 1/2 - c <strong>de</strong>pen<strong>de</strong>nce allowed us to calculate the<br />
diffusion coefficient using the well-known Randles-Sevcik equation for<br />
reversible processes. A value of diffusion coefficient for complexed silver<br />
ion of 0.36 ×10 -6 cm 2 /s was estimated from Fig. 6, whereas a higher value,<br />
of 0.92 ×10 -6 cm 2 /s, was computed consi<strong>de</strong>ring the data of diluted solution<br />
(0.14M), only (Fig. 5). Taking into account the lack of information about the<br />
diffusion data in ionic liquid media, we have compared the diffusion<br />
coefficient obtained in diluted solution with similar measurements in<br />
aqueous solutions and found out them being quite close to the previous<br />
data reported for silver ion in thiosulphate solutions from photographic<br />
wastes (D=0.5 ×10 -5 cm 2 /s at room temperature [10,11]).<br />
It also resulted that the Ag + /Ag couple on Pt exhibits almost reversible<br />
behavior in ChCl-urea electrolyte support at 70 0 C, with diffusion control of<br />
cathodic process and a rapid charge transfer.<br />
The a.c. impedance measurements<br />
The a.c. frequency response of the supporting electrolyte system (pure<br />
ChCl+urea ionic liquid) was investigated at different electro<strong>de</strong> potentials,<br />
where some increases of current were observed. Figure 7 presents the Nyquist<br />
125
126<br />
LIANA ANICAI, ANCA COJOCARU, ANDREEA FLOREA, TEODOR VISAN<br />
and Bo<strong>de</strong> spectra, illustrating the absence of any cathodic process in the<br />
region of less negative potentials. Here, the a.c. frequency response is almost<br />
totally capacitive (for instance, the phase angle of 70 0 is closed to theoretical<br />
value, 90 0 ). However, due to water impurities, probably, the cathodic process<br />
has modified drastically the a.c. response at –1V potential, where the phase<br />
angle is around 10 0 and the charge transfer resistance (diameter of semicircle)<br />
<strong>de</strong>creases with three or<strong>de</strong>rs of magnitu<strong>de</strong>.<br />
Z Im , kΩ<br />
-12<br />
-10<br />
-8<br />
-6<br />
-4<br />
-2<br />
0<br />
E = -1V<br />
E = 0.438 V<br />
Z Im , kΩ<br />
-0.20<br />
-0.15<br />
-0.10<br />
-0.05<br />
0.00<br />
0.05 0.10 0.15 0.20<br />
0 2 4 6 8 10 12<br />
Z Re , kΩ<br />
Z Re , kΩ<br />
IZI, Ω<br />
10 4<br />
10 3<br />
10 2<br />
10 -2<br />
10 -1<br />
10 0<br />
10 1<br />
10 2<br />
Frequency, Hz<br />
a) b)<br />
10 3<br />
E = -1V<br />
E = 0,438V<br />
Figure 7. Nyquist (a) and Bo<strong>de</strong> (b) diagrams of ChCl+urea (1:2) with Pt electro<strong>de</strong><br />
(0.5 cm 2 ) at two potentials: 0.438V and –1V.<br />
Impedance investigations in solutions containing choline chlori<strong>de</strong><br />
(ChCl) with urea (1: 2) mixture as electrolyte and 0.14M, 0.282M, 0.565M<br />
AgNO3, respectively, are also performed at different electro<strong>de</strong> potentials, ie<br />
at the beginning of silver <strong>de</strong>position and within the potential region of peak<br />
current or limiting current. As in CV experiments, a quite different behavior<br />
of the a.c. impedance was noticed in the region near equilibrium potentials<br />
(E=0 V vs. Ag pseudo-reference electro<strong>de</strong>), compared to the region of a<br />
massive Ag <strong>de</strong>position. The impedance spectra as Nyquist diagrams (Figs.<br />
8a-10a) show clearly at less cathodic polarization the capacitive semicircles<br />
in the region of high frequences, followed by a linear <strong>de</strong>pen<strong>de</strong>nce of<br />
imaginary part of impedance against the real part. The values of charge<br />
transfer resistance (the diameters) drastically <strong>de</strong>creased with 2-3 or<strong>de</strong>rs of<br />
magnitu<strong>de</strong> in the potential region of continuous <strong>de</strong>position. The shape of<br />
<strong>de</strong>pressed semi-circles may be attributed to the non-uniformity of silver <strong>de</strong>posit<br />
onto platinum surface, especially after the first nuclei of electrocrystallised<br />
silver occur forming a monolayer. Thus, during a.c. measurements at higher<br />
negative overpotentials a roughness of catho<strong>de</strong> surface has continuously<br />
increased. Generally, the value of the real part of impedance <strong>de</strong>termined by<br />
10 4<br />
10 5<br />
-70<br />
-60<br />
-50<br />
-40<br />
-30<br />
-20<br />
-10<br />
0<br />
10 6<br />
10<br />
Phase, <strong>de</strong>gree
ELECTROCHEMICAL INVESTIGATION OF SILVER / SILVER ION COUPLE REVERSIBILITY …<br />
extrapolation of capacitive arc to zero frequency <strong>de</strong>creases with an increase<br />
of cathodic overpotential (indicating a diminution of the charge transfer<br />
resistance), and increases with a <strong>de</strong>crease of Ag + ion concentration.<br />
Z Im , Ω<br />
Z Im , Ω<br />
-60<br />
-50<br />
-40<br />
-30<br />
-20<br />
-10<br />
0<br />
-450<br />
-400<br />
-350<br />
-300<br />
-250<br />
-200<br />
-150<br />
-100<br />
-50<br />
0<br />
Z Im , Ω<br />
-100<br />
-90<br />
-80<br />
-70<br />
-60<br />
-50<br />
-40<br />
-30<br />
-20<br />
-10<br />
0<br />
10<br />
10 20 30 40 50 60 70 80 90 100<br />
Z Re , Ω<br />
E = 0 V<br />
E = -0.1 V<br />
0 50 100 150 200 250 300 350 400 450<br />
Z Re , Ω<br />
IZI, Ω<br />
10 3<br />
10 2<br />
10 1<br />
10 -2<br />
10 -1<br />
10 0<br />
10 1<br />
10 2<br />
10 3<br />
Frequency, Hz<br />
a) b)<br />
E = 0 V<br />
E = -0.1 V<br />
Figure 8. Nyquist (a) and Bo<strong>de</strong> (b) diagrams of silver electro<strong>de</strong>position<br />
from 0.14M AgNO3 in ChCl+urea (1:2) with Pt electro<strong>de</strong> (0.5 cm 2 )<br />
at two potentials: 0V and -0.1V<br />
E = -0.05 V<br />
E = -1.25 V<br />
10 20 30 40 50 60<br />
Z Re , Ω<br />
IZI, Ω<br />
10 1<br />
10 -2<br />
10 -1<br />
10 0<br />
10 1<br />
10 2<br />
10 4<br />
Frequency, Hz<br />
a) b)<br />
10 5<br />
E = -0.05 V<br />
E = -1.25 V<br />
Figure 9. Nyquist (a) and Bo<strong>de</strong> (b) diagrams of silver electro<strong>de</strong>position<br />
from 0.282M AgNO3 in ChCl+urea (1:2) with Pt electro<strong>de</strong> (0.5 cm 2 )<br />
at two potentials: -0.05V and -1.25V<br />
The same behavior is evi<strong>de</strong>nced in all Bo<strong>de</strong> diagrams (Figs. 8b-10b).<br />
The capacitive response at potentials near 0V is illustrated by a phase<br />
angle of about 60 0 and large values of impedance. In the potential region of<br />
continuous silver <strong>de</strong>position, the phase angle <strong>de</strong>creases at values around<br />
10 3<br />
10 4<br />
10 6<br />
10 5<br />
10 7<br />
10 6<br />
60<br />
50<br />
40<br />
30<br />
20<br />
10<br />
0<br />
-10<br />
24<br />
22<br />
20<br />
18<br />
16<br />
14<br />
12<br />
10<br />
8<br />
6<br />
4<br />
2<br />
0<br />
-2<br />
-4<br />
-6<br />
-8<br />
-Phase, <strong>de</strong>gree<br />
-Phase, Degree<br />
127
128<br />
LIANA ANICAI, ANCA COJOCARU, ANDREEA FLOREA, TEODOR VISAN<br />
20 0 and less. Moreover, the large linear portions of impedance variation<br />
with frequency for more negatively polarised samples are correlated with<br />
the thickening of silver film onto platinum electro<strong>de</strong>. Corespondingly, at<br />
lower frequencies a Warburg impedance appears.<br />
Z Im , Ω<br />
-100<br />
-90<br />
-80<br />
-70<br />
-60<br />
-50<br />
-40<br />
-30<br />
-20<br />
-10<br />
0<br />
E = 0 V<br />
E = -0.16 V<br />
10 20 30 40 50 60 70 80 90 100<br />
Z Re , Ω<br />
lZl, Ω<br />
10 2<br />
10 1<br />
10 -2<br />
10 -1<br />
10 0<br />
10 1<br />
10 2<br />
10 3<br />
Frequency, Hz<br />
a) b)<br />
E = 0 V<br />
E = - 0,16 V<br />
Figure 10. Nyquist (a) and Bo<strong>de</strong> (b) diagrams of silver electro<strong>de</strong>position from<br />
0.565M AgNO3 in ChCl+urea (1:2) with Pt electro<strong>de</strong> (0.5 cm 2 )<br />
at two potentials: 0V and -0.16V<br />
We consi<strong>de</strong>r that the above interpretation of impedance of Pt<br />
electro<strong>de</strong> in Ag + ion containing electrolyte measured at different overpotentials<br />
and for different silver concentrations was consistent to the above <strong>de</strong>scribed<br />
reaction mechanism.<br />
Impedance data were simulated by proposing an equivalent electric<br />
circuit (Fig. 11). This mo<strong>de</strong>l of interface is composed of the electrolyte<br />
resistance, Rs, connected with a constant phase element, CPE (which is a<br />
non-i<strong>de</strong>al capacitor), in parallel with the charge transfer resistance, Rct,<br />
which <strong>de</strong>scribes the electrochemical reaction un<strong>de</strong>r activation control; finally, a<br />
Warburg element (W) which represents a diffusion controlling step was ad<strong>de</strong>d<br />
in series with the charge transfer resistance.<br />
The constant phase element CPE replaces the capacity of the electric<br />
double layer for a better fitting; it takes into account the <strong>de</strong>viation from pure<br />
capacitive behavior, having the impedance given by the expression:<br />
p<br />
1 1<br />
CPE<br />
T j<br />
<br />
= (3)<br />
<br />
ω<br />
where for the exponent value p=1, CPE reduces to a i<strong>de</strong>al capacitor with a<br />
capacitance T and, for p=0 value, to a simple resistor. In the above expression<br />
the other significations are: – the angular frequency of ac voltage and<br />
j – the imaginary vector unit ( j= −1<br />
).<br />
10 4<br />
10 5<br />
10 6<br />
10 7<br />
-40<br />
-30<br />
-20<br />
-10<br />
0<br />
Phase, <strong>de</strong>gree
ELECTROCHEMICAL INVESTIGATION OF SILVER / SILVER ION COUPLE REVERSIBILITY …<br />
The Warburg impedance has a resistive part (W-R) and a capacitive<br />
part (W-CPE), for this last component (capacitive part) consi<strong>de</strong>ring an<br />
expression similar with eq. (3). However, since W represents the diffusive<br />
component of equivalent circuit the exponent p was consi<strong>de</strong>red around a<br />
constant value, p=0.5. The values of circuit parameters resulted from fitting<br />
procedure are given in Table I. An example of both experimental and fitted<br />
data is represented in Figure 12.<br />
Figure 11. The proposed equivalent electrical circuit used for fitting<br />
impedance data. The significances of circuit parameters are given in text.<br />
a) b)<br />
Figure 12. Nyquist and Bo<strong>de</strong> diagrams of silver electro<strong>de</strong>position from 0.14M<br />
AgNO3 in ChCl+urea (1:2) with Pt electro<strong>de</strong> (0.5 cm 2 ) at 0V electro<strong>de</strong> potential.<br />
Dotted lines represent the experimental data; the continuous lines show the<br />
fitted points using the mo<strong>de</strong>l circuit from Figure 11.<br />
As can be seen from Table I, the ohmic resistance of electrolyte has<br />
almost a constant value, of around 10Ωcm<br />
129<br />
2 . We have noticed that for relatively<br />
diluted solutions the charge transfer resistance, Rct, <strong>de</strong>creases with shift of the<br />
electro<strong>de</strong> potential towards negative direction. This behavior corresponds<br />
to a more intensive rate of charge transfer after the first silver layer was<br />
<strong>de</strong>posited on Pt, leading to the increasing the exchange currents.<br />
Table 1 shows that at near equilibrium potentials (zero values of E),<br />
with increasing silver concentration in binary ionic liquid there is also a<br />
continuous <strong>de</strong>creasing in diffusion resistance (W-R). On contrary, in the
LIANA ANICAI, ANCA COJOCARU, ANDREEA FLOREA, TEODOR VISAN<br />
region of intense silver <strong>de</strong>position (-0.1V to -0.2V) W-R has a slightly increase.<br />
This constitutes an evi<strong>de</strong>nce for a diffusion control of cathodic process. As a<br />
consequence, we confirm the chemical step (1) as a rapid one, the diffusion<br />
of complexated Ag ion to the electro<strong>de</strong> surface being the rate-<strong>de</strong>termining<br />
step. Taking into account an approximately constant value of CPE-p exponent<br />
(p is mostly in the 0.6-0.86 range) we can compare the values of CPE-T at<br />
each potential; the increasing of double layer capacitance with cathodic<br />
overpotential would be explained by an increasing in the surface area of<br />
electro<strong>de</strong>, which is due to the further silver <strong>de</strong>position on the electro<strong>de</strong>.<br />
Fitted parameters for silver electro<strong>de</strong>position on Pt electro<strong>de</strong> (0.5cm 2 ) in<br />
ChCl+urea (1: 2) ionic liquid at 70 0 C<br />
Table 1.<br />
Circuit<br />
parameter<br />
0.14M AgNO3 0.282M AgNO3 0.565M AgNO3<br />
Potential 0V -0.1V -0.05V -0.12V -1.25V 0V -0.16V<br />
Rs, Ω 16.12 23.05 17.94 11.17 19.19 12.96 16.55<br />
CPE-T, F 1019 4009 2827 498 1563 1834 5931<br />
CPE-P 0.86 0.60 0.70 0.81 1.24 0.73 0.57<br />
Rct, Ω 409.4 20.0 9.4 5.0 8.0 49.9 148.2<br />
W-R, Ω 280.4 411.7 45.8 589.8 5.8 21.0 626.9<br />
W-T, F 5340 21290 37330 45400 480 500 6140<br />
W-P 0.55 0.54 0.53 0.5 0.74 0.001 0.84<br />
About the using of Ag/Ag+ ion couple as the reference electro<strong>de</strong> in ionic<br />
liquid media<br />
In our experiments we have arbitrarily chosen a quasi-reference<br />
electro<strong>de</strong> consisting in a silver wire immersed in the ionic liquid containing<br />
Ag<br />
130<br />
+ ion (ChCl + urea + AgNO3 (or AgCl)). This convenience of use has led<br />
to the frequent employment. It has advantage of achieving quickly its<br />
equilibrium potential and reproducibility and of maintaining its potential well<br />
with time, making it particularly well suited to act as a comparison. The<br />
results about reversible behavior of silver/silver ion couple may lead to<br />
some interpretations regarding the use of this couple as reference electro<strong>de</strong> in<br />
ChCl based ionic liquids.<br />
It is well known that a reference electro<strong>de</strong> i<strong>de</strong>ally provi<strong>de</strong>s a fixed<br />
reference potential against which the potential of the working electro<strong>de</strong> is<br />
measured. Conventionally, its Galvani electric potential is set equal to zero.<br />
One of the most common used reference electro<strong>de</strong>s in electrochemical<br />
studies un<strong>de</strong>rtaken in aqueous media is the silver/silver chlori<strong>de</strong> (Ag/AgCl)<br />
electro<strong>de</strong> with NaCl or KCl aqueous solutions in concentration ranging from<br />
1M to saturation. Sometimes, this electro<strong>de</strong> is also used in experiments in<br />
non-aqueous media being easier to construct and with potentials established<br />
rapidly and reproducibly.
ELECTROCHEMICAL INVESTIGATION OF SILVER / SILVER ION COUPLE REVERSIBILITY …<br />
However, the electro<strong>de</strong> potential difference between two electro<strong>de</strong>s<br />
immersed in electrolytes in contact with each other involves supplementary<br />
potentials, apart from ohmic potential drop term (IR). Thus, a salt bridge<br />
may give rise to a liquid junction potential which may alter the imposed<br />
potential of working electro<strong>de</strong> from potentiostat. For good results, the liquid<br />
junction potentials at the reference electro<strong>de</strong>/salt bridge and salt bridge/working<br />
solution interfaces must have similar magnitu<strong>de</strong>s but opposite polarities<br />
and will, therefore, cancel each other. The complexity of problem is related<br />
to knowledge of the free energies of solvation for charged (cation) or<br />
neutral particles transferred between the aqueous and organic solvent; for<br />
minimizing errors these transfer free energies should be the same from<br />
solvent to solvent. It follows that in electrochemical measurements using<br />
non-aqueous solutions an electrochemical series can be established for<br />
each solvent [12]. The problem is how the potentials of such a series would<br />
compare with the corresponding potentials in water.<br />
In conditions where AgCl is soluble in a non-aqueous solvent, the<br />
working electro<strong>de</strong> potential is measured against Ag/non-aqueous solution<br />
containing Ag + ion (commonly as AgNO3) reference couple. For example,<br />
we have used a nonaqueous Ag/Ag + system (10 -2 M AgNO3 + 0.1M tetra-nbutylammonium<br />
perchlorate, CH3CN) as reference electro<strong>de</strong> in acetonitrile [13].<br />
In cyclic voltammetry experiments carried out in molten nitrates (300-600 0 C),<br />
we also employed a silver wire immersed in a melt containing AgNO3 with a<br />
concentration about 10 -2 M in the studied molten nitrate electrolyte [14,15].<br />
Working in medium and high temperature molten hali<strong>de</strong>s or carbonates,<br />
within 450-1000 0 C range, the choosing of an appropriate reference electro<strong>de</strong><br />
is much more difficult. Using LiCl-KCl melts, the reference electro<strong>de</strong> was<br />
a Ag wire immersed in silver ion containing melt (1M AgCl in LiCl-KCl<br />
eutectic) placed in a separated compartment [16]. Usually, especially at high<br />
temperatures, a metal electro<strong>de</strong> (Pt, Al, W, Ni etc.) simply immersed in the<br />
melt is frequently used as quasi-reference electro<strong>de</strong> in molten electrolytes<br />
where no established reference electro<strong>de</strong> couple exists [17].<br />
The use of such quasi-reference electro<strong>de</strong>s for experiments in ionic<br />
liquids was reported by many authors. For example, Bakkar and Neubert [18]<br />
employed a Pt wire directly placed in the electrochemical cell during corrosion<br />
studies carried out in ChCl binary mixtures (with urea, ethylene glycol, glycerol,<br />
malonic acid). A silver wire as quasi-reference electro<strong>de</strong> was used recently<br />
by Abbott et al. during studies of either stainless steel electropolishing [7] or<br />
<strong>de</strong>position of metals and alloys [19-21] in <strong>de</strong>ep eutectic solvents based on<br />
choline chlori<strong>de</strong>. We consi<strong>de</strong>r that employing a Ag wire immersed in an<br />
ionic liquid with a certain content in chlori<strong>de</strong> ions such as ChCl ionic<br />
complex species, a half-cell reaction of AgCl film formation occurs:<br />
Ag(solid) + Cl - (ionic liquid) ⇔ AgCl(solid)+ e - (4)<br />
131
132<br />
LIANA ANICAI, ANCA COJOCARU, ANDREEA FLOREA, TEODOR VISAN<br />
This process of film formation on Ag quasi-reference electro<strong>de</strong> has<br />
advantages of achieving the equilibrium potential in short time, reproducibility<br />
and maintaining electro<strong>de</strong> potential with time, making it particularly well<br />
suited to act as a comparison.<br />
CONCLUSIONS<br />
Both voltammetric and electrochemical impedance measurements<br />
showed a quite reversible and diffusion controlled process of silver <strong>de</strong>position<br />
in choline chlori<strong>de</strong> + urea mixture at 70 0 C, where one electron transfer process<br />
is prece<strong>de</strong>d by a chemical step of <strong>de</strong>livering of electroactive species. Thus,<br />
the diffusion of complexated silver ion with choline chlori<strong>de</strong> was consi<strong>de</strong>red<br />
as rate-<strong>de</strong>termining step.<br />
Additionally, the EIS data exhibit a non-uniformity of electro<strong>de</strong>posited<br />
silver layer onto platinum substrate as well as change in behavior of cathodic<br />
process at more negative potentials. The experimental impedance data<br />
were fitted using a single electric circuit as mo<strong>de</strong>l, with the values of circuit<br />
parameters in good agreement with the experimental data. The use of Ag/Ag +<br />
reference electro<strong>de</strong>s for experiments in ionic liquids was finally discussed.<br />
EXPERIMENTAL SECTION<br />
Cyclic voltammetry and electrochemical impedance spectroscopy<br />
investigations were conducted in ChCl-urea-AgNO3 ionic liquid media. The<br />
binary ChCl-urea system as supporting electrolyte was separately prepared<br />
with analytical gra<strong>de</strong> choline chlori<strong>de</strong> (Merck) and urea (Fluka) in the<br />
corresponding amounts for 1: 2 (in moles) mixtures. AgNO3 was dissolved<br />
as precursor of Ag + ion in concentrations in the range of 0.14 - 0.565 M, the<br />
molarity values being calculated using own experimental data of ionic liquid<br />
<strong>de</strong>nsity (work in progress). The electrochemical cell (50 cm 3 ) contained a Pt<br />
foil (0.5 cm 2 ) as working electro<strong>de</strong>, a large platinum plate (4 cm 2 ) as auxiliary<br />
electro<strong>de</strong>, and a Ag wire placed in the same electrolyte (a quasi reference<br />
electro<strong>de</strong>). In the experiments a computer driven Autolab PGSTAT 302<br />
potentiostat was used. Voltammograms were recor<strong>de</strong>d using scan rates in<br />
10 -200mV/s range. The impedance was measured in the potentiostatic<br />
conditions with a sinusoidal potential perturbation of the peak to peak<br />
amplitu<strong>de</strong> equal to 10 mV at frequency sweep from 1 MHz to 0.01 Hz at<br />
different electro<strong>de</strong> potentials. Zview 2.80 software (Scribner Assoc. Inc.)<br />
was used for fitting impedance data. All electrochemical tests were carried<br />
out in a quiescent aerated ionic liquid at 70 0 C.<br />
ACKNOWLEDGEMENT<br />
The financial support within the PNCDI-2, Parteneriate Romanian Programme -<br />
project nr.31066/2007 is gratefully acknowledged.
ELECTROCHEMICAL INVESTIGATION OF SILVER / SILVER ION COUPLE REVERSIBILITY …<br />
REFERENCES<br />
1. A. P. Abbott, G. Capper, D. L. Davies, H. Munro, R. K. Rasheed, V. Tambyrajah,<br />
Chemical Communications, 2001, 2010.<br />
2. A. P. Abbott, G. Capper, D. L. Davies, R. K. Rasheed, V. Tambyrajah, Chemical<br />
Communications, 2003, 70.<br />
3. A. P. Abbott, D. Boothby, G. Capper, D. L. Davies, R. K. Rasheed, Journal of<br />
American Chemical Society, 2004, 126, 9142.<br />
4. K. J. McKenzie, A. P. Abbott, Physical Chemistry Chemical Physics, 2006, 8, 4265.<br />
5. W. Freyland, C. A. Zell, S. Zein El Abedin, F. Endres, Electrochimica Acta, 2003,<br />
48, 3053.<br />
6. A. P. Abbott, G. Capper, D. L. Davies, H. L. Munro, R. K. Rasheed, V.<br />
Tambyrajah, in: Ionic liquids as green solvents: progress and prospects, R. D.<br />
Rodgers, K. R.Seddom, Eds., ACS Symposium Series, 2003, 439.<br />
7. A. P. Abbott, G. Capper, K. J. McKenzie, K. S. Ry<strong>de</strong>r, Electrochimica Acta,<br />
2006, 51, 4420.<br />
8. L. Anicai, M. Duu, A. Perache, T. Visan, Coroziune si Protectie Anticoroziva<br />
(Cluj-Napoca), 2007, 2, 10.<br />
9. D. Gonnissen, S. Van<strong>de</strong>putte, A. Hubin, J. Vereecken, Electrochimica Acta, 1996,<br />
41, 1051.<br />
10. D. Bistriteanu, T. Visan, M. Buda, N. Ibris, Chemical Bulletin of Politehnica University<br />
Timisoara, 1998, 43, 67.<br />
11. N. Ibris, M. Buda, D. Bistriteanu, T. Visan, Annals West Univ. Timisoara, 15,<br />
2006, 109.<br />
12. R. G. Compton, G. H. W. San<strong>de</strong>rs, Electro<strong>de</strong> Potentials, Oxford Univ. Press,<br />
Oxford, 1996.<br />
13. E. Saint-Aman, M. Ungureanu, T. Visan, J. C. Moutet, Electrochimica Acta,<br />
1997, 42, 1829.<br />
14. S. Sternberg, T. Visan, Electrochimica Acta, 1981, 26, 75.<br />
15. D. Tkalenko, N. Chmilenko, T. Visan, M. Tkalenko, C. Ghiga, Studia Universitatis<br />
Babes-Bolyai, Chemia, 1996, 41, 158.<br />
16. S. Sternberg, I. Lingvay, T. Visan, Electrochimica Acta, 1985, 30, 283.<br />
17. M. Chemla, D. Devilliers Eds, Molten Salts Chemistry and Technology, Materials<br />
Science Forum, Vol.73-75, Trans.Tech.Publ., Switzerland, 1991.<br />
18. A. Bakkar, V. Neubert, Electrochemical Communications, 2007, 9, 2428.<br />
19. A. P. Abbott, G. Capper, K. J. McKenzie, K. S. Ry<strong>de</strong>r, Journal of Electroanalytical<br />
Chemistry, 2007, 599, 288.<br />
20. A. P. Abbott, J. Griffith, S. Nandhra, C. O’Connor, S. Postlethwaite, K. S. Ry<strong>de</strong>r, E.<br />
L. Smith, Surface and Coatings Technology, 2008, 202, 2033.<br />
21. A. P. Abbott, D. L. Davies, G. Capper, R. K. Rasheed, V. Tambyrajah, US Patent<br />
2004 / 0097755.<br />
133
STUDIA UNIVERSITATIS BABE-BOLYAI, CHEMIA, LIII, 1, 2008<br />
In memoriam prof. dr. Liviu Oniciu<br />
ELECTROREDUCTION OF CARBON DIOXIDE TO FORMATE<br />
ON BRONZE ELECTRODE<br />
MARIA JITARU * , MARIANA TOMA<br />
ABSTRACT. This paper presents our data on the electrochemical reduction<br />
of carbon dioxi<strong>de</strong>, on bronze electro<strong>de</strong> (Sn85Cu15) in aqueous medium (0.2 M<br />
K2CO3), un<strong>de</strong>r CO2 atmosphere, (12-25) 0 C. The current efficiency for main<br />
product (formate) <strong>de</strong>pends on the current <strong>de</strong>nsity and was found to be up<br />
to 74% at high negative potential (> - 1.6 V/SCE), <strong>de</strong>creasing with operating<br />
time and with temperature increase (72-74% at 12 0 C and 60-65% at 25 0 C).<br />
Keywords: carbon dioxi<strong>de</strong>, electroreduction, formate, bronze electro<strong>de</strong>.<br />
INTRODUCTION<br />
The electrochemistry of CO2 is a continuously growing field because<br />
it is a remarkable process with respect to at least two reasons. Firstly, CO2<br />
is the ultimate by-product of all processes involving oxidation of carbon<br />
compounds. Secondly, CO2 represents a possible potential source for Cfeedstock<br />
for the manufacture of chemicals.<br />
The electroreduction of CO2 at various metal electro<strong>de</strong>s yields many<br />
kinds of organic substances, namely CO, CH4, C2H6, EtOH, other alcohols,<br />
formic acid, etc. Sánchez-Sánchez et al. [1] summarized representative results<br />
for the direct electrochemical CO2 reduction at solid electro<strong>de</strong>s. The various<br />
types of electrocatalytic behavior among metals can be related to their<br />
electronic configuration and can be grouped into sp and d metals [2, 3]. The<br />
electroreduction techniques had to overcome the difficulty of finding<br />
electro<strong>de</strong>s with both high electrocatalytic activity and satisfactory lifetime [3].<br />
The thermodynamic requirements for various CO2-reduction reactions<br />
should be consi<strong>de</strong>red, because of the stability and chemical inertness of CO2.<br />
The necessary energy to carry out carbon dioxi<strong>de</strong> transformations for the<br />
processing and recovery of the air carbon-based sources can be generated<br />
by high temperatures, extremely reactive reagents, electricity, or by light<br />
irradiation [1]. However, because of the close proximity of the hydrogen<br />
* Faculty of Chemistry and Chemical Engineering, Babes-Bolyai University, 11, Arany Janos,<br />
400028, Cluj-Napoca, Romania, mjitaru@chem.ubbcluj.ro
MARIA JITARU, MARIANA TOMA<br />
potential, hydrogen evolution may also occur, as a concurrent reaction,<br />
<strong>de</strong>pending on the operating system. The electroreduction of carbon dioxi<strong>de</strong><br />
needs substantial overpotentials due to the kinetic barrier and the large<br />
difference in the HOMO and LUMO energies. Moreover, the cathodic<br />
reduction of carbon dioxi<strong>de</strong> is normally accompanied by hydrogen evolution<br />
and often mixtures of reaction products are obtained.<br />
The main competitive reactions (1-5) involve electrosorbed species<br />
with hydrogen atom participation. Thus, in the electrochemical reduction of<br />
CO2 in water, the hydrogen formation competes with the CO2 reduction<br />
reaction. Therefore, the suppression of hydrogen formation is very important<br />
because the applied energy is wasted on hydrogen evolution instead of<br />
being used for the reduction of CO2.<br />
H + + e -<br />
H ad (1)<br />
CO 2 + H ad HCOOad (2)<br />
HCOO ad + H ad HCOOH (3)<br />
HCOO ad + CH 3OH CH 3COOH + OH ad (4)<br />
OH ad + H ad H 2O (5)<br />
The large number of recent papers, published during the last ten<br />
years on electrochemical reduction of carbon dioxi<strong>de</strong> are both fundamental<br />
and preparative interest [4-19].<br />
According to the recent review of Gattrell and Gupta [4] the reaction<br />
product distribution strongly <strong>de</strong>pends on conditions at which data has been<br />
reported. When used in the aqueous solution, most flat metallic electro<strong>de</strong>s<br />
yiel<strong>de</strong>d carbon monoxi<strong>de</strong> and formic acid [5, 6-10]. Hori et al. [11] with<br />
regard to the hydrocarbons formation on copper catho<strong>de</strong> revealed exten<strong>de</strong>d<br />
aspects on the <strong>de</strong>activation of copper. Many workers reported “poisoning”<br />
or “<strong>de</strong>activation” of the copper electro<strong>de</strong> in 10-30 min after the start of the<br />
CO2 electroreduction [11].<br />
CO2 can be reduced on the surface of Pd-Pt-Rh alloys in the<br />
potential range of hydrogen electrosorption [12, 13]. The presence of the<br />
adsorbed product of the electroreduction of CO2 on the electro<strong>de</strong> surface<br />
does not block hydrogen absorption [1, 3, 13].<br />
The electrocatalytic activity of bronze catho<strong>de</strong> for the electrochemical<br />
reduction of stable inorganic molecules (nitrates and NO) has been reported<br />
[14, 15]. An enhancement of the electrocatalytic activity of Cu by alloying<br />
with Sn was observed only in the composition region up to 15% (wt.) Sn. A<br />
further increase in Sn content results in a rapid <strong>de</strong>cline of the electrocatalytic<br />
activity caused by changes in the phase structure of the alloy material [14].<br />
136
ELECTROREDUCTION OF CARBON DIOXIDE TO FORMATE ON BRONZE ELECTRODE<br />
The current efficiency for formate <strong>de</strong>pends on the electro<strong>de</strong> nature<br />
[1,5], current <strong>de</strong>nsity and CO2 pressure. Other factors such the hydrogen<br />
overpotential [2] and mass transfer capacity of the catho<strong>de</strong> are important<br />
and <strong>de</strong>pend on the operating time. During the experiments the tin was lost<br />
from the catho<strong>de</strong> surface [11,13] and this fact <strong>de</strong>creased the current efficiency<br />
for carbon electroreduction.<br />
Several papers related to the electrochemistry of CO2 are of<br />
technological interest [16-19]. Copper tube electro<strong>de</strong>s have been employed<br />
for the production of methanol and formic acid [16].<br />
The i<strong>de</strong>a of this work is to enhance the electrocatalytic activity of<br />
copper for reduction of carbon dioxi<strong>de</strong> to formate, diminishing the competitive<br />
hydrogen formation in the presence of tin in Cu-Sn alloy catho<strong>de</strong>.<br />
RESULTS AND DISCUSSIONS<br />
Voltamperommetric response of system<br />
The potential was scanned at a sweep rate of 25 - 250 mVs -1<br />
. Typical<br />
current-potential curves are illustrated in Fig. 1. The starting potential of the<br />
cathodic current was observed at approximately -1.1 V. No voltammetric peak<br />
was observed in potential range down to – 2.0 V. Further CO2 reduction<br />
may proceed with increasingly negative potentials, inhibiting the hydrogen<br />
evolution.<br />
Current, µA<br />
- E /V/Ag,AgCl<br />
Figure 1. Current-potential curves for<br />
CO2 reduction on bronze (Sn85Cu15)<br />
in 0.2 M K2CO3, saturated with CO2<br />
un<strong>de</strong>r CO2 atmosphereatambient<br />
temperature ( 20±0.4) 0 C.<br />
€ - Ar gas; – CO2 gas.<br />
From the polarization curves it was observed that the CO2 reduction<br />
presented a Tafel slope corresponding to ne=1, indicating that the first<br />
electronation of the CO2 molecule to form the radical anion (CO2 -. ), is the<br />
rate-controlling step.<br />
137
138<br />
MARIA JITARU, MARIANA TOMA<br />
Factors influencing the current efficiency<br />
In absence of CO2 in the cell, the current was used only for hydrogen<br />
evolution; no other reaction products were <strong>de</strong>tected both in electrolyte and<br />
in cell atmosphere. In presence of CO2, the main product <strong>de</strong>tected (by HPLC<br />
Perkin-Elmer LC 200, ODS-18 column) and by gas chromatography (Hewlett-<br />
Packard 6890, TCD, FID, Porapac QS columns) was formic acid (formate and<br />
methyl formate, in the presence of methanol). Accordingly, only the formate<br />
has been <strong>de</strong>terminated during our experiments. The influence of applied<br />
potential and temperature on the current efficiency for formic acid formation<br />
has been <strong>de</strong>terminated.<br />
Influence of applied potential<br />
current efficiency /%/<br />
70<br />
65<br />
60<br />
55<br />
50<br />
45<br />
40<br />
35<br />
30<br />
1,5 1,7 1,9 2,1<br />
-E ( V/Ag,AgCl )<br />
Figure 2. Current efficiency - potential diagrams for CO2 reduction on bronze (Sn85Cu15)<br />
in 0.2 M K2CO3, saturated with CO2, un<strong>de</strong>r CO2 atmosphere at ambient temperature<br />
(20±0.4) 0 C.( and ) – two series of experiments<br />
The maximum of the partial current <strong>de</strong>nsity for the formation of formic<br />
acid on bronze electro<strong>de</strong> is 80-100 mAcm -2 , larger that with other reported<br />
electro<strong>de</strong> materials [1, 3].<br />
Influence of temperature<br />
The results of the temperature studies show (Fig. 3) that current<br />
efficiency achieved is in the range of 74% after 30 min. of electrolysis, carried<br />
out at the optimum reduction potential of -1.8 V (Fig.2).<br />
It is well known that in aqueous electrolytes, the electroreduction of CO2<br />
not only to HCOOH is in competition with the H2 evolution permanently [13].
ELECTROREDUCTION OF CARBON DIOXIDE TO FORMATE ON BRONZE ELECTRODE<br />
current efficiency /%<br />
75<br />
73<br />
71<br />
69<br />
67<br />
65<br />
63<br />
61<br />
59<br />
57<br />
55<br />
10 15 20 25 30<br />
T ( o C )<br />
Figure 3. Current efficiency - temperature diagrams for CO2 reduction on bronze<br />
(Sn85Cu15) in 0.2 M K2CO3, un<strong>de</strong>r CO2 atmosphere, at 120 mA.cm -2 ,<br />
( and ) – two series of experiments<br />
The increase in the temperature un<strong>de</strong>r ambient conditions leads to a<br />
<strong>de</strong>crease of the current efficiencies for the HCOOH formation because of<br />
the <strong>de</strong>creasing CO2 concentration in the electrolyte; thus the H2 evolution<br />
becomes more dominant. In this small temperature range (=13 0 C), the<br />
<strong>de</strong>crease was <strong>de</strong>monstrated. Probably, with the <strong>de</strong>crease of temperature<br />
un<strong>de</strong>r 12 0 C, the competitive hydrogen evolution could be further diminished.<br />
The preliminary data were obtained on the influence of electrolysis<br />
time and of the presence of methanol, on the current efficiency for formate<br />
formation (Table 1).<br />
After 40-50 minutes of electrolysis, a catho<strong>de</strong> <strong>de</strong>activation was<br />
observed (the corresponding current efficiencies <strong>de</strong>creased with 10-30%).<br />
A further increase in electrolysis time leads to a rapid <strong>de</strong>cline in activity.<br />
On the other hand, the presence of methanol up to 50% in volume<br />
leads to a smaller selectivity for formate formation, which becomes only<br />
(54-58) % at -1.8 V and low temperature (12 0 C), comparing with (72-74) %<br />
in aqueous electrolyte.<br />
The preliminary data in Table 1 are according to bibliographical<br />
information and with the supposed beneficial effect of Sn on the electrocatalytic<br />
activity of copper catho<strong>de</strong>, in bronze. Thus, when aqueous solution<br />
was used, copper was reported to be a suitable electro<strong>de</strong> for the formation<br />
of hydrocarbons. The electrochemical reduction of CO2 with a Cu electro<strong>de</strong><br />
in methanol-based electrolyte was investigated by other authors [6]. The<br />
main products from CO2 were methane, ethylene, ethane, carbon monoxi<strong>de</strong><br />
and formic acid. On the other hand, very recent paper <strong>de</strong>monstrated the<br />
influence of ad<strong>de</strong>d Sn on the electrocatalytic activity of copper, as the basic<br />
catho<strong>de</strong> material, on the electrocatalytic activity of the resulting material for<br />
nitrate (NO3 – ) reduction [15].<br />
139
140<br />
MARIA JITARU, MARIANA TOMA<br />
Current – efficiencies on bronze catho<strong>de</strong> <strong>de</strong>pending on<br />
electrolysis time and presence of methanol<br />
Composition of electrolyte Time of<br />
Current<br />
electrolysis (min) Efficiency (%)<br />
Aqueous 0.2 M K2CO3 30 72-74<br />
60 62-65<br />
MeOH/water (1/2) + 0.2 M K2CO3 30 59-63<br />
60 49-52<br />
MeOH/water (1/1) + 0.2 M K2CO3 30 54-58<br />
60 42-43<br />
Table 1.<br />
The current efficiency for HCOOH production increased after hydrogen<br />
was absorbed on the electro<strong>de</strong> surface. This fact was <strong>de</strong>monstrated using<br />
the bronze electro<strong>de</strong> after activation by H2 evolution (10 minutes before the<br />
electrolysis in the presence of carbon dioxi<strong>de</strong>). The participation of absorbed<br />
hydrogen in the reduction of CO2 and the possibility of direct attack on the<br />
reaction intermediates by absorbed hydrogen could be involved.<br />
CONCLUSIONS<br />
The present paper <strong>de</strong>monstrated for the first time, up to our knowledge,<br />
that the bronze electro<strong>de</strong> is suitable for selective electroreduction of CO2 to<br />
formate, especially in aqueous bicarbonate solution. The selectivity diminishes<br />
in the presence of methanol.<br />
The important current efficiency for formic acid formation (up to 74%)<br />
have been obtained at reduction potential of -1.8 V and 12 0 C, during the<br />
first 30 minutes of electrolysis.<br />
According to our preliminary observations on the increase of current<br />
efficiency after the saturation of the electro<strong>de</strong> with adsorbed hydrogen (Had)<br />
the electrochemical hydrogenation can be also involved in the electroreduction<br />
mechanism.<br />
The most important result of this work is the enhancing of the<br />
electrocatalytic activity of copper for reduction of carbon dioxi<strong>de</strong> to formate,<br />
diminishing the competitive hydrogen formation, in the presence of tin of<br />
the Cu-Sn alloy catho<strong>de</strong>.<br />
As perspectives, it is envisaged to use this procedure as a suitable<br />
alternative for testing other catho<strong>de</strong>s including modified materials, like<br />
nanocopper catho<strong>de</strong>s, modified with un<strong>de</strong>rpotential <strong>de</strong>posited stanium.
ELECTROREDUCTION OF CARBON DIOXIDE TO FORMATE ON BRONZE ELECTRODE<br />
EXPERIMENTAL SECTION<br />
Reagents and solution preparation<br />
All reagents (potassium permanganate, potassium carbonate,<br />
potassium hydroxi<strong>de</strong>, methanol, formic acid) were reagent gra<strong>de</strong> from<br />
Fluka. The electrolytes were prepared from MiilQ water. To saturate the<br />
potassium bicarbonate the carbon dioxi<strong>de</strong> (Fluka, quality sign 48) free of<br />
organics has been used.<br />
Formate <strong>de</strong>termination<br />
The solution of the sample is treated with excess of standard potassium<br />
permanganate in alkaline conditions to form manganese dioxi<strong>de</strong>. The<br />
manganese dioxi<strong>de</strong> and excess potassium permanganate were <strong>de</strong>termined<br />
iodometrically in acid conditions and the concentration of oxidizable<br />
impurities were calculated and expressed as formic acid.<br />
Apparatus<br />
Voltammetric measurements were ma<strong>de</strong> using a potentiostatgalvanostat<br />
system – BAS 100B (Bioanalytical Systems, USA) with the<br />
specific software BAS 100W and a classic three-electro<strong>de</strong> electrochemical<br />
cell. The electrochemical cell is comprised of a cell bottom of 20 mL<br />
capacity. A working electro<strong>de</strong> of (Sn85Cu15) (2 mm diameter) and a platinum<br />
plate auxiliary electro<strong>de</strong> were inserted through the cell top into the cell.<br />
During the voltammetry <strong>de</strong>termination, a salt bridge for the protection of the<br />
reference electro<strong>de</strong> Ag/AgCl was used. The pH measurements were ma<strong>de</strong><br />
with a pH-meter Basic 20 (Crison).<br />
Procedure<br />
Cyclic voltammetry and linear sweep potential voltammetry were<br />
performed in the usual way with a potential sweep rate of 5 mV/s at 25º C.<br />
The sensitivity is 10 A/V and the domain of potential was established after<br />
several <strong>de</strong>terminations: -400 to 400 mV vs. Ag/AgCl.<br />
The electroreduction of CO2 was ma<strong>de</strong> in a laboratory divi<strong>de</strong>d<br />
bench-scale reactor (V= 200 ml; Nafion 424 membrane), equipped with<br />
bronze catho<strong>de</strong> (S= 2.2 cm 2 ) and Pt ano<strong>de</strong>. The electrolyte was aqueous or<br />
hydro-alcoholic 0.2 M K2CO3 saturated with carbon dioxi<strong>de</strong>. The catholyte<br />
was stirred magnetically. The faradic efficiency of formation for the main<br />
products were calculated from the total charge passed during batch<br />
electrolyses, which was set to 50 coulombs.<br />
During the preparative electrolysis, samples were taken (in 30-min<br />
periods) with a volume of 5 mL from the electrolyte. The samples from the<br />
electrolyte were studied with respect to formate formation.<br />
141
142<br />
MARIA JITARU, MARIANA TOMA<br />
REFERENCES<br />
1. C. M. Sánchez-Sánchez, V. Montiel, D. A. Tryk, A. Aldaz, A. Fujishima, Pure<br />
Applied Chemistry, 2001, 20,1917.<br />
2. M. Jitaru, D. A. Lowy, M. Toma, B. C. Toma, L. Oniciu, Journal of Applied<br />
Electrochemistry, 1997, 27, 875.<br />
3. M. Jitaru, Journal of the University of Chemical Technology and Metallurgy, 2007,<br />
42, 333.<br />
4. M. Gattrell, N. Gupta, Journal of Electroanalytical Chemistry, 2006, 594, 1.<br />
5. S. Kaneco, N. Hiei, Y. Xing, H. Katsumata, H. Ohnishi, T. Suzuki, K. Ohta,<br />
Electrochimica Acta, 2002, 48, 51.<br />
6. G. M. Brisard, A. P. M. Camargo, F. C. Nart and T. Iwasita, Electrochemistry<br />
Communications, 2001, 3, 603.<br />
7. H. Yano, T. Tanaka, M. Nakayama and K. Ogura, Journal of Electroanalytical<br />
Chemistry, 2004, 565, 287.<br />
8. R. Aydin and F. Köleli, Journal of Electroanalytical Chemistry, 2002, 535, 107.<br />
9. T. Kuniko, T. Fu<strong>de</strong>ko, K. Masahiro, A. Yoshio, A. Makoto, Bulletin of the Faculty of<br />
Human Environmental Science, 2005, (36),13.<br />
10. L. Jaeyoung, Tak Yongsug, Electrochimica Acta, 2001, 46, 3015.<br />
11. Y. Hori, H. Konishi, T. Futamura, A. Murata, O. Koga, H. Sakurai and K. Oguma,<br />
Electrochimica Acta, 2005, 50, 5354.<br />
12. R. Aydin and F. Köleli, Synthetic Metals, 2004, 144, 75.<br />
13. M. Lukaszewski, M. Gr<strong>de</strong>n and A. Czerwinski, Electrochimica Acta, 2004, 49,<br />
3161.<br />
14. C. Polati<strong>de</strong>s, G. Kyriacou, Journal of Applied Electrochemistry, 2005, 35, 421.<br />
15. Z. Mácová , K. Bouzek and J. Šerák, Journal of Applied Electrochemistry, 2007,<br />
37, 557.<br />
16. K. Ohta, A. Hashimoto and T. Mizuno, Energy Conversion and Management,<br />
1995, 36, 625.<br />
17. Sh. Ikeda, T. Ito, K. Azuma, N. Nishi, K. Ito and H. Noda, Denki Kagaku, 1996,<br />
64, 625.<br />
18. T. Mizuno, K. Ohta, A. Sasaki, T. Akai, M. Hirano and A. Kawabe, Energy Sources,<br />
1995, 17, 503.<br />
19. H. Noda, Sh. Ikeda, A. Yamamoto, H. Einaga and K. Ito, Bulletin of the Chemical<br />
Society of Japan, 1995, 68, 1889.
STUDIA UNIVERSITATIS BABE-BOLYAI, CHEMIA, LIII, 1, 2008<br />
In memoriam prof. dr. Liviu Oniciu<br />
KINETIC AND THERMODYNAMIC CHARACTERIZATION OF<br />
PROTEIN ADSORPTION AT FLUID INTERFACES<br />
MARIA TOMOAIA-COTISEL a , OSSI HOROVITZ a , OLIMPIA BOROSTEAN a ,<br />
LIVIU-DOREL BOBOS a , GHEORGHE TOMOAIA b , AURORA MOCANU a<br />
AND TRAIANOS YUPSANIS c<br />
ABSTRACT. The formation and characterization of nanostructured polyfunctional<br />
layers (films) based on protein adsorption at different fluid interfaces,<br />
such as air/water or oil/water interfaces, in the absence or in the presence<br />
of stearic acid are investigated. For instance, kinetics and thermodynamics<br />
of protein adsorption at the air/aqueous solutions were studied, thereby<br />
evi<strong>de</strong>ncing the protein surface active properties. The investigated protein<br />
was a globulin extracted and purified from aleurone cells of barley. The<br />
conjugated effect of protein and stearic acid simultaneous adsorption was<br />
also investigated, at the benzene/aqueous solutions interface. A stable<br />
mixed lipid and protein film has been formed by the co-adsorption of these<br />
biomolecules at liquid-liquid interface showing that the interaction between<br />
stearic acid and the protein is significant.<br />
Keywords: adsorption, fluid interfaces, protein, stearic acid<br />
INTRODUCTION<br />
A great number of problems in interface science <strong>de</strong>al with the<br />
adsorption [1-15] and relaxation [5, 16-20] of surface active compounds (in<br />
short, surfactants) at fluid interfaces. In fact, the mo<strong>de</strong>rn soft-matter physical<br />
chemistry has opened a great number of questions <strong>de</strong>aling with the dynamics<br />
of soft surfaces, particularly with protein or lipid dynamics at interfaces. Among<br />
these systems, adsorbed protein films are frequently consi<strong>de</strong>red as mo<strong>de</strong>l<br />
systems to explore the surface behavior of proteins or their interaction with<br />
lipids at fluid interfaces. In vivo, the control over protein functional behavior<br />
is often mediated by the formation of supramolecular assemblies with lipids<br />
that frequently play a crucial role in the molecular organization of biological<br />
systems.<br />
a Babes-Bolyai University of Cluj-Napoca, Faculty of Chemistry and Chemical Engineering,<br />
Arany J. Str., no 11, 400028 Cluj-Napoca, Romania, mcotisel@chem.ubbcluj.ro<br />
b Iuliu Hatieganu University of Medicine and Pharmacy, Department of Orthopedic Surgery,<br />
Mosoiu Str., no. 47, 400132 Cluj-Napoca, Romania<br />
c Aristotelian University, School of Chemistry, Laboratory of Biochemistry, 54006 Thessaloniki,<br />
Greece
M. TOMOAIA-COTISEL, O. HOROVITZ, O. BOROSTEAN, L.-D. BOBOS, G. TOMOAIA, A. MOCANU, T. YUPSANIS<br />
Protein adsorption at interfaces is also an important subject of<br />
investigations, in many artificial systems encountered in industrial applications,<br />
particularly because many alimentary emulsions are stabilized by proteins. The<br />
un<strong>de</strong>rstanding of protein behavior and its interactions with other biomolecules<br />
might bring strong information for a <strong>de</strong>sired performance.<br />
Usually protein adsorption at fluid interfaces is studied by measurements<br />
of the interfacial tension between the two phases (e.g., oil and water) [21-23].<br />
By protein adsorption, the interfacial tension is reduced in time, for a particular<br />
concentration in protein, and as a function of protein concentration. From<br />
interfacial tension isotherms, information is gained upon the processes<br />
taking place in the early stage of adsorption [24]. Generally, the interfacial<br />
phenomena and adsorption kinetics are essential in <strong>de</strong>termining chemical<br />
and physical properties of such systems [25]. Thus, the adsorption kinetics<br />
of egg yolk was studied at the triacylglycerol / water interface and the effect<br />
of pH was assessed [26]. The role of the charged protein surface in the<br />
adsorption dynamics was studied on L-glutamic acid copolymers [27].<br />
Mo<strong>de</strong>l for protein adsorption at interfaces<br />
Experimentally, it was found that the dynamics of surface tension<br />
presents three regimes [24], specific for diluted solutions of different proteins<br />
(Fig. 1):<br />
• an induction regime, noted regime I, where the interfacial tension<br />
remains relatively constant, at the values characteristic for the pure<br />
liquid phase (e.g., the air/water interface)<br />
• the second regime, noted regime II, is distinguished by a sud<strong>de</strong>n<br />
drop of interfacial tension from its initial value<br />
• the last regime, named regime III, corresponds to a quasi-linear<br />
<strong>de</strong>crease of interfacial tension, with a less abrupt slope than for the<br />
second regime.<br />
144<br />
Figure 1. Plot in semilogarithmic coordinates corresponding to<br />
the three adsorption regimes of proteins at fluid interfaces.
KINETIC AND THERMODYNAMIC CHARACTERIZATION OF PROTEIN ADSORPTION AT FLUID INTERFACES<br />
An induction time, as in the first regime, is frequently observed in<br />
protein solutions at low concentrations, at the air/water interface [28, 29].<br />
Protein molecules are present at the interface, but they do not reduce<br />
consi<strong>de</strong>rably the interfacial tension. In this period, the diffusion of protein<br />
molecules to the surface is important in controlling the adsorption, and is<br />
followed by modifications of the protein configuration (<strong>de</strong>naturation). An<br />
induction period is observed only for much diluted protein solutions. In more<br />
concentrated solutions, regime III is directly attained.<br />
In the regime II, there is already a saturated protein monolayer at<br />
the interface, but the relaxation in the conformation of proteins makes<br />
possible both the adsorption of more inner segments, of the protein<br />
molecules at the interface, and the diffusion of more protein molecules from<br />
the bulk to the interface. Both effects contribute to the <strong>de</strong>crease of<br />
interfacial tension in time. Conformational modifications and <strong>de</strong>naturation of<br />
proteins are therefore more important in reducing interfacial tension than<br />
the initial diffusion and adsorption of protein molecules. It is recognized that<br />
the protein adsorption corresponding to the regime II can give indications<br />
on the protein conformational stability of adsorbed proteins.<br />
In the regime III, there is only a slight <strong>de</strong>crease of interfacial tension,<br />
ascribed to conformational modifications in the adsorption layer with the<br />
formation of multilayers and consequently building of o continuous protein<br />
gel lattice at the interface.<br />
In many cases, the time <strong>de</strong>pen<strong>de</strong>nce of interfacial tension is a<br />
logarithmic one, σ ( t) ~ k logt<br />
, for the protein adsorption at the air/water<br />
interface.<br />
Among proteins, the plant proteins are particularly important because<br />
they are largely used as ingredients in human alimentation and in other<br />
fields, such as cosmetics or drugs <strong>de</strong>livery systems. Adsorption properties<br />
of plant proteins (such as α-gliadins or pea protein) were investigated at the<br />
oil / water interface [30] and compared with the corresponding properties of<br />
gelatin.<br />
Recently, we studied the adsorption of a plant protein, namely the<br />
major globular protein extracted from aleurone cells of barley [31], on<br />
various surfaces, such as glass or mica [32, 33], the surface of citrate<br />
anions capped gold nanoparticles in colloidal aqueous solutions [34, 35],<br />
and on gold nanoparticles auto-assembled as an interfacial film on a solid<br />
surface [36], using UV-Vis spectroscopy, TEM and AFM observations.<br />
In the present paper we investigate the adsorption of the same<br />
globular protein at fluid interfaces, such as the air/water and oil/water<br />
interfaces, as well as the simultaneous adsorption of the protein and stearic<br />
acid at the interface between the aqueous and benzene solutions.<br />
145
M. TOMOAIA-COTISEL, O. HOROVITZ, O. BOROSTEAN, L.-D. BOBOS, G. TOMOAIA, A. MOCANU, T. YUPSANIS<br />
RESULTS AND DISCUSSION<br />
Protein adsorption at the air/water interface<br />
146<br />
Table 1.<br />
Interfacial tension, σ, at the air/aqueous 0.5 M NaCl solution interface, at 20 o C,<br />
for different bulk protein concentrations, Cp, in the aqueous phase, at different<br />
times, t, of adsorption<br />
Cp = 5 mg/L<br />
t, min σ,<br />
Cp = 4 mg/L<br />
t, σ,<br />
Cp = 3 mg/L<br />
t, min σ,<br />
Cp = 2 mg/L<br />
t, min σ,<br />
Cp = 1 mg/L<br />
t, min σ,<br />
Cp = 0.5 mg/L<br />
t, min σ,<br />
mN/m min mN/m mN/m mN/m mN/m mN/m<br />
0 67.77 0 72.3 0 72.25 0 72.07 0 72.19 0 72.13<br />
5 66.51 5 71.85 5 72.08 5 72.02 5 72.11 5 72.10<br />
10 65.8 10 71.01 10 71.99 10 71.87 10 72.08 10 72.08<br />
15 65.3 15 70.52 15 71.91 15 71.73 15 72.02 15 72.05<br />
20 64.93 20 70.01 20 71.65 20 71.62 20 71.99 20 72.02<br />
25 64.73 25 69.32 25 71.59 25 71.50 25 71.93 25 72.02<br />
30 64.44 30 69.09 30 71.42 30 71.39 30 71.88 30 71.99<br />
40 64.16 40 68.45 40 70.98 40 71.10 40 71.82 40 71.96<br />
50 63.59 50 67.99 50 70.69 50 70.87 50 71.73 50 71.93<br />
60 63.33 60 67.48 60 70.06 60 70.55 60 71.59 60 71.90<br />
80 62.84 80 66.84 80 69.25 80 69.92 80 71.36 80 71.87<br />
100 62.66 100 65.98 100 68.74 100 69.32 100 71.16 100 71.85<br />
120 62.56 120 65.35 120 67.99 120 69.11 120 70.93 120 71.79<br />
150 62.44 150 64.31 150 67.12 150 68.34 150 70.44 150 71.73<br />
180 62.32 180 63.85 180 66.31 180 67.76 180 70.06 180 71.64<br />
210 62.26 210 63.39 210 65.97 210 67.30 210 69.69 210 71.50<br />
240 62.26 240 63.28 240 65.45 240 66.96 240 69.49 240 71.39<br />
270 63.05 270 65.03 270 66.44 270 69.28 270 71.30<br />
300 62.97 300 64.93 300 66.27 300 68.94 300 71.13<br />
330 62.87 330 64.73 330 66.12 330 68.77 330 70.93<br />
360 62.83 360 64.56 360 65.81 360 68.54 360 70.75<br />
410 62.79 390 64.38 390 65.64 390 68.48 390 70.70<br />
450 62.8 420 64.15 420 65.26 480 68.23 420 70.61<br />
480 62.65 450 64.01 450 65.06 570 68.06 450 70.58<br />
510 62.56 480 63.81 480 65.06 600 68.02 480 70.55<br />
540 62.56 510 63.69 510 65.03 510 70.52<br />
570 62.64 540 63.60 540 64.97 540 70.52<br />
570 63.43 570 64.78<br />
600 64.60<br />
630 64.51<br />
The values of the interfacial tension measured at different times of<br />
protein adsorption, for each of the investigated protein concentrations, at<br />
the air/aqueous (0.5 M NaCl) solution interface, are given in Table 1.<br />
From this table, it can be observed that the interfacial tension varies<br />
strongly with time, the adsorption equilibrium being reached in more than<br />
10 hours for some protein concentrations. The equilibrium is indicated by<br />
the almost constant value of the interfacial tension.
KINETIC AND THERMODYNAMIC CHARACTERIZATION OF PROTEIN ADSORPTION AT FLUID INTERFACES<br />
Further, using semilogarithmic coordinates, the representation of<br />
interfacial tension against the logarithm of the adsorption time, = f(log t),<br />
is given in Fig. 2. The general aspect of the plots is similar to that resulting<br />
from the mo<strong>de</strong>l of the three adsorption regimes of proteins (Fig.1). While<br />
regime I (induction period) and II (monolayer saturation) are clearly evi<strong>de</strong>nced<br />
in the plots, for regime III the beginning is barely outlined for the highest<br />
concentration (5 mg/L). On the other hand, the induction period is clearly<br />
<strong>de</strong>limited only for the lower protein concentrations (below 4 mg/L).<br />
σ, mN/m<br />
73<br />
72<br />
71<br />
70<br />
69<br />
68<br />
67<br />
66<br />
65<br />
64<br />
63<br />
62<br />
5 mg/L<br />
0.5 mg/L<br />
1 mg/L<br />
2 mg/L<br />
3 mg/L<br />
4 mg/L<br />
0,6 0,8 1,0 1,2 1,4 1,6 1,8 2,0 2,2 2,4 2,6 2,8 3,0<br />
log t<br />
Figure 2. Representation in semilogarithmic coordinates of dynamic interfacial<br />
tension (mN/m) against time (min) for protein adsorption from the aqueous<br />
phase (with various protein concentrations), at the interface with air, at a<br />
temperature of 20 o C.<br />
The limiting values of the interfacial tensions, those corresponding<br />
to the maximum time of protein adsorption for each protein concentration<br />
can be consi<strong>de</strong>red for the establishing of thermodynamic adsorption<br />
equilibrium that is given by the static interfacial tension. The representation<br />
of these static interfacial tensions versus Cp concentration (Figure 3) shows<br />
the typical appearance of a surface tension isotherm, in presence of a<br />
surface active substance. The surface activity of the protein at the air /<br />
aqueous solution interface is thus confirmed.<br />
147
M. TOMOAIA-COTISEL, O. HOROVITZ, O. BOROSTEAN, L.-D. BOBOS, G. TOMOAIA, A. MOCANU, T. YUPSANIS<br />
The adsorption equilibrium and the final adsorption regime III occur<br />
upon protein adsorbed monolayer coverage, and is attributed to continued<br />
relaxation of the adsorbed layer and possible build-up of protein multilayers,<br />
as <strong>de</strong>picted in Figure 4.<br />
Protein and stearic acid co-adsorption at the oil/water interface<br />
Furthermore, we studied the lipid and protein layers at the benzene/<br />
aqueous (0.5 M NaCl) solutions interface. To explore the interaction between<br />
lipid and protein, we have chosen a fatty acid (stearic acid) as a simple<br />
148<br />
σ (mN/m)<br />
74<br />
72<br />
70<br />
68<br />
66<br />
64<br />
62<br />
0 1 2 3 4 5<br />
C p (mg/L)<br />
Figure 3. Variation of the static interfacial tension at the interface with air,<br />
for protein adsorption from the aqueous phase, against the protein<br />
concentration at 20 o C temperature.<br />
Figure 4. Schematic representation of protein adsorption at interface<br />
(regime III)
KINETIC AND THERMODYNAMIC CHARACTERIZATION OF PROTEIN ADSORPTION AT FLUID INTERFACES<br />
mo<strong>de</strong>l for lipids. For the beginning we studied the adsorption of protein and<br />
separately the adsorption of stearic acid at the same interface oil/water for<br />
two distinct temperatures, 20 and 36 O C.<br />
The dynamics of protein adsorption at benzene/water (0.5 M NaCl)<br />
interface is examined over the time scales ranging from seconds to several<br />
hours by measuring the interfacial tension at the benzene/aqueous<br />
solutions interface for the chosen constant temperature. The adsorption of<br />
protein at the benzene/aqueous solution interface leads to an interfacial<br />
tension versus time pro<strong>file</strong> that presents common characteristics with the<br />
adsorption of bovine serum album at the benzene/water interface [40, 41].<br />
For oil/water interface the induction period for protein adsorption was not<br />
<strong>de</strong>tected. The adsorption equilibrium of protein appears to be established in<br />
about 60 min at the oil/water interface. The equilibrium data for pure protein<br />
adsorbed at the benzene/aqueous interface are given in Tables 2 and 3 at<br />
20 and 36 O C, respectively.<br />
The protein diffusion and protein interfacial affinity <strong>de</strong>termine the<br />
duration of early stages of adsorption period at fluid interfaces. Continued<br />
protein rearrangement leads to the final interfacial tension reduction<br />
resulting in various interfacial contacts per protein molecule.<br />
In<strong>de</strong>pen<strong>de</strong>ntly, the adsorption of stearic acid at the benzene/aqueous<br />
(0.5 M NaCl, pH 5.5) solution interface was investigated. The adsorption<br />
behavior of stearic acid is similar with its adsorption at the interface benzene/<br />
water (pH 2) interface. At pH 2, stearic acid (pKa = 5.63 [42] is neutral and<br />
at pH 5.5 it is almost 50% ionized. The static adsorption is reached at about<br />
100 min <strong>de</strong>pending on the stearic acid bulk concentration in substantial<br />
agreement with data published by us earlier [39]. The equilibrium data for<br />
the adsorption of stearic acid at benzene/water interface are given in Table 2<br />
(for 20 o C) and in Table 3 (for 36 o C).<br />
For co-adsorption of stearic acid and protein at benzene/water<br />
interface it was observed that the adsorption equilibrium is apparently reached<br />
in about 60 min. Therefore, for mixed layers of protein and stearic acid, the<br />
equilibrium (static) interfacial intension is recor<strong>de</strong>d at an adsorption time of<br />
60 min. It is to be mentioned that for very long adsorption times (several<br />
hours) some aging effects are noticed.<br />
For comparison, the co-adsorption of protein and stearic acid at the<br />
oil/water interface was recor<strong>de</strong>d by interfacial tension measurements executed<br />
at 60 min after the oil/water interface was formed, for both temperatures<br />
investigated, 20 and 36 o C. The results are also given in Tables 2 and 3.<br />
To avoid the superposition of a strongly time <strong>de</strong>pen<strong>de</strong>nt effect, due to<br />
the protein adsorption over the one generated by the adsorption of stearic<br />
acid from the benzene phase, we have chosen the 2.9 mg/L concentration<br />
of protein in the aqueous solutions. The concentration of stearic acid was<br />
varied in the range of 0.025 to 0.4 M stearic acid in benzene.<br />
149
M. TOMOAIA-COTISEL, O. HOROVITZ, O. BOROSTEAN, L.-D. BOBOS, G. TOMOAIA, A. MOCANU, T. YUPSANIS<br />
150<br />
Table 2.<br />
Interfacial tensions () and interfacial pressures () for the simultaneous<br />
adsorption of stearic acid (SA) and protein (P) at the benzene/aqueous<br />
solution interface, at a constant temperature of 20 o C.<br />
(mN/m)<br />
Cp = 2.9<br />
(mN/m)<br />
CSA (mol/L) Cp = 0 mg/L SA P<br />
1 2 3 4 5<br />
0.000 34.70 24.90 0.00 9.80<br />
0.030 29.25 24.40 5.45 4.85<br />
0.039 28.43 23.64 6.27 4.79<br />
0.050 27.24 22.58 7.46 4.66<br />
0.064 25.25 21.82 9.45 3.43<br />
0.082 23.82 21.23 10.88 2.59<br />
0.105 22.13 20.14 12.57 1.99<br />
0.136 20.49 19.32 14.21 1.17<br />
0.174 19.15 18.20 15.55 0.95<br />
0.223 17.57 17.15 17.13 0.42<br />
0.287 16.60 16.28 18.10 0.32<br />
0.368 15.81 15.51 18.89 0.30<br />
Table 3.<br />
Interfacial tensions ( ) and interfacial pressures () for the simultaneous<br />
adsorption of stearic acid (SA) and protein (P) at the benzene/aqueous<br />
solution interface, at constant temperature of 36 o C.<br />
(mN/m) (mN/m)<br />
CSA (mol/L) Cp = 0 Cp = 2.9 mg/L SA P<br />
1 2 3 4 5<br />
0.000 35.10 25.17 0.00 9.93<br />
0.025 31.22 22.31 3.88 8.91<br />
0.034 30.05 21.91 5.05 8.14<br />
0.040 29.80 21.63 5.30 8.17<br />
0.050 29.47 21.47 5.63 8.00<br />
0.065 28.78 20.93 6.32 7.85<br />
0.083 28.20 20.44 6.90 7.76<br />
0.109 26.88 19.58 8.22 7.30<br />
0.135 25.84 18.88 9.26 6.96<br />
0.176 24.74 18.59 10.36 6.15<br />
0.225 23.92 17.78 11.18 6.14<br />
0.287 22.60 17.14 12.50 5.46<br />
0.368 20.98 16.13 14.12 4.85
KINETIC AND THERMODYNAMIC CHARACTERIZATION OF PROTEIN ADSORPTION AT FLUID INTERFACES<br />
σ, mN/m<br />
30<br />
28<br />
26<br />
24<br />
22<br />
20<br />
18<br />
16<br />
14<br />
protein 2.9 mg/L<br />
without protein<br />
-3,5 -3,0 -2,5 -2,0 -1,5 -1,0<br />
ln cSA Figure 5. Equilibrium interfacial tension, σ, against the logarithm of stearic acid<br />
molar concentration, cSA, in the organic phase, for the interface aqueous 0.5 M<br />
NaCl solution / benzene, in absence and presence of protein in<br />
the aqueous phase at 20 o C<br />
σ, mN/m<br />
32<br />
30<br />
28<br />
26<br />
24<br />
22<br />
20<br />
18<br />
16<br />
protein 2.9 mg/L<br />
without protein<br />
-4,0 -3,5 -3,0 -2,5<br />
ln cSA -2,0 -1,5 -1,0<br />
Figure 6. Equilibrium interfacial tension, σ, against the logarithm of stearic acid<br />
molar concentration, cSA, in the organic phase, for the interface aqueous 0.5 M<br />
NaCl solution / benzene, in absence and presence of protein in<br />
the aqueous phase at 36 o C.<br />
151
M. TOMOAIA-COTISEL, O. HOROVITZ, O. BOROSTEAN, L.-D. BOBOS, G. TOMOAIA, A. MOCANU, T. YUPSANIS<br />
In Figs 5 and 6 the static interfacial tension isotherms versus stearic<br />
acid concentration (CSA) are given for the situation without and with protein<br />
(2.9 mg/L concentration) in aqueous solutions. From the adsorption<br />
isotherm, it is to be noted that the stearic acid is surface active at the<br />
benzene/water interfaces.<br />
The processing of the isotherms according to Gibbs equation:<br />
∂σ<br />
<br />
<br />
<br />
<br />
= −RT<br />
Γ<br />
∂ ln cSA T<br />
allows for the <strong>de</strong>termination of the SA surface concentration ( Γ ) for a<br />
certain interfacial tension and the corresponding molecular area: A =<br />
ΓN<br />
A<br />
1 ,<br />
NA being the Avogadro’s constant; R and T having their usual meanings.<br />
For the saturation of the interface with adsorbed SA, the limiting molecular<br />
areas are <strong>de</strong>termined for stearic acid adsorbed at the oil/water interface<br />
with or without protein at two temperatures, 20 and 36 o C, see Table 4.<br />
152<br />
Table 4.<br />
Limiting molecular areas, A0, and the correlation coefficients, r, for adsorbed<br />
stearic acid film at the benzene/water interfaces, in the absence<br />
and the presence of protein, for two temperatures.<br />
20 o C 36 o Adsorbed layers<br />
C<br />
A0,<br />
Å 2 /molecule<br />
Standard<br />
error<br />
A0,<br />
Å 2 /molecule<br />
Standard error<br />
SA 79.6 ±4.9 87.0 ±4.7<br />
SA and protein 111.5 ±1.8 124 ±7<br />
The comparison of the limiting molecular areas for stearic acid in<br />
the absence of protein leads us to the conclusion that the SA film at the<br />
benzene/water interface is more expan<strong>de</strong>d than the pure SA film at the<br />
air/water interface, Ao = 20 Å 2 [39]. The area increase in adsorbed SA as<br />
compared to spread film is due to the benzene molecules which penetrate<br />
between the hydrocarbon chains of the SA interfacial film, tending to<br />
reduce the attraction among the SA chains.<br />
Also, the limiting molecular areas, A0, for stearic acid in the presence<br />
of protein is much greater than the area of pure SA oriented at one and the<br />
same interface at constant temperature. The protein effect is related with<br />
the penetration of protein among the hydrocarbon chains of SA film adsorbed<br />
at the oil/water interfaces. The increase in temperature brings also an<br />
expanding effect upon SA adsorbed film at benzene/water interface.<br />
The equilibrium interfacial tensions are apparently established in<br />
about 60 min in contrast with 100 min for pure stearic acid adsorbed film at<br />
the oil/water interfaces. The more rapid attainment of the adsorption equilibrium
KINETIC AND THERMODYNAMIC CHARACTERIZATION OF PROTEIN ADSORPTION AT FLUID INTERFACES<br />
of SA at the benzene/water interface in the presence of protein is probably<br />
due to the interaction between SA and protein in the interfacial adsorbed<br />
mixed film.<br />
In or<strong>de</strong>r to get a better image of the possible interactions in the<br />
mixed SA and P film, data regarding the variation of the equilibrium interfacial<br />
tension with SA concentration in the absence (column 2) and in the presence<br />
of protein (column 3) in Tables 3 and 4, for 20 and 36 o C, respectively were<br />
compared. It is evi<strong>de</strong>nt that the presence of protein leads to an additional<br />
<strong>de</strong>crease of interfacial tension, respectively to an increase of the pressure<br />
in the adsorbed SA film for all concentrations of SA. Column 4 lists the<br />
interfacial pressures of pure SA. The last column shows the contribution of<br />
protein to the interfacial pressure of the mixed SA and P film, the contributions<br />
of SA (column 4) being assumed as constant. The contribution of protein<br />
was evaluated from the difference of the values in columns 2 and 3 for<br />
each individual concentration of SA. It is noted that the interfacial pressure<br />
due to the protein <strong>de</strong>creases with the increasing of SA concentration. In<br />
other words, the contribution of each component to the interfacial pressure<br />
of the mixed adsorbed film is not in<strong>de</strong>pen<strong>de</strong>nt. This fact also suggests the<br />
interaction between SA and protein.<br />
Similar cases are reported in the literature on mixed lipid and protein<br />
films obtained by penetration of lipid monolayers spread at the air/water<br />
interface by an injected protein in the aqueous phase un<strong>de</strong>r the lipid monolayer.<br />
The penetration of the protein in the lipid layer leads to an increase of its<br />
surface pressure at constant area, and the pressure increment was consi<strong>de</strong>red<br />
a measure of the lipid and protein interaction [43]. This situation corresponds<br />
to a sequentially adsorbed lipid and protein mixed film.<br />
In our case, in the complex process of adsorption and penetration of<br />
SA and protein at the oil/water interface, the interaction between the stearic<br />
acid and the protein is revealed by the <strong>de</strong>crease of interfacial tension,<br />
respectively the increase of the interfacial pressure at the benzene/water<br />
interfaces. The increment of interfacial pressure is attributed to the mutual<br />
penetration of the two adsorbed films. The interaction between carboxyl<br />
groups or the negatively charged carboxylate of SA molecules and the<br />
pepti<strong>de</strong> bridges of protein or with protein positively charged regions may be<br />
suggested, as well as the interaction among their hydrocarbon chains,<br />
which is not to be completely neglected even at the oil/water interface.<br />
Moreover, in our case, the simultaneously adsorbed stearic acid<br />
and protein mixed films are formed where the molecular associations can<br />
be generated at the interfaces, such as negatively charged complexes when<br />
stearate molecules (negatively charged at pH 5.5) are involved in associations<br />
and neutral complexes when stearic acid not charged is involved in the<br />
interaction within mixed adsorbed layers at oil/water interfaces, as recently<br />
emphasized for -lactoglobulin and pectin in adsorbed layers at fluid<br />
interfaces [2].<br />
153
M. TOMOAIA-COTISEL, O. HOROVITZ, O. BOROSTEAN, L.-D. BOBOS, G. TOMOAIA, A. MOCANU, T. YUPSANIS<br />
CONCLUSIONS<br />
Our previous studies on the adsorption of the globular storage protein,<br />
extracted and purified from aleurone cells of barley, at the solid interface of<br />
gold nanoparticles is completed by the investigation of the adsorption of the<br />
same protein at gas/liquid and liquid/liquid interfaces. The evolution in time<br />
of the protein adsorption at the air/aqueous solution interface evi<strong>de</strong>nced a<br />
kinetic behavior compatible with the three steps mo<strong>de</strong>l, induction regime,<br />
conformational change regime and relaxation regime coupled with a possible<br />
build-up of multilayers, proposed for various proteins [24]. On the other hand,<br />
the values at thermodynamic equilibrium of interfacial tensions are situated on<br />
a typical adsorption isotherm, thus evi<strong>de</strong>ncing the surface-active character<br />
of the investigated protein. The same character is manifested at liquid –<br />
liquid interfaces, studied on the mo<strong>de</strong>l system, such as an aqueous NaCl<br />
solution with protein and stearic acid solution in benzene. Here the effect of<br />
both surface-active substances is conjugated.<br />
EXPERIMENTAL SECTION<br />
Materials<br />
The protein solution used is that of the major globular storage<br />
protein from aleurone cells of barley (Hor<strong>de</strong>um vulgare L.) extracted and<br />
purified as shown elsewhere [31]. The protein was dissolved in ultra pure<br />
water and diluted to the working concentrations. The pH of the major<br />
aleurone protein solution was about 5.6. The protein is related to 7S<br />
globulins present in other cereals and to the vicilin-type 7S globulins of<br />
legumes and cottonseed. It contains 4 subunits of about 20, 25, 40 and 50<br />
kDa molecular weights [31]. The N-terminal sequence of 16 amino acids in<br />
the protein [14] is given as follows: 1 X 2 Glu 3 Gln 4 Gly 5 Asp 6 Ser 7 Arg 8 Arg<br />
9 Pro 10 Tyr 11 Val 12 Phe 13 Gly 14 Pro 15 Arg 16 (Ser or His) 17 Phe, where X<br />
stands for the first amino acid of the N-terminal of aleurone protein which<br />
was not i<strong>de</strong>ntified. The secondary structure of this protein was recently<br />
investigated by advanced spectroscopy [37, 38]. Deionized water of ultra<br />
high purity was used in all experiments and it was obtained from an<br />
Elgastat water purification system. Benzene, stearic acid and NaCl were of<br />
high purity, purchased from Merck and used without further purification.<br />
Methods<br />
The adsorption of the protein at the air/water interface was investigated<br />
by measurements of the dynamic interfacial tension of aqueous solutions<br />
with variable protein concentrations, in the range from 0.5 to 5 mg/L, by means<br />
of the ring method (Le Compte du Nouy) and the plate method (Wilhelmy<br />
method), <strong>de</strong>scribed elsewhere [16-18, 39-41]. In or<strong>de</strong>r to maintain constant<br />
154
KINETIC AND THERMODYNAMIC CHARACTERIZATION OF PROTEIN ADSORPTION AT FLUID INTERFACES<br />
the ionic strength of the aqueous phase and full solubility of globular protein,<br />
this aqueous phase was a 0.5 M NaCl solution [31]. The temperature was<br />
maintained constant at about 20 o C.<br />
The influence of protein adsorption on interfacial tension at a water/<br />
oil interface was studied using the following phases:<br />
• benzene solutions of stearic acid (SA), having different SA<br />
concentrations in the range from 0.4 to 0.025 M<br />
• an aqueous 0.5 M NaCl solution without protein and separately with<br />
a constant protein content of 2.9 mg/L.<br />
The measurements of interfacial tension were executed by the ring<br />
method (Le Compte du Nouy) and the plate method (Wilhelmy) at two<br />
different temperatures (20 o C and 36 o C) for the oil/water interfacial systems.<br />
ACKNOWLEDGEMENTS<br />
This research was financially supported by Romanian National Research<br />
Program PNCDI2, grant 41050.<br />
REFERENCES<br />
1. R. A. Ganzevles, R. Fokkink, T. van Vliet, M. A. Cohen Stuart, H. H. J. <strong>de</strong><br />
Jongh, Journal of Colloid and Interface Science, 2008, 317, 137.<br />
2. E. V. Kudryashova, H. H. J. <strong>de</strong> Jongh, Journal of Colloid and Interface Science,<br />
2008, 318, 430.<br />
3. J. Minones Con<strong>de</strong>, J. M. Rodriguez Patino, Journal of Food Engineering, 2007,<br />
78, 1001.<br />
4. Y. Zhang, Z. An, G. Cui, J. Li, Colloids and Surfaces A, Physicochemical and<br />
Engineering Aspects, 2003, 223, 11.<br />
5. F. Monroy, F. Ortega, R. G. Rubio and M. G. Velar<strong>de</strong>, Advances in Colloid and<br />
Interface Science, 2007, 134-135, 175.<br />
6. J. Gualbert, P. Shahgaldian, A. W. Coleman, International Journal of Pharmaceutics,<br />
2003, 257, 69-73.<br />
7. T. Xu, R. Fu, L. Yan, Journal of Colloid and Interface Science, 2003, 262, 342.<br />
8. S. V. Dorozhkin, E. I. Dorozhkina, Colloids and Surfaces A, Physicochemical<br />
and Engineering Aspects, 2003, 215, 191.<br />
9. A. N. Lazar, P. Shahgaldian, A. W. Coleman, Journal of Supramolecular<br />
Chemistry, 2001, 1, 193.<br />
10. Y. Wang, X. Yin, M. Shi, W. Li, L. Zhang, J. Kong, Talanta, 2006, 69, 1240.<br />
11. W. Lu, Y. Zhang, Y. -Z. Tan, K.-L. Hu, X.-G. Jiang, S.-K. Fu, Journal of Controlled<br />
Release, 2005, 107, 428.<br />
155
M. TOMOAIA-COTISEL, O. HOROVITZ, O. BOROSTEAN, L.-D. BOBOS, G. TOMOAIA, A. MOCANU, T. YUPSANIS<br />
12. T. Maruyama, S. Katoh, M. Nakajima, H. Nabetani, T. P. Abbott, A. Shono, K.<br />
Satoh, Journal of Membrane Science, 2001, 192, 201.<br />
13. S. Salgin, S. Takac, T. H. Ozdamar, Journal of Membrane Science, 2006, 278,<br />
251.<br />
14. J. Tian, J. Liu, X. Tian, Z. Hu and X. Chen, Journal of Molecular Structure, 2004,<br />
691, 197.<br />
15. F. Wang, Z. Yang, Y. Zhou, S. Weng, L. Zhang, J. Wu, Journal of Molecular<br />
Structure, 2006, 794, 1.<br />
16. P. Joos, A. Tomoaia-Cotisel, A. J. Sellers, M. Tomoaia-Cotisel, Colloids and<br />
Surfaces B: Biointerfaces, 2004, 37, 83.<br />
17. M. Tomoaia-Cotisel, P. Joos, Studia Universitatis Babes-Bolyai, Chemia, 2004,<br />
49 (1), 35.<br />
18. M. Tomoaia-Cotisel, D. A. Ca<strong>de</strong>nhead, Langmuir, 1991, 7, 964.<br />
19. M. Tomoaia-Cotisel, J. Zsakó, E. Chifu, D. A. Ca<strong>de</strong>nhead, Langmuir, 1990, 6<br />
(1), 191.<br />
20. M. Tomoaia-Cotisel, Progress in Colloid and Polymer Scence., 1990, 83, 155.<br />
21. E. Dickinson, B.S. Murray, G. Stainsby, Journal of the Chemical Society, Faraday<br />
Transactions, 1, 1988, 84, 871.<br />
22. A. -P. Wei, J. N. Herron, J.D. Andra<strong>de</strong>, in “From Clone to Clinic” (D.J.A. Crommelin,<br />
H. Schellekens, Editors.), Kluwe Aca<strong>de</strong>mic Publishers, Dordrecht, 1990, pp. 305.<br />
23. W. Van <strong>de</strong>r Vegt, H.C. Van <strong>de</strong>r Mei, H.J.Busscher, Journal of Colloid and<br />
Interface Science, 1993, 156, 129.<br />
24 C. J. Beverung, C.J.Radke, H.W.Blanch, Biophysical Chemistry, 1999, 81, 59.<br />
25. G. Lu, H.Chen, J.Li, Colloids and Surfaces A, Physicochemical and Engineering<br />
Aspects, 2003, 215, 25.<br />
26. S. M. Mel’nikov, Colloids and Surfaces B: Biointerfaces, 2003, 27, 265.<br />
27. C. J. Beverung, C. J. Radke, H. W. Blanch, Biophysical Chemistry, 1998, 70, 121.<br />
28. K. B. Song, S. Damodaran, Langmuir, 1991, 7, 2737.<br />
29. M. G. Ivanova, R. Verger, A. G. Bois, I. Panaiotov, Colloids and Surfaces, 1991,<br />
54, 279.<br />
30. V. Ducel, J. Richard, Y. Popineau, F. Boury, Biomacromolecules, 2004, 5, 2088.<br />
31. T. Yupsanis, S. R. Burgess, P. J. Jackson. P. R. Shewry, Journal of Experimental<br />
Botany., 1990, 41, 385.<br />
32. M. Tomoaia-Cotisel, in “Convergence of Micro-Nano-Biotechnologies, Series in<br />
Micro and Nanoengineering” Vol. 9 (Editors: M. Zaharescu, E. Burzo, L. Dumitru,<br />
I. Kleps, D. Dascalu), Romanian Aca<strong>de</strong>my Press, Bucharest, 2006, pp. 147-161.<br />
33. M. Tomoaia-Cotisel, A. Tomoaia-Cotisel, T. Yupsanis, Gh. Tomoaia, I. Balea,<br />
A. Mocanu, Cs. Racz, Revue Roumaine <strong>de</strong> <strong>Chimie</strong>, 2006, 51, 1181.<br />
34. O. Horovitz, A. Mocanu, Gh. Tomoaia, L. Olenic, Gg. Mihilescu, O. Borotean,<br />
A. Popoviciu, C. Crciun, T. Yupsanis, M.Tomoaia-Cotiel, In: "Convergence of<br />
micro-nano-biotechnologies, Series in Micro and Nanoengineering", Vol.9, Ed.<br />
Aca<strong>de</strong>miei, Bucureti, 2006, pp. 133-147.<br />
156
KINETIC AND THERMODYNAMIC CHARACTERIZATION OF PROTEIN ADSORPTION AT FLUID INTERFACES<br />
35. O. Horovitz, Gh. Tomoaia, A. Mocanu, T. Yupsanis, Tomoaia-Cotisel, Gold<br />
Bulletin, 2007, 40, 213.<br />
36. O. Horovitz, Gh. Tomoaia, A. Mocanu, T. Yupsanis, Tomoaia-Cotisel, Gold<br />
Bulletin, 2007, 40, 295.<br />
37. I. Bratu, M. Tomoaia–Cotisel, G. Damian, A. Mocanu, Journal of Optoelectronics<br />
and Advanced Materials, 2007, 9, 672.<br />
38. M. Tomoaia-Cotiel, A. Mocanu, N. Leopold, M. Vasilescu, V. Chi, O. Cozar,<br />
Journal of Optoelectronics and Advanced Materials, 2007, 9, 637.<br />
39. E. Chifu, M. Sljan, I. Demeter-Vodnár, M. Tomoaia-Cotiel, Revue Roumaine<br />
<strong>de</strong> <strong>Chimie</strong>, 1987, 32 (7), 683.<br />
40. M. Tomoaia-Cotisel, E. Chifu, in "IUPAC Macro83, Section IV: Structure and<br />
Properties", Bucharest, 1983, pp. 636-639.<br />
41. E. Chifu, M. Tomoaia-Cotisel, Studia Universitatis Babes-Bolyai, Chemia, 1987,<br />
26 (2), 3.<br />
42. M. Tomoaia-Cotisel, D.A. Ca<strong>de</strong>nhead, Langmuir, 1991, 7, 964.<br />
43. G. Colacicco, Journal of Colloid and Interface Science, 1969, 29, 345.<br />
157