full papers - Facultatea de Chimie şi Inginerie Chimică
full papers - Facultatea de Chimie şi Inginerie Chimică
full papers - Facultatea de Chimie şi Inginerie Chimică

Create successful ePaper yourself
Turn your PDF publications into a flip-book with our unique Google optimized e-Paper software.
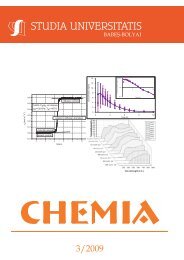
CHEMIA<br />
1/2011
ANUL LVI 2011<br />
S T U D I A<br />
UNIVERSITATIS BABEŞ–BOLYAI<br />
CHEMIA<br />
1<br />
Volume <strong>de</strong>dicated to Professor SIMION GOCAN PhD.<br />
Desktop Editing Office: 51 ST B.P. Has<strong>de</strong>u, Cluj-Napoca, Romania, Phone + 40 264-40.53.52<br />
CUPRINS – CONTENT – SOMMAIRE – INHALT<br />
Biography SIMION GOCAN .................................................................................5<br />
TIBERIU FRENTIU, MICHAELA PONTA, ALIN IRONIM MIHALTAN,<br />
EUGEN DARVASI, MARIA FRENTIU, E. CORDOS, Spectroscopic<br />
Study of Atmospheric Pressure Argon/Methane Capacitively Coupled<br />
Plasma.................................................................................................... 7<br />
ADRIANA GOG, MIRCEA CHINTOANU, MARIUS ROMAN, EMIL LUCA,<br />
FLORIN-DAN IRIMIE, Production and Characterization of Biodiesel<br />
from Rapeseed Oils .............................................................................. 17<br />
MARIN ŞENILĂ, ERIKA LEVEI, LĂCRIMIOARA ŞENILĂ, OANA CADAR,<br />
GABRIELA OPREA, CECILIA ROMAN, Comparative Study of Mercury<br />
Determination in Soil and Vegetable by Methods Based on Thermal<br />
Decomposition-AAS and Wet Digestion CV-AFS ................................. 27<br />
IOAN BÂTIU, Analysis in Terms of the Wilson, NRTL (Non Randon Two<br />
Liquids) and Uniquac Mo<strong>de</strong>ls of the Experimental Vapor - Liquid<br />
Equilibrium Data in Binary and Ternary Systems Containing {(1r,4s)-<br />
(+)-Fenchone, Methyl Chavicol and Trans-Anethole} ........................... 35
DORINA CASONI, COSTEL SÂRBU, Comparative Study of Different Oils<br />
and Fats Impregnated Thin-Layer Chromatographic Layers for the<br />
Amino Acids Lipophilicity Estimation..................................................... 45<br />
EUGEN DARVASI, CSONGOR MÁTYÁS, Simple and Cost-Effective<br />
Multispectral Imaging System for Reflectance Measurement Using Led<br />
Light Sources and Integrating Sphere .................................................. 63<br />
GOG ADRIANA, MIRCEA CHINTOANU, MARIUS ROMAN, EMIL LUCA,<br />
PAIZS CSABA, FLORIN-DAN IRIMIE, Biodiesel Production from<br />
Sunflower Oil with Candida Antarctica Lipase B................................... 71<br />
ANDRADA MĂICĂNEANU, CERASELLA INDOLEAN, SILVIA BURCĂ,<br />
MARIA STANCA, HOREA BEDELEAN, MAJDIK CORNELIA, Organics<br />
Removal from Aqueous Solutions Using Suspen<strong>de</strong>d and Immobilized<br />
Romanian Bentonites............................................................................ 81<br />
DIANA BLEJAN, DANIEL MARCONI, AUREL POP, LIANA MARIA<br />
MUREŞAN, The Influence of TiO2 Nanoparticles on Morpho-Structural<br />
and Anti-Corrosion Properties of Electro<strong>de</strong>posited Zn-Ni Coatings...... 95<br />
RAMONA FLAVIA CÂMPEAN, NELI KINGA OLAH, CLAUDIA TOMA,<br />
RISTOIU DUMITRU, GEORGE ARGHIR, In Depth Variation of Water<br />
Properties for St. Ana Lake – Romania Related to Sediments in<br />
Suspension ......................................................................................... 107<br />
MIRCEA DAN, NICOLAE VASZILCSIN, ANDREA KELLENBERGER,<br />
NARCIS DUTEANU, Electrochemical Behaviour of YBaCo4O7 in<br />
Neutral Aqueous Solution ................................................................... 119<br />
CAMELIA POPA, PETRU BULAI, MATEI MACOVEANU, Equilibrium<br />
and Kinetic Studies of Iron (II) Removal from 34% Calcium Chlori<strong>de</strong><br />
Solutions by Chelating Resin Purolite S930 ....................................... 129<br />
ADRIAN PATRUT, KARL F. VON REDEN, VASILE SAVU, DANIEL A.<br />
LOWY, RALUCA MITEA, IOANA BARBUL, AMS Radiocarbon Dating<br />
of the Very Large Pedunculate Oak of Cajvana.................................. 145<br />
SORANA D. BOBLOACĂ, LORENTZ JÄNTSCHI, RADU E. SESTRAŞ,<br />
Depen<strong>de</strong>nce between Determination Coefficient and Number of<br />
Regressors: a Case Study on Retention Times of Mycotoxins........... 157<br />
LADISLAU KÉKEDY-NAGY, GYÖNGYI PETŐ, Evaluation of a Rural<br />
Settlement Well Waters Based on the Quantification of Some Physical<br />
and Chemical Parameters. A Case Study .......................................... 167<br />
RĂZVAN ŞTEFAN, IOAN BRATU, GHEORGHE BORODI, NICOLAE<br />
LEOPOLD, VIORICA SIMON, Structural Investigations of Ag2O-B2O3-<br />
CaO-P2O5 Glass and Glass-Ceramic System..................................... 177
RĂZVAN ŞTEFAN, EMIL VINŢELER, ALEXANDRU MARCU, GEORGETA<br />
TARALUNGA, SILVANA POPESCU, IOAN BRATU, Structural<br />
Investigation of xFe2O3·(70-X)B2O3 ·15ZnO·15CaO Glasses by Infrared<br />
Spectroscopy and DFT Calculations................................................... 189<br />
CAMELIA BERGHIAN GROŞAN, VALER ALMĂŞAN, Structure and<br />
Vibrational Spectrum of L-Leucine: a DFT-PCM Investigation ........... 199<br />
OSSI HOROVITZ, NICOLAE CIOICA, NICOLAE JUMATE, MARIA<br />
POJAR-FENEŞAN, ANA BALEA, VICTOR LITEANU, AURORA<br />
MOCANU, MARIA TOMOAIA-COTIŞEL, SEM Characterization of<br />
Starch Granules.................................................................................. 211<br />
SHENGLI MA, SHERRY SHEN, ZHENGXU HAN, YIBO XU, HEEWON<br />
LEE, DHILEEPKUMAR KRISHNAMURTHY, CHRIS SENANAYAKE,<br />
NELU GRINBERG, Determination of the Absolute Configuration of<br />
3-Amino-3-(Tetrahydrofuran) Carboxylic Acid by Vibrational Circular<br />
Dichroism and DFT Calculation .......................................................... 221<br />
PAUL ŞERBAN AGACHI, GOMBOS SÁNDOR, Investigation of Initial<br />
Peroxi<strong>de</strong> In<strong>de</strong>x Value Influence on AFB1, AFB2, AFG2 and T-2<br />
Mycotoxins Decomposition in Sunflower Oil ....................................... 229<br />
CLAUDIA CIMPOIU, ANDRADA MĂICĂNEANU, ANAMARIA HOSU,<br />
HOREA BEDELEAN, Preliminary Investigations on Clinoptilolite Usage<br />
as Selective Adsorbent for Wastewater Analysis................................ 243<br />
GOMBOS SÁNDOR, PAUL ŞERBAN AGACHI, The Effect of Bentonite<br />
on AFB1, AFB2, AFG2 and T-2 Mycotoxins Decomposition in Sunflower<br />
Oil un<strong>de</strong>r the Irradiation of Ultraviolet Light......................................... 249<br />
CORNELIA MAJDIK, GABRIEL KATONA, MIRCEA CHINTOANU, MARIUS<br />
ROMAN, EMIL LUCA, SIMONA MARIANA SIMON, TIBERIU RUSU,<br />
CECILIA ROMAN, Immobilized Polyphenoloxidase for Wastewaters<br />
Tratement............................................................................................ 261<br />
CORNELIA MAJDIK, GABRIEL KATONA, MIRCEA CHINTOANU, MARIUS<br />
ROMAN, EMIL LUCA, SIMONA MARIANA SIMON, TIBERIU RUSU,<br />
CECILIA ROMAN, Phenol Removal from Wastewaters Using Polyphenoloxidase<br />
from Potato ................................................................. 267<br />
CSABA VÁRHELYI JR., GYÖRGY POKOL, VLADISZLAV IZVEKOV,<br />
ÁGNES GÖMÖRY, CSABA VÁRHELYI, LÁSZLÓ KOCSIS, Asymmetric<br />
CO(III)-Complexes of Ethyl-Methyl-Dioxime ....................................... 275<br />
LÉNÁRD-ISTVÁN CSEPEI, CSABA BOLLA, The Effect of Salicylic Acid<br />
on the Briggs-Rauscher Oscillating Reaction ..................................... 285
Studia Universitatis Babes-Bolyai Chemia has been selected for coverage<br />
in Thomson Reuters products and custom information services. Beginning<br />
with V. 53 (1) 2008, this publication is in<strong>de</strong>xed and abstracted in the following:<br />
• Science Citation In<strong>de</strong>x Expan<strong>de</strong>d (also known as SciSearch®)<br />
• Chemistry Citation In<strong>de</strong>x®<br />
• Journal Citation Reports/Science Edition
STUDIA UBB CHEMIA, LVI, 1, 2011<br />
Prof. Simion Gocan PhD.<br />
Simion Gocan graduated from the Faculty of Chemistry, Research and Analysis<br />
Department of “Victor Babes” University, Cluj-Napoca in 1954. In 1969 he obtained his<br />
PhD un<strong>de</strong>r the supervision of Prof. Dr. Candin Liteanu. His teaching activity started at<br />
the Physical Department of the Polytechnic Institute and continued at the Pedagogical<br />
Institute as an assistant professor in Cluj-Napoca. In 1972 he joined the Faculty of<br />
Chemistry and Chemical Engineering, “Babes-Bolyai” University and from 1990 he was<br />
a <strong>full</strong> professor at the Analytical Chemistry Department. He was the head of the<br />
Department from 1990 to 1996, when he retired. His activity continued as a consulting<br />
professor and in 2009 he was granted the title of honorific consulting professor.<br />
Professor Simion Gocan is among the first Romanian researchers who implemented<br />
and <strong>de</strong>veloped the analytical separation techniques based on chromatography. He<br />
introduced the new subject of “Separation Methods” in the faculty curriculum.<br />
Un<strong>de</strong>rstanding the importance of mo<strong>de</strong>rn data processing and interpretation he<br />
introduced the “Chemometrics” course, as a new course. In the position of PhD<br />
coordinator, he supervised ten doctoral theses in the field of separation methods, such<br />
as optimizing the chromatographic separation process, lipophilicity <strong>de</strong>terminations,<br />
sample preparation for chromatographic analysis, immunoassay analysis, bioactive<br />
compound <strong>de</strong>termination from different medicinal plants.<br />
Professor Gocan is a member of many scientific societies of chemistry, analytical<br />
chemistry and chromatography, in the country and abroad. His aca<strong>de</strong>mic activity is<br />
reflected in seven textbooks, collection of problems, practical work gui<strong>de</strong>s and courses<br />
for stu<strong>de</strong>nts or postgraduate training programs.
6<br />
BIOGRAPHY PROFESSOR SIMION GOCAN PhD.<br />
Professor Gocan has a rich publishing activity. He is co-author of ten scientific books<br />
such as “Fundamentals of Column Adsorption Chromatography” (1971), “Fundamentals<br />
of Ionic Exchange Chromatography on Paper and Thin Layers” (1972), “Liquid<br />
Chromatography”, Ed. Stiinţifica (printing house), Bucharest, 1974. The last one was<br />
consi<strong>de</strong>red at the time a fundamental book for the training of researchers and teaching<br />
staff. Other reference books are “Gradient Liquid Chromatography”, Ed. Tehnică<br />
(printing house), Bucharest, 1976, “Analytical Separation”, Ed. Dacia (printing house),<br />
Cluj-Napoca, 1981, “Analytical Immunochemistry” (1995), “Mo<strong>de</strong>rn Techniques for<br />
sample preparation” (2006).<br />
His theoretical and experimental researches as well as his pedagogic experience were<br />
fructified into a series of books focusing on high performance chromatography: Gas<br />
Chromatography (1998), Liquid Chromatography (2002) and Thin Layer Chromatography<br />
(2005). He is co-author of the book “Gradient Liquid Chromatography” in the Series in<br />
Analytical Chemistry published by Ellis Horwood, Chichester, London, 1974. Professor<br />
Gocan published several chapters in scientific books such as: Chapter 2 “Stationary<br />
Phases in Thin-Layer Chromatography”; Chapter 3 “Mobile Phases in Thin-Layer<br />
Chromatography”; Chapter 4 “Theoretical Aspects of Thin-Layer Chromatography<br />
in Mo<strong>de</strong>rn Thin-Layer Chromatography”, Marcel Dekker, N. Grinberg (Ed), New York,<br />
1990 and Chapter 28 “Organophosphates”, in Handbook of Water Analysis, L.M.L.<br />
Nollet (Ed.) Marcel Dekker, New York, 2000. He had also brought his contribution in<br />
“Encyclopedia of Chromatography”, Marcel Dekker, New York, first edition in 2001,<br />
2 nd edition. 2005 and 3 rd third edition in 2009.<br />
The professor’s entire scientific activity is reflected in 105 peer-reviewed articles<br />
published in the country and 38 in prestigious international journals, of which 8 review<br />
<strong>papers</strong>. He was invited to sustain plenary presentations at many national and<br />
international meetings and conferences.<br />
Cluj-Napoca, 24 March 2011
STUDIA UBB CHEMIA, LVI, 1, 2011<br />
SPECTROSCOPIC STUDY OF ATMOSPHERIC PRESSURE<br />
ARGON/METHANE CAPACITIVELY COUPLED PLASMA<br />
TIBERIU FRENTIU a,* , MICHAELA PONTA a , ALIN IRONIM MIHALTAN b ,<br />
EUGEN DARVASI a , MARIA FRENTIU b , E. CORDOS b<br />
ABSTRACT. The emission spectrum (200 – 1000 nm) and discharge<br />
characteristics of an atmospheric pressure Ar/CH4 capacitively coupled<br />
plasma, 275 W, 27.12 MHz, 0.7 L min -1 Ar and 0-7.5 mL min -1 CH4 as<br />
collision/reaction gas were studied. The emission spectrum of pure Ar<br />
plasma is dominated by molecular bands of OH and N2 second positive<br />
system in UV as well as Ar I (4p→4s) lines in VIS range. The addition of<br />
CH4 results in the appearance of the C2 Swan band and quenching of OH, N2<br />
and Ar emission. Quenching is the consequence of the second-kind collisions<br />
of CH4 molecule with Ar, N2 excited species and chemical reaction with OH<br />
radical, respectively. Processes were confirmed by the <strong>de</strong>crease of the<br />
excitation temperature of Ar and electron number <strong>de</strong>nsity when adding CH4<br />
in Ar plasma. The Ar/CH4 plasma is of great interest for applications in atomic<br />
spectroscopy due to the possibility to remove spectral interferences by the<br />
collision/reaction gas method and the use of low resolution microspectrometers.<br />
Keywords: capacitively coupled plasma, molecular emission, collision/reaction<br />
gas, plasma diagnosis<br />
INTRODUCTION<br />
Progress in the atomic emission spectrometry (AES) relied inter alia on<br />
new spectral sources to guarantee the analytical performances required in the<br />
multielemental <strong>de</strong>terminations of high sensitivity. The <strong>de</strong>velopment of spectral<br />
sources began with flame, continued with arc and spark, than inductively<br />
coupled plasma (ICP), while in recent years microplasmas on a chip have<br />
become an important field of innovation [1]. Currently, ICP-AES is a mature<br />
technique with excellent analytical capabilities for the rapid multielemental<br />
<strong>de</strong>termination as it benefits from the advantages of CCD technology and dualviewing.<br />
ICP-AES was standardized for the <strong>de</strong>termination of elements in<br />
water and soil [2,3]. The shortcomings of ICP-AES associated to acquisition<br />
a Babes-Bolyai University, Faculty of Chemistry and Chemical Engineering, 1, Kogălniceanu<br />
Street, RO-400084 Cluj-Napoca,Romania, ftibi@chem.ubbcluj.ro<br />
b National Institute of Development for Optoelectronics, Bucharest – Research Institute for<br />
Analytical Instrumentation, 67 Donath Street, 400293 Cluj-Napoca, Romania.
8<br />
T. FRENTIU, M. PONTA, A. I. MIHALTAN, E. DARVASI, M. FRENTIU, E. CORDOS<br />
and maintenance high cost directed research towards the <strong>de</strong>velopment of new<br />
plasma sources such as capacitively microwave plasma (CMP) [4], microwave<br />
induced plasma (MIP) [5,6], microwave plasma torch (MPT) [7] and radiofrequency<br />
capacitively coupled plasma (CCP) [8,9], less expensive and having<br />
several analytical performances similar to ICP. The advantages of the new<br />
plasma sources are related to the operation at atmospheric pressure, low<br />
consumption of Ar or He as support gas (< 1 L min -1 ) and low operation power<br />
(< 300 W). This last feature enables the miniaturization to hand-held systems<br />
for in-situ analysis [9].<br />
The results obtained in our laboratory have <strong>de</strong>monstrated that the<br />
atmospheric pressure CCP with tubular electro<strong>de</strong> operated at 275 W and<br />
below 1 L min -1 Ar is not only a relatively powerful excitation source in AES but<br />
also a promising atomization cell in atomic fluorescence spectrometry (AFS)<br />
[10-13]. The torch configuration favors the sample introduction right in the center<br />
of the plasma where most of the energy is dissipated. This ensures a better<br />
wet aerosol-plasma interaction and therefore the <strong>de</strong>crease of the matrix effects<br />
compared to MIP. Nevertheless, the emission spectrum is rich in molecular<br />
bands (OH, N2) over a wi<strong>de</strong> range (200-420 nm) because of the air diffusion in<br />
the Ar plasma. This raises problems of spectral interferences on analytes<br />
lines both in AES and AFS when using a low resolution microspectrometer.<br />
In a preliminary study it has been shown that the Ar/CH4 plasma is suitable<br />
for Pb <strong>de</strong>termination by AFS at 283.31 nm following circumventing spectral<br />
interferences by quenching of OH molecular emission [13].<br />
Plasmas used for analytical purposes are usually <strong>de</strong>veloped in Ar<br />
and He, while those for thin film growth or surface treatment in mixtures of<br />
these gases with hydrocarbons (CH4, C2H2) [14].<br />
The aim of this work was the spectral characterization of an Ar/CH4<br />
plasma <strong>de</strong>veloped in the torch with tubular electro<strong>de</strong> and single ring electro<strong>de</strong>.<br />
The study presents the features of the background emission over the spectral<br />
range 200-1000 nm and physical and chemical processes in plasma responsible<br />
for quenching of OH and nitrogen molecular emission and argon lines. Results<br />
were corroborated with the electron number <strong>de</strong>nsity (ne) and excitation<br />
temperature (Tex) of Ar lines. The study is of interest since the introducing CH4<br />
in the Ar plasma represents a simple method to remove spectral interference<br />
of the molecular emission on elements and allows the use of low-resolution<br />
microspectrometers in spectrochimical <strong>de</strong>terminations.<br />
RESULTS AND DISCUSSIONS<br />
Study of background emission spectrum of Ar/CH4 plasma<br />
The main features of the emission of plasma <strong>de</strong>veloped in pure Ar and<br />
Ar/CH4 mixture are shown in Table 1, while the background spectra in Figure 1.
SPECTROSCOPIC STUDY OF ATMOSPHERIC PRESSURE ARGON/METHANE CAPACITIVELY …<br />
Table 1. Main features of emission spectra of Ar and Ar/CH4 plasmas<br />
Species System Transition Excitation energy (eV)<br />
OH 282.90 nm (0,1)<br />
308.90 nm (0,0)<br />
N2 second positive<br />
system<br />
337.13 nm (0,0)<br />
357.69 nm (0,1)<br />
380.49 nm (0,2)<br />
C2 Swan band 438.3 nm (0,2)<br />
473.7 nm (0,1)<br />
516.5 nm (0,0)<br />
563.6 nm (1,0)<br />
619.1 nm (2,0)<br />
685.0 nm (3,0)<br />
A 2 Σ + → X 2 Π 4.05<br />
C 3 Πu →B 3 Σg<br />
D 3 Πg→ A 3 Πu<br />
11.05<br />
2.40<br />
Ar I 690-950 nm 4p→4s 12.90-13.50<br />
The emission spectrum of the pure Ar plasma consists of OH bands,<br />
N2 second positive system (SPS) and Ar I lines (690-950 nm) corresponding<br />
to 4p→4s transitions (Eex up to 13.5 eV). Argon I lines related to 5p→4s<br />
transitions (415-430 nm) (Eex above 14 eV) are much less intense, indicating<br />
low electron temperature values and a lower excitation capability. Results<br />
were similar to those reported by Yanguas-Gil et al. [14], who stated that<br />
the 5p→4s Ar I transitions were almost negligible in an Ar/CH4 microplasma<br />
jet. Other emissions are those of atomic nitrogen (402.456 nm) and atomic<br />
oxygen (477.291 nm and 477.375 nm) with excitation energies similar to Ar I<br />
4p→4s lines.<br />
The OH radicals <strong>de</strong>velop from H2O molecules that dissociate following<br />
collisions with oxygen atoms resulted from O2 traces diffused into plasma:<br />
O + H 2 O → OH + OH<br />
(1)<br />
The molecular emission of OH radicals is the result of their excitation<br />
by collisions with electrons [13].<br />
The emission of the N2 SPS is principally due to second-kind collisions<br />
with metastable argon atoms [15-17]. Argon has 2 metastable energy levels<br />
for the 4s states ( 2 P 0 3/2 -11.55 eV; 2 P 0 1/2 – 11.72 eV). The C 3 Πu state of N2 is<br />
similar in energy to Ar 4s metastable levels and therefore an energy transfer is<br />
possible [18]. The relatively strong band of N2 SPS C 3 Πu →B 3 Σg observed<br />
in our Ar plasma is the direct result of this energy transfer between a metastable<br />
Ar atom and a ground state N2 molecule.<br />
* *<br />
N 2 + Ar → N 2 + Ar<br />
(2)<br />
9
10<br />
T. FRENTIU, M. PONTA, A. I. MIHALTAN, E. DARVASI, M. FRENTIU, E. CORDOS<br />
Figure 1. Background emission spectra of Ar and Ar/CH4 plasmas.<br />
Experimental conditions: 275 W; 70 mm observation height;<br />
0.7 L min -1 Ar; CH4 flow rate (mL min -1 ): (a) 0; (b) 2.5; (c) 5; (d) 7.5.
SPECTROSCOPIC STUDY OF ATMOSPHERIC PRESSURE ARGON/METHANE CAPACITIVELY …<br />
The emission spectra in Fig. 1 shows that the CH4 content in the Ar<br />
plasma controls the emission intensity of OH, N2 SPS and Ar I. The quenching<br />
of OH emission is the result of its photochemical reaction with CH4 due to<br />
the radical affinity toward a hydrogen atom.<br />
+ CH → CH + H O<br />
(3)<br />
OH 4<br />
3 2<br />
The mechanism of this reaction is discussed in [19-22].<br />
The quenching of the N2 SPS is the result of the second-kind collision<br />
with CH4 molecule and <strong>de</strong>crease of the population of Ar metastable atoms in<br />
the Ar/CH4 plasma. Following this collision the N2 molecule from C 3 Πu goes to<br />
the ground state A 3 Πu that remains unchanged in the presence of CH4 [23]:<br />
*<br />
*<br />
N 2 + CH 4 → N 2 + CH 4 → N 2 + CH 3 + H (4)<br />
The quenching of the Ar I emission in the visible spectral range is<br />
attributed to an energy transfer from Ar I excited state to the CH4 molecule,<br />
which is dissociated according to the process:<br />
*<br />
*<br />
Ar + nCH 4 → Ar + nCH 4 → Ar + CH + CH 2 + CH 3 + H (5)<br />
This process is in agreement with a previous report in the literature<br />
[24]. For an addition of 7.5 mL min -1 CH4 to 0.7 L min -1 Ar it occurred a complete<br />
quenching of OH and nitrogen molecular emission in UV and an almost<br />
complete one of Ar I 4p→4s in the visible range.<br />
Interestingly, there is no evi<strong>de</strong>nce of the CN molecular emission<br />
(B 2 Σ + → X 2 Σ + ; Eex = 3.19 eV; 359.04 nm (0,1) and 388.34 nm (0,0)) in the<br />
spectrum of Ar/CH4 plasma, which <strong>de</strong>monstrates that the chemical reaction<br />
between N2 and methane is insignificant in the quenching of nitrogen molecular<br />
emission:<br />
*<br />
N 2 + CH 3 → N + HCN + H 2<br />
(6)<br />
The lack of the CN emission was reported in other atmospheric<br />
pressure Ar/CH4 microplasmas [14].<br />
Another feature of the Ar/CH4 plasma spectrum is the absence of the<br />
molecular emission corresponding to CH (CH 314.3 nm system C 2 Σ + →X 2 Π; CH<br />
390 nm system B 2 Σ + →X 2 Π; CH 430 nm system A 2 D→X 2 Π) and CH2 (360-<br />
390 nm) as well as the presence of the intense C2 Swan band (D 3 Πg→ A 3 Πu;<br />
409-690 nm). Our finding is in agreement with that of Yanguas-Jil et al. [14]<br />
who reported the <strong>de</strong>crease of the CH/C2 emissions ratio in the Ar/CH4 plasma<br />
when increasing the CH4 addition.<br />
The approach of quenching the molecular emission by CH4 addition in<br />
Ar plasma is superior to that based on oxygen-sheated plasma studied by<br />
Jin et al. [7] in Ar MPT. Whereas the method using CH4 as reaction/collision<br />
11
12<br />
T. FRENTIU, M. PONTA, A. I. MIHALTAN, E. DARVASI, M. FRENTIU, E. CORDOS<br />
gas ensures quenching of both OH and N2 SPS molecular emission, the<br />
approach using oxygen accomplishes only the removal of nitrogen emission<br />
signal, while that of OH increases.<br />
Discharge parameters<br />
Electron number <strong>de</strong>nsity and excitation temperature of the Ar atoms<br />
were <strong>de</strong>termined from the Ar emission spectrum. Spectroscopic data are<br />
summarized in Table 2 [25].<br />
Table 2. Spectroscopic data for Ar I lines (4p→4s) [25]<br />
(nm) Eex (eV) gA 10 8 (s -1 )<br />
801.478 13.09 0.464<br />
810.369 13.15 0.750<br />
811.531 13.07 2.32<br />
826.452 13.32 0.459<br />
840.821 13.29 1.12<br />
842.465 13.09 1.08<br />
852.144 13.28 0.417<br />
866.794 13.15 0.0729<br />
912.297 12.90 0.567<br />
Plasma diagnostics by optical emission spectrometry is a passive<br />
technique easy to implement but assumes that plasma is in local thermal<br />
equilibrium (LTE). In accord with the observation of Al<strong>de</strong>r et al. [17] that<br />
electron temperature (Te) is close to Tex of species with high excitation energy,<br />
we consi<strong>de</strong>red that Te could correspond to Tex for Ar I (4p→4s). The gas<br />
temperature (Tg), ne and Te characterize the capability of atomization and<br />
excitation of a plasma source. Low Tg and high Te recommend plasma as<br />
excitation source in atomic emission. The excitation temperature of Ar I<br />
(4p→4s) was estimated from the Bolzmann plot consi<strong>de</strong>ring the convolution<br />
of the grating and <strong>de</strong>tector efficiencies in conjunction with the wavelength.<br />
The excitation temperature of Ar I (4p→4s) vs. viewing height in the absence<br />
of CH4 and with addition of 2.5 and 5 mL min -1 CH4 in 0.7 L min -1 Ar is<br />
presented in Figure 2. The variation of electron number <strong>de</strong>nsity un<strong>de</strong>r the<br />
same conditions is shown in Figure 3.<br />
The excitation temperature of Ar I in pure Ar plasma is in the range<br />
1210 – 1950 K and <strong>de</strong>creases to 780 – 1460 K and 580 – 1365 K when<br />
adding 2.5 and 5 mL min -1 CH4 respectively. The error in the <strong>de</strong>termination<br />
of Tex evaluated from the standard <strong>de</strong>viation of the slope of the Bolzmann plot<br />
was in the range 5 – 15 %. The <strong>de</strong>crease of Tex for Ar I confirms quenching<br />
of Ar emission caused by second-kind collisions between argon excited atoms<br />
and CH4 molecules. The <strong>de</strong>cline of the population of 4s Ar metastable<br />
atoms involved in the excitation of nitrogen SPS when adding CH4 proves<br />
the <strong>de</strong>crease of the nitrogen molecular emission.
SPECTROSCOPIC STUDY OF ATMOSPHERIC PRESSURE ARGON/METHANE CAPACITIVELY …<br />
Figure 2. Depen<strong>de</strong>nce of the excitation temperature of Ar I (4p→4s) on the viewing<br />
height in plasma operated at 275 W and 0.7 L min -1 Ar. CH4 flow rate (mL min -1 ): A - 0;<br />
B - 2.5; C - 5. Error bars correspond to uncertainty in temperature <strong>de</strong>termination<br />
Figure 3. Electron number <strong>de</strong>nsity vs. viewing height in plasma operated at 275 W<br />
and 0.7 L min -1 Ar. CH4 flow rate (mL min -1 ): A - 0; B - 2.5; C - 5. Error bars<br />
correspond to uncertainty in temperature <strong>de</strong>termination<br />
The value of ne was calculated from the Saha’s equation consi<strong>de</strong>ring<br />
the statistical weights for electrons and ions (ge=2 and gi=6) and Te equal to<br />
Tex of Ar atoms.<br />
hc gA<br />
3 Ei<br />
− Eex<br />
ln( ) = 51.<br />
72 − 2 ln ne<br />
+ lnT<br />
−<br />
I λ 2 kT<br />
(7)<br />
where: Ei – ionization energy of Ar (15.86 eV)<br />
Eex – excitation energy of Ar I lines<br />
13
14<br />
T. FRENTIU, M. PONTA, A. I. MIHALTAN, E. DARVASI, M. FRENTIU, E. CORDOS<br />
Thus, ⎟ ⎛ hc gA ⎞<br />
Ei − Eex<br />
ln ⎜ was plotted vs. (Fig.3) and ne was<br />
⎝ I λ ⎠<br />
k<br />
calculated from the intercept.<br />
The value of ne in the plasma tail (60 – 80 mm) of pure Ar is in the<br />
range 6.34x10 9 – 1.37x10 12 cm -3 , lower than in the inferior zone of the<br />
discharge (0 – 32 mm), of 4.35x10 12 – 2.37x10 13 cm -3 [26]. This parameter<br />
<strong>de</strong>creases at 1.21x10 8 – 7.70x10 10 cm -3 and 1.06x10 8 – 3.79x10 10 cm -3 when<br />
adding 2.5 and 5 mL min -1 CH4, respectively. The error in ne <strong>de</strong>termination<br />
was in the range 5 – 15 %.<br />
The <strong>de</strong>cline of ne in the presence of CH4 in the Ar plasma suggests a<br />
sharp <strong>de</strong>crease of the ionization <strong>de</strong>gree of the support gas. The gas temperature<br />
of Ar plasma was in the range 2330 - 2550 K [26]. The relatively high gas<br />
temperature and low electron temperature and ne in the plasma tail are benefit<br />
for a good atomization of sample but provi<strong>de</strong> low excitation capabilities,<br />
what is suitable as atoms cell in AFS [11-13].<br />
CONCLUSIONS<br />
The spectral characterization of an Ar/CH4 plasma operated at low<br />
power and gas consumption was carried out. The emission spectrum of the<br />
pure Ar plasma was dominated by the OH, N2 SPS band and Ar I lines 4p→4s<br />
transitions. Addition of CH4 in Ar plasma resulted in quenching of the molecular<br />
emission and Ar I lines following chemical reactions with OH and second-kind<br />
collisions with nitrogen molecules and Ar atoms. In the Ar/CH4 plasma<br />
molecular emission of CHx (x=1, 2) is missing, while the C2 Swan band is<br />
relative intense. The role of CH4 in quenching of emission subsequent secondkind<br />
collisions was evi<strong>de</strong>nced by the <strong>de</strong>crease of Ar I excitation temperature<br />
and electron number <strong>de</strong>nsity. The low background spectrum and low excitation<br />
capability of the Ar/CH4 plasma recommend it as an attractive atomization<br />
source in atomic spectrometry using low resolution microspectrometers.<br />
EXPERIMENTAL SECTION<br />
Instrumentation<br />
The discharge was characterized by optical emission spectrometry using<br />
spectrum ranging from 200 – 1000 nm recor<strong>de</strong>d with the low resolution<br />
HR4000 microspectrometer from Ocean Optics with FWHM of 1.5 nm. Detailed<br />
about the measurement settings are given in Table 3, while the experimental<br />
set-up in Figure 4. Un<strong>de</strong>r standard conditions, plasma was generated at a<br />
flow rate of 0.7 L min -1 Ar (5.0 quality). In the approach with CH4 (4.5 quality)<br />
as collision/reaction gas, plasma was <strong>de</strong>veloped in a mixture using the<br />
same Ar flow rate as above and CH4 in the range of 2.5-7.5 mL min -1 .
SPECTROSCOPIC STUDY OF ATMOSPHERIC PRESSURE ARGON/METHANE CAPACITIVELY …<br />
Table 1. Characteristics and operating conditions for the experimental system<br />
CCP torch-microspectrometer<br />
Power supply Free running generator, 275 W, 27.12 MHz (Research Institute for Analytical<br />
Instrumentation, Cluj-Napoca, Romania)<br />
Plasma torch Capacitively coupled with Mo tubular electro<strong>de</strong> (i.d. 3.5 mm) connected to<br />
the generator and groun<strong>de</strong>d ring electro<strong>de</strong> of Cu spaced at 5 mm; 16 mm i.d.<br />
quartz tube, 10 cm length, GFC 17 mo<strong>de</strong>l CH4 mass flow meter (Aalborg Instr.<br />
Sample<br />
introduction<br />
system<br />
and Controls, USA).<br />
Meinhardt nebulizer equipped with impactor spray chamber (Perkin Elmer,<br />
Norwalk, USA) without <strong>de</strong>solvation, 5% nebulization efficiency; aerosol intake<br />
into the plasma via the tubular electro<strong>de</strong>.<br />
Optics HR4000 Microspectrometer Ocean Optics (200-1100 nm), 1200 grooves mm -1 ,<br />
Toshiba TCD1304AP CCD array, 3636 pixels, focal length 101.6 mm, FWHM<br />
1.5 nm, collimating system-74 UV, fibre optic QP 600 μm, 25 cm length (Ocean<br />
Data<br />
acquisition<br />
Optics, Dunedin, USA).<br />
Spectra Suite Soft (Ocean Optics); average of 10 successive measurements<br />
for 5 s integration time<br />
Throughout the experiment a flow rate of 1 mL min -1 water with 5%<br />
nebulization efficiency was introduced into plasma. The emission signal<br />
was collected through the quartz tube with a collimating lens placed in the<br />
radial direction related to the plasma by means of the fibre optic of the<br />
microspectrometer. Measurements were performed in plasma tail at viewing<br />
heights greater than 60 mm above the tubular electro<strong>de</strong>, the zone consi<strong>de</strong>red<br />
as optimum for fluorescence measurements [13].<br />
Figure 4. Experimental set-up of the capacitively coupled plasma torch<br />
and HR4000 Ocean Optics microspectrometer.<br />
ACKNOWLEDGMENTS<br />
The present investigations are supported by the Romanian Ministry of Education,<br />
Research and Innovation, PNCDI II Program (Project FLUOROSPEC no. 71019/2007.<br />
15
T. FRENTIU, M. PONTA, A. I. MIHALTAN, E. DARVASI, M. FRENTIU, E. CORDOS<br />
REFERENCES<br />
1. J.A.C. Broekaert, Applied Spectroscopy, 2008, 62, 227A.<br />
2. ISO 11885: 2007, Water quality – Determination of selected elements by inductively<br />
coupled plasma optical emission spectrometry (ICP-OES).<br />
3. ISO 22036 Soil quality - Determination of trace elements in extracts of soil by<br />
inductively coupled plasma - atomic emission spectrometry (ICP - AES).<br />
4. A.E. Croslyn, B.W. Smith, J.D. Winefordner, Critical Review Analytical Chemistry,<br />
1997, 27, 199.<br />
5. D.L. Haas, J.A. Caruso, Analytical Chemistry, 1984, 56, 2014.<br />
6. K. Jankowski, Journal of Analytical Atomic Spectrometry, 1999, 14, 1419.<br />
7. Q. Jin, W. Yang, F. Liang, H. Zhang, A. Yu, Y. Cao, J. Zhou, B. Xu, Journal of<br />
Analytical Atomic Spectrometry, 1998, 13, 377.<br />
8. M.W. Bla<strong>de</strong>s, Spectrochimica Acta, 1994, 49B, 47.<br />
9. T. Frentiu, D. Petreus, M. Senila, A.I. Mihaltan, E. Darvasi, M. Ponta, E. Plaian,<br />
E.A. Cordos, Microchemical Journal, 2011, 97, 188.<br />
10. E.A. Cordos, T. Frentiu, A.M. Rusu, S.D. Anghel, A. Fodor, M. Ponta, Talanta,<br />
1999, 48, 827.<br />
11. T. Frentiu, E. Darvasi, M. Senila, M. Ponta, E. Cordos, Talanta, 2008, 76, 1170.<br />
12. T. Frentiu, M. Ponta, M. Senila, A.I. Mihaltan, E. Darvasi, M. Frentiu, E. Cordos,<br />
Journal of Analytical Atomic Spectrometry, 2010, 25, 739.<br />
13. T. Frentiu, M. Ponta, A.I. Mihaltan, E. Darvasi, M. Frentiu, E. Cordos, Spectrochimica<br />
Acta, 2010, 65B, 565.<br />
14. A. Yanguas-Gil, K. Focke, J. Benedikt, A. von Keu<strong>de</strong>ll, Journal of Applied Physics,<br />
2007, 101, 103307.<br />
15. D.W. Setser, D.H. Stedman, J.A. Coxon, Journal of Chemical Physics, 1970, 53,<br />
1004.<br />
16. N. Bibinov, A. Fateev, K. Wiesemann, Journal of Physics. D: Applied Physics,<br />
2001, 34, 1819.<br />
17. J.F. Al<strong>de</strong>r, R.M. Bombelka, G.F. Kirkbright, Spectrochimica Acta, 1980, 35B, 163.<br />
18. W.K. McGregor, Proc. V Bienn. Gas Dynamics Symp., Evanson 1963, Chapter 8.<br />
Northwestern University Press (1963).<br />
19. J.R. Dunlop, F.P. Tully, Journal of Physical Chemistry, 1993, 97, 11148.<br />
20. F.P. Tully, A.R. Ravishankara, Journal of Physical Chemistry, 1980, 4, 3126.<br />
21. J.G. Calvert, R. Atkinson, K.H. Becker, R.M. Kamens, J.H. Seinfeld, T.J. Wallington,<br />
G. Yarwood, “The Mechanisms of Atmospheric Oxidation of Aromatic Hydrocarbons”,<br />
Oxford University Press, UK, 2002.<br />
22. T. Gierczak, R.K. Talukdar, S.C. Herndon, G.L. Vaghjiani, A.R. Ravishankara,<br />
Journal of Physical Chemistry. A 1997, 101, 3125.<br />
23. M. Shimozuma, H. Tagashira, Journal of Physics. D: Applied Physics, 1981, 14,<br />
1783.<br />
24. A. Gicquel, M. Chenevier, Kh. Hassouni, A. Tserepi, M. Dubus, Journal of Applied<br />
Physics, 1998, 83, 7504.<br />
25. NIST Atomic Spectra Database Lines Form<br />
http://physics.nist.gov/PhysRefData/ASD/lines_form.html (accessed November 2010)<br />
26. T. Frentiu, M. Ponta, E. Darvasi, M. Frentiu, E. Cordos, Acta Chimica Slovenica,<br />
2010, 57, 173.<br />
16
STUDIA UBB CHEMIA, LVI, 1, 2011<br />
PRODUCTION AND CHARACTERIZATION OF BIODIESEL<br />
FROM RAPESEED OILS<br />
ADRIANA GOG a , MIRCEA CHINTOANU* ,a , MARIUS ROMAN a ,<br />
EMIL LUCA b , FLORIN-DAN IRIMIE c<br />
ABSTRACT. The main objective of the present work was to investigate the<br />
influence of rapeseed oil type upon the biodiesel quality. For this purpose<br />
eleven types of rapeseed oil were used to obtain biodiesel by alkaline<br />
transesterification. The produced biodiesels were examined for several<br />
physico–chemical characteristics in or<strong>de</strong>r to evaluate and compare their<br />
quality with the specifications for biodiesel according to the EN 14214:2004<br />
European standard.<br />
Keywords: rapeseed oil, biodiesel, alkaline transesterification<br />
INTRODUCTION<br />
Biodiesel is gaining more and more importance as an attractive<br />
alternative fuel due to the <strong>de</strong>pleting nature of fossil fuel resources. The<br />
most common method to produce biodiesel, industrially applied, is catalytic<br />
transesterification of vegetable oils and animal fats using a homogeneous acid<br />
or base catalyst (Fig. 1a). Alkaline-catalyzed transesterification process is<br />
normally adopted for biodiesel production because alkaline catalysts are the<br />
most effective transesterification catalysts compared to the acid catalysts and<br />
also for economic reasons [1, 2]. The basic catalyst reacts with methanol to<br />
form sodium methoxi<strong>de</strong> (Fig. 1b) that reacts with the triglyceri<strong>de</strong>s to produce<br />
biodiesel (fatty acid methyl esters, FAMEs). The main by-product is glycerol<br />
which, after purification, can be used for pharmaceutical and cosmetic purposes.<br />
Free fatty acids, water and unreacted alkaline catalyst are also present. Thus,<br />
complicated purification steps are nee<strong>de</strong>d in or<strong>de</strong>r to obtain a pure biodiesel<br />
achieving the standard requirements. When the acidity of a feedstock is high<br />
the reaction between the free fatty acids and the basic catalyst produces<br />
soap (Fig. 1c). Since soap is a surfactant it forms emulsions and makes the<br />
separation between FAMEs and glycerol difficult. Thus, in the presence of a<br />
high content of free fatty acids an acid-catalyzed process is used.<br />
a INCDO-INOE 2000 Research Institute for Analytical Instrumentation - ICIA, 67 Donath St.,<br />
400293 Cluj-Napoca, Romania, *mircea.chintoanu@icia.ro<br />
b University of Agricultural Sciences and Veterinary Medicine Cluj-Napoca, Faculty of Horticulture,<br />
3 Calea Manastur St., 400372 Cluj-Napoca, Romania<br />
c Babes-Bolyai University Cluj-Napoca, Faculty of Chemistry and Chemical Engineering, 11<br />
Arany Janos St. 400028, Cluj-Napoca, Romania
18<br />
ADRIANA GOG, MIRCEA CHINTOANU, MARIUS ROMAN, EMIL LUCA, FLORIN-DAN IRIMIE<br />
Figure 1. (a) Methanolysis reaction of triglyceri<strong>de</strong>s for the production of Fatty Acid<br />
Methyl Esters(biodiesel); (b) Methoxi<strong>de</strong> formation; (c) Unwanted reaction of soap<br />
formation due to the presence of free fatty acids<br />
Rapeseed (Brassica napus) is wi<strong>de</strong>ly cultivated throughout the world<br />
for the production of animal feed, vegetable oil and biodiesel. Rapeseed oil is<br />
one of the preferred oil stocks for biodiesel production, partly because rapeseed<br />
produces more oil per unit of land area compared to other oil sources, ranking<br />
fourth in the world with respect to production, after soybean, palm and<br />
cottonseed [3]. The properties of the biodiesel fuel are strongly influenced by<br />
the structure and distribution of the component fatty acid methyl esters which<br />
vary <strong>de</strong>pending on the source.<br />
The main objective of the present work was to investigate the influence<br />
of rapeseed oil type upon the biodiesel quality. For this purpose eleven types<br />
of rapeseed oils were used to obtain biodiesel by alkaline transesterification.<br />
The reaction conditions used for methanolysis of rapeseed oils were: 1.5 %<br />
(w/w by oil weight) KOH as catalyst, methanol/oil molar ratio 6:1, reaction<br />
temperature 60°C, rate of mixing 300 rpm and a reac tion time of 1 h. The<br />
produced biodiesel was examined for several physico–chemical characteristics<br />
in or<strong>de</strong>r to evaluate and compare its quality with the specifications for biodiesel<br />
according to the EN 14214:2004 European standard (Table 1) [4].<br />
Table 1. Generally applicable requirements and related test methods for several<br />
physico-chemical characteristics necessary for FAME use as diesel fuel<br />
Property Unit<br />
Density, 15°C Kg/m 3<br />
Limits<br />
Test method<br />
Minimum Maximum<br />
860 900 EN ISO 3675<br />
Viscosity, 40°C mm 2 /s 3.50 5.00 ASTM D 2983-04a
PRODUCTION AND CHARACTERIZATION OF BIODIESEL FROM RAPESEED OILS<br />
Property Unit<br />
Limits<br />
Test method<br />
Minimum Maximum<br />
Acid value mg KOH/g 0.50 EN 14104<br />
Iodine value gI2/100g - 120 EN 14111<br />
Sulfur content mg/Kg - 10.0 prEN ISO 20846<br />
Water content mg/Kg - 500 EN ISO 12937<br />
Flash point °C 120 prEN ISO 3679<br />
Ester content % (m/m) 96.5 EN 14103<br />
Linoleic acid methyl ester % (m/m) - 12.0 EN 14103<br />
RESULTS AND DISCUSSION<br />
The biodiesel yield was consi<strong>de</strong>red as the ratio between the produced<br />
biodiesel weight and the initial rapeseed oil weight, % (w/w). The yields obtained<br />
for the transesterification of rapeseed oils are shown in Table 2.<br />
Table 2. The yields obtained for the transesterification reactions of rapeseed oils<br />
Rapeseed Martor Martor Aviator Karibik Formula Nelson Octans Toccata Petrol Smart Speed<br />
biodiesel<br />
Yield,<br />
I II<br />
wt % 93.2 93.9 92.9 90.6 57.3 91.3 92.4 92 91.2 93.3 93.4<br />
As shown in the table above, the yields for the alkaline transesterification<br />
reactions were greater than 90 % except for FORMULA rapeseed oil, with a<br />
yield of only 57.3 %. The reason was the high content of free fatty acids<br />
which in the presence of potassium hydroxi<strong>de</strong> <strong>de</strong>termined the formation of<br />
soaps, making difficult the conversion of triglyceri<strong>de</strong>s to methyl esters and<br />
also the separation of reaction products.<br />
The products of above transesterification processes were analyzed,<br />
taking into consi<strong>de</strong>ration several specifications for biodiesel as fuel in diesel<br />
engines. Most of these parameters comply with the limits prescribed in the<br />
EN 14214:2004 standard for biodiesel.<br />
For each studied physico-chemical characteristic the values obtained<br />
were graphically presented compared with the minimum and/or maximum<br />
limits recommen<strong>de</strong>d by the quality specifications according to EN 14214:2004<br />
(see Figure 2).<br />
DENSITY<br />
Density is an important property of biodiesel. It represents the weight of<br />
a unit volume of fluid. Fuel injection equipment operates on a volume metering<br />
system, hence a higher <strong>de</strong>nsity for biodiesel results in the <strong>de</strong>livery of a slightly<br />
19
20<br />
ADRIANA GOG, MIRCEA CHINTOANU, MARIUS ROMAN, EMIL LUCA, FLORIN-DAN IRIMIE<br />
greater mass of fuel. The <strong>de</strong>nsity values for the rapeseed <strong>de</strong>rived biodiesels<br />
are schematically presented in Figure 2a. It is noted that only the biodiesel<br />
obtained from FORMULA rapeseed oil has excee<strong>de</strong>d the maximum permissible.<br />
This was due to low yield of reaction; much of the oil remained untransformed.<br />
The <strong>de</strong>nsity values for other rapeseed oils were comparable to those reported<br />
in the literature [5].<br />
VISCOSITY<br />
Viscosity is a measure of the internal friction or resistance of an oil<br />
to flow. As the temperature of oil is increased, its viscosity <strong>de</strong>creases and it is<br />
therefore able to flow more readily. Viscosity is the most important property of<br />
biodiesel since it affects the operation of fuel injection equipment, particularly<br />
at low temperatures when the increase in viscosity affects the fluidity of the<br />
fuel. High viscosity leads to poorer atomization of the fuel spray and less<br />
accurate operation of the fuel injectors. The viscosity may be used not only<br />
as the indicator of impurities in biodiesel, but also as the control parameter<br />
of the transesterification process [6].<br />
The values of the kinematic viscosity at 40°C for the rapeseed oil<br />
biodiesels were represented in Figure 2b. Due to low conversion efficiency,<br />
the viscosity value for biodiesel obtained from FORMULA oil was higher than<br />
the maximum recommen<strong>de</strong>d (out of the plotting scale). Biodiesel produced<br />
from AVIATOR and MARTOR I oils have slightly excee<strong>de</strong>d the maximum,<br />
but in the literature the viscosity values for rapeseed biodiesel are up to<br />
5.7 mm 2 /s [7].<br />
ACID VALUE<br />
High fuel acidity is associated with corrosion and engine <strong>de</strong>posits,<br />
particularly in the fuel injectors. The acid number or acid value indicates the<br />
quantity of free fatty acids (FFA) and mineral acids (negligible) present in<br />
the sample. According to EN 14104, the acid value is expressed in milligrams<br />
(mg) potassium hydroxi<strong>de</strong> (KOH) required to neutralize 1 g of sample.<br />
The acid value of the analyzed biodiesels was ranged 0.09 – 0.42 mg<br />
KOH/g. The EN 14214:2004 biodiesel standard approved a maximum acid<br />
value for biodiesel of 0.5 mg KOH/g which was fulfilled by all of the produced<br />
rapeseed methyl esters (Figure 2c). The highest value of 0.42 mg KOH/g<br />
sample was obtained for the FORMULA oil biodiesel, indicating a high content<br />
of free fatty acids.
PRODUCTION AND CHARACTERIZATION OF BIODIESEL FROM RAPESEED OILS<br />
Figure 2. Physico-chemical characteristics of rapeseed <strong>de</strong>rived biodiesels compared<br />
with the minimum and/or maximum limits recommen<strong>de</strong>d by the quality specifications<br />
according to EN 14214:2004 (minimum limit – blue line, maximum limit – red line);<br />
a - <strong>de</strong>nsity; b - viscosity; c - acid value; d - iodine value; e - sulphur content;<br />
f - flash point; g - water content; h - methanol content; i - linoleic acid methyl ester<br />
content; j - ester content<br />
21
22<br />
ADRIANA GOG, MIRCEA CHINTOANU, MARIUS ROMAN, EMIL LUCA, FLORIN-DAN IRIMIE<br />
IODINE VALUE<br />
Iodine value <strong>de</strong>pends on the feedstock origin and greatly influences<br />
fuel oxidation ten<strong>de</strong>ncy. Consequently, in or<strong>de</strong>r to avoid oxidation, special<br />
precautions must be taken during the storage of biodiesel from rapeseed oil<br />
with high iodine values, According to EN 14214 European standard methyl<br />
esters used as diesel fuel must have an iodine value less than 120 g I2 per 100<br />
g of sample. Methyl esters obtained in this study had iodine value in the range<br />
109.2 – 112.9 g I2/100 g (Figure 2d), thus the variations were not consi<strong>de</strong>rable.<br />
SULFUR CONTENT<br />
The presence of sulfur in biodiesel samples may be from vegetable oils,<br />
for example, from phospholipids present in all vegetable oils or glucosinolates<br />
present in rapeseed <strong>de</strong>rived biodiesel [8].The sulfur content of the biodiesels<br />
was analyzed by EN ISO 20846 test method, using ultraviolet fluorescence<br />
spectrometry. The values were ranged from 1.23–5.64 mg/Kg, as shown in<br />
Figure 2e. Values for sulfur content for the rapeseed biodiesels were all<br />
situated below the recommen<strong>de</strong>d maximum of 10.0 mg/Kg.<br />
FLASH POINT<br />
The flash point of a substance represents the lowest temperature at<br />
which it can vaporize to form flammable mixtures when exposed to air. It is<br />
a parameter to consi<strong>de</strong>r in the handling, storage and safety of fuels and<br />
flammable materials. A higher value of flash point <strong>de</strong>creases the risk of fire. In<br />
the case of biodiesel, the flash point (FP) <strong>de</strong>creases with increasing amounts<br />
of residual alcohol and other low-boiling solvents [9]. In this study, only residual<br />
methanol can be present in biodiesel. Therefore, the flash point was presupposed<br />
to be <strong>de</strong>pending only on the methanol content. For all rapeseed biodiesel<br />
samples, the flash point was much higher than the minimum recommen<strong>de</strong>d<br />
value of 120 °C. The results are plotted in Figure 2f.<br />
WATER CONTENT<br />
The water content in biodiesel is an important factor in the quality<br />
control. Water can promote microbial growth, lead to tank corrosion, participate<br />
in the formation of emulsions, and cause hydrolysis or hydrolytic oxidation [8].<br />
Therefore, the content of water is limited to 0.05 % (w/w) according to EN<br />
14214. The water content of the rapeseed biodiesel samples was measured<br />
using EN ISO 12937 standard test method and in all experiments, the values<br />
were higher than the recommen<strong>de</strong>d maximum of 500 mg/Kg, as presented<br />
in Figure 2g. This indicates an incomplete purification process and the need<br />
for additional steps for biodiesel drying.
PRODUCTION AND CHARACTERIZATION OF BIODIESEL FROM RAPESEED OILS<br />
METHANOL CONTENT<br />
The residual methanol in biodiesel can cause corrosion of metal,<br />
mainly of aluminium, and <strong>de</strong>creases the biodiesel flash point. Besi<strong>de</strong>s, it is<br />
responsible for cetane number and lubricity <strong>de</strong>creasing of fuel. The values<br />
for the methanol content were situated below the maximum recommen<strong>de</strong>d<br />
of 0.20% (w/w), for all the types of rapeseed biodiesel submitted to analysis<br />
(Figure 2h). The highest value of 0.1469 % (w/w) was obtained for FORMULA<br />
oil biodiesel that <strong>de</strong>monstrated once again the difficulties caused by the formed<br />
soaps on the conversion and purification processes.<br />
ESTER CONTENT. LINOLENIC ACID METHYL ESTER CONTENT<br />
The values for ester content of rapeseed biodiesels were all situated<br />
below the recommen<strong>de</strong>d minimum of 96.5% (w/w). This requires additional<br />
steps of purification and drying to achieve a more efficient removal of water<br />
and of by-products (mono-, di- triglyceri<strong>de</strong>s, and glycerol) to obtain a product<br />
that meets the quality specifications. Values for ester content are presented<br />
in Figure 2j. In the case of biodiesel obtained from FORMULA oil the ester<br />
content was only 14.9 % (w/w), indicating a very low conversion of triglyceri<strong>de</strong>s<br />
into methyl esters. The values for linolenic acid methyl ester content were<br />
all situated below the maximum recommen<strong>de</strong>d value of 12% (w/w) (Figure 2i).<br />
A complete purification scheme of cru<strong>de</strong> biodiesel in or<strong>de</strong>r to obtain<br />
a finished product that meets EN 14214 quality specifications is proposed<br />
in Figure 3.<br />
Cru<strong>de</strong><br />
biodiesel<br />
Distillation<br />
Methanol<br />
Water<br />
Water<br />
washing<br />
Wash water<br />
Drying<br />
Water<br />
Residual methanol water<br />
and unreacted oil<br />
Vacuum<br />
distillation<br />
Finished biodiesel<br />
Figure 3. Purification scheme of cru<strong>de</strong> biodiesel in or<strong>de</strong>r to obtain a finished<br />
product that meets EN 14214 quality specifications.<br />
Cru<strong>de</strong> biodiesel is first submitted to a distillation process in or<strong>de</strong>r to remove<br />
methanol from other components. Then a water washing step is used to remove<br />
remaining catalyst, soap, salts, methanol, or free glycerol from the biodiesel. After the<br />
wash process, the remaining water is removed from the biodiesel by a drying process.<br />
A final vacuum distillation is required to remove any residual methanol, water and<br />
23
24<br />
ADRIANA GOG, MIRCEA CHINTOANU, MARIUS ROMAN, EMIL LUCA, FLORIN-DAN IRIMIE<br />
unreacted oil and to obtain a biofuel purity that meets EN 14214 specifications.<br />
Vacuum operating conditions are required in or<strong>de</strong>r to keep the temperature low<br />
enough to avoid the biofuel <strong>de</strong>gradation.<br />
HIGHER HEATING VALUE<br />
Higher heating value (HHV) is an important property <strong>de</strong>fining the<br />
energy content and thereby efficiency of fuels that <strong>de</strong>termines in the case<br />
of biodiesel its suitability as an alternative to diesel fuels. As it can be<br />
observed from Table 3, the values were ranged from 38.8 to 40.1 MJ/kg.<br />
Higher HHVs were obtained for experiments in which the yields of ester<br />
were higher while the lowest value was obtained for FORMULA oil due to low<br />
conversion of triglyceri<strong>de</strong>s. For the other rapeseed biodiesels the variations<br />
were not consi<strong>de</strong>rable. The European standard EN 14214 approved a suitable<br />
heating value for biodiesel of 35 MJ/kg.<br />
Table 3. High heating values for rapeseed <strong>de</strong>rived biodiesels<br />
Rapeseed Martor Martor Aviator Karibik Formula Nelson Octans Toccata Petrol Smart Speed<br />
biodiesel I II<br />
HHV,<br />
MJ/Kg<br />
39.9 39.9 39.9 38.9 38.8 40.0 39.9 39.9 40.1 39.9 39.9<br />
CONCLUSIONS<br />
The results obtained in the present study regarding the production<br />
of biodiesel using alkaline transesterification of eleven varieties of rapeseed<br />
oil as feedstocks together with the physico-chemical characterization of the<br />
biodiesels obtained, showed that only the rapeseed oil from the FORMULA<br />
hybrid proved ina<strong>de</strong>quate for the alkaline transesterification process due to<br />
high levels of free fatty acids that led to the formation of soaps. The<br />
consequence was a low yield for the transesterification process of only<br />
57.3% due to incomplete conversion of triglyceri<strong>de</strong>s into esters. The formed<br />
soaps caused many difficulties also in the purification steps of cru<strong>de</strong> biodiesel<br />
that inclu<strong>de</strong>d: separation, washing and drying, ester content of the final<br />
product being only 14.9% (w/w). The other rapeseed oils tested: control<br />
sample variety oils (MARTOR I, MARTOR II), AVIATOR, KARIBIK, NELSON,<br />
OCTANS, TOCCATA, PETROL, SMART, SPEED gave yields higher than 90%<br />
and the physico-chemical characterization of these biodiesels <strong>de</strong>monstrated<br />
that these rapeseed oils can be success<strong>full</strong>y used as feedstocks for biodiesel<br />
production using alkaline transesterification.
PRODUCTION AND CHARACTERIZATION OF BIODIESEL FROM RAPESEED OILS<br />
EXPERIMENTAL SECTION<br />
Materials and methods<br />
11 types of rapeseed oil: two rapeseed oils from DEXTER control<br />
sample variety named further MARTOR I and MARTOR II (obtained from<br />
Saaten-Union) and eight oils obtained from rapeseed hybrids: AVIATOR,<br />
KARIBIK, FORMULA, NELSON, OCTANS, TOCCATA, PETROL, SMART,<br />
SPEED (obtained from Syngenta). The fatty acid profiles of rapeseed oils are<br />
summarized in Table 4. Pure standards of fatty methyl esters (FAMEs) were<br />
obtained from Sigma Chemicals Co. (St. Louis, MO, USA). Methanol, n-hexane,<br />
potassium hydroxi<strong>de</strong>, and anhydrous magnesium silicate were of Merck<br />
(Darmstadt, Germany). All the chemicals used were analytical reagent gra<strong>de</strong>.<br />
Table 4. Fatty acid composition for the rapeseed oils used for biodiesel production<br />
Fatty<br />
acids<br />
Abr.<br />
Dexter control<br />
sample variety<br />
(Saaten-<br />
Martor<br />
I<br />
Union)<br />
Martor<br />
II<br />
Cultivar<br />
Hybrids<br />
(Syngenta)<br />
Aviator Karibik FormulaNelson OctansTocatta Petrol Smart Speed<br />
C10 % 0.014 0.013 0.013 0.015 0.013 0.013 0.016 0.014 0.016 0.017 0.015<br />
C12 % 0.010 0.010 0.011 0.009 0.010 0.009 0.009 0.010 0.009 0.009 0.009<br />
C14 % 0.057 0.058 0.065 0.055 0.056 0.056 0.051 0.058 0.051 0.051 0.051<br />
C16 % 4.32 4.24 4.42 4.3 4.18 4.13 4.23 4.06 4.29 3.98 4.23<br />
C16:1 % 0.186 0.191 0.185 0.197 0.176 0.184 0.186 0.174 0.186 0.17 0.193<br />
C18 % 1.67 1.57 1.70 1.66 1.56 1.53 1.69 1.66 1.53 1.85 1.64<br />
C18:1 % 58.2 58.9 59.1 59.17 57.5 58.8 58.3 59.8 59.1 61.4 59.5<br />
C18:2 % 19.4 18.8 18.5 17.31 19.5 19.4 18.5 18.9 18.2 17.2 17.6<br />
C18:3 % 9.27 9.26 8.98 10 8.46 8.67 9.01 8.65 9.5 8.28 9.51<br />
C20 % 0.530 0.474 0.496 0.512 0.474 0.472 0.502 0.488 0.512 0.535 0.495<br />
C22:0 % 0.261 0.220 0.227 0.236 0.224 0.23 0.226 0.224 0.275 0.225 0.229<br />
C22:1 % - - - - - 0.048 0.076 0.029 - - -<br />
C24:0 % 0.093 - 0.071 0.069 0.091 0.078 0.071 0.096 0.076 -<br />
25
26<br />
ADRIANA GOG, MIRCEA CHINTOANU, MARIUS ROMAN, EMIL LUCA, FLORIN-DAN IRIMIE<br />
Alkaline catalyzed transesterification<br />
Single-stage laboratory esterification was carried out in a 250 ml conical<br />
flask equipped with a magnetic stirrer. 1.5 g potassium hydroxy<strong>de</strong> dissolved<br />
in 20 ml methanol was ad<strong>de</strong>d to 100 g vigorously stirred oil. Stirring was<br />
continued for 1 h at 60°C. After this time the reaction was stopped, the mixture<br />
was transferred to a separatory funnel and the glycerol was allowed to separate<br />
for a minimum of 3 h. After separation of the two layers by sedimentation,<br />
the upper methyl esters layer was purified by distilling the residual methanol at<br />
80°C. The remaining catalyst was removed by successive rinses with distilled<br />
water. Finally, the residual water was eliminated by treatment with anhydrous<br />
magnesium silicate at 60 °C for 60 min with stirring. After cooling, the biodiesel<br />
was filtered and its quality was tested.<br />
Gas Chromatographic Analysis of Fatty Acid Methyl Ester<br />
The fatty acid methyl ester contents in the reaction mixture were<br />
<strong>de</strong>termined using an Agilent 7890A GC gas chromatograph equipped with a<br />
DB-WAX capillary column (30m × 0.25mm × 0.25μm) and a flame ionization<br />
<strong>de</strong>tector. The column oven temperature was kept at 50 °C for 1 min, heated<br />
to 200 °C at 25°C/min, then to 230 °C at 3°C/min and finally maintained for<br />
18 min. The injector and <strong>de</strong>tector temperatures were set to 250 and 280 °C,<br />
respectively. Helium was utilized as a carrier gas. The gas chromatography<br />
calibration was conducted via the analysis of standard solutions of methyl<br />
esters and hepta<strong>de</strong>canoate methyl ester was used as internal standard.<br />
ACKNOWLEDGMENTS<br />
This work was financially supported by The Partnerships in Priority Domains<br />
Program of National Center of Programs Management from Romania, Project No.<br />
22094/2008.<br />
REFERENCES<br />
1. U. Rashid, F. Anwar, Fuel, 2008, 87, 265–273.<br />
2. G. Knothe, J.V. Gerpen, V. Krahl, “Basics of the Transesterification Reaction, the<br />
Biodiesel Handbook”, Champaign, III, AOCS Press, 2005, 26-39.<br />
3. FAO/WHO/UNU, World Health Organization, Geneva, 2002.<br />
4. EN 14214:2004<br />
5. J.M. Encinar, J.F. Gonzalez, A. Rodryguez-Reinares A., Ind. Eng. Chem. Res.,<br />
2005, 44, 5491–5499.<br />
6. N. Ellis, F. Guan, T. Chen, C. Poon, Chem. Eng. J., 2008, 138, 200–206.<br />
7. http://www.brevardbiodiesel.org/viscosity.html<br />
8. G. Knothe, J. Am. Oil Chem. Soc., 2006, 83(10), 823–33.<br />
9. M. Mittelbach, C. Remschmidt, “Biodiesel, the Comprehensive Handbook” I st Ed.<br />
Martin Mittelbach, Graz, 2004.
STUDIA UBB CHEMIA, LVI, 1, 2011<br />
COMPARATIVE STUDY OF MERCURY DETERMINATION IN SOIL<br />
AND VEGETABLE BY METHODS BASED ON THERMAL<br />
DECOMPOSITION-AAS AND WET DIGESTION CV-AFS<br />
MARIN ŞENILĂ a , ERIKA LEVEI a , LĂCRIMIOARA ŞENILĂ a ,<br />
OANA CADAR a , GABRIELA OPREA b , CECILIA ROMAN a<br />
ABSTRACT. The aim of this study was to evaluate and compare the analytical<br />
parameters of two methods used for mercury <strong>de</strong>termination from solid<br />
samples (soils and vegetables): direct <strong>de</strong>termination from solid samples by<br />
thermal <strong>de</strong>composition - atomic absorption spectrometry (TD-AAS) with gold<br />
amalgamation and <strong>de</strong>termination using wet digestion followed by measurements<br />
by cold vapor atomic fluorescence spectrometry (CV-AFS). Two commercially<br />
available mercury (Hg) analyzers were used for the study. Using direct<br />
measurement in solid sample by TD-AAS, a <strong>de</strong>tection limit of 1.2 μg kg −1<br />
and a RSD of 3.8% for 1441 μg kg −1 Hg were obtained, while by using wet<br />
digestion and CV-AFS measurement, a <strong>de</strong>tection limit of 2.5 μg kg −1 and a<br />
RSD of 4.5% for 1438 μg kg −1 Hg were calculated. The accuracy of the<br />
methods was verified by the <strong>de</strong>termination of mercury in certified reference<br />
materials and good agreement between found concentrations and certified<br />
values was obtained for the both methods. Five real soil samples and five<br />
vegetable samples from Baia Mare area were analyzed. The Hg concentrations<br />
in soils ranged between 653–2004 μg kg −1 using TD-AAS method and<br />
between 644-1998 μg kg −1 using CV-AFS method, while in vegetables the<br />
concentrations ranged between 4,60-53,4 μg kg −1 using TD-AAS method<br />
and between 4,32-55,8 μg kg −1 using CV-AFS method. According to the t-<br />
Test and regression analysis, no significant statistical difference between<br />
the datasets obtained by the two methods was found.<br />
Keywords: mercury <strong>de</strong>termination, soil samples, vegetable samples, TD-AAS,<br />
CV-AFS<br />
INTRODUCTION<br />
As a consequence of natural and anthropogenic processes high amounts<br />
of mercury is released into the hydrosphere, atmosphere and biosphere. This<br />
element occurs naturally as the metallic form and/or its sulfi<strong>de</strong> ores such as<br />
cinnabar (HgS) [1]. The earth's crust contains 0.5 mg kg -3 , ambient air may<br />
contain 0.002-0.02 pg dm -3 , and sea water contains about 0.03 mg dm -3<br />
a<br />
INCDO-INOE Research Institute for Analytical Instrumentation, 67 Donath, 400293, Cluj-Napoca,<br />
Romania, e-mail: icia@icia.ro<br />
b<br />
Faculty of Sciences, North University of Baia Mare, Victoriei 76, 430122 Baia Mare, Romania
MARIN ŞENILĂ, ERIKA LEVEI, LĂCRIMIOARA ŞENILĂ, OANA CADAR, GABRIELA OPREA, CECILIA ROMAN<br />
mercury. It is also found in trace amounts in most animal and plant tissues.<br />
Due to his volatility, elemental mercury is efficiently transported as a gas around<br />
the globe, and even remote areas [2, 3].<br />
Hg poisoning may lead to damage in the central nervous system [4].<br />
Due to its high toxicity, mercury (Hg) is consi<strong>de</strong>red one of the most dangerous<br />
pollutants, being in the lists of priority dangerous substances established by the<br />
United States Comprehensive Environmental Response, Compensation, and<br />
Liability Act (CERCLA) and the European Water Framework Directive (2000/<br />
60/EC) [5]. From 2011 export of mercury from the EU will be prohibited in<br />
or<strong>de</strong>r to further reduce its release [5]. As a consequence of its toxicity, it is<br />
very important to make accurate <strong>de</strong>terminations of mercury in environmental<br />
samples.<br />
A variety of analytical techniques can be used for mercury <strong>de</strong>termination.<br />
The most popular methods for <strong>de</strong>termining mercury in almost any type of<br />
sample are based on cold vapor atomic absorption spectrometry (CV-AAS)<br />
and cold vapor atomic fluorescence spectrometry (CV-AFS) [6-8]. The way of<br />
liberating mercury from aqueous or digested samples is reduction, followed by<br />
volatilization and introduction of the mercury by aid of a gas stream. A gold<br />
amalgamation method to purify the mercury vapor can be used [9]. Inductively<br />
coupled plasma mass spectrometry (ICP-MS) can be also success<strong>full</strong>y applied<br />
for mercury analysis [10, 11], including for mercury speciation, but not always<br />
un<strong>de</strong>r routine operating conditions.<br />
The majority of analytical methods for the <strong>de</strong>termination of mercury<br />
in solid samples are based on wet digestion [12, 13]. Ultrasound-assisted<br />
leaching is an alternative and effective way of extracting the analytes from<br />
samples [14]. The techniques using wet digestion followed by cold vapor<br />
generation are generally time-consuming and in addition, high amounts of<br />
harmful and expensive reagents are necessary. Also, the risk of contamination<br />
by supplementary pretreatment steps is high [15, 16]. A good alternative to wet<br />
digestion is the use of reagent-free methods, based on thermal <strong>de</strong>composition<br />
of solid samples or extraction and preconcentration from liquid samples.<br />
These alternatives are in accord with new approach of use non-chemical<br />
methods leading to green analytical chemistry [17- 20].<br />
Thermal <strong>de</strong>composition (pyrolise) - atomic absorption spectrometry<br />
is a reagent-free analytical method in that <strong>de</strong>composition products are carried<br />
to a catalyst by an oxygen flow, then sample oxidation is completed and halogens<br />
and nitrogen/sulphur oxi<strong>de</strong>s are trapped. The final <strong>de</strong>composition products pass<br />
through a mercury amalgamator which collects Hg 0 . The Hg amalgamator is<br />
heated at high temperature and the Hg 0 is released and quantified using the<br />
spectral method [21-26].<br />
The aim of this study was to evaluate and compare the analytical<br />
parameters of the method based on thermal <strong>de</strong>composition atomic absorption<br />
28
COMPARATIVE STUDY OF MERCURY DETERMINATION IN SOIL AND VEGETABLE BY METHODS …<br />
spectrometry with those of wet digestion – cold vapor atomic fluorescence<br />
spectrometry, and to apply these methods for mercury <strong>de</strong>termination in real solid<br />
samples (soils and vegetables) collected from Baia Mare (NW Romania) area.<br />
RESULTS AND DISCUSSIONS<br />
Performance parameters of analytical methods<br />
Mercury <strong>de</strong>terminations in soil and vegetable samples were carried out<br />
using two commercially available automated Hg analyzers. Direct measurements<br />
on solid samples were done using a TD-AAS analyzer, while the solutions<br />
obtained by wet digestion were analysed using a CV-AFS analyzer.<br />
Limits of Detection (LOD) and Limit of Quantitation (LOQ) were<br />
calculated using the 3s criteria. For TD-AAS method, the SBR was <strong>de</strong>termined<br />
for a concentration of 1400 μg kg<br />
29<br />
−1 Hg, while the relative standard <strong>de</strong>viation<br />
of the background (RSDB) was calculated from 10 successive measurements<br />
for the background signal, at analytical wavelength of 253.65 nm. The<br />
calculated value for <strong>de</strong>tection limit was 1.2 μg kg −1 , using high sensitivity cell<br />
for measurement. Limit of quantitation was calculated as being 3.6 μg kg −1<br />
in solid samples (was consi<strong>de</strong>red to be three times the LOD). For CV-AFS<br />
method, the SBR was <strong>de</strong>termined for a concentration in solution of 10 μg L −1 ,<br />
while the RSDB was calculated from measurements of 10 in<strong>de</strong>pen<strong>de</strong>nt black<br />
solutions at wavelength of 253.65 nm. The <strong>de</strong>tection limit in liquid solution<br />
was 0.025 μg L −1 . For digestion of 1 g of sample, and dilution to 100 mL the<br />
<strong>de</strong>tection limit in solid sample was calculated as being 2.5 μg kg −1 , while the<br />
limit of quantitation was 7.5 μg kg −1 .<br />
Working ranges. In the Mercury Analyzer TD-AAS, the signal is<br />
measured in series by a high sensitivity cell followed by a low sensitivity cell.<br />
Using the two cells, a wi<strong>de</strong>r working range is obtained. For high sensitivity cell,<br />
the calibration curve was linear up to 50 ng Hg, and for low sensitivity cell,<br />
up to 600 ng Hg. If 10 mg sample is weighted and introduced in the system,<br />
the upper limit of working range is 600 mg kg −1 . Using the CV-AFS system the<br />
upper limit of working range is 250 μg L −1 in liquid sample and 25 mg kg −1 , if<br />
1g of solid sampled is digested.<br />
According to the Romanian legislation the normal value for Hg<br />
concentration in soil is 100 µg kg -1 , the alert threshold for sensitive areas is<br />
1000 µg kg -1 , and the intervention threshold 2000 µg kg -1 . All this values can<br />
be easily measured by TD-AAS and also by CV-AFS methods.<br />
The trueness was studied by analyzing a Certified Reference Material<br />
in soil matrix, SRM 2709, and two CRMs in vegetable matrices, NCS 85 006<br />
(Tomato) and IAEA-359 (Cabbage). The obtained results compared to certified<br />
values of mercury are presented in Table 1.
MARIN ŞENILĂ, ERIKA LEVEI, LĂCRIMIOARA ŞENILĂ, OANA CADAR, GABRIELA OPREA, CECILIA ROMAN<br />
30<br />
Table 1. Results of Mercury Determination in Various CRMs<br />
by TD-AAS and CV-AFS (mg kg −1 )<br />
CRM Certif. value<br />
TD-AAS<br />
Found<br />
CV-AFS<br />
SRM 2709 soil 1.40±0.08 1.441±0.055 1.438±0.067<br />
NCS ZC 85 006 tomato 0.14±0.022 0.152±0.006 0.144±0.014<br />
IAEA-359 cabbage 0.013±0.002* 0.014±0.001 0.014±0.002<br />
Values are reported with 95% confi<strong>de</strong>nce limit (n = 10).<br />
* Information Values<br />
For all analyzed CRMs: SRM 2709, NCS ZC 85006 and IAEA-359,<br />
good agreements of the results obtained by TD-AAS and CV-AFS with the<br />
certified values were obtained. No significant statistical differences were<br />
found at the significance level p
COMPARATIVE STUDY OF MERCURY DETERMINATION IN SOIL AND VEGETABLE BY METHODS …<br />
In the regression analysis, satisfactory agreement between the two<br />
sets of results was obtained, the correlation coefficient (r) and the slope (b)<br />
of the regression equation do not differ significantly from the unity and the<br />
intercept does not differ significantly from zero for a 95 % probability level<br />
consi<strong>de</strong>red within this study. The parameters of linear regression are presented<br />
in the Table 3.<br />
Table 3. Linear regression parameters for a 95% confi<strong>de</strong>nce level for mercury<br />
<strong>de</strong>termination in soil and vegetables by TD-AAS and CV-AFS<br />
Regression analysis Values<br />
Intercept -5.667±15.497<br />
Slope 0.984±0.017<br />
Correlation coefficient 0.9987<br />
CONCLUSIONS<br />
A comparison study of performance parameters of two methods used<br />
for Hg <strong>de</strong>termination in solid samples: TD-AAS and wet digestion followed<br />
by CV-AFS was conducted. Detection limits in solid samples are lower in<br />
TD-AAS method, but in the same or<strong>de</strong>r of magnitu<strong>de</strong> for the two methods.<br />
Working range of the both methods make possible the easily <strong>de</strong>termination<br />
with a good accuracy of normal value, the alert threshold and the intervention<br />
threshold for Hg concentration in soil established by Romanian environmental<br />
legislation. The accuracy of methods was verified by the <strong>de</strong>termination of mercury<br />
in the certified reference materials of soil and vegetables an no significant<br />
differences were found at the significance level p
MARIN ŞENILĂ, ERIKA LEVEI, LĂCRIMIOARA ŞENILĂ, OANA CADAR, GABRIELA OPREA, CECILIA ROMAN<br />
32<br />
Reagents, Standard Solutions and CRMs<br />
Stock standard solutions of mercury (1000 mg L −1 ) Merck (Darmstadt,<br />
Germany) was used for instruments calibration. For all dilutions ultrapure<br />
water (18 MΩ cm -1 ) was obtained from a Millipore Direct Q3 (Millipore, France).<br />
SnCl2·2H2O and 30% (v/v) HCl ultrapure both from Merck (Darmstadt,<br />
Germany) were used as reductant reagent for CV-AFS system.<br />
Concentrated HNO3 and HCl suprapure from Merck (Darmstadt,<br />
Germany) were used for samples digestion.<br />
Soil CRM SRM 2709 San Joaquin Soil (New York, USA) and vegetable<br />
CRMs NCS ZC 85006 Tomato (Beijing, China) and IAEA-359 (Vienna, Austria)<br />
were used in the internal quality control of Hg <strong>de</strong>termination.<br />
Oxygen (4.5 quality) for Hydra-C Analyzer and Argon (5.0 quality) for<br />
Hydra-AF Analyzer supplying, both from Lin<strong>de</strong> Gas SRL Cluj-Napoca, Romania<br />
were used.<br />
Direct Hg <strong>de</strong>termination in solid samples<br />
Soil and vegetable samples were collected in Jully 2009 from Ferneziu,<br />
Baia Mare, NW of Romania. Ferneziu is a district of Baia Mare, situated in the<br />
north-east of it. This is located near to plant ROMPLUMB, whose activity has<br />
caused extensive pollution of the area with heavy metals [27-29].<br />
Soils were sieved through a 2 mm sieve in or<strong>de</strong>r to eliminate stones<br />
and other materials extraneous to soil, and then stored in polyethylene bags<br />
for transport to the laboratory. The sieved soils were spread over a polyethylene<br />
sheet and air-dried at room temperature for one week. Samples were<br />
ground to a fine pow<strong>de</strong>r in a tungsten-carbi<strong>de</strong> swing mill for 3 min and sieved<br />
through 100 micron mesh sieve. The fraction below 100 microns was further<br />
homogenised by mixing in a PVC drum for 1 h, then stored in brown glass<br />
bottles at room temperature until analysis. The vegetable samples were dried<br />
in oven, groun<strong>de</strong>d using a grin<strong>de</strong>r and sieved through 100 micron mesh sieve.<br />
The Hydra-C Hg Analyzer inclu<strong>de</strong>s a furnace module in that the sample<br />
is dried and <strong>de</strong>composed at high temperature that assures a homogenous<br />
<strong>de</strong>composition of sample. Decomposition products are carried to a catalyst<br />
by an oxygen flow, where sample oxidation is completed and halogens and<br />
nitrogen/sulphur oxi<strong>de</strong>s are trapped. The final <strong>de</strong>composition products pass<br />
through a mercury amalgamator which collects Hg 0 . By heating of amalgamation<br />
tube, mercury is released and carried to the atomic absorption spectrometer.<br />
The transient signal is measured in series by two cells: a high sensitivity<br />
cell and a low sensitivity cell. The samples were weighted in nickel boats.<br />
Table 4 shows the instrument parameters employed for soils and vegetables.<br />
Calibration was completed using aqueous standards prepared in 10%<br />
HNO3. Working standards were blank, 0.1, and 1.0 ppm at six different injection<br />
weights. The calibration curve plots microabsorbance vs total mercury injected.
COMPARATIVE STUDY OF MERCURY DETERMINATION IN SOIL AND VEGETABLE BY METHODS …<br />
Table 4. Instrumental parameters of TD-AAS system<br />
Parameter Setting<br />
Dry 300°C for 45 sec.<br />
Decomposition 800°C for 150 sec.<br />
Catalyst 600°C<br />
Catalyst Wait Period 60 sec.<br />
Gold Trap 700°C for 30 sec.<br />
Measurement 90 sec.<br />
Oxygen Flow Rate 300 mL min -1<br />
Determination of Hg by wet digestion and CV-AFS<br />
Amounts of 1.000 g soil were digested with 10 ml aqua regia in closed<br />
PTFE containers of the microwave system. For vegetable, amounts of 1.000 g<br />
sample were digested with 6 ml concentrated nitric acid and 2 ml hydrogen<br />
peroxi<strong>de</strong> in closed PTFE containers of the microwave system. After cooling<br />
to room temperature, the slurry was diluted to 100 ml with ultrapure water<br />
and then filtered un<strong>de</strong>r vacuum through a 0.45 μm cellulose membrane using<br />
the Sartorius vacuum filter equipment. At the end of this process, clear solutions<br />
were obtained. Digested samples were analyzed by CV-AFS method. Hydra<br />
AF is a continuous flow system where sample and reductant, in this case<br />
2% SnCl2·2H2O in 3.6% (v/v) HCl ultrapure, are pumped into a gas/liquid<br />
separator. There the mercury in the sample is reduced to elemental<br />
mercury, which enters in the gas phase and is carried to the spectrometer.<br />
Instrument parameters are provi<strong>de</strong>d in the Table 5.<br />
ACKNOWLEDGMENTS<br />
Table 5. Instrumental parameters of CV-AFS system<br />
Parameter Setting<br />
Argon Flow Rate 700 mL min -1<br />
Sample Flow Rate 5 mL min -1<br />
Reductant Flow Rate 1 mL min -1<br />
Uptake time 20 sec.<br />
Rinse time 60 sec.<br />
Integration time 15 sec.<br />
The present investigations are supported by the Romanian Ministry of Education<br />
and Research, PNCDI II Program (Project CISPPA no. 52157/2008).<br />
33
MARIN ŞENILĂ, ERIKA LEVEI, LĂCRIMIOARA ŞENILĂ, OANA CADAR, GABRIELA OPREA, CECILIA ROMAN<br />
34<br />
REFERENCES<br />
1. M. Morita, J. Yoshinaga, J. Edmonds, Pure & Appl. Chem., 1998, 70, 1585.<br />
2. F.M.M. Morel, A.M.L. Kraepiel, M. Amyot, Annu. Rev. Ecol. Syst., 1998, 29, 543.<br />
3. L.D. Hylan<strong>de</strong>r, M.E. Goodsite, Sci. Total Environ., 2006, 638, 352.<br />
4. A.G. Bravo, J. Loizeau, L. Ancey, V. Ungureanu, J. Dominik, Env. Sci. Pollut. Res.,<br />
2009, 16-S1, 66.<br />
5. K. Leopold, M. Foulkes, P. Worsfold, Anal. Chim. Acta, 2010, 663, 127.<br />
6. V.L. Dressler, E.M.M. Flores, D. Pozebon, L.E. Kaercher, J. Anal. At. Spectrom., 2002,<br />
17, 790.<br />
7. P.R. Aranda, R.A. Gil, S. Moyano, I. De Vito, L.D. Martinez, J. Hazard. Mater., 2009,<br />
161, 1399.<br />
8. H. Ashkenani, S. Dadfarnia, A.M.H. Shabani, A.A. Jaffari, A. Behjat, J. Hazard. Mater.,<br />
2009, 161, 276.<br />
9. M.J. Chang, R.L. McDaniel, J.D. Naworal, D.A. Self, J. Anal. At. Spectrom., 2002, 17, 710.<br />
10. I. López, S. Cuello, C. Camara, Y. Madrid, Talanta, 2010, 82, 594.<br />
11. J.L. Rodrigues, S.S. <strong>de</strong> Souza, V.C. <strong>de</strong> Oliveira Souza, F. Barbosa, Talanta, 2010,<br />
80, 1158.<br />
12. A. Krata, E. Bulska, Spectrochim. Acta Part B, 2005, 60, 345<br />
13. O.T. Butler, J.M. Cook, C.F. Harrington, S.J. Hill, J. Rieuwerts, D.L. Miles, J. Anal.<br />
At. Spectrom., 2007, 22, 187.<br />
14. C. Lomonte, D. Gregory, A.J.M. Baker, S.D. Kolev, Chemosphere, 2008, 72, 1420.<br />
15. F.X. Han, W.D. Patterson, Y. Xial, S.B.B. Maruthi, Y. Su, Water Air Soil Pollut.,<br />
2006, 170, 161.<br />
16. A. Collasiol, D. Pozebon, S.M. Maia, Anal. Chim. Acta, 2004, 518, 157.<br />
17. A. Zierhut, K. Leopold, L. Harwardt, M. Schuster, Talanta, 2010, 81, 1529.<br />
18. C. Fernan<strong>de</strong>z, A.C.L. Conceicao, R. Rial-Otero, C. Vaz, J.L. Capelo, Anal. Chem.,<br />
2006, 78, 2494.<br />
19. Y. Li, C. Zheng, Q. Ma, L. Wu, C. Hu, X. Hou, J. Anal. At. Spectrom., 2006, 21, 82.<br />
20. K. Leopold, M. Foulkes, P.J. Worsfold, Anal. Chem., 2009, 81, 3421.<br />
21. Xun Li, Z. Wang, Anal. Chim. Acta, 2007, 588, 179.<br />
22. Garcia-Sanchez, A. Murciego, E. Alvarez-Ayuso, I. Santa Regina, M.A. Rodriguez-<br />
Gonzalez, J. Hazard. Mater, 2009, 168, 1319.<br />
23. M.J. Sierra, R. Millan, E. Esteban, Food Chem. Toxicol., 2009, 47, 2761.<br />
24. J. Canario, C. Vale, L. Poissant, M. Nogueira, M. Pilote, V. Branco, J. Environ.<br />
Sci., 2010, 22, 1151.<br />
25. A. Sahuquillo, G. Rauret, M. Bianchi, A. Rehnert, H. Muntau, Anal. Bioanal. Chem.,<br />
2003, 375, 578.<br />
26. Teledyne Instruments Leeman Labs, Hydra-C automated direct Hg Analyzer,<br />
Operations Manual.<br />
27. E. Levei, M. Senila, C. Roman, M. Ponta, T. Frentiu, E. Cordos, Studia UBB<br />
Chemia, 2008, 3, 51.<br />
28. M. Miclean, E. Levei, M. Senila, B. Abraham, C. Roman, E. Cordos, Studia UBB<br />
Chemia, 2008, 3, 57.<br />
29. T. Frentiu, M. Ponta, E. Levei, E. Gheorghiu, M. Benea, E. Cordos, Chem. Spec.<br />
Bioavailab., 2008, 20, 99.
STUDIA UBB CHEMIA, LVI, 1, 2011<br />
ANALYSIS IN TERMS OF THE WILSON, NRTL (NON RANDON TWO<br />
LIQUIDS) AND UNIQUAC MODELS OF THE EXPERIMENTAL VAPOR -<br />
LIQUID EQUILIBRIUM DATA IN BINARY AND TERNARY SYSTEMS<br />
CONTAINING {(1R,4S)-(+)-FENCHONE, METHYL CHAVICOL<br />
AND TRANS-ANETHOLE}<br />
IOAN BÂTIU a<br />
ABSTRACT. The experimental vapor-liquid equilibrium data (VLE) in binary<br />
and ternary systems containing {(1R,4S)-(+)-fenchone, methyl chavicol<br />
and trans-anethole}, reported in previous <strong>papers</strong>, were correlated by means<br />
of Wilson, NRTL and UNIQUAC equation. The binary parameters of the<br />
corresponding mo<strong>de</strong>ls were calculated. The Wilson, NRTL and UNIQUAC<br />
parameters obtained from the isobaric T-x-y measurements at P=4000 Pa in<br />
binary systems were used to calculate the VLE data in the ternary system at<br />
the same pressure. A comparison with the experimental VLE data was done.<br />
The accuracy of the correlation is satisfactory. The Wilson, NRTL (Non<br />
Randon Two Liquids) and UNIQUAC mo<strong>de</strong>ls are the most useful mo<strong>de</strong>ls<br />
to correlate the experimental vapor – liquid equilibrium data.<br />
Keywords: Vapor - liquid equilibria, Terpenoids, Wilson, NRTL, UNIQUAC.<br />
INTRODUCTION<br />
(1R,4S)-(+)-Fenchone [(1R,4S)-(+)-1,3,3-trimethylbicyclo[2.2.1]heptan-<br />
2-one], methyl chavicol [4-allyl-1-methoxybenzene] and trans-anethole [trans-<br />
1-methoxy-4(prop-1-en-1-yl) benzene] are the main components of the essential<br />
oil from the fruits of bitter fennel (Foeniculum vulgare Mill, fam. Umbelliferae).<br />
Both the raw essential oils and its isolated pure components are used in<br />
perfumery, cosmetics, pharmacy, aromatherapy and food industry [1].<br />
Generally, essential oil components belong to the terpenoid class.<br />
Terpenoids are natural products comprising a large number of compounds<br />
with complicate chemical structures. Many essential oil components are<br />
monoterpenoids (C10) and sesquiterpenoids (C15), acyclic, monocyclic or<br />
bicyclic, saturated or unsaturated.<br />
Batch distillation is an important unit operation frequently used for small<br />
scale production. Batch distillation is preferably to continuous distillation when<br />
small quantities of high value ad<strong>de</strong>d chemicals and biochemicals need to<br />
separate. The main components of the essential oil are high value ad<strong>de</strong>d<br />
chemicals.<br />
a Universitatea Babeş-Bolyai, <strong>Facultatea</strong> <strong>de</strong> <strong>Chimie</strong> <strong>şi</strong> <strong>Inginerie</strong> <strong>Chimică</strong>, Str. Kogălniceanu,<br />
Nr. 1, RO-400084 Cluj-Napoca, Romania, batiu@chem.ubbcluj.ro
36<br />
IOAN BÂTIU<br />
There are two basic mo<strong>de</strong> of operating batch distillation column:<br />
constant reflux ration and variable product composition, respectively variable<br />
reflux ratio and constant key component composition. Also, there is the third<br />
mo<strong>de</strong> of operation where neither the reflux ratio no the product composition<br />
is kept constant. This type of operation is possible in batch distillation and is<br />
known as the optimal reflux or the optimal control policy [2].<br />
The second mo<strong>de</strong> of operation is used to obtain the keys components<br />
of high purity. The main components separate function of their boiling points.<br />
The first key component distils at the lower temperature than the second<br />
key component. The third component distils at the higher temperature than<br />
the second key component. To reduce the energy consumes in the reboiler<br />
and to eliminate <strong>de</strong>gradation of the key components it is necessary to adjust<br />
the pressure insi<strong>de</strong> the batch distillation column.<br />
Accurate isobaric vapor-liquid equilibrium data are necessary for the<br />
<strong>de</strong>sign and optimization of the batch distillation column. The literature [3, 4]<br />
is very poor in the vapor - liquid equilibrium data in the field of terpenoids.<br />
The chemical structures of the main components of the essential<br />
oils of fennel are presented in Figure 1. The names of the components referred<br />
to in this paper are: (+)-fenchone, methyl chavicol and trans-anethole.<br />
CH3<br />
O<br />
CH 3<br />
OCH 3<br />
OCH 3<br />
H<br />
C C<br />
CH3 CH2 CH=CH2<br />
H CH3 (1R,4S)-(+)-Fenchone Methyl chavicol trans-Anethole<br />
Figure 1. Chemical structure of (1R,4S)-(+)-fenchone, methyl chavicol<br />
and trans-anethole<br />
RESULTS AND DISCUSSIONS<br />
In the binary systems containing {(+)-fenchone, methyl chavicol and<br />
trans-anethole} the values of the experimental activity coefficients, γi are<br />
ranging from ca. 0.75 to ca. 1.08. The experimental fugacity coefficients, ϕi<br />
are very close to unity [5]. This means that a quasi-i<strong>de</strong>al behavior of the liquid<br />
phase and i<strong>de</strong>al behavior of the vapor phase can be consi<strong>de</strong>red.<br />
Reduction of the experimental VLE data by non-electrolyte<br />
solutions mo<strong>de</strong>ls<br />
The experimental VLE data of the all binary systems have been<br />
correlated by means of the Wilson [6], NRTL [7, 8] and UNIQUAC [9] activity<br />
coefficient, γi equations (eq. 1- 12).
ANALYSIS IN TERMS OF THE WILSON, NRTL (NON RANDON TWO LIQUIDS) AND UNIQUAC MODELS<br />
The Wilson equations:<br />
( ) ⎟ ⎛ Λ12<br />
lnγ<br />
1 = −ln<br />
x1<br />
+ Λ12x2<br />
+ x2<br />
⎜<br />
⎝ x1<br />
+ Λ12x2<br />
Λ ⎞ 21 −<br />
Λ21x1<br />
+ x2<br />
⎠<br />
(1)<br />
( ) ⎟ ⎛ Λ12<br />
lnγ<br />
⎜<br />
2 = − ln x2<br />
+ Λ 21x1<br />
− x1<br />
⎝ x1<br />
+ Λ12<br />
x2<br />
Λ 21 ⎞<br />
−<br />
Λ 21x1<br />
+ x2<br />
⎠ (2)<br />
L<br />
V2 ⎛ λ12<br />
− λ11<br />
⎞<br />
Λ12<br />
= exp⎜−<br />
L<br />
⎟<br />
V1<br />
⎝ RT ⎠<br />
L<br />
V1 ⎛ λ21<br />
− λ22<br />
⎞<br />
Λ21<br />
= exp⎜−<br />
L<br />
⎟<br />
V2<br />
⎝ RT ⎠ (3)<br />
where: γi is the activity coefficient of component i; xi is the mole fraction of<br />
component i; in the liquid phase, Vi L is the molar volume of component i;<br />
( 12 , 21)<br />
Λ Λ and [ ( λ12 − λ11<br />
) , ( λ21<br />
− λ22<br />
) ] are two adjustable parameters of the<br />
Wilson mo<strong>de</strong>l.<br />
The NRTL equations<br />
lnγ<br />
⎡ ⎛ G21<br />
⎢τ<br />
21 ⎜<br />
⎢⎣<br />
⎝ x1<br />
+ x2G<br />
⎞<br />
⎟<br />
⎠<br />
⎛<br />
+ ⎜<br />
⎝<br />
lnγ<br />
2<br />
2<br />
⎡<br />
2 ⎛ G ⎞ ⎛<br />
12<br />
x ⎢ ⎜<br />
⎟ + ⎜<br />
1 τ12<br />
⎜<br />
⎢⎣<br />
⎝ x2<br />
+ x1G12<br />
⎠ ⎝<br />
τ G<br />
1 2<br />
g12<br />
− g22<br />
g21<br />
− g11<br />
τ12<br />
= ; τ 21 =<br />
RT RT<br />
G = exp( −α<br />
τ ); a = ( g − g ); α = α<br />
ij<br />
2<br />
1 = x2<br />
2<br />
τ G<br />
2<br />
21<br />
2 1 12<br />
⎞⎤<br />
⎟<br />
⎠⎦<br />
⎞⎤<br />
⎟<br />
⎠⎦<br />
( ) ⎥ ⎥<br />
12 12<br />
x + x G ⎟<br />
= 2<br />
21<br />
ij<br />
ij<br />
ij<br />
ij<br />
( ) ⎥ ⎥<br />
21 21<br />
x + x G ⎟<br />
where: γi is the activity coefficient of component i; xi is the mole fraction of<br />
component i; in the liquid phase, ( τ 12 , τ 21)<br />
and [ ( g12 − g 22 ) , ( g 21 − g11<br />
) ] are<br />
two adjustable parameters of the NRTL mo<strong>de</strong>l; α is the third parameter of<br />
the NRTL mo<strong>de</strong>l.<br />
The UNIQUAC equations<br />
The activity coefficient, γi is calculated as the sum of two terms (eq. 7):<br />
C<br />
i<br />
R<br />
i<br />
jj<br />
ln γ = lnγ<br />
+ lnγ<br />
(7)<br />
i<br />
ij<br />
ji<br />
(4)<br />
(5)<br />
(6)<br />
37
IOAN BÂTIU<br />
where: the combinatorial part (lnγi C ) accounts for entropic effects, while the<br />
residual part (γi R ) <strong>de</strong>scribes the interactions between the different groups<br />
from molecule. For a binary system:<br />
C φ<br />
⎛ ⎞<br />
1 ⎛ z ⎞ θ1<br />
r1<br />
lnγ 1 = ln + ⎜ ⎟q1<br />
ln + φ2<br />
⎜<br />
⎜l1<br />
− l2<br />
⎟<br />
x1<br />
⎝ 2 ⎠ φ1<br />
⎝ r2<br />
⎠<br />
(8)<br />
C φ<br />
⎛ ⎞<br />
2 ⎛ z ⎞ θ2<br />
r2<br />
lnγ 2 = ln + ⎜ ⎟q2<br />
ln + φ1<br />
⎜<br />
⎜l2<br />
− l1<br />
⎟<br />
x2<br />
⎝ 2 ⎠ φ2<br />
⎝ r1<br />
⎠<br />
(9)<br />
( ) ⎟ R<br />
⎛ τ<br />
⎞<br />
21 τ12<br />
lnγ<br />
1 = −q1<br />
ln θ1<br />
+ θ2τ<br />
21 + θ2q1<br />
⎜ −<br />
⎝θ1<br />
+ θ2τ<br />
21 θ2<br />
+ θ1τ<br />
12 ⎠<br />
(10)<br />
( ) ⎟ R<br />
⎛ τ<br />
⎞<br />
12 τ 21<br />
lnγ<br />
2 = −q2<br />
ln θ1τ<br />
12 + θ2<br />
+ θ1q2<br />
⎜ −<br />
⎝θ1τ<br />
12 + θ2<br />
θ1<br />
+ θ2τ<br />
21 ⎠<br />
⎛ u21 − u11<br />
⎞ ⎛ u12<br />
− u22<br />
⎞<br />
τ 21 = exp⎜− ⎟;<br />
τ12<br />
= ⎜−<br />
⎟<br />
⎝ RT ⎠ ⎝ RT ⎠<br />
(11)<br />
⎛ z ⎞<br />
⎛ z ⎞<br />
l1<br />
= ⎜ ⎟(<br />
r1<br />
− q1)<br />
− ( r1<br />
−1)<br />
; l2<br />
= ⎜ ⎟(<br />
r2<br />
− q2<br />
) − ( r2<br />
−1)<br />
; z = 10<br />
⎝ 2 ⎠<br />
⎝ 2 ⎠<br />
(12)<br />
θ i =<br />
qi<br />
xi<br />
q x<br />
; i = 1,<br />
2 Φ i =<br />
ri<br />
xi<br />
r x<br />
; i = 1,<br />
2<br />
∑<br />
j j<br />
j j<br />
j<br />
j<br />
where: xi is the mole fraction of component i; in the liquid phase, θi is the<br />
area fraction of component i; Φi is the segment fraction of component i<br />
which is similar to volume fraction. Pure component parameters r, and qi<br />
are measures of molecular van <strong>de</strong>r Waals volumes and molecular surface<br />
area, respectively; (τ12, τ21) and [ ( u12 − u22<br />
) , ( u21<br />
− u11<br />
) ] are two adjustable<br />
parameters of the UNIQUAC mo<strong>de</strong>l.<br />
The Wilson, NRTL and UNIQUAC adjustable parameters must be<br />
evaluated from experimental vapor-liquid equilibrium data. They are used to<br />
calculate vapor-liquid equilibrium data at other pressures than those from<br />
which were calculated. The pressure insi<strong>de</strong> the batch distillation column is<br />
chosen taking into consi<strong>de</strong>ration the boiling points of the key components<br />
which successively separate at the top of the batch distillation column. Due to<br />
the high boiling points of the terpenoids the pressures insi<strong>de</strong> the batch distillation<br />
column are adjusted at values smaller than the atmospheric pressure.<br />
The Wilson, NRTL and UNIQUAC binary parameters were calculated<br />
from the isobaric T-x-y measurements and from the T-P-x measurements<br />
performed at the constant liquid phase compositions, xi, respectively by<br />
minimizing the following objective functions (S):<br />
38<br />
∑
ANALYSIS IN TERMS OF THE WILSON, NRTL (NON RANDON TWO LIQUIDS) AND UNIQUAC MODELS<br />
• the maximum likelihood multimo<strong>de</strong>l fitting method [10] (eq. 13)<br />
2 2<br />
2 2<br />
2 2<br />
2 2<br />
[ ( P - P ) / + ( T - T ) / σ + ( x - x ) / σ + ( y - y ) / σ ]<br />
N<br />
S = ∑ ie ic σ (13)<br />
P ie ic T ie ic x ie ic y<br />
i=<br />
1<br />
where: N is the number of experimental points, Pie, Tie, xie and yie are the<br />
experimental data and Pic, Tic, xic and yic are the corresponding calculated<br />
values for pressure, temperature, and the liquid and vapor phase compositions,<br />
respectively. In this paper, the standard <strong>de</strong>viation for pressure, temperature, and<br />
liquid and vapor phase compositions were set to σP = 60 Pa, σT = 0.05 K,<br />
σx = 0.003 mol. fr. and σy = 0.003 mol. fr., respectively.<br />
• the boiling points condition, eq. (14):<br />
N<br />
= ∑ [ 1 1 1 12 21 2 2 2 12 21<br />
i=<br />
1<br />
0<br />
0<br />
S 1−<br />
( P / P)<br />
x γ ( A , A ) − ( P / P)<br />
x γ ( A , A )] = min.<br />
(14)<br />
where: N is the number of experimental points, P is the total pressure,<br />
P and P are the vapor pressures of the pure components 1 and 2, A12 and<br />
0<br />
1<br />
0<br />
2<br />
A21 are, respectively, the binary parameters of the Wilson, NRTL and UNIQUAC<br />
mo<strong>de</strong>ls, γ1 and γ2 are the activity coefficients, x1 and x2 are the mole fractions<br />
of the pure components 1 and 2 in the liquid phase.<br />
The purport of the calculated binary parameters, A12 and A21 (eq. 14) is:<br />
[ 12 , Λ 21 Λ ] (Wilson); [ 12 21 ,τ τ ] (NRTL) and [ ) ( ), ( u12 − u22<br />
u21<br />
− u11<br />
] (UNIQUAC),<br />
respectively B12 and B21 (eq. 13): [( λ12 − λ11)<br />
, ( λ21 − λ22)<br />
] (Wilson); [ ( g12 − g22)<br />
,<br />
( g21 − g11)<br />
] (NRTL) and [ ( u 12 − u22)<br />
/ R , R u u / ) ( 21 − 11 ] (UNIQUAC).<br />
The binary parameters of each mo<strong>de</strong>l (A12, A21, respectively B12, B21),<br />
the statistic criterion of the all experimental points (global Ro), the absolute<br />
mean <strong>de</strong>viations in the vapor phase compositions, AMD(y)/mol. fr. and in<br />
pressure, AMD(P)/Pa are reported in Tables 1 - 3.<br />
It should be noted that the values of the binary parameters of the<br />
Wilson, NRTL and UNIQUAC mo<strong>de</strong>ls, for the same isobaric T-x-y measurements,<br />
are not i<strong>de</strong>ntical when the two objective functions are used. Using the same<br />
objective function - the boiling points condition – the calculated binary parameters<br />
from the isobaric T-x-y measurements and from T-P-x measurements are<br />
different. This fact do not affect the VLE prediction if the binary parameters<br />
are used only to calculate VLE data at the same pressure or at others<br />
pressures. Consequently, the vapor phase compositions, yi/mol. fr. at the<br />
pressure of P=4000 Pa and, respectively P=4270 Pa, calculated using the<br />
Wilson, NRTL and UNIQUAC binary parameters obtained from our P-T-xi<br />
experimental data, are in good agreement with our P-T-xi-yi experimental<br />
data (Table 4). The absolute mean <strong>de</strong>viations, AMD(y) and AMD(P) for all<br />
the binary systems are less than 0.01 mol. fr. and respectively 100 Pa.<br />
i<br />
39
40<br />
IOAN BÂTIU
ANALYSIS IN TERMS OF THE WILSON, NRTL (NON RANDON TWO LIQUIDS) AND UNIQUAC MODELS<br />
41
42<br />
IOAN BÂTIU<br />
Table 4. Comparison between experimental isobaric VLE data, T-x-y and calculated<br />
isobaric VLE data, T-x-y using the binary parameters of the Wilson, NRTL (α=0.3)<br />
and UNIQUAC mo<strong>de</strong>ls obtained from T-P-x measurements. Binary systems: (+)-fenchone<br />
+ methyl chavicol (P=4000 Pa and, respectively P=4270 Pa*), (+)-fenchone + transanethole<br />
(P=4000 Pa) and methyl chavicol + trans-anethole (P=4000 Pa).<br />
__________________________________________________________________<br />
Mo<strong>de</strong>ls/Binary systems AMD(y)/mol. fr. AMD(P)/Pa<br />
Wilson<br />
(+)-fenchone + methyl chavicol 0.010 45.00<br />
*(+)-fenchone + methyl chavicol 0.005 100.00<br />
(+)-fenchone + trans-anethole 0.009 78.00<br />
methyl chavicol + trans-anethole 0.010 30.00<br />
NRTL<br />
(+)-fenchone + methyl chavicol 0.010 45.00<br />
*(+)-fenchone + methyl chavicol 0.004 100.00<br />
(+)-fenchone + trans-anethole 0.009 80.00<br />
methyl chavicol + trans-anethole 0.003 70.00<br />
UNIQUAC<br />
(+)-fenchone + methyl chavicol 0.010 50.00<br />
*(+)-fenchone + methyl chavicol 0.005 97.00<br />
(+)-fenchone + trans-anethole 0.009 90.00<br />
methyl chavicol + trans-anethole 0.010 60.00<br />
AMD(y)/mol.fr. - Absolute mean <strong>de</strong>viations in the vapor phase; AMD(P)/Pa - Absolute mean<br />
<strong>de</strong>viations in pressure.<br />
Calculated VLE data in the ternary system (+)-fenchone + methyl chavicol + trans-anethole<br />
using the binary parameters of the Wilson, NRTL and UNIQUAC mo<strong>de</strong>ls<br />
The binary parameters of the Wilson, NRTL and UNIQUAC mo<strong>de</strong>ls,<br />
calculated from isobaric T-x-y data at P=4000 Pa, using the objective function<br />
(S) (eq. 13) - the maximum likelihood multimo<strong>de</strong>l fitting method – have been<br />
used to calculate VLE data in the ternary system {(+)-fenchone + methyl<br />
chavicol + trans-anethole} (Table 5). The absolute mean <strong>de</strong>viations in the<br />
vapor phase composition, AMD(y)/mol.fr. are practicaly the same for all the<br />
mo<strong>de</strong>ls, while absolute mean <strong>de</strong>viation in temperature, AMD(T)/K exhibits<br />
rather small differences. We appreciate that, due to the same <strong>de</strong>viations in the<br />
vapor phase compositions and due to the small <strong>de</strong>viations in the temperature,<br />
the binary parameters of the Wilson, NRTL and UNIQUAC mo<strong>de</strong>ls present<br />
the same accuracy in calculating the vapor liquid equilibrium data.<br />
In a previous paper [11] we checked the predictive capability of the<br />
neuronal networks in the ternary system {(+)-fenchone + methyl chavicol +<br />
trans-anethole}. The vapor phase compositions, yi were calculated after training
ANALYSIS IN TERMS OF THE WILSON, NRTL (NON RANDON TWO LIQUIDS) AND UNIQUAC MODELS<br />
the network consi<strong>de</strong>ring the experimental liquid phase compositions, xi of<br />
all the binary systems as inputs in each neuronal networks. The calculated<br />
vapor phase compositions, yi,c were compared with experimental vapor<br />
phase compositions, yi,exp at the liquid phase compositions, xi of the ternary<br />
system. The absolute mean <strong>de</strong>viation in the vapor phase composition, AMD(y)<br />
was 0.01 mol. fr. (not calculated in paper) proving the better predictive capability<br />
of the VLE data using the neuronal network.<br />
Table 5. Comparison between experimental isobaric VLE data T-x-y of the ternary system<br />
(+)-fenchone + methyl chavicol + trans-anethole and calculated isobaric VLE data T-x-y<br />
data using the binary parameters of the Wilson, NRTL (α=0.3) and UNIQUAC mo<strong>de</strong>ls<br />
obtained from the isobaric VLE data T-x-y of the binary systems at P=4000 Pa<br />
(objective function - the maximum likelihood multimo<strong>de</strong>l fitting method).<br />
__________________________________________________________________<br />
Ternary system/Mo<strong>de</strong>l AMD(y)/mol. fr. AMD(T)/K<br />
(+)-fenchone + methyl chavicol + trans-anethole/<br />
Wilson 0.023 1.29<br />
NRTL (α=0.3) 0.023 1.37<br />
UNIQUAC 0.022 1.13<br />
AMD(y)/mol.fr. - Absolute mean <strong>de</strong>viation in the vapor phase;<br />
AMD(T)/K- Absolute mean <strong>de</strong>viation in temperature.<br />
CONCLUSION<br />
We have presented and correlated the experimental vapor-liquid<br />
equilibrium data (VLE) in binary and ternary systems containing {(1R,4S)-<br />
(+)-fenchone, methyl chavicol and trans-anethole} by means of Wilson,<br />
NRTL and UNIQUAC equation. The binary parameters of the corresponding<br />
mo<strong>de</strong>ls were calculated. The Wilson, NRTL and UNIQUAC parameters obtained<br />
from the isobaric T-x-y measurements at P=4000 Pa in systems which contain<br />
{(+)-fenchone, methyl chavicole and trans-anethole} were used to calculate<br />
the VLE data in the ternary system {(+)-fenchone + methyl chavicole + transanethole}.<br />
The calculated VLE data was compared with experimental VLE<br />
data. The accuracy is satisfactory.<br />
EXPERIMENTAL SECTION<br />
In previous <strong>papers</strong> [12, 13, 14] we reported experimental vapor-liquid<br />
equilibrium data for the following binary and ternary systems: {(+)-fenchone (1)<br />
+ methyl chavicol (2)}; {(+)-fenchone (1) + trans-anethole (2)}; {methyl chavicol (1)<br />
+ trans-anethole (2)}; {(+)-fenchone (1) + methyl chavicol(2) + trans-anethole (3)}.<br />
43
44<br />
IOAN BÂTIU<br />
A series of isobaric T-x-y measurements were performed at (4000±30)<br />
Pa [12, 13, 14]. Another series of T-P-x measurements were performed at<br />
three constant liquid-phase compositions [12, 13]. For the binary system<br />
(+)-fenchone (1) + methyl chavicol (2) a series of isobaric T-x-y measurements<br />
were performed at (4270±30) Pa [12].<br />
VLE data in binary systems were found to be thermodynamically<br />
consistent as tested by using the maximum likelihood multimo<strong>de</strong>l fitting<br />
method <strong>de</strong>scribed by Panaitescu [10]. The thermodynamic consistency of<br />
the isobaric T-x-y measurements in the ternary system was checked using<br />
the McDermott-Ellis method [15] modified by Wisniak and Tamir [16].<br />
REFERENCES<br />
1. G. Radoias, A. Bosilcov, I. Batiu, “Odorante Naturale în Parfumeria Mo<strong>de</strong>rnă” (Natural<br />
Fragrances in Mo<strong>de</strong>rn Parfumery), Editura Casa Cărţii <strong>de</strong> Ştiinţă Cluj-Napoca, 2005.<br />
2. Urmila M. Diwekar, “BATCH DISTILLATION Simulation, Optimal Design and Control”,<br />
Taylor & Francis Washington DC., 1995.<br />
3. I. Wichterle, J. Linek, Z. Wagner and H.V. Kehiaian, „Vapor-Liquid Equilibrium<br />
Bibliographic Database”. 9 th Ed. CD-ROM, ELDATA, Paris, France, 2004.<br />
4. I. Wichterle, J. Linek, Z. Wagner, J.-C. Fontaine, K. Sosnkowska-Kehiaian and H.V.<br />
Kehiaian, „Vapor-Liquid Equilibrium in Mixtures and Solutions. Landolt-Boernstein<br />
Numerical Data and Functional Relationships in Science and Technology, New Series”.<br />
W. Martienssen, Ed.,Vol.IV/13A. Springer-Verlag, Berlin-Hei<strong>de</strong>lberg, Germany, 2007.<br />
5. I. Bâtiu, Ph.D. Thesis “Contributions to the separation process and high ad<strong>de</strong>d<br />
value of the essential oils” (Contribuţii la tehnologia <strong>de</strong> separare <strong>şi</strong> valorificare<br />
superioară a uleiurilor volatile) Cluj-Napoca, 1995.<br />
6. G.M. Wilson, J. Am. Chem.Soc., 1964, 86, 127.<br />
7. H. Renon and J.M. Prausnitz, A. I. Ch. E. Journal, 1968, 14, 135.<br />
8. H. Renon and J.M. Prausnitz, Ind. and Eng. Chem. Process. Des. Dev., 1969, 8, 413.<br />
9. D.S. Abrams and J.M. Prausnitz, A. I. Ch. Journal, 1975, 21, 116.<br />
10. G. M. Panaitescu, Rev. Chim., 1982, 33 (12), 1110; Ind. Chem. Eng., 1985, 25, 68.<br />
11. M. Cristea, I. Batiu, Rev. Roumaine <strong>de</strong> <strong>Chimie</strong>, 2005, 50,1009.<br />
12. Batiu, E. Jurgea, G.M. Panaitescu, ELDATA: Int. Electron. J. Phys.-Chem. Data,<br />
1995, 1, 39.<br />
13. I. Batiu, G.M. Panaitescu, M. Peia, ELDATA: Int. Electron. J. Phys.-Chem. Data,<br />
1995, 1, 117.<br />
14. I. Batiu, ELDATA: Int. Electron. J. Phys.-Chem. Data, 1995, 1, 303.<br />
15. C. Mc Dermott, S.R.M. Ellis, Chem. Eng. Sci., 1965, 20, 293.<br />
16. J. Wisniak, A. Tamir, J. Chem. Eng. Data, 1977, 22, 253.
STUDIA UBB CHEMIA, LVI, 1, 2011<br />
COMPARATIVE STUDY OF DIFFERENT OILS AND FATS<br />
IMPREGNATED THIN-LAYER CHROMATOGRAPHIC LAYERS<br />
FOR THE AMINO ACIDS LIPOPHILICITY ESTIMATION<br />
DORINA CASONI a *, COSTEL SÂRBU a<br />
ABSTRACT. The chromatographic behavior of a series of amino acids<br />
compounds was investigated on silica gel chromatographic plates impregnated<br />
with various oils (paraffin, olive, sunflower and corn) and different animal fats<br />
(pig, pullet, sheep and bear) using mixture of methanol-phosphate buffer in<br />
different proportions as mobile phase. The relevance of the obtained results<br />
was evaluated by a critical comparison of the lipophilicity parameters with<br />
different theoretical lipophilicity and solubility indices. Also some correlation<br />
matrices and diagrams were <strong>de</strong>veloped for a comparative evaluation of the<br />
studied impregnated stationary phases. The results indicated that the oils<br />
and some animal fats (pullet and bear) impregnated silica gel plates can be<br />
a good alternative in the field of chromatographic lipophilicity estimation of<br />
amino acids. In addition, the PCA methodology proved again to offer a realistic<br />
characterization of the impregnated plates, both from the retention mechanism<br />
and lipophilicity point of view.<br />
Keyords: TLC, lipophilicity, amino acids, impregnated TLC plates<br />
INTRODUCTION<br />
A problem that continues to eva<strong>de</strong> researchers is a complete<br />
un<strong>de</strong>rstanding of how proteins fold into their native state. The importance of<br />
this problem lies in the interactions of the individual amino acids that make up<br />
the tertiary structure. From the four types of involved interactions (hydrophobic/<br />
lipophilic, electrostatic, hydrogen bonding, and van <strong>de</strong>r Waals), the hydrophobic/<br />
lipophilic ones are believed to be the most significant [1] giving consi<strong>de</strong>rable<br />
insights into how a protein is going to fold. A better un<strong>de</strong>rstanding of these<br />
interactions can be provi<strong>de</strong>d by the lipophilicity concept that has been examined<br />
for many <strong>de</strong>ca<strong>de</strong>s in absorption, permeability, toxicity and in vivo distribution of<br />
organic compounds [2]. Over the years, a vast amount of work has been done<br />
in measuring amino acids lipophilicity in or<strong>de</strong>r to find a universal amino acid<br />
lipophilicity scale that would be i<strong>de</strong>al in examining the interactions of<br />
a Babeş-Bolyai University, Faculty of Chemistry and Chemical Engineering, Arany Janos Str. No 11,<br />
RO-400028 Cluj Napoca, Romania, *casoni_dorina@yahoo.com
46<br />
DORINA CASONI, COSTEL SÂRBU<br />
transmembrane pepti<strong>de</strong> segments with lipid bilayers (the natural environment<br />
of such pepti<strong>de</strong>s) [3]. The lipophilicity, <strong>de</strong>fined as the ten<strong>de</strong>ncy of a compound<br />
to partition between non-polar and aqueous environments, is most commonly<br />
measured directly using the shake-flask technique (when lipophilicity is<br />
expressed by log Pow or log kow values) or indirectly using reversed-phase<br />
liquid chromatography (when lipophilicity is expressed by log kw or RM0 values).<br />
Because of some advantages, nowadays the shake-flask technique has been<br />
success<strong>full</strong>y replaced by chromatographic methods such as high performance<br />
liquid chromatography RP-HPLC [4-7] and thin layer chromatography (RP-<br />
HPTLC) [8-10]. Concerning the experimental estimation of lipophilicity, the<br />
chromatographic procedures offer large possibilities, the combinations between<br />
both stationary and mobile phases being practically unlimited. Furthermore, the<br />
possibility of impregnation of the HPTLC plates with a series of oils more or<br />
less lipophilic may suggest the retention mechanism and may <strong>de</strong>fine them in<br />
the context of the strength of lipophilicity character. In addition, the chemical<br />
composition of vegetable oils (trigliceri<strong>de</strong>s, free fatty acids, lipophilic vitamins)<br />
and of animal fats (high concentration of saturated fatty acids and cholesterol)<br />
may enable their use as new realistic mo<strong>de</strong>ls for the mimesis of biological<br />
membranes. Over the years, the paraffin oil [11], silicon oil [12, 13] vegetable<br />
oils and different animal fats [14] were success<strong>full</strong>y used for the impregnation<br />
of TLC-plates in or<strong>de</strong>r to change the stationary phase characteristics and<br />
improve the chromatographic performance. Consi<strong>de</strong>ring that the lipophilicity<br />
experiments are performed mainly to evi<strong>de</strong>nce in the in vivo behavior of active<br />
compounds, it may be appreciated that actually is still a need for continuously<br />
improvement of the stationary phases in or<strong>de</strong>r to offer a realistic alternative<br />
to the investigations of the biological membranes properties.<br />
In the above consi<strong>de</strong>rations, the purpose of this work was to investigate<br />
the chromatographic behavior of the amino acids on different oils and fats<br />
impregnated TLC silica gel plates and evaluate their lipophilicity by using<br />
also different computed log P values.<br />
THEORETICAL BACKGROUND<br />
The most popular lipophilicity indices measured by RP-HPTLC are<br />
<strong>de</strong>rived from the retention factor (RF) according to Bate-Smith and Westall [15]<br />
equation:<br />
RM = log (1/RF – 1) (1)<br />
The direct influence of the organic modifier concentration from the<br />
mobile phase over the RM values is <strong>de</strong>scribed by the linear relationship<br />
expressed by the Soczewiński-Wachtmeister equation:<br />
RM = RM0 + bC (2)
COMPARATIVE STUDY OF DIFFERENT OILS AND FATS IMPREGNATED THIN-LAYER …<br />
were RM0 is the extrapolated value to a zero fraction of organic component in the<br />
mobile phase composition, b is the regression slope frequently associated with<br />
the specific hydrophobic surface area of the stationary phase and C represents<br />
the volume fraction of the organic solvent in the mobile phase composition.<br />
Many studies suggested that the biological activity cannot be associated only<br />
with RM0 values, especially when polar interactions may take place. The specific<br />
hydrophobic surface area of the compounds plays an important role, a confirmed<br />
fact by the RM0 and b correlation [16]. Due to the advanced computerized<br />
procedures of multivariate data analysis, more recently, the Principal Component<br />
Analysis (PCA) has been success<strong>full</strong>y applied to <strong>de</strong>velop new lipophilicity<br />
indices based on the RF and RM values [17,18]. The methodology based on<br />
PCA is not only more robust to different errors but it is also more informative.<br />
Usually, scatterplot of the first principal components produces charts in which<br />
the coordinates of the analytes reproduce the most variance of the input<br />
chromatographic data [19]. In addition, the first principal components can offer<br />
more efficient alternatives for characterization and ranking of investigated<br />
compounds and stationary phases including new insights into the chromatographic<br />
behavior of the compounds and the retention mechanism.<br />
RESULTS AND DISCUSSION<br />
For the studied amino acids, the use of different oils and animal fats<br />
impregnated silica gel plates revealed a linear <strong>de</strong>pen<strong>de</strong>nce of retention<br />
parameters (RM) with methanol fraction in the mobile phase, the regression<br />
<strong>de</strong>termination coefficient being higher than 0.98 in all cases. These<br />
chromatographic regularities are supported by the profiles of retention<br />
parameters representation (Figure 1a and Figure 1b) that also illustrate high<br />
similarities in chromatographic behavior of compounds between oils impregnated<br />
stationary phases and also between animal fats impregnated stationary phases.<br />
This representation proves to be a very good way also for emphasizing the<br />
some specific interactions with stationary phases as it is highlighted for<br />
phenylalanine on RP-18W and oils impregnated plates (Figure 1a).<br />
All the computed lipophilicity indices (Table 1 and Table 2) and the<br />
experimental ones (Table 3 and respectively Table 4) expressed by mean<br />
of retention parameters (mRM), those obtained by extrapolation (RM0), and<br />
respectively those obtained by applying PCA on the RM values (PC1/RM)<br />
show the histidine, arginine and respectively lysine as the most lipophilic<br />
compounds exception in case of RP-18W stationary phase were phenylalanine<br />
followed by tyrosine and respectively leucine seem to have the highest<br />
lipophilicity. The particular distinct behavior of lysine, arginine and histidine in<br />
case of the impregnated TLC stationary phases (Figure 2) might be attributed<br />
to possible specific (hydrogen bond or N-N pair) interactions with some of the<br />
principal constituents (lipids, triglyceri<strong>de</strong>s, fatty acids, lipoproteins) of the used<br />
fats and oils. These interactions seem to change the retention characteristics<br />
of the stationary phases and influence the behavior of the compounds containing<br />
47
48<br />
DORINA CASONI, COSTEL SÂRBU<br />
multiple amino groups. These consi<strong>de</strong>rations are very well supported by the<br />
new “lipophilicity charts” provi<strong>de</strong>d by the scores corresponding to RM values<br />
onto the planes <strong>de</strong>scribed by the first two principal components (PC1 and<br />
respectively PC2 obtained by applying principal component analysis to RM<br />
values) (Figure 3). The applied methodology classified the specified compounds<br />
as outliers of the group in all cases.<br />
R M values<br />
R M values<br />
0.20<br />
0.00<br />
-0.20<br />
-0.40<br />
-0.60<br />
-0.80<br />
-1.00<br />
-1.20<br />
-1.40<br />
1.40<br />
1.00<br />
0.60<br />
0.20<br />
-0.20<br />
-0.60<br />
-1.00<br />
RP-18W chromatographic plates<br />
Leu<br />
Lys<br />
Met<br />
Phe<br />
Val<br />
Cys<br />
Gly<br />
Pro<br />
Ser<br />
Tyr<br />
Arg<br />
His<br />
Ala<br />
Asn<br />
Asp<br />
Glu<br />
Compounds<br />
Olive oil impregnated silica gel plates<br />
Leu<br />
Lys<br />
Met<br />
Phe<br />
Val<br />
Cys<br />
Gly<br />
Pro<br />
Ser<br />
Tyr<br />
Arg<br />
His<br />
Ala<br />
Asn<br />
Asp<br />
Glu<br />
Compounds<br />
R M values<br />
1.20<br />
0.80<br />
0.40<br />
0.00<br />
-0.40<br />
-0.80<br />
-1.20<br />
20% MeOH<br />
40% MeOH<br />
60% MeOH<br />
80% MeOH<br />
90% MeOH<br />
mR M<br />
20% MeOH<br />
40% MeOH<br />
60% MeOH<br />
80% MeOH<br />
90% MeOH<br />
mR M<br />
R M values<br />
R M values<br />
1.20<br />
0.80<br />
0.40<br />
0.00<br />
-0.40<br />
-0.80<br />
-1.20<br />
1.20<br />
0.80<br />
0.40<br />
0.00<br />
-0.40<br />
-0.80<br />
-1.20<br />
Corn oil impregnated silica gel plates<br />
Leu<br />
Lys<br />
Leu<br />
Lys<br />
Meth<br />
Phe<br />
Val<br />
Cys<br />
Gly<br />
Pro<br />
Ser<br />
Tyr<br />
Arg<br />
His<br />
Ala<br />
Asn<br />
Asp<br />
Glu<br />
Compounds<br />
Paraffin oil impregnated silica gel plates<br />
Met<br />
Phe<br />
Val<br />
Cys<br />
Gly<br />
Pro<br />
Ser<br />
Compounds<br />
Tyr<br />
Arg<br />
His<br />
Ala<br />
Sunflower oil impregnated silica gel plates<br />
As n<br />
As p<br />
Leu<br />
Lys<br />
Met<br />
Phe<br />
Val<br />
Cys<br />
Gly<br />
Pro<br />
Ser<br />
Tyr<br />
Arg<br />
His<br />
Ala<br />
Asn<br />
Asp<br />
Glu<br />
Compounds<br />
20% MeOH<br />
40% MeOH<br />
60% MeOH<br />
80% MeOH<br />
90% MeOH<br />
mRM<br />
Figure 1a. Profiles of RM values for all fraction of methanol on the investigated RP<br />
and oils impregnated stationary phases.<br />
Glu<br />
20% MeOH<br />
40% MeOH<br />
60% MeOH<br />
80% MeOH<br />
90% MeOH<br />
mR M<br />
20% MeOH<br />
40% MeOH<br />
60% MeOH<br />
80% MeOH<br />
90% MeOH<br />
mR M
COMPARATIVE STUDY OF DIFFERENT OILS AND FATS IMPREGNATED THIN-LAYER …<br />
No. Abbr.<br />
Cpd.<br />
Table 1. The experimental log Pow and computed lipophilicity <strong>de</strong>scriptors<br />
of studied amino acids<br />
Log Pow CLogP ALOGP MLOGP ALOGPs AC logP AB/logP miLogP XLOGP2 XLOGP3<br />
1 Leu -1.52 -1.667 0.631 -1.677 -1.82 0.20 -1.77 -1.38 -1.39 -1.52<br />
2 Lys -3.05 -3.424 -0.680 -2.485 -3.76 -1.16 -2.00 -3.18 -2.95 -3.05<br />
3 Met -1.85 -1.730 -0.273 -2.055 -1.85 -0.43 -2.00 -2.24 -1.85 -1.87<br />
4 Phe -1.38 -1.556 0.955 -0.968 -1.35 0.21 -1.39 -1.23 -1.38 -1.52<br />
5 Val -2.26 -2.286 0.242 -2.055 -2.29 -2.26 -2.00 -1.91 -2.17 -2.26<br />
6 Cys -2.49 -2.347 -0.517 -2.918 -2.57 -0.94 -2.00 -2.71 -2.57 -2.49<br />
7 Gly -3.21 -3.210 -0.978 -3.437 -3.34 -1.47 -2.00 -2.55 -3.35 -3.21<br />
8 Pro -2.54 -2.413 -0.057 -0.232 -2.71 -0.35 -2.00 -1.7 -0.18 -2.50<br />
9 Ser -3.07 -2.811 -1.489 -3.726 -3.42 -2.02 -2.00 -3.67 -3.96 -3.07<br />
10 Tyr -2.26 -2.223 0.688 -1.508 -2.39 -0.09 -2.00 -1.71 -1.78 -2.26<br />
11 Arg -4.20 -3.517 -1.107 -2.934 -3.49 -2.41 -2.00 -3.63 -2.97 -4.20<br />
12 His -3.32 -4.367 -1.015 -3.057 -2.67 -1.64 -2.00 -3.00 -3.11 -3.56<br />
13 Ala -2.85 -3.124 -0.601 -2.918 -3.05 -1.06 -2.00 -2.69 -2.82 -2.96<br />
14 Asn -3.82 -3.544 -1.847 -3.762 -3.36 -2.49 -2.00 -2.81 -4.43 -3.41<br />
15 Asp -3.89 -2.411 -1.245 -3.356 -3.52 -1.95 -2.00 -3.52 -3.71 -2.76<br />
16 Glu -3.69 -2.694 -0.924 -2.946 -3.54 -1.49 -2.00 -3.25 -3.35 -3.69<br />
Table 2. The solubility values for the studied amino acids<br />
No. Abbr.<br />
Cpd.<br />
Sexp<br />
(mg/mL)<br />
ALOGpS AC logS<br />
1 Leu 21.5 -0.27 -1.11<br />
2 Lys 1000.0 -0.14 -0.79<br />
3 Met 56.6 -0.80 -1.05<br />
4 Phe 26.9 -1.60 -1.54<br />
5 Val 58.5 0.26 -0.84<br />
6 Cys 277.0 -0.72 -1.06<br />
7 Gly 249.0 0.87 -0.03<br />
8 Pro 162.0 0.50 -0.71<br />
9 Ser 425.0 0.66 0.10<br />
10 Tyr 0.5 -1.37 -1.25<br />
11 Arg 182.0 -1.88 -0.16<br />
12 His 45.6 -0.34 -0.38<br />
13 Ala 164.0 0.70 -0.41<br />
14 Asn 29.4 0.10 -0.23<br />
15 Asp 5.4 0.03 -0.15<br />
16 Glu 8.6 -0.26 -0.42<br />
49
50<br />
R M values<br />
R M Values<br />
R M values<br />
R M values<br />
1.20<br />
0.80<br />
0.40<br />
0.00<br />
-0.40<br />
-0.80<br />
-1.20<br />
1.40<br />
1.00<br />
0.60<br />
0.20<br />
-0.20<br />
-0.60<br />
-1.00<br />
-1.40<br />
1.20<br />
0.80<br />
0.40<br />
0.00<br />
-0.40<br />
-0.80<br />
-1.20<br />
1.40<br />
1.00<br />
0.60<br />
0.20<br />
-0.20<br />
-0.60<br />
-1.00<br />
-1.40<br />
DORINA CASONI, COSTEL SÂRBU<br />
Pig fat impregnated silica gel plates<br />
Leu<br />
Lys<br />
Met<br />
Phe<br />
Val<br />
Cys<br />
Gly<br />
Pro<br />
Ser<br />
Tyr<br />
Arg<br />
His<br />
Ala<br />
Asn<br />
Asp<br />
Glu<br />
Leu<br />
Lys<br />
Compounds<br />
Pullet fat impregnated silica gel plates<br />
Met<br />
Phe<br />
Val<br />
Cys<br />
Gly<br />
Pro<br />
Ser<br />
Tyr<br />
Compounds<br />
Sheep fat impregnated silica gel plates<br />
Arg<br />
His<br />
Leu<br />
Lys<br />
Met<br />
Phe<br />
Val<br />
Cys<br />
Gly<br />
Pro<br />
Ser<br />
Tyr<br />
Arg<br />
His<br />
Ala<br />
Asn<br />
Asp<br />
Glu<br />
Compounds<br />
Bear fat impregnated silica gel plates<br />
Leu<br />
Lys<br />
Met<br />
Phe<br />
Val<br />
Cys<br />
Gly<br />
Pro<br />
Ser<br />
Tyr<br />
Arg<br />
His<br />
Ala<br />
Asn<br />
Asp<br />
Glu<br />
Compounds<br />
Ala<br />
Asn<br />
Asp<br />
Glu<br />
20% MeOH<br />
40% MeOH<br />
60% MeOH<br />
80% MeOH<br />
90% MeOH<br />
mR M<br />
20% MeOH<br />
40% MeOH<br />
60% MeOH<br />
80% MeOH<br />
90% MeOH<br />
mR M<br />
20% MeOH<br />
40% MeOH<br />
60% MeOH<br />
80% MeOH<br />
90% MeOH<br />
mRM<br />
20% MeOH<br />
40% MeOH<br />
60% MeOH<br />
80% MeOH<br />
90% MeOH<br />
m RM<br />
Figure 1b. Profiles of RM values for all fraction of methanol<br />
on the investigated animal fats impregnated stationary phases.
Table 3. The lipophilicity indices of amino acids obtained on RP-18W<br />
and different oils impregnated TLC plates<br />
No Abbr.<br />
RP-18W Paraffin Olive Sunflower Corn<br />
. Cpd. mRM RM0 b PC1/ mRM RM0 b PC1/ mRM RM0 b PC1/ mRM RM0 b PC1/ mRM RM0 b PC1/<br />
RM RM RM RM RM 1 Leu -0.445 -0.472 0.001 -0.341 -0.444 -0.581 0.002 0.534 -0.573 -0.636 0.001 0.790 -0.486 -0.617 0.002 0.627 -0.559 -0.651 0.002 0.791<br />
2 Lys -0.420 -0.930 0.012 -0.161 0.671 -0.256 0.016 -2.059 0.626 -0.229 0.015 -1.991 0.679 -0.259 0.016 -2.076 0.684 -0.234 0.016 -2.096<br />
3 Met -0.453 -0.554 0.002 -0.289 -0.483 -0.756 0.005 0.594 -0.512 -0.636 0.002 0.644 -0.506 -0.755 0.004 0.650 -0.483 -0.641 0.003 0.612<br />
4 Phe -0.226 -0.017 -0.005 -0.913 -0.569 -0.284 -0.005 0.881 -0.596 -0.427 -0.003 0.884 -0.567 -0.414 -0.003 0.852 -0.528 -0.386 -0.003 0.768<br />
5 Val -0.520 -0.681 0.004 -0.119 -0.486 -0.795 0.005 0.596 -0.531 -0.714 0.003 0.675 -0.515 -0.800 0.005 0.665 -0.477 -0.712 0.004 0.584<br />
6 Cys -0.654 -0.896 0.006 0.199 -0.408 -0.796 0.007 0.409 -0.384 -0.811 0.007 0.307 -0.417 -0.922 0.009 0.412 -0.420 -0.804 0.007 0.430<br />
7 Gly -0.663 -1.071 0.010 0.296 -0.262 -1.257 0.017 -0.015 -0.257 -0.994 0.013 -0.029 -0.271 -1.285 0.018 0.006 -0.225 -1.050 0.014 -0.082<br />
8 Pro -0.626 -0.897 0.007 0.155 -0.377 -0.973 0.010 0.305 -0.397 -0.870 0.008 0.327 -0.388 -1.063 0.012 0.321 -0.348 -0.823 0.008 0.255<br />
9 Ser -0.761 -1.214 0.011 0.527 -0.249 -1.088 0.015 -0.019 -0.270 -1.102 0.014 -0.020 -0.256 -1.220 0.017 -0.019 -0.251 -0.961 0.012 -0.004<br />
10 Tyr -0.490 -0.439 -0.001 -0.284 -0.577 -0.952 0.007 0.785 -0.527 -0.707 0.003 0.667 -0.506 -0.876 0.006 0.630 -0.558 -0.713 0.003 0.778<br />
11 Arg -0.278 -0.598 0.008 -0.551 0.715 -0.106 0.014 -2.137 0.658 -0.020 0.012 -2.029 0.736 -0.122 0.015 -2.190 0.726 -0.080 0.014 -2.164<br />
12 His -0.190 -0.586 0.009 -0.698 0.499 -0.046 0.009 -1.613 0.476 -0.006 0.008 -1.592 0.452 -0.016 0.008 -1.497 0.426 -0.022 0.008 -1.437<br />
13 Ala -0.705 -1.138 0.010 0.398 -0.441 -1.078 0.011 0.441 -0.432 -0.988 0.010 0.387 -0.372 -0.943 0.010 0.301 -0.427 -0.864 0.008 0.435<br />
14 Asn -0.700 -1.187 0.012 0.413 -0.295 -0.912 0.011 0.123 -0.154 -0.990 0.014 -0.274 -0.355 -1.130 0.013 0.230 -0.172 -0.836 0.012 -0.169<br />
15 Asp -0.867 -1.255 0.009 0.716 -0.489 -1.188 0.012 0.535 -0.539 -0.997 0.008 0.642 -0.488 -1.264 0.013 0.523 -0.509 -1.122 0.011 0.579<br />
16 Glu -0.849 -1.185 0.008 0.653 -0.530 -1.144 0.011 0.640 -0.536 -1.114 0.010 0.613 -0.489 -1.029 0.009 0.565 -0.564 -1.086 0.009 0.720
Table 4. The lipophilicity indices of amino acids obtained<br />
on different animal fats impregnated TLC plates<br />
No. Abbr.<br />
Pig Pullet Sheep Bear<br />
Cpd. mRM RM0 b PC1/RM mRM RM0 b PC1/RM mRM RM0 b PC1/RM mRM RM0 b PC1/RM<br />
1 Leu -0.615 -0.794 0.003 0.925 -0.644 -0.976 0.006 0.702 -0.574 -0.805 0.004 0.797 -0.663 -1.003 0.006 0.800<br />
2 Lys 0.688 -0.173 0.015 -2.059 0.618 -0.331 0.016 -2.164 0.624 -0.166 0.014 -1.933 0.730 -0.283 0.018 -2.374<br />
3 Met -0.492 -0.642 0.003 0.657 -0.565 -0.961 0.007 0.521 -0.462 -0.640 0.003 0.555 -0.591 -0.913 0.006 0.642<br />
4 Phe -0.489 -0.635 0.003 0.652 -0.642 -0.843 0.004 0.711 -0.364 -0.609 0.004 0.329 -0.618 -0.719 0.002 0.728<br />
5 Val -0.499 -0.775 0.005 0.653 -0.632 -1.150 0.009 0.657 -0.438 -0.725 0.005 0.488 -0.631 -0.998 0.006 0.726<br />
6 Cys -0.085 -1.267 0.020 -0.402 -0.528 -1.083 0.010 0.422 -0.363 -0.735 0.006 0.309 -0.466 -0.970 0.009 0.343<br />
7 Gly -0.206 -0.998 0.014 -0.073 -0.337 -1.180 0.015 -0.030 -0.225 -1.122 0.016 -0.064 -0.325 -1.167 0.015 -0.009<br />
8 Pro -0.362 -0.912 0.010 0.308 -0.474 -1.179 0.012 0.288 -0.413 -1.041 0.011 0.388 -0.522 -1.148 0.011 0.452<br />
9 Ser -0.251 -1.056 0.014 0.023 -0.397 -1.382 0.017 0.092 -0.338 -1.351 0.018 0.172 -0.326 -1.161 0.014 -0.006<br />
10 Tyr -0.410 -0.949 0.009 0.416 -0.548 -1.295 0.013 0.451 -0.505 -0.798 0.005 0.635 -0.531 -1.015 0.008 0.489<br />
11 Arg 0.628 -0.073 0.012 -1.901 0.653 -0.191 0.015 -2.235 0.629 -0.052 0.012 -1.929 0.749 -0.077 0.014 -2.392<br />
12 His 0.355 -0.064 0.007 -1.256 0.261 -0.183 0.008 -1.323 0.353 -0.142 0.009 -1.293 0.295 -0.045 0.006 -1.326<br />
13 Ala -0.481 -0.972 0.009 0.581 -0.555 -1.287 0.013 0.468 -0.410 -0.768 0.006 0.415 -0.517 -1.088 0.010 0.448<br />
14 Asn -0.189 -0.917 0.013 -0.101 -0.368 -1.617 0.022 0.001 -0.233 -0.929 0.012 -0.021 -0.351 -1.302 0.016 0.035<br />
15 Asp -0.508 -1.179 0.012 0.612 -0.611 -1.291 0.012 0.594 -0.584 -1.052 0.008 0.788 -0.607 -1.324 0.012 0.631<br />
16 Glu -0.653 -1.103 0.008 0.966 -0.724 -1.429 0.012 0.846 -0.399 -0.971 0.010 0.364 -0.685 -1.314 0.011 0.814
mR M values<br />
COMPARATIVE STUDY OF DIFFERENT OILS AND FATS IMPREGNATED THIN-LAYER …<br />
1.00<br />
0.80<br />
0.60<br />
0.40<br />
0.20<br />
0.00<br />
-0.20<br />
-0.40<br />
-0.60<br />
-0.80<br />
-1.00<br />
Leu<br />
Lys<br />
Met<br />
Phe<br />
Val<br />
Cys<br />
Gly<br />
Pro<br />
Ser<br />
Compounds<br />
Tyr<br />
Arg<br />
His<br />
Ala<br />
Asn<br />
Asp<br />
Glu<br />
RP-18W<br />
Paraffin<br />
Olive<br />
Sunflower<br />
Corn<br />
Pig<br />
Pullet<br />
Sheep<br />
Bear<br />
Leu<br />
Lys<br />
Met<br />
Phe<br />
Val<br />
Cys<br />
Gly<br />
Pro<br />
Ser<br />
Compounds<br />
(a) (b)<br />
PC1/R M values<br />
1.50<br />
1.00<br />
0.50<br />
0.00<br />
-0.50<br />
-1.00<br />
-1.50<br />
-2.00<br />
-2.50<br />
-3.00<br />
R M0 values<br />
0.20<br />
0.00<br />
-0.20<br />
-0.40<br />
-0.60<br />
-0.80<br />
-1.00<br />
-1.20<br />
-1.40<br />
-1.60<br />
-1.80<br />
Leu<br />
Lys<br />
Met<br />
Phe<br />
Val<br />
Cys<br />
Gly<br />
Pro<br />
Ser<br />
Tyr<br />
Arg<br />
His<br />
Ala<br />
Asn<br />
Asp<br />
Glu<br />
Compounds<br />
(c)<br />
RP-18W<br />
Paraffin<br />
Olive<br />
Sunflower<br />
Corn<br />
Pig<br />
Pullet<br />
Sheep<br />
Bear<br />
Tyr<br />
Arg<br />
His<br />
Ala<br />
Asn<br />
Asp<br />
Glu<br />
Figure 2. The correlation patterns of lipophilicity indices ((a) mRM; (b) RM0;<br />
(c) PC1/RM) corresponding to the investigated stationary phases.<br />
RP-18W<br />
Parrafin<br />
Olive<br />
Sunflower<br />
Corn<br />
Pig<br />
Pullet<br />
Sheep<br />
Bear<br />
In or<strong>de</strong>r to evaluate the suitability of oils and animal fats impregnated<br />
plates as reversed phase for TLC <strong>de</strong>termination of amino acids lipophilicity,<br />
the obtained results were compared with a series of theoretical lipophilicity<br />
indices. The correlation matrix of the experimental values versus theoretical<br />
ones is characterized by reasonable correlation coefficients (Table 5) in case<br />
of RM0 and b lipophilicity parameters in all cases. These correlations show<br />
in all cases that the specific surface area (b) of stationary phases is also a<br />
good alternative <strong>de</strong>scriptor of amino acids lipophilicity. The mean (mRM) of<br />
retention parameter RM proved to be a good lipophilicity parameter only in<br />
case of RP-18 stationary phases (rlog Pow = 0.92 and rALOGPs = 0.95) having low<br />
statistical significance in case of all impregnated stationary phases. By a<br />
careful examination, it can observe that in case of pig and respectively sheep<br />
fat impregnated stationary phases the correlations between theoretical and<br />
experimental lipophilicity indices are not statistically significant. Among the used<br />
different calculated lipophilicity indices, the best correlations were obtained<br />
with ALOGPs, log Pow and respectively XLOGP3 values for all the RP-18W,<br />
53
54<br />
DORINA CASONI, COSTEL SÂRBU<br />
oils and respectively pullet and bear fat impregnated stationary phases. These<br />
correlations illustrate that the substructure of molecule and both topological<br />
and valence states of atoms have an important contribution on the lipophilicity<br />
of the amino acids compounds.<br />
PC2/R M<br />
PC2/R M<br />
0.50<br />
0.40<br />
0.30<br />
0.20<br />
0.10<br />
0.00<br />
-0.10<br />
-0.20<br />
RP-18W chromatographic plates<br />
His<br />
Lys<br />
Arg<br />
Meth<br />
Leu<br />
Pro<br />
Val Cys<br />
Asn<br />
Gly Ala Ser<br />
Asp<br />
Glu<br />
-0.30<br />
Phe<br />
Tyr<br />
-0.40<br />
-1.00 -0.80 -0.60 -0.40 -0.20 0.00 0.20 0.40 0.60 0.80<br />
PC1/R M<br />
0.60<br />
0.40<br />
0.20<br />
0.00<br />
-0.20<br />
-0.40<br />
-0.60<br />
Arg<br />
Lys<br />
PC2/R M<br />
0.50<br />
0.40<br />
0.30<br />
0.20<br />
0.10<br />
0.00<br />
-0.10<br />
-0.20<br />
-0.30<br />
Sunflower impregnated silica gel plates<br />
His<br />
Lys<br />
Arg<br />
PC2/R M<br />
0.60<br />
0.40<br />
0.20<br />
0.00<br />
-0.20<br />
-0.40<br />
-0.60<br />
Olive oil impregnated silica gel plates<br />
His<br />
Lys<br />
Arg<br />
Paraffin oil impregnated silica gel plates<br />
His<br />
Gly<br />
Ser<br />
Asp<br />
AlaGlu<br />
AsnPro<br />
Tyr<br />
Cys<br />
Val<br />
Meth<br />
-0.80<br />
-2.50 -2.00 -1.50 -1.00 -0.50<br />
PC1/R M<br />
0.00 0.50 1.00 1.50<br />
Ser<br />
Asn<br />
Gly<br />
Glu<br />
Ala<br />
Asp<br />
Pro<br />
Cys<br />
Tyr Val<br />
Meth<br />
Leu<br />
-0.40<br />
Phe<br />
-0.50<br />
-2.50 -2.00 -1.50 -1.00 -0.50 0.00 0.50 1.00 1.50<br />
Gly<br />
Ser<br />
Asn<br />
Pro<br />
Asp<br />
Ala Glu<br />
Cys<br />
Tyr<br />
Val<br />
Meth<br />
-0.80<br />
-2.50 -2.00 -1.50 -1.00 -0.50 0.00 0.50 1.00<br />
PC1/R M<br />
Leu<br />
Phe<br />
PC1/R M<br />
Lys<br />
Arg<br />
Corn impregnated silica gel plates<br />
His<br />
Gly<br />
Ser<br />
Leu<br />
Phe<br />
Pro Ala<br />
Cys<br />
Val<br />
Tyr<br />
Meth<br />
Leu<br />
-0.50<br />
-2.50 -2.00 -1.50 -1.00 -0.50 0.00 0.50 1.00<br />
PC1/R M<br />
Figure 3a. Lipophilicity charts corresponding to RM values in case<br />
of RP-18W and different oils impregnated silica gel plates.<br />
PC2/R M<br />
0.40<br />
0.30<br />
0.20<br />
0.10<br />
0.00<br />
-0.10<br />
-0.20<br />
-0.30<br />
-0.40<br />
Asn<br />
Asp<br />
Glu<br />
Phe
PC2/R M<br />
PC2/R M<br />
COMPARATIVE STUDY OF DIFFERENT OILS AND FATS IMPREGNATED THIN-LAYER …<br />
0.60<br />
0.40<br />
0.20<br />
0.00<br />
-0.20<br />
Lys<br />
Arg<br />
Pig fat impregnated silica gel plates<br />
His<br />
Cys<br />
Ser<br />
Gly<br />
Asn<br />
Asp<br />
ProTyr<br />
Ala<br />
Val<br />
Leu<br />
Meth<br />
Phe<br />
-0.40<br />
-2.50 -2.00 -1.50 -1.00 -0.50 0.00 0.50 1.00 1.50<br />
0.60<br />
0.50<br />
0.40<br />
0.30<br />
0.20<br />
0.10<br />
0.00<br />
-0.10<br />
-0.20<br />
Lys<br />
Arg<br />
PC1/R M<br />
Sheep fat impregnated silica gel plates<br />
His<br />
Glu<br />
Cys Ala<br />
Tyr<br />
Val<br />
Leu<br />
Phe<br />
Meth<br />
-0.30<br />
-2.50 -2.00 -1.50 -1.00 -0.50 0.00 0.50 1.00<br />
PC1/R M<br />
Gly<br />
Asn<br />
Ser<br />
Pro<br />
Glu<br />
Asp<br />
PC2/R M<br />
0.80<br />
0.60<br />
0.40<br />
0.20<br />
0.00<br />
-0.20<br />
-0.40<br />
Lys<br />
Arg<br />
Pullet fat impregnated silica gel plates<br />
His<br />
Asn<br />
Gly<br />
Ser<br />
Tyr Ala<br />
Pro Asp Glu<br />
Cys Val<br />
Meth<br />
Leu<br />
-0.60<br />
-2.50 -2.00 -1.50 -1.00 -0.50 0.00 0.50 1.00<br />
Lys<br />
Arg<br />
PC1/R M<br />
Bear fat impregnated silica gel plates<br />
His<br />
Gly Ser<br />
Pro<br />
Ala<br />
CysTyr<br />
Phe<br />
Val<br />
Leu<br />
Meth<br />
-0.50<br />
-3.00 -2.50 -2.00 -1.50 -1.00 -0.50 0.00 0.50 1.00<br />
Figure 3b. Lipophilicity charts corresponding to RM values in case of different<br />
animal fats impregnated silica gel plates.<br />
Statistically significant correlations were obtained also with solubility<br />
parameter AClogS for almost of the used stationary phases, exception being<br />
in case of pig and pullet fat impregnated stationary phases (Table 5). These<br />
results indicate that newly ALOGPs version of log P computing module, based<br />
on associative neutral networks method, seems to cover, in the most efficiently<br />
way, the lipophilic character of amino acids.<br />
Surprisingly, the log D and log Pn values, calculated by correctly<br />
adjust for charged parts of molecules are not so well statistically correlated<br />
with experimental lipophilicity indices in some cases. The best correlations<br />
coefficients are r = 0.91 and r = -0.93 between log Pn and RM0RP18W and<br />
respectively bRP-18W; r = -0.91 between log Pn and bbear; r = 0.92 and r = -0.94<br />
between log D(IP) and RM0RP18W and respectively bRP-18W; r = -0.92 between<br />
log D(IP) and bcorn; r = -0.92 between log D(IP) and bbear.<br />
These results are in good agreement with the properties of amino acids<br />
that having both amine and carboxylic acid functional groups, at a certain pH<br />
(known as isoelectric point -IP) they can have both positive and negative<br />
PC2/R M<br />
0.40<br />
0.30<br />
0.20<br />
0.10<br />
0.00<br />
-0.10<br />
-0.20<br />
-0.30<br />
-0.40<br />
PC1/R M<br />
Asn<br />
Asp<br />
Glu<br />
Phe<br />
55
56<br />
DORINA CASONI, COSTEL SÂRBU<br />
charges (zwitterions). Amino acids can exist as zwitterions in polar solutions<br />
such as water [20] this fact being supported by the corelations of experimental<br />
lipophilicity indices and log D(IP) values in most of the cases. In or<strong>de</strong>r to getting<br />
more information concerning the similarities and differences between the oils<br />
and animal fats impregnated layers, PCA was applied to the matrices resulted<br />
by consi<strong>de</strong>ring the experimental lipopilicity indices mRM and respectively RM0<br />
obtained for all RP-18W and impregnated stationary phases. According to the<br />
“lipophilicity space” obtained by 3D representation of scores corresponding<br />
to the first three principal components (Figure 4), the RP-18W stationary<br />
phases lipophilicity appears in the group of outliers including pig fat (in case of<br />
mRM values) and respectively pullet fat (in case of RM0 values) impregnated<br />
silica gel plates. The different lipophilicity of RP-18W stationary phase is very<br />
well supported also by PC1/RM representations provi<strong>de</strong>d by Figure 2.<br />
RP-18W<br />
Pig<br />
Sh<br />
Be Pu<br />
CoOl<br />
Pa SF<br />
RP-18W<br />
Ol<br />
Be<br />
Co<br />
Pig<br />
Pa<br />
SF<br />
(a) (b)<br />
Figure 4. The “lipophilicity space” provi<strong>de</strong>d by score plots of the first three<br />
principal components (PC1, PC2, PC3) obtained by applying PCA on the:<br />
(a) mRM lipophilicity indices; (b) RM0 lipophilicity indices.<br />
Pu<br />
Sh
Table 5. The correlation between the theoretical and experimental lipophilicity indices of amino acids<br />
(Marked correlations are statistically significant)<br />
ClogP ALOGP MLOGP ALOGPs AC log P miLogP XLOGP2 XLOGP3 Sexp ALOGpS AClogS<br />
log D<br />
(IP)<br />
log Pow log Pn log D<br />
(pH=7)<br />
Lipophilicity<br />
indices<br />
Stationary<br />
Phases<br />
mRM 0.92 0.83 0.89 0.84 0.71 0.83 0.69 0.95 0.70 0.89 0.68 0.86 -0.29 -0.63 -0.84<br />
RM0 0.91 0.91 0.84 0.92 0.82 0.91 0.74 0.96 0.76 0.88 0.72 0.89 -0.39 -0.76 -0.92<br />
RP-18W<br />
b -0.86 -0.93 -0.76 -0.94 -0.87 -0.92 -0.75 -0.91 -0.77 -0.82 -0.71 -0.86 0.46 0.83 0.93<br />
PC1/RM -0.92 -0.87 -0.88 -0.88 -0.75 -0.87 -0.72 -0.96 -0.73 -0.89 -0.70 -0.88 0.33 0.68 0.88<br />
mRM -0.41 -0.73 -0.28 -0.74 -0.66 -0.67 -0.52 -0.52 -0.49 -0.42 -0.45 -0.49 0.73 0.73 0.71<br />
RM0 0.82 0.69 0.70 0.71 0.73 0.70 0.58 0.91 0.58 0.73 0.55 0.82 -0.32 -0.68 -0.83<br />
Paraffin Oil<br />
b -0.81 -0.81 -0.66 -0.82 -0.81 -0.79 -0.64 -0.91 -0.63 -0.74 -0.60 -0.83 0.50 0.79 0.91<br />
PC1/RM 0.52 0.79 0.38 0.79 0.72 0.73 0.57 0.63 0.55 0.51 0.50 0.58 -0.72 -0.78 -0.79<br />
mRM -0.54 -0.77 -0.32 -0.77 -0.81 -0.73 -0.57 -0.59 -0.55 -0.45 -0.55 -0.63 0.59 0.57 0.66<br />
RM0 0.91 0.88 0.84 0.89 0.83 0.86 0.71 0.98 0.70 0.86 0.71 0.94 -0.41 -0.72 -0.92<br />
Olive Oil<br />
b -0.85 -0.93 -0.71 -0.94 -0.92 -0.91 -0.73 -0.92 -0.72 -0.78 -0.72 -0.91 0.54 0.74 0.91<br />
PC1/RM 0.60 0.81 0.39 0.81 0.85 0.78 0.61 0.65 0.59 0.51 0.59 0.69 -0.60 -0.61 -0.71<br />
mRM -0.49 -0.73 -0.32 -0.74 -0.76 -0.68 -0.55 -0.65 -0.45 -0.51 -0.48 -0.62 0.80 0.76 0.77<br />
RM0 0.88 0.84 0.73 0.86 0.78 0.84 0.65 0.93 0.69 0.78 0.64 0.82 -0.43 -0.70 -0.90<br />
Sunflower<br />
oil<br />
b -0.82 -0.86 -0.66 -0.87 -0.82 -0.84 -0.66 -0.90 -0.66 -0.75 -0.63 -0.81 0.56 0.76 0.91<br />
PC1/RM 0.58 0.78 0.40 0.78 0.80 0.73 0.59 0.72 0.51 0.58 0.53 0.68 -0.77 -0.78 -0.82<br />
mRM -0.46 -0.71 -0.24 -0.71 -0.74 -0.68 -0.48 -0.51 -0.54 -0.37 -0.47 -0.53 0.61 0.62 0.65<br />
Corn Oil RM0 0.89 0.78 0.86 0.79 0.68 0.77 0.67 0.94 0.64 0.83 0.64 0.84 -0.29 -0.66 -0.86
ClogP ALOGP MLOGP ALOGPs AC log P miLogP XLOGP2 XLOGP3 Sexp ALOGpS AClogS<br />
log D<br />
(IP)<br />
log Pow log Pn log D<br />
(pH=7)<br />
Lipophilicity<br />
indices<br />
Stationary<br />
Phases<br />
b -0.87 -0.91 -0.75 -0.92 -0.85 -0.89 -0.72 -0.94 -0.73 -0.78 -0.70 -0.87 0.50 0.78 0.95<br />
PC1/RM 0.54 0.77 0.33 0.78 0.79 0.74 0.54 0.60 0.59 0.45 0.53 0.61 -0.61 -0.67 -0.72<br />
mRM -0.24 -0.45 -0.01 -0.45 -0.49 -0.44 -0.37 -0.28 -0.30 -0.25 -0.31 -0.30 0.66 0.21 0.28<br />
RM0 0.69 0.60 0.64 0.60 0.51 0.58 0.57 0.75 0.42 0.72 0.52 0.65 -0.40 -0.31 -0.53<br />
Pig Fat<br />
b -0.58 -0.63 -0.41 -0.64 -0.60 -0.61 -0.56 -0.63 -0.44 -0.59 -0.50 -0.58 0.62 0.32 0.49<br />
PC1/RM 0.29 0.48 0.05 0.48 0.51 0.46 0.39 0.33 0.32 0.29 0.34 0.34 -0.67 -0.22 -0.30<br />
mRM -0.33 -0.56 -0.07 -0.57 -0.64 -0.53 -0.38 -0.40 -0.34 -0.25 -0.35 -0.39 0.61 0.49 0.53<br />
RM0 0.86 0.76 0.69 0.77 0.83 0.75 0.61 0.85 0.71 0.67 0.71 0.86 -0.08 -0.46 -0.72<br />
Pullet Fat<br />
b -0.79 -0.82 -0.55 -0.82 -0.90 -0.79 -0.62 -0.82 -0.69 -0.61 -0.68 -0.82 0.32 0.55 0.77<br />
PC1/RM 0.38 0.60 0.12 0.60 0.68 0.57 0.41 0.45 0.38 0.29 0.39 0.44 -0.60 -0.51 -0.57<br />
mRM -0.31 -0.48 -0.15 -0.48 -0.64 -0.47 -0.38 -0.33 -0.39 -0.21 -0.41 -0.53 0.48 0.31 0.38<br />
RM0 0.65 0.71 0.60 0.73 0.56 0.66 0.47 0.77 0.50 0.64 0.48 0.64 -0.55 -0.67 -0.83<br />
Sheep Fat<br />
b -0.66 -0.77 -0.55 -0.78 -0.72 -0.73 -0.54 -0.76 -0.56 -0.61 -0.56 -0.73 0.64 0.66 0.83<br />
PC1/RM 0.37 0.54 0.21 0.54 0.68 0.52 0.42 0.39 0.43 0.27 0.44 0.57 -0.52 -0.37 -0.45<br />
mRM -0.39 -0.63 -0.14 -0.62 -0.69 -0.60 -0.52 -0.48 -0.41 -0.38 -0.49 -0.48 0.71 0.46 0.57<br />
RM0 0.93 0.82 0.88 0.83 0.73 0.79 0.59 0.92 0.68 0.73 0.63 0.84 -0.05 -0.62 -0.83<br />
Bear Fat<br />
b -0.88 -0.91 -0.71 -0.92 -0.88 -0.88 -0.69 -0.91 -0.70 -0.72 -0.71 -0.86 0.40 0.68 0.90<br />
PC1/RM 0.45 0.67 0.20 0.66 0.73 0.64 0.55 0.53 0.45 0.43 0.52 0.53 -0.69 -0.49 -0.61
COMPARATIVE STUDY OF DIFFERENT OILS AND FATS IMPREGNATED THIN-LAYER …<br />
CONCLUSIONS<br />
Different lipophilicity indices of amino acids on RP-18W and different<br />
oils (paraffin, olive, sunflower and corn) and respectively animal fats (pig,<br />
pullet, sheep and bear) impregnated silica gel plates were <strong>de</strong>termined using<br />
methanol-phosphate buffer as mobile phase. The obtained results indicate<br />
no significant differences, in terms of lipophilicity, between oils and animal fats<br />
impregnated silica gel plates. The correlation between the theoretical and<br />
chromatographic lipophilicity indices revealed that all oils and some animal fats<br />
(pullet and bear) can be a good alternative in the field of chromatographic<br />
lipophilicity estimation of amino acids. From the lipophilicity used indices,<br />
the RM0 and b values showed, in all cases, the most significant correlations.<br />
The PCA methodology proved to be again a useful tool that can offer a realistic<br />
characterization of impregnated plates, both from the retention mechanism<br />
and lipophilicity point of view.<br />
EXPERIMENTAL SECTION<br />
Chemicals<br />
The amino acids Leucine (Leu), Lysine (Lys), Methionine (Met),<br />
Phenylalanine (Phe), Valine (Val), Cysteine (Cys), Glycine (Gly), Proline (Pro),<br />
Serine (Ser), Tyrosine (Tyr), Arginine (Arg), Histidine (His), Alanine (Ala),<br />
Asparagine (Asn), Aspartic acid (Asp) and Glutamic acid (Glu) of analytical<br />
gra<strong>de</strong> were obtained from Merck or Fluka. Analytical - gra<strong>de</strong> methanol was<br />
purchased from Chemical Company (Iasi, Romania). The oils (paraffin, olive,<br />
sunflower and corn) and fats (from pig, pullet, sheep and bear), used for<br />
silica gel plates impregnation, were from local markets. Ninhydrin, used as<br />
visualization reagent, was from Rie<strong>de</strong>l-<strong>de</strong> Haen (Seelze, Germany).<br />
Thin-Layer Chromatography<br />
The chromatographic behavior of series of amino acids compounds<br />
was studied on eight different impregnated silica gel layers (10 x 20 cm) and<br />
on RP-18W (10 X 20 cm) chromatographic plates. The silica gel plates were<br />
impregnated with 10% of oil and respectively 5% of animal fat in diethyl<br />
ether solution in all cases, by ascendant <strong>de</strong>velopment. The animal fats used as<br />
raw material were extracted from the natural membranes by heating to melting<br />
point followed by filtration. The standard solutions of amino acids (2 mg/mL)<br />
were prepared in methanol and respectively water and 2μL of which were<br />
applied manually, in duplicate, on the plate by means of a 10 μL Hamilton<br />
(Switzerland) microliter syringe. The mobile phase consisting of different<br />
proportions of methanol and phosphate buffer (pH = 7) mixture was from<br />
59
DORINA CASONI, COSTEL SÂRBU<br />
20% to 90% methanol in all cases. Chromatography was performed in a<br />
normal <strong>de</strong>veloping chamber, saturated for 15 min at room temperature (~22 0 C),<br />
by ascendant <strong>de</strong>velopment and a <strong>de</strong>veloping distance of 8 cm in all cases.<br />
The amino acids were visualized by using a 0.2% ninhydrin solution prepared<br />
in ethanol and heating the plates at 110 0 C for 10 minutes.<br />
Computation of lipophilicity indices<br />
Nowadays, it is well known that many software and internet modules<br />
are able to calculate different lipophilicity values applying various algorithms<br />
based on structural, atomistic, topological or electrotopological consi<strong>de</strong>rations.<br />
All of them require a previously molecule drawing that is usually performed by<br />
Hyperchem [21] and optimized using the MM+ molecular mechanics force<br />
field. On the basis of obtained geometry, software like Chem3D Ultra 8.0 [22]<br />
and Dragon Plus version 5.4 [23] calculate various lipophilicity <strong>de</strong>scriptors.<br />
In the present study, one log P value (Clog P) was calculated by Chem3D Ultra<br />
and two log P values (MLOGP-Moriguchi method and ALOGP- Ghose-Crippen<br />
method) by the Dragon Plus software. Another five lipophilicity <strong>de</strong>scriptors<br />
(ALOGPs, AC logP, miLogP, XLOGP2, XLOGP3) were computed by the<br />
internet module ALOGPS 2.1 [24]. By using this free internet module we<br />
<strong>de</strong>rived also a set of three solubility indices (ALOGpS, AC logS, AB/logS).<br />
The experimental solubility in water and octanol-water partition coefficient of<br />
studied compounds are from the Human Metabolome Project database [25].<br />
In some cases, the distribution coefficient (log D) of a compound at a<br />
given pH may be used as an appropriate <strong>de</strong>scriptor for lipophilicity estimation.<br />
Because of the nature of studied compounds, we <strong>de</strong>rived log D values for<br />
two different pH (log D (pH = 7) and log D (PI) -at isoelectric point of each<br />
compound) and respectively log P for nonionic species of amino acids (log Pn)<br />
by using a new and improved log P calculator available as free internet<br />
module Marvin Sketch 5.3.2 [26].<br />
ACKNOWLEDGMENTS<br />
The financial support of the Ministry of Education and Research of<br />
Romania (CNCSIS, IDEI 560/2007) is grate<strong>full</strong>y acknowledged.<br />
REFERENCES<br />
1. K.A. Dill, Biochemistry, 1990, 29, 7133.<br />
2. W.P. Walter, M.A. Ajay Murcko, Curr. Opin. Chem. Biol., 1999, 3, 384.<br />
3. K.M. Biswas, D.R. DeVido, J.G. Dorsey, J. Chromatogr. A, 2003, 1000, 637.<br />
4. K. Valkó, J. Chromatogr. A, 2004, 1037, 299.<br />
60
COMPARATIVE STUDY OF DIFFERENT OILS AND FATS IMPREGNATED THIN-LAYER …<br />
5. X. Liu, H. Tanaka, A. Yamauchi, B. Tesa, H. Chuman, J. Chromatogr. A, 2005,<br />
1091, 51.<br />
6. R.D/ Briciu, A. Kot-Wasik, J. Namiesnśik, C. Sârbu, J. Sep. Sci., 2009, 32, 2066.<br />
7. D. Casoni, A. Kot-Wasik, J. Namiesnśik, C. Sârbu, J. Chromatogr. A, 2009, 1216,<br />
2456.<br />
8. T.L. Djakovic, C. Sârbu, N.U. Perišic-Janjic, J. Planar Chromatogr., 2005, 18, 432.<br />
9. A. Pyka, D. Gurak, J. Planar Chromatogr., 2007, 20, 373.<br />
10. D. Casoni, C. Sârbu, Chromatographia, 2009, 70, 1277.<br />
11. N.U. Perišić-Janjić, T.L. Djaković-Sekulić, J. Planar Chromatogr., 2006, 19, 438.<br />
12. T. Csermely, G. Petroianu, K. Kuca, J. Fûrész, F. Darvas, Z. Gulyás, R. Laufer,<br />
H. Kalász, J Planar Chromatogr., 2007, 20, 39.<br />
13. J. Kresta, P. Kastner, J. Klimeš, V. Klimešová, J. Planar Chromatogr., 2005, 18, 450.<br />
14. C. Sârbu, R.D. Briciu, J. Liq. Chromatogr. Rel. Technol., 2010, 33, 1.<br />
15. E.C. Bate-Smith, R.G. Westall, Biochim. Biophys. Acta, 1950, 4, 427.<br />
16. S. Gocan, G. Cimpan, J. Comer. “Lipophilicity measurements by liquid chromatography.<br />
In: Grushka E., Grinberg N. (eds), “Advances in chromatography”, Oxford, UK,<br />
2005, chapter 2.<br />
17. C. Sârbu, S. Todor, J. Planar Chromatogr., 1998, 11, 123.<br />
18. C. Sârbu, S. Todor, J. Chromatogr. A, 1998, 822, 263.<br />
19. R. Kaliszan, Chem. Rev., 2007, 107, 3212.<br />
20. M. Remko, B.M. Ro<strong>de</strong>, J. Phis. Chem. A, 2006, 110, 1960.<br />
21. HyperChem, release 7.5 for Windows, Molecular Mo<strong>de</strong>ling System; Hypercube,<br />
Inc. and Auto<strong>de</strong>sk, Inc.<br />
22. Chemical Structure Drawing Standard, ChemDraw Ultra 8.0.3 (2003)<br />
http://www.cambridgesoft.com.<br />
23. Talete SRL, DRAGON for windows (software for molecular <strong>de</strong>scriptor calculations).<br />
Version 5.4-2006. http://www. talete.mi.it.<br />
24. Virtual Computational Chemistry Laboratory. http://www.vcclab.org/lab/alogps/.<br />
25. The Human Metabolome Project. http://www.metabolomics.ca.<br />
26. Marvin Sketch 5.3.2 free internet module. http://www.chemaxon.com.<br />
61
STUDIA UBB CHEMIA, LVI, 1, 2011<br />
SIMPLE AND COST-EFFECTIVE MULTISPECTRAL IMAGING<br />
SYSTEM FOR REFLECTANCE MEASUREMENT USING LED<br />
LIGHT SOURCES AND INTEGRATING SPHERE<br />
EUGEN DARVASI *,a AND CSONGOR MÁTYÁS a<br />
ABSTRACT. In the <strong>de</strong>veloped multispectral imaging system the sample is<br />
illuminated diffusely by monochromatic light with an integrating sphere. The<br />
LEDs are used for monochromatic light source. The wavelengths of the 11<br />
different type of LEDs are uniformly covering the 380–670nm wavelength<br />
range. For calibration we use gray standards placed on the wall of the sphere.<br />
The <strong>de</strong>tector is a digital camera. From the multispectral image after calibration<br />
the reflectance spectra of any region can be represented.<br />
Keywords: multispectral imaging, image spectroscopy, LED light source,<br />
integrating sphere, reflectance spectra<br />
INTRODUCTION<br />
Multispectral imaging is an imaging technology that can simultaneously<br />
record spectral and spatial information of a sample. A multispectral image<br />
consists of a set of gray images, each registered at a <strong>de</strong>sired narrow band<br />
of wavelengths [1]. New forms of multispectral imaging are now appearing:<br />
spectrum imaging (or a variant of it: image-spectroscopy), where a complete<br />
spectrum is recor<strong>de</strong>d for each pixel in the image, combines the useful properties<br />
of spectroscopy and imaging [2]. Multispectral imaging techniques have been<br />
adopted in many disciplines, such as airborne remote sensing, environmental<br />
monitoring, medicine, military operations, factory automation and classification<br />
or sorting of agricultural products.<br />
Traditionally the images are produced using the light filters or scanning<br />
spectrometers. Ariana et al. assembled an imaging system to capture images<br />
of apples un<strong>de</strong>r different lighting mo<strong>de</strong>s and seven band pass filters [3]. Lu<br />
used the spectral images of the backscattering of light at the apple surface,<br />
which were generated from a focused broadband beam, obtained for five<br />
selected spectral bands [4]. Guo, et al. used a multispectral imaging<br />
microscope for White Blood Cell segmentation. The apparatus consists of a<br />
microscope, a Liquid Crystal Tunable Filter (LCTF) <strong>de</strong>vice and a cooled<br />
monochrome Charge Coupled Device (CCD) camera [5]. Vila et al. <strong>de</strong>scribed<br />
a Babeş-Bolyai University, Faculty of Chemistry and Chemical engineering, Str. Arany János<br />
11, 400028 Cluj-Napoca, Romania, * edarvasi@chem.ubbcluj.ro
64<br />
EUGEN DARVASI, CSONGOR MÁTYÁS<br />
a smart multispectral system for industrial, environmental and commercial<br />
applications. The system acquires multispectral images by means of an optical<br />
tunable filter (six spectral bands in the range 400–1000 nm) in front of a<br />
monochrome camera [6].<br />
In the <strong>de</strong>veloped imaging system the sample is illuminated by<br />
monochromatic light of LEDs. Light emitting dio<strong>de</strong>s (LEDs) were first used for<br />
chemical analysis three <strong>de</strong>ca<strong>de</strong>s ago. They are finally making their appearance<br />
in commercial analytical systems and <strong>de</strong>dicated <strong>de</strong>tectors [7]. Light emitting<br />
dio<strong>de</strong>s (LEDs) are used very often in analytical photometric methods as extremely<br />
cheap, low-power, most energy-efficient sources of nearly monochromatic light.<br />
Pokrzywnicka et al. <strong>de</strong>scribed a very simple photometric system <strong>de</strong>dicated<br />
for simultaneous photometric and fluorometric <strong>de</strong>tection [8]. More advanced<br />
absorbance <strong>de</strong>tectors are presented for chromatography [9–10] and for flow<br />
injection analysis [11–12]. Darvasi et Kekedy <strong>de</strong>scribe the application of<br />
integrating sphere in imaging spectroscopy [13]. The light source used was a<br />
halogen bulb. Commercial digital cameras were used to calculate the color<br />
characteristics of 16 pepper pow<strong>de</strong>r samples. No reference was found regarding<br />
the use of LEDs as monochromatic light sources in multispectral systems.<br />
Thus the system presented below can be consi<strong>de</strong>red a novelty.<br />
In the present article the preliminary testing results are presented,<br />
with the possibility of future improvement.<br />
The measuring system can have numerous applications in the noninvasive<br />
study of biological and geological samples.<br />
RESULTS AND DISCUSSION<br />
In the <strong>de</strong>veloped multispectral imaging system the sample is illuminated<br />
diffusely with an integrating sphere. Eleven images from different wavelength<br />
range of the visible region were acquired. The photo <strong>de</strong>tector was a commercially<br />
available digital camera.<br />
Measuring geometry<br />
The diffuse measuring geometry was realized with the help of a self<br />
<strong>de</strong>signed integrating sphere having a diameter of 106 mm. (Fig.1). The<br />
experiments were carried out with an integrating sphere cast in a gypsum<br />
cubic block, having a spherical inner hole. The inner wall was covered with<br />
BaSO4 pow<strong>de</strong>r (used as white reference material for reflectance measurements).<br />
The sphere was provi<strong>de</strong>d with 2 apertures. The aperture on the upper si<strong>de</strong><br />
served as observation hole for camera. The second aperture, on the lower<br />
si<strong>de</strong>, opposite to the first, served for sample introduction. The samples were put<br />
on a plastic support, and lifted upwards till they reached a tangential position<br />
to the sphere. The support also served as a light trap, as it is painted black<br />
in the insi<strong>de</strong>. The trap has three holes, serving as the black reference.
SIMPLE AND COST-EFFECTIVE MULTISPECTRAL IMAGING SYSTEM FOR REFLECTANCE …<br />
Figure 1. The multispectral imaging system with an integrating sphere and LEDs<br />
Light sources<br />
For lighting the integrating sphere eleven different type of LEDs were<br />
used. (Table 1)<br />
LED Type Color<br />
Table 1. LEDs data<br />
Central wavelength<br />
(nm)<br />
Position<br />
in sphere<br />
a L-7113UVC 1 UV 400 1, 12, 23<br />
b L-53MBC 1 Blue 430 2, 13, 24<br />
c OSUB5111A-RS 2 Blue 471 3, 14, 25<br />
d OSBG5121A-TU 2 Blue 505 4, 15, 26<br />
e OSPG5111P 2 Green 525 5, 16, 27<br />
f L-53SGC 1 Green 565 6, 17, 28<br />
g LL-503UGC-2BC 3 Green 568 7, 18, 29<br />
h OSYL5111P 2 Yelow 590 8, 19, 30<br />
i OSOR5111P 2 Red 605 9, 20, 31<br />
j OSHR5111P 2 Red 625 10, 21, 32<br />
k L-53SRC/F 1 Red 660 11, 22, 33<br />
Manufacturer: 1 Kingbright Elec. Co., Ltd, 2 Optosupply Ltd, 3 Lucky Light Co. Ltd<br />
The wavelengths of the LEDs are uniformly covering the 380–670nm<br />
wavelength range (Fig.2).<br />
65
EUGEN DARVASI, CSONGOR MÁTYÁS<br />
Figure 2. The spectral characteristics of the LEDs used<br />
The LEDs were positioned in 11 groups of 3 insi<strong>de</strong> the sphere along the<br />
great circle. The intensity of the LEDs was set individually for each group. The<br />
selection of the wavelength range was possible in 11 steps by turning on the<br />
appropriate LED groups. For operating the LED groups a switchboard was used.<br />
Photo <strong>de</strong>tector<br />
The photo <strong>de</strong>tector was a commercially available CS330 VGA digital<br />
camera (manufacturer: Intel Co). The exposure parameters of the camera<br />
were set manually (saturation, brightness, white balance and hue). The digital<br />
image was saved as .jpg file and transferred to the PC for processing. As<br />
reflectance reference 6 gray standards were photographed together with<br />
each sample.<br />
CONCLUSIONS<br />
The <strong>de</strong>veloped multispectral imaging system is simple and costeffective.<br />
After calibrating the system the reflectance spectrum of any image<br />
<strong>de</strong>tail can be <strong>de</strong>termined based on the multispectral images of small<br />
samples. The measurement results are close to the values <strong>de</strong>termined by a<br />
spectrophotometer. The system can be further <strong>de</strong>veloped by the use of a<br />
professional camera and specific software.<br />
EXPERIMENTAL SECTION<br />
Procedure<br />
The samples were put on a plastic support, and lifted upwards till they<br />
reached a tangential position to the sphere. The sample was sequentially lit by<br />
the different wavelengths LED groups while images were recor<strong>de</strong>d. 11 images<br />
of i<strong>de</strong>ntical size were ma<strong>de</strong>, these containing the spectral information.<br />
66
SIMPLE AND COST-EFFECTIVE MULTISPECTRAL IMAGING SYSTEM FOR REFLECTANCE …<br />
Calibration and data processing<br />
Six gray calibration standards with known reflectance placed close to<br />
the lower aperture of the sphere were used for calibration (Fig.1). A function<br />
was established between the calibration standards in the sphere wall and<br />
the same standards in sample support (Fig.3a). The images of the samples<br />
were calibrated based on the corrected grey standards’ value (Fig.3b). The<br />
image calibration curve was used for calculating the reflectance value of<br />
selected sample pixels. In or<strong>de</strong>r to attain the best signal/noise ratio in the<br />
case of a, b, LEDs B image parameters were used, in the case of c, d, e, f, g, h<br />
LEDs G image parameters were used and in the case of i, j, k LEDs R<br />
image parameters were used. The RGB image parameters were <strong>de</strong>termined<br />
using ColorPilot 4.80.01v software package (Two Pilots, USA, Germany,<br />
Russia). The rest of data processing and graphical representation was ma<strong>de</strong><br />
in Microsoft Office Excel program.<br />
Figure 3. The calibration a) The calibration of the standards in the sphere wall;<br />
b) The image calibration curve<br />
Measurements<br />
The testing of the system was ma<strong>de</strong> using gray and colored standards<br />
(Macbeth ColorChecker). The reflectance value of the used standards was<br />
<strong>de</strong>termined with a Jasco V-670-ILN725 spectrophotometer. These values<br />
were consi<strong>de</strong>red reference values in error <strong>de</strong>termination. Figure 4 represents<br />
the measured and reference reflectance values of the 1 cm 2 surface gray<br />
standards <strong>de</strong>pending on the wavelength.<br />
67
EUGEN DARVASI, CSONGOR MÁTYÁS<br />
Figure 4. The measured and reference reflectance values of the gray standards<br />
The measurement errors in the case of gray standards do not<br />
exceed 4%R. The measurement results of the colored samples are shown<br />
in figure 5. In the case of colored standards the measurement errors are<br />
greater than those of gray standards but they do not exceed 7%R.<br />
Figure 5. The measured and reference reflectance values of the color standards<br />
68
SIMPLE AND COST-EFFECTIVE MULTISPECTRAL IMAGING SYSTEM FOR REFLECTANCE …<br />
REFERENCES<br />
1. R.M. Levenson, C.C. Hoyt, American Laboratory, 2000, November, 26–33.<br />
2. N. Bonnet, Micron, 2004, 35, 635.<br />
3. D. Ariana D.E. Guyer, B. Shrestha, Computers and Electronics in Agriculture,<br />
2006, 50, 148.<br />
4. R. Lu, Postharvest Biology and Technology, 2004, 31, 147.<br />
5. N. Guo, L. Zeng, Q. Wu, Computers in Biology and Medicine, 2006, 37, 70.<br />
6. J. Vila et al., Real-Time Imaging, 2005, 11, 85.<br />
7. P.K. Dasgupta, I.-Y. Eom, K. J. Morris, J. Li, Analytica Chimica Acta, 2003, 500,<br />
337.<br />
8. M. Pokrzywnicka, R. Koncki, Ł. Tymecki, Talanta, 2010, 82, 422.<br />
9. L. Barron, P.N. Nesterenko, D. Diamond, M. O’Toole, K.T. Lau, B. Paull, Anal.<br />
Chim. Acta, 2006, 577, 32.<br />
10. L. Barron, M. O’Toole, D. Diamond, P.N. Nesterenko, B. Paull, J. Chromatogr. A,<br />
2008, 1213, 31.<br />
11. M. O’Toole, K.T. Lau, D. Diamond, Talanta, 2005, 66, 1340.<br />
12. M. O’Toole, K.T. Lau, R. Shepherd, C. Slater, D. Diamond, Anal. Chim. Acta, 2007,<br />
597, 290.<br />
13. E. Darvasi, L. Kekedy N., Studia UBB Chemia, 2009, 54(3), 49.<br />
69
STUDIA UBB CHEMIA, LVI, 1, 2011<br />
BIODIESEL PRODUCTION FROM SUNFLOWER OIL<br />
WITH CANDIDA ANTARCTICA LIPASE B<br />
GOG ADRIANA a , MIRCEA CHINTOANU a , MARIUS ROMAN a ,<br />
EMIL LUCA b , PAIZS CSABA c , FLORIN-DAN IRIMIE c<br />
ABSTRACT. In this paper, we have evaluated the efficacy of an enzymatic<br />
method for the transesterification process of sunflower oil with methanol in<br />
the presence of tert-butanol. tert-Butanol was used as the reaction medium to<br />
eliminate both negative effect caused by excessive methanol and glycerol<br />
resulted as by product. Using the following reaction conditions: 1% Novozym<br />
435 based on oil weight, methanol / oil molar ratio 6:1, tert-butanol/ oil volume<br />
ratio 6:1, the FAME reached its maximum level after 3h, with a value of<br />
78.6% (m/m).<br />
Keywords: biodiesel, tert-Butanol, Novozym 435, enzymatic transesterification<br />
INTRODUCTION<br />
Biodiesel, having a chemical structure of fatty acid alkyl esters (usually<br />
fatty acid methyl ester, FAME), has recently become an alternative to petroleumbased<br />
diesel fuel. It is renewable, bio<strong>de</strong>gradable, non-inflammable, and nontoxic.<br />
It also has a favorable combustion emission profile, producing much less<br />
carbon monoxi<strong>de</strong>, sulphur dioxi<strong>de</strong> and unburned hydrocarbons than petroleumbased<br />
diesel [1]. Biodiesel is <strong>de</strong>rived from abundant and renewable substances<br />
such as vegetable oils, animal fats, algae, industrial acid oil, waste cooking oil<br />
etc. In conventional chemical processing, synthesis of these esters is achieved by<br />
an alkaline esterification reaction encountered with lowered selectivity, leading<br />
to un<strong>de</strong>sirable si<strong>de</strong> reactions. Moreover, the process is not environmentally<br />
friendly. The disadvantages caused by chemical catalysts are largely prevented<br />
by the lipases which allow mild reaction conditions and easy recovery of<br />
glycerol without purification, avoiding in this way the formation of chemical<br />
waste [2, 3]. Because of the high energy cost of the conventional chemical<br />
process and additional purification step of glycerol, application of lipase in<br />
a<br />
INCDO-INOE 2000 Research Institute for Analytical Instrumentation - ICIA, 67 Donath St.,<br />
400293 Cluj-Napoca, Romania<br />
b<br />
University of Agricultural Sciences and Veterinary Medicine Cluj-Napoca, Faculty of Horticulture,<br />
3 Calea Manastur St., 400372 Cluj-Napoca, Romania<br />
c<br />
Babes-Bolyai University Cluj-Napoca, Faculty of Chemistry and Chemical Engineering, 11 Arany<br />
Janos St., 400028 Cluj-Napoca, Romania
GOG ADRIANA, MIRCEA CHINTOANU, MARIUS ROMAN, EMIL LUCA, PAIZS CSABA, FL.-DAN IRIMIE<br />
the oleo chemical industry has become more attractive. Although enzymatic<br />
approaches have become more and more attractive, their use at industrial<br />
scale has not been realized yet, due to the relatively high price of lipases<br />
and their short operational life caused by the negative effects of excessive<br />
methanol and by-product glycerol [4, 5].<br />
It has been <strong>de</strong>monstrated that more than 1/2 molar equivalent methanol<br />
are insoluble in vegetable oils and the immobilized lipases are easily inactivated<br />
by contacting with insoluble methanol existing as drops in the oils [6]. For<br />
example, Shimada et al. [7] found that immobilized Candida antarctica lipase<br />
was inactivated in a mixture containing greater than 1.5 molar equivalents of<br />
methanol in oil when using a solvent-free system. Stepwise addition of methanol<br />
or using some hydrophobic solvents such as n-hexane or petroleum ether<br />
as reaction media have been proposed to reduce the negative effect of<br />
methanol on lipase activity [8, 9]. But in another study, although n-hexane was<br />
used as reaction medium for the methanolysis of salad oil with Candida sp.,<br />
Nie et al. [10] found that the lipase was <strong>de</strong>natured when methanol/oil molar<br />
ratio excee<strong>de</strong>d 1:1. This was caused by methanol poor solubility in this<br />
hydrophobic solvent, so the negative effects of methanol on lipase activity<br />
and stability could not be eliminated. Several hydrophilic organic solvents<br />
have also been tested for lipase-catalyzed biodiesel production and proved<br />
much less useful, as strongly interact with the essential water layer coating<br />
enzyme molecules [4, 11]. Other studies reported that when using hydrophilic<br />
1,4-dioxane and tert-butanol the enzymatic process was improved [4, 9, 11-13].<br />
In our study, we conducted the enzyme-catalyzed methanolysis of<br />
sunflower oil using Novozym 435, a well-known lipase that facilitates reactions<br />
between a wi<strong>de</strong> variety of substrates and a remarkably heat-tolerant enzyme.<br />
A mo<strong>de</strong>rate polar solvent, tert-butanol, was adopted as reaction medium for<br />
lipase-catalyzed methanolysis of sunflower oil in or<strong>de</strong>r to eliminate the<br />
negative effect caused by methanol and glycerol on lipase activity [11, 12].<br />
RESULTS AND DISCUSSION<br />
In this study, tert-butanol was used as reaction medium for lipasecatalyzed<br />
methanolysis of sunflower oil because it dissolves both methanol<br />
and glycerol and is not a substrate for lipases (lipases do not act on tertiary<br />
alcohols). Moreover, tert-butanol is a non-toxic solvent of relative low cost.<br />
The influence of tert-butanol was examined for the enzymatic<br />
methanolysis of sunflower oil and the result was shown in Figure 1. Total<br />
methyl ester content was very low in solvent-free system due to the toxicity<br />
of excessive methanol on lipase activity. But when tert-butanol was ad<strong>de</strong>d<br />
into the reaction mixture the ester content significantly increased. The highest<br />
content of methyl esters of 70% was obtained when the volume ratio of tertbutanol/oil<br />
reached 6:1 therefore this ratio was used for further studies.<br />
72
BIODIESEL PRODUCTION FROM SUNFLOWER OIL WITH CANDIDA ANTARCTICA LIPASE B<br />
Figure 1. Effect of tert-butanol quantity on the methanolysis of sunflower oil.<br />
Reaction conditions: methanol/oil molar ratio 6:1, 10% Novozym 435<br />
based on oil weight, 8 h reaction time.<br />
Effect of molar ratio of methanol/oil was studied and the results are<br />
shown in the Figure 2. It can be seen that total methyl ester content increased<br />
with the increasing of methanol/oil molar ratio and that the presence of tertbutanol<br />
as solvent allowed the use of methanol in high excess without lipase<br />
<strong>de</strong>activation.<br />
Figure 2. Effect of methanol to oil molar ratio on the methanolysis of sunflower oil.<br />
Reaction conditions: 10% Novozym 435 based on oil weight,<br />
tert-butanol/ oil volume ratio 6:1, 8 h reaction time.<br />
The effect of Novozym 435 dosage on the methanolysis of sunflower<br />
oil was shown in Figure 3. The methyl ester content was increased by increasing<br />
lipase dosage and when lipase dosage reached 10%, a content of 72%<br />
could be given at 8 h. Further increase of lipase dosage did not have that<br />
much effect on ester content.<br />
73
GOG ADRIANA, MIRCEA CHINTOANU, MARIUS ROMAN, EMIL LUCA, PAIZS CSABA, FL.-DAN IRIMIE<br />
74<br />
Figure 3. Effect of lipase dosage on the methanolysis of sunflower oil.<br />
Reaction conditions: methanol /oil molar ratio 6:1, tert-butanol/oil<br />
volume ratio 6:1, 8 h reaction time.<br />
These optimized conditions (10% Novozym 435 based on oil weight,<br />
tert-butanol/oil volume ratio 6:1, methanol/oil molar ratio 6:1) were further<br />
used for the enzymatic methanolysis of sunflower oil for 12 h reaction time. The<br />
results obtained are summarized in Table 1 and the time course methanolysis<br />
of sunflower oil was shown in Figure 4.<br />
Table 2. Fatty acid methyl ester content resulted for the enzymatic<br />
methanolysis of sunflower oil using tert-butanol as reaction medium<br />
Time<br />
[min]<br />
Total methyl ester content<br />
[wt %]<br />
15 9.19<br />
30 34.78<br />
45 50.21<br />
60 56.14<br />
90 63.76<br />
180 78.60<br />
360 77.06<br />
480 76.71<br />
540 70.74<br />
660 55.40<br />
It was observed that the FAME content reached its maximum after<br />
3h, with a value of 78.6% (m/m). After reaching this point the FAMEs<br />
content was maintained almost constant for another 2h and in the end a<br />
<strong>de</strong>crease of FAMEs content was observed.
BIODIESEL PRODUCTION FROM SUNFLOWER OIL WITH CANDIDA ANTARCTICA LIPASE B<br />
Figure 1. Time course methanolysis of sunflower oil. Reaction conditions:<br />
10 % Novozym 435 based on oil weight; methanol /oil molar ratio 6:1;<br />
tert-butanol/ oil volume ratio 6:1<br />
This <strong>de</strong>crease was caused by the mechanical disruption of the enzyme<br />
due to the physical agitation of the reaction mixture with the magnetic stirrer.<br />
Thus, the particles resulted from the enzyme and from the carrier <strong>de</strong>termined a<br />
dilution effect for the samples withdrawn after 8h. The results obtained showed<br />
a high activity of the lipase even in the presence of methanol in high excess<br />
and this high activity was maintained because of the tert-butanol used as<br />
reaction medium. However, disruption of the enzyme carrier by the physical<br />
agitation force may not promise the use of immobilized lipase for a long<br />
period of time. Thus, in case of immobilized lipases the solution would be<br />
the use of mechanical shakers instead of magnetic stirrers, or other reactor<br />
configurations such as packed-bed reactor.<br />
The wi<strong>de</strong>ly accepted mechanism for triglyceri<strong>de</strong>s alcoholysis follows a<br />
Ping-Pong Bi Bi mechanism, as each product is released between addition<br />
of the substrates [14-16]. When fitting to experimental results, simplifications<br />
such as Michaelis–Menten kinetics can also be applied [17]. The effect of<br />
substrate concentration on the initial reaction rate (V) catalyzed by the<br />
Novozym 435 lipase was studied using sunflower oil as the substrate.<br />
Thus, using Michaelis–Menten mo<strong>de</strong>l, Michaelis constant (Km) and the<br />
maximum reaction rate (Vmax) of Novozym 435 were calculated from the<br />
Lineweaver-Burk plot given in Figure 2. The experiment was run using substrate<br />
concentration in the range of 0.1 –0.6 M, at a constant methanol concentration<br />
of 3 M and in the presence of tert-butanol as reaction medium. The values<br />
obtained for initial reaction rate Vmax and the Michaelis constant Km were<br />
0.0165 M min -1 and 0.7118 M respectively.<br />
75
GOG ADRIANA, MIRCEA CHINTOANU, MARIUS ROMAN, EMIL LUCA, PAIZS CSABA, FL.-DAN IRIMIE<br />
76<br />
Figure 2. Lineweaver-Burk plot of sunflower oil methanolysis reaction for<br />
variation in triglyceri<strong>de</strong>s concentration in the range of 0.1 –0.6 M.<br />
The value of R 2 :0.9893<br />
CONCLUSIONS<br />
For the enzymatic methanolysis of sunflower oil a batch reactor was<br />
used and the reaction was performed un<strong>de</strong>r continuous agitation using a<br />
magnetic stirrer. The enzyme used was Novozym 435 and the reaction was<br />
performed in the presence of tert-butanol in or<strong>de</strong>r to avoid the inactivation<br />
of enzyme caused by methanol or by the glycerol formed during the reaction.<br />
The FAME content was 78.6% (m/m) after 3h, when the following optimized<br />
conditions have been used: 10% Novozym 435 based on oil weight, tertbutanol/oil<br />
volume ratio 6:1, methanol/oil molar ratio 6:1. The effect of substrate<br />
concentration on the initial reaction rate was studied using sunflower oil<br />
concentration in the range of 0.1 –0.6 M and the values obtained for initial<br />
reaction rate Vmax and Michaelis constant Km were 0.0165 M min -1 and<br />
0.7118 M respectively.<br />
The main disadvantage of the batch reactor used was the enzyme<br />
<strong>de</strong>naturation in time caused by mechanical <strong>de</strong>gradation produced by the<br />
magnetic stirring but the presence of tert-butanol improved the solubility of<br />
methanol in the reaction mixture, and thus lipase retained a high level of<br />
activity with all methanol ad<strong>de</strong>d for lipase-catalyzed methanolysis.<br />
EXPERIMENTAL SECTION<br />
Materials<br />
The Novozym 435, lipase B from Candida antarctica, immobilized on<br />
macroporous acrylic resin, 1–2% water content, 10,000 propyl laurate units/g)<br />
was purchased from Novozymes (Vienna, Austria). The sunflower oil was<br />
obtained locally and its characteristics are summarized in Table 1. Methyl
BIODIESEL PRODUCTION FROM SUNFLOWER OIL WITH CANDIDA ANTARCTICA LIPASE B<br />
ester standards (palmitic acid methyl ester, stearic acid methyl ester, oleic acid<br />
methyl ester, linoleic acid methyl ester, linolenic acid methyl ester, arachidic<br />
acid methyl ester, eicosane acid methyl ester, docosane acid methyl ester<br />
and hepta<strong>de</strong>canoic acid methyl ester) were obtained from Sigma-Aldrich<br />
(St. Louis, MO, USA) and were chromatographically pure; other chemicals and<br />
solvents were of the highest purity.<br />
Table 1. Fatty acid composition for the sunflower oil used for biodiesel production<br />
Systematic name Common name Abbr. Content<br />
[%] (m/m)<br />
Hexa<strong>de</strong>canoic acid Palmitic acid C16:0 6.2<br />
Octa<strong>de</strong>canoic acid Stearic acid C18:0 3.9<br />
cis-9-Octa<strong>de</strong>cenoic acid Oleic acid C18:1n9 26.3<br />
cis,cis-9,12-octa<strong>de</strong>cadienoic acid Linoleic acid C18:2n6 62.7<br />
6,9,12-octa<strong>de</strong>catrienoic acid γ-Linolenic acid C18:3n6 0.1<br />
Icosanoic acid Arachidic acid C20:0 0.2<br />
Docosanoic acid Behenic acid C22:0 0.6<br />
GC-FID analysis<br />
The fatty acid methyl ester contents in the reaction mixture were<br />
<strong>de</strong>termined using an Agilent 7890A GC (Agilent Technologies) gas chromatograph<br />
equipped with a DB-WAX capillary column (30m × 0.32mm × 0.5μm) and a<br />
flame ionization <strong>de</strong>tector. The instrumental configuration and the experimental<br />
conditions are given in Table 2.<br />
Methanolysis of sunflower oil<br />
Methanolysis reaction was carried out un<strong>de</strong>r continuous stirring in a 50<br />
mL round-bottomed flask, maintained at room temperature. In or<strong>de</strong>r to avoid<br />
the direct contact of lipase with methanol drops, methanol was mixed with tertbutanol<br />
and oil first, followed by the addition of lipase into the mixture. The<br />
reaction conditions were the following: 10% Novozym 435 based on oil weight;<br />
methanol /oil molar ratio 6:1; tert-butanol/ oil volume ratio 6:1.<br />
The methanolysis reaction using a batch reactor was monitored for<br />
12 h. Samples from reaction mixture were withdrawn at specific periods of<br />
time and analyzed to <strong>de</strong>termine the ester content. Before analysis, the samples<br />
were processed as the following: a volume of 100 μL sample was introduced<br />
in a mixture that contained 400 μL hexane, 400 μL methyl hepta<strong>de</strong>canoate<br />
(used as internal standard) and 100 μL water, and the solution obtained was<br />
centrifuged at 1000 rpm for 15 min. 1 μL from the organic phase was injected<br />
in the gas chromatograph to <strong>de</strong>termine the FAME content (m/m).<br />
77
GOG ADRIANA, MIRCEA CHINTOANU, MARIUS ROMAN, EMIL LUCA, PAIZS CSABA, FL.-DAN IRIMIE<br />
78<br />
Tabel 2. Instrumental configuration and experimental conditions used for<br />
GC-FID analysis of fatty acid methyl esters<br />
Instrumental configuration Agilent 7890N GC - FID<br />
GC Parameters<br />
Injector Split/Splitless<br />
Column DB-WAX 30 m x 0,25 mm(i.d.), 0,25μm<br />
Detector FID<br />
Experimental conditions<br />
Inlet temperature 250°C<br />
Injection mo<strong>de</strong> Split (Split ratio: 1/50)<br />
Injection volume 1 μl<br />
Carrier gas He<br />
Pressure 53 kPa<br />
Oven temperature 50, 1 min<br />
25°C/min to 200°C<br />
3°C/min to 230°C, 18 min<br />
Detector temperature 280°C<br />
Detector gases H2:40 ml/min;<br />
Air: 450 ml/min;<br />
He make-up: 30 ml/min<br />
ACKNOWLEDGMENTS<br />
This work was financially supported by The Partnerships in Priority<br />
Domains Program of National Center of Programs Management from Romania,<br />
Project No. 22094/2008.<br />
REFERENCES<br />
1. D. Bajpai, V.K. Tyagi, J. Oleo. Sci., 2006, 55, 487.<br />
2. G. Knothe, J.V. Gerpen, V. Krahl, “Basics of the Transesterification Reaction, The<br />
Biodiesel Handbook”, Champaign, III, AOCS Press, 2005, 26.<br />
3. L.C. Meher, D.V. Sagar, S.N. Naik, Renew. Sustain. Ener. Rev., 2004, 1.<br />
4. M. Iso, B. Chen, M. Eguchi, T. Kudo, S. Shrestha, J. Mol. Catal. B: Enzym., 2001,<br />
16, 53.<br />
5. S. Shah, S. Sharma, M.N. Gupta, Indian J. Biochem. Biophys., 2003, 40, 392.<br />
6. G.-T. Jeong, D.-H. Park, Appl. Biochem. Biotechnol., 2008, 148, 131.<br />
7. Y. Shimada, Y. Watanabe, A. Sugihara, Y. Tominaga, J. Mol. Catal. B: Enzym.,<br />
2002, 17, 133.
BIODIESEL PRODUCTION FROM SUNFLOWER OIL WITH CANDIDA ANTARCTICA LIPASE B<br />
8. L.A. Nelson, T.A. Foglia, W.N. Marmer, J. Am. Oil Chem. Soc., 1996, 73, 1191.<br />
9. M.M. Soumanou, U.T. Bornscheuer, Enzyme Microb. Technol., 2003, 33, 97.<br />
10. K. Nie, F. Xie, F. Wang, T. Tan, J. Mol. Catal. B Enzym., 2006, 43, 142.<br />
11. D. Royon, M. Daz, G. Ellenrie<strong>de</strong>r, S. Locatelli, Bioresour. Technol., 2007, 96, 767.<br />
12. L. Li, W. Du, D. Liu, L. Wang, Z. Li, J. Mol. Catal. B: Enzym., 2006, 43, 58.<br />
13. J.W. Chen, W.T. Wu, J. Biosci. Bioeng., 2003, 95, 466.<br />
14. A.L. Paiva, V.M. Balcao, F.X. Malcata, Enzyme Microb. Technol., 2000, 27, 187.<br />
15. T. Garcia, A. Coteron, M. Martinez, J. Aracil, Chem. Eng. Sci., 1996, 51, 2841.<br />
16. V. Dossat, D. Combes, A. Marty, Enzyme Microb. Technol., 2002, 30, 90.<br />
17. X. Xu, “Modification of oils and fats by lipase-catalyzed interesterification:<br />
Aspects of process engineering” in: U. T. Bornscheuer, (Ed.), Enzymes in lipid<br />
modification, Wiley-VCH, Weinheim, Germany, 2000, 190.<br />
79
STUDIA UBB CHEMIA, LVI, 1, 2011<br />
ORGANICS REMOVAL FROM AQUEOUS SOLUTIONS USING<br />
SUSPENDED AND IMMOBILIZED ROMANIAN BENTONITES<br />
ANDRADA MĂICĂNEANU a,* , CERASELLA INDOLEAN a ,<br />
SILVIA BURCĂ a , MARIA STANCA a , HOREA BEDELEAN b ,<br />
MAJDIK CORNELIA a<br />
ABSTRACT. This work presents experimental results obtained in the process<br />
of phenol and Fastac pestici<strong>de</strong> removal from aqueous solutions using batch<br />
technique (immobile phases, 3D shaker, magnetic stirring) on Romanian<br />
bentonites (Oraşul Nou and Petreşti <strong>de</strong>posits). Bentonite samples were used<br />
in suspension and immobilized in alginate beads. Influences of bentonite<br />
provenience and quantity, batch contact type and phenol concentration over<br />
the process efficiency were studied. The most effective bentonite proved to<br />
be the one from Oraşul Nou. Removal efficiencies up to 80% were reached<br />
in case of phenol solutions with concentrations smaller then 50 mg/L on<br />
immobilized bentonite and Fastac (100 mg/L) on suspen<strong>de</strong>d bentonite.<br />
Also, adsorption capacity increased with the <strong>de</strong>crease of the bentonite<br />
quantity and the increase of the initial phenol concentration.<br />
Keywords: bentonite, suspension, alginate beads, phenol, pestici<strong>de</strong>, adsorption<br />
INTRODUCTION<br />
Phenolic compounds, which are released into the aquatic environment<br />
by industries such as coke ovens in steel plants, petroleum refineries,<br />
petrochemical, phenolic resin, and fertilizer, pharmaceutical, chemical, and<br />
dye industries and have been reported in hazardous wastes sites, are<br />
consi<strong>de</strong>red to be hazardous wastes [1].<br />
The utilization of phenol-contaminated waters causes protein<br />
<strong>de</strong>generation, tissue erosion, paralysis of the central nervous system and<br />
also damages the kidney, liver and pancreas in human bodies [2].<br />
According to the recommendation of World Health Organization (WHO),<br />
the permissible concentration of phenolic contents in potable waters is 1g/L [3]<br />
and the regulations by the Environmental Protection Agency (EPA), call for<br />
lowering phenol content in wastewaters less than 1mg /L [4].<br />
a Universitatea Babeş-Bolyai, <strong>Facultatea</strong> <strong>de</strong> <strong>Chimie</strong> <strong>şi</strong> <strong>Inginerie</strong> <strong>Chimică</strong>, Str. Kogălniceanu,<br />
Nr. 1, RO-400084 Cluj-Napoca, Romania, * andrada@chem.ubbcluj.ro<br />
b Universitatea Babeş-Bolyai, <strong>Facultatea</strong> <strong>de</strong> Biologie <strong>şi</strong> Geologie, Str. Kogălniceanu, Nr. 1,<br />
RO-400084 Cluj-Napoca, Romania, horea.be<strong>de</strong>lean@ubbcluj.ro
A. MĂICĂNEANU, C. INDOLEAN, S. BURCĂ, M. STANCA, H. BEDELEAN, C. MAJDIK<br />
According to Romanian legislation the maximum allowable concentration<br />
of phenol in surface waters and municipal sewer system is 0.3 and 30 mg/L,<br />
respectively [5], therefore elimination of phenol becomes a necessity in or<strong>de</strong>r<br />
to preserve water quality [6]. In case of drinking water Romanian legislation<br />
states values of 0.001 to 0.1 mg phenol/L for waters that are used for drinking<br />
water production [5].<br />
Fastac is one of the many commercial names for alpha-cypermethrin,<br />
which is a compound from synthesis pyrethroid pestici<strong>de</strong> group. It is used<br />
on a large scale as an insectici<strong>de</strong> and acarici<strong>de</strong>. It behaves as neurotoxin<br />
(non-systemic insectici<strong>de</strong>) in insects (e.g. cockroaches, mosquitoes, flies).<br />
Alpha-cypermethrin is highly toxic to fish, bees and aquatic insects; it can<br />
produce acute poisoning in humans (tingling, burning dizziness, itching, nausea,<br />
tiredness) by contact inhalation or ingestion [7]. According to Romanian<br />
legislation the maximum allowable concentration of pestici<strong>de</strong> as total pestici<strong>de</strong>s<br />
varies from 0.5 μg/L for potable water to 1-5 μg/L for waters subjected to<br />
various treatments in or<strong>de</strong>r to obtain potable water [5].<br />
Various methods have been proposed for the treatment of wastewaters<br />
containing organic and inorganic pollutants. These processes are based on<br />
the principles of precipitation and coagulation, chemical oxidation, sedimentation,<br />
filtration, adsorption, osmosis, ion exchange, etc. Adsorption technology is<br />
currently being used extensively for the removal of organic and inorganic<br />
micro pollutants from aqueous solutions. There are many absorbents in use.<br />
Activated carbon is the most wi<strong>de</strong>ly used for the removal of a variety of<br />
organics from waters, but the disadvantage associated with it is the high<br />
regeneration cost and the generation of carbons fines, due to the brittle nature<br />
of carbons used for the removal of organic species [8].<br />
Adsorbents from low-cost materials, such as fertilizer wastes [9],<br />
wood [10], and rice husk [11], by several chemical treatments are currently<br />
<strong>de</strong>veloped for phenol removal. The use of sawdust for the removal of phenol<br />
from aqueous solution was also studied by Sivanandam and Anirudhan [12].<br />
Natural zeolites gained a significant interest among scientist, mainly<br />
due to their valuable properties such as ion exchange ability and high<br />
surface areas. Large <strong>de</strong>posits of natural zeolites in many countries such as<br />
Greece, UK, Italy, Mexico, Iran, and Jordan, provi<strong>de</strong> local industries some<br />
promising benefits such as cost efficiency since they are able to treat<br />
wastewater contaminated with organic solutes at low-costs [8,13].<br />
Clay is one of the potential alternatives to activated carbon as well.<br />
Similar to zeolites, clay minerals are important inorganic components in<br />
soil. Their sorption capabilities come from high surface area and exchange<br />
capacities. The negative charge on the structure of clay minerals gives clay<br />
the capability to be modified by surfactant. USA, Lithuania, Georgia,<br />
Romania and Kazakhstan are well known for their large <strong>de</strong>posits of natural<br />
clay minerals [6,8,14].<br />
82
ORGANICS REMOVAL FROM AQUEOUS SOLUTIONS USING SUSPENDED AND IMMOBILIZED …<br />
Bentonite is a member of 2:1 clay minerals (meaning that it has two<br />
tetrahedral sheets sandwiching a central octahedral sheet) which consists<br />
essentially of clay minerals of montmorillonite group. Bentonite is characterized<br />
by an Al octahedral sheet between two Si tetrahedral sheets. It has a<br />
negative surface charge created by the isomorphous substitution of Al 3+ for<br />
Si 4+ in tetrahedral layer and Mg 2+ for Al 3+ in octahedral layer. The bentonite<br />
surface is hydrophilic in nature because inorganic cations, such as Na + and<br />
Ca 2+ , are strongly hydrated in presence of water. As a result, the adsorption<br />
efficiency of natural bentonite for organic molecules is low. The adsorption<br />
properties of bentonite can be improved by the modification of clay mineral<br />
surface with a cationic surfactant. [15,16].<br />
The aim of this work was to investigate, the potential of two Romanian<br />
bentonites from Oraşul Nou, (ON), Satu Mare County, and Petreşti (P), Cluj<br />
County, used in suspension, and immobilized in calcium alginate to adsorb<br />
phenol and Fastac pestici<strong>de</strong> from aqueous solutions, in batch conditions<br />
(Influences of bentonite provenience and quantity, batch contact type and<br />
phenol concentration over the process efficiency were studied). The consi<strong>de</strong>red<br />
bentonites were used without any chemical modification of their structure.<br />
RESULTS AND DISCUSSION<br />
Bentonite samples<br />
In or<strong>de</strong>r to realise the proposed adsorption study, two bentonite samples<br />
were collected from two <strong>de</strong>posits located in Transylvania, Romania, namely,<br />
Oraşul Nou, (ON), and Petreşti (P). Bentonite samples were collected as<br />
representative bulk rock sample from the open pits.<br />
The bentonite <strong>de</strong>posit from Oraşul Nou (Satu Mare County) is located<br />
about 30 km north-west of the city of Baia Mare. The bentonites were formed<br />
by alteration of rhyolites and perlites, due to the solutions’ complex circulation<br />
through the rocks. They are white in colour, fine grained or compact, the<br />
perlitic fabric being more or less preserved. The mineralogical composition<br />
of raw material was analysed using XRD and indicates the presence of<br />
montmorillonite, as the main clay mineral (subordinately kaolinite, illite),<br />
cristobalite, carbonates, clinoptilolite, iron oxi-hydroxi<strong>de</strong>s and quartz and feldspar<br />
(as relics of primary minerals). According to the transformation <strong>de</strong>gree of the<br />
primary rock, the amount of montmorillonite varies between 20-85% [17].<br />
The bentonite <strong>de</strong>posit from Petreşti (Cluj County, Romania) is located at<br />
about 30 km south from Cluj-Napoca (north-western part of Romania). The<br />
bentonite <strong>de</strong>posit was formed at then contact of the carbonate rocks (Upper<br />
Jurassic age) and basaltic an<strong>de</strong>sites and basalts rock, generated by circulating<br />
hydrothermal fluids. The main rocks are represented by Ca-bentonites white<br />
and white-yellowish in color. Mineralogical composition of clay raw material<br />
resulting from X-ray diffraction analyses is represented by smectite (montmorillonite)<br />
65-72%, mica/illite, quartz, cristobalite, feldspars and clinoptilolite [14].<br />
83
84<br />
A. MĂICĂNEANU, C. INDOLEAN, S. BURCĂ, M. STANCA, H. BEDELEAN, C. MAJDIK<br />
Suspen<strong>de</strong>d bentonite – phenol removal<br />
In figure 1 are presented the results obtained for the two bentonite<br />
samples in batch conditions, immobile phases and magnetic stirring. It can be<br />
observed that the highest increase of the removal efficiency is in the first 24<br />
hours, respectively in the first 15 minutes from the beginning of the experiment<br />
<strong>de</strong>pending on the contact type (immobile vs. stirring).<br />
Efficiency (%)<br />
Efficiency (%)<br />
18<br />
16<br />
14<br />
12<br />
10<br />
8<br />
6<br />
4<br />
2<br />
0<br />
30<br />
25<br />
20<br />
15<br />
10<br />
5<br />
0<br />
0 24 48<br />
Time (h)<br />
72 96<br />
0 15 30 45 60 75<br />
Time (min)<br />
(b).<br />
Figure 1. Time evolution of phenol removal efficiency on bentonite samples (suspen<strong>de</strong>d)<br />
from Oraşul Nou (ON) and Petreşti (P) in batch conditions, solid : liquid ratio = 1:10,<br />
Ci = 100 mg phenol/L; (a) immobile phases, and (b) magnetic stirring.<br />
Also the equilibrium was reached after 96 hours, respectively after<br />
75 minutes (diffusion limitations are reduced with stirring intensification) for<br />
both bentonite samples. If we compare the values obtained for ON and P<br />
samples it is easy to observe that in all cases the ON sample proved to be<br />
more efficient, results that can be correlated with the specific surface area of<br />
the bentonite sample, which is higher in case of ON (72 m 2 /g) by comparison<br />
with 64 m 2 /g for P.<br />
In case of the batch conditions realised using a 3D shaker, exemplified<br />
for P sample in figure 2, equilibrium was reached after 150 minutes suggesting<br />
that external diffusion limitation are diminished by comparison with immobile<br />
ON<br />
P<br />
ON<br />
P<br />
(a).
ORGANICS REMOVAL FROM AQUEOUS SOLUTIONS USING SUSPENDED AND IMMOBILIZED …<br />
phases, but they still have a great influence taking in account that the equilibrium<br />
was reached in 150 minutes by comparison to 75 minutes for the magnetic<br />
stirring. Another aspect observed in case of 3D shaker by comparison with<br />
magnetic stirring was that the increase of the adsorption efficiency (<strong>de</strong>crease<br />
of the phenol quantity in solution) takes place more slowly.<br />
Efficiency (%)<br />
25<br />
20<br />
15<br />
10<br />
5<br />
0<br />
0 50 100<br />
Time (min)<br />
150 200<br />
Figure 2. Time evolution of phenol removal efficiency on bentonite sample (suspen<strong>de</strong>d)<br />
from Petreşti (P) in batch conditions – 3D shaker, solid : liquid ratio = 1:10,<br />
Ci = 100 mg phenol/L.<br />
The influence of the contact type in batch conditions for phenol<br />
adsorption in suspension is presented in figure 3, for ON sample. As the<br />
intensity of the mass transfer increases due to a more intense stirring, the<br />
removal efficiency also increases.<br />
The influence of the bentonite quantity (solid : liquid ratio) over the<br />
removal process efficiency is exemplified in figure 4, for P sample when 2<br />
and 4 grams of bentonite were suspen<strong>de</strong>d in 20 ml of phenol solution. An<br />
increase in the adsorbent quantity led to only a small increase in the removal<br />
efficiency, suggesting that an increase of the bentonite quantity (more than<br />
2 grams) is not economically feasible.<br />
Efficiency, (%)<br />
30<br />
25<br />
20<br />
15<br />
10<br />
5<br />
0<br />
16.56<br />
23.21<br />
26.79<br />
static 3D magnetic stirring<br />
Figure 3. Maximum phenol removal efficiency on ON bentonite sample (suspen<strong>de</strong>d),<br />
obtained in batch conditions, solid : liquid ratio = 1:10, Ci = 100 mg phenol/L.<br />
85
A. MĂICĂNEANU, C. INDOLEAN, S. BURCĂ, M. STANCA, H. BEDELEAN, C. MAJDIK<br />
4g<br />
2g<br />
Figure 5. Time evolution of Fastac removal efficiency on bentonite samples (suspen<strong>de</strong>d<br />
from Oraşul Nou (ON) and Petreşti (P) in batch conditions – magnetic stirring,<br />
solid : liquid ratio = 1:10, Ci = 100 mg Fastac/L.<br />
86<br />
22.02<br />
27.15<br />
0 5 10 15 20 25 30<br />
Efficiency (%)<br />
Figure 4. Bentonite quantity influence over the maximum phenol removal efficiency<br />
on the P bentonite sample (suspen<strong>de</strong>d) in batch conditions – 3D shaker, corresponding<br />
to a solid : liquid ratio of 1:10 and 2:10 respectively, Ci = 100 mg phenol/L.<br />
Suspen<strong>de</strong>d bentonite – Fastac (alpha-cypermethrin) removal<br />
Adsorption of Fastac pestici<strong>de</strong> was realised in similar conditions on<br />
the ON and P samples. In case of immobile phases (static), as for phenol,<br />
the adsorption equilibrium was reached in 96 hours, again with better removal<br />
efficiencies on the ON sample, 65.78% (ON) by comparison with 57.22% (P).<br />
In case of magnetic stirring, figure 5, adsorption efficiency increased very<br />
much in the first 15 minutes, after that a slowly increase until equilibrium (75<br />
minutes) being observed. A direct comparison between the batch conditions,<br />
figure 6, showed that magnetic stirring is more efficient due to a more intense<br />
stirring leading to a more intense mass transfer. The highest adsorption<br />
efficiency was calculated to be 78.61% in case of ON bentonite sample.<br />
Efficiency (%)<br />
90<br />
80<br />
70<br />
60<br />
50<br />
40<br />
30<br />
20<br />
10<br />
0<br />
0 20 40 60 80 100<br />
Time (min)<br />
ON<br />
P
ORGANICS REMOVAL FROM AQUEOUS SOLUTIONS USING SUSPENDED AND IMMOBILIZED …<br />
Efficiency (%)<br />
80<br />
70<br />
60<br />
50<br />
40<br />
30<br />
20<br />
10<br />
0<br />
ON P<br />
static magnetic stirring<br />
Figure 6. Maximum Fastac removal efficiencies on Oraşul Nou (ON) and Petreşti (P)<br />
bentonite samples (suspen<strong>de</strong>d), obtained in batch conditions,<br />
solid : liquid ratio = 1:10, Ci = 100 mg Fastac/L.<br />
Immobilized bentonite – phenol removal<br />
In the first stage of the experiment, phenol adsorption was realised<br />
in a batch reactor with mobile phases, benonite-alginate beads, ON and P<br />
samples, being contacted with the phenol solution using a magnetic stirrer.<br />
The obtained results are presented in terms of adsorption capacity evolution in<br />
time, figure 7, and maximum adsorption efficiency, figure 8, for the same<br />
quantity of bentonite present in the beads (8g) and the same phenol initial<br />
concentration (103.77 mg/L). From figure 7 it can be observed that in the<br />
first 15 minutes from the beginning of the experiment the highest quantity of<br />
phenol is removed. Also at the beginning of the experiment P sample looks<br />
to be more efficient, while towards the end of the experiment ON sample will<br />
retain a higher quantity of phenol. This fact can be attributed to the internal<br />
diffusion limitation for ON sample which has a higher specific surface area<br />
as was mentioned before. Adsorption capacity was calculated to be 0.708<br />
mg/g and 0.629 mg/g for ON and P samples respectively. The adsorption<br />
equilibrium was reached after 180 minutes. If we compare this value with<br />
that obtained when the bentonite was suspen<strong>de</strong>d (75 minutes) it can be<br />
observed that the time for reaching equilibrium is more than double (due to<br />
diffusion limitation in the alginate bead). Maximum values for adsorption<br />
efficiencies, figure 8, showed also that ON immobilized bentonite sample is<br />
more efficient in phenol removal process. Taking into account the fact that ON<br />
bentonite sample proved to be the most efficient one in the phenol adsorption<br />
process, this sample was next consi<strong>de</strong>red for the rest of adsorption experiments.<br />
For a better use of the adsorbent (optimisation of the adsorbent quantity)<br />
the next stage of the experiment was to study the evolution of the adsorption<br />
process for different ON bentonite quantities immobilized in calcium alginate<br />
beads (2-8g) at different initial concentrations of phenol in solution. In figures 9<br />
and 10 the results obtained for Ci = 157.23 mg phenol/L and all consi<strong>de</strong>red<br />
bentonite quantities are presented. Evolution of the adsorption efficiency in<br />
87
A. MĂICĂNEANU, C. INDOLEAN, S. BURCĂ, M. STANCA, H. BEDELEAN, C. MAJDIK<br />
time, figure 9, showed that in the first 15 minutes from the beginning of the<br />
experiment, the highest quantity of phenol was adsorbed, after that the<br />
adsorbed quantity increase very slowly in case of 2 and 4 g of bentonite<br />
and increase slowly in case of 8g benotnite. Equilibrium was reached in<br />
about 60 minutes.<br />
Q (mg/g)<br />
0.80<br />
0.70<br />
0.60<br />
0.50<br />
0.40<br />
0.30<br />
0.20<br />
0.10<br />
0.00<br />
0 15 30 45 60 90 120 150 180 210<br />
Time (min)<br />
Figure 7. Time evolution of phenol adsorption capacities for Oraşul Nou (ON) and<br />
Petreşti (P) bentonite samples (immobilized), 8g bentonite,<br />
Ci = 103.77 mg phenol/L.<br />
P<br />
ON<br />
Figure 9. Influence of the bentonite quantity over the time evolution of phenol<br />
removal efficiency, 4g ON bentonite (immobilized), Ci = 157.23 mg phenol/L.<br />
88<br />
48.48<br />
54.55<br />
44 46 48 50 52 54 56<br />
Efficiency (%)<br />
Figure 8. Maximum adsorption efficiency obtained on bentonite samples (immobilized)<br />
from Oraşul Nou (ON) and Petreşti (P), 8g bentonite, Ci = 103.77 mg phenol/L.<br />
Efficiency (%)<br />
80<br />
70<br />
60<br />
50<br />
40<br />
30<br />
20<br />
10<br />
0<br />
0 50 100<br />
Time (min)<br />
150 200<br />
ON<br />
P<br />
2g<br />
4g<br />
8g
ORGANICS REMOVAL FROM AQUEOUS SOLUTIONS USING SUSPENDED AND IMMOBILIZED …<br />
To have a more complete image of the adsorption process on the<br />
chosen bentonite sample, adsorption capacities were calculated in or<strong>de</strong>r to<br />
inclu<strong>de</strong> into the numerical values also the bentonite quantities we used, figure<br />
10. From the values in figure 10, it is easy to observe that as the bentonite<br />
quantity increases, the adsorption capacity <strong>de</strong>creases. Therefore if an adsorption<br />
process of this type is consi<strong>de</strong>red for practical uses, it will be necessary to<br />
take into consi<strong>de</strong>ration the initial phenol concentration and water quantity<br />
that need to be treated, in or<strong>de</strong>r to establish the appropriate bentonite quantity.<br />
Also adsorption efficiency should be calculated and evaluated along with<br />
bentonite quantity from the economic point of view. As our results show, an<br />
increase of the bentonite quantity will lead to an increase of adsorption efficiency,<br />
which will finally lead to an increase of the operating cost.<br />
Q (mg/g)<br />
3.5<br />
3.0<br />
2.5<br />
2.0<br />
1.5<br />
1.0<br />
0.5<br />
0.0<br />
3.302<br />
Figure 11. Influence of the phenol initial concentration over the removal process<br />
kinetics on 4g ON bentonite (immobilized), C1 = 31.35, C2 = 53.46, C3 = 103.77,<br />
C4 = 157.23 mg phenol/L.<br />
89<br />
2.044<br />
2g 4g 8g<br />
Figure 10. Bentonite quantity influence over the adsorption capacity values for<br />
phenol removal, ON bentonite (immobilized), Ci = 157.23 mg phenol/L.<br />
In the final part of the study, the influence of the initial phenol concentration<br />
over the adsorption process was studied. Were used solutions containing<br />
between 31 and 160 mg phenol/L and as adsorbent 4g of ON bentonite<br />
immobilized in calcium alginate beads. Influence of phenol initial concentration<br />
over the evolution of phenol concentration in time is presented in figure 11.<br />
C (mg/L)<br />
180<br />
160<br />
140<br />
120<br />
100<br />
80<br />
60<br />
40<br />
20<br />
0<br />
0 50 100 150 200<br />
Time (min)<br />
1.494<br />
C1<br />
C2<br />
C3<br />
C4
A. MĂICĂNEANU, C. INDOLEAN, S. BURCĂ, M. STANCA, H. BEDELEAN, C. MAJDIK<br />
As the initial concentration <strong>de</strong>creases, the quantity of phenol retained<br />
in the first 15 minutes <strong>de</strong>creases also, due to the smaller difference that exist<br />
between the concentration of phenol on the adsorbent surface and in the<br />
solution. Therefore the adsorption capacity of the immobilized ON, increases<br />
with an increase of the phenol initial concentration, from 0.393 to 2.044 mg<br />
phenol/L, figure 12.<br />
Q (mg/g)<br />
2.5<br />
2.0<br />
1.5<br />
1.0<br />
0.5<br />
0.0<br />
0.393<br />
0.512<br />
In this study two bentonite samples collected from two <strong>de</strong>posits,<br />
Oraşul Nou, (ON), Satu Mare County, and Petreşti (P), Cluj County, were used<br />
as adsorbents for phenol and Fastac (alpha-cypermethrin). The two bentonite<br />
samples were used suspen<strong>de</strong>d or immobilized in Ca-alginate beads. The<br />
bentonite samples were used as pow<strong>de</strong>r, (d < 0.2 mm), without any chemical<br />
treatment.<br />
90<br />
1.101<br />
C1 C2 C3 C4<br />
Figure 12. Adsorption capacity values for phenol removal for different initial<br />
concentrations, 4g ON bentonite (immobilized), C1 = 31.35, C2 = 53.46,<br />
C3 = 103.77, C4 = 157.23 mg phenol/L.<br />
CONCLUSIONS<br />
This work presents experimental results obtained in the process of<br />
phenol and Fastac pestici<strong>de</strong> removal from aqueous solutions using batch<br />
technique (immobile phases, 3D shaker and magnetic stirring) and suspen<strong>de</strong>d<br />
and alginate immobilized bentonite as adsorbent. Influences of bentonite<br />
provenience (Oraşul Nou and Petreşti samples) and quantity (2-8 grams),<br />
batch contact type and phenol concentration (31-160 mg/L) over the process<br />
efficiency were studied.<br />
The most effective bentonite sample proved to be the one from Oraşul<br />
Nou in suspen<strong>de</strong>d and alginate immobilized form as well. Removal efficiencies<br />
up to 80% were reached. Also, adsorption capacity increased with a <strong>de</strong>crease<br />
in the bentonite quantity and an increase of the initial phenol concentration<br />
showing the capacity of this adsorbent to retain organic compounds.<br />
EXPERIMENTAL SECTION<br />
2.044
ORGANICS REMOVAL FROM AQUEOUS SOLUTIONS USING SUSPENDED AND IMMOBILIZED …<br />
Phenol solutions with concentrations ranging from 31 to 160 mg/L were<br />
prepared. Fastac working solution, 100 mg/L, was obtained from commercial<br />
available pestici<strong>de</strong> vials. Fastac is one of the many commercial names for<br />
alpha-cypermethrin, which is a compound from synthesis pyrethroid pestici<strong>de</strong><br />
group, containing more than 90% the most active pair (Scheme 1, (RS)-αciano-3-fenoxibenzil<br />
(1RS)-cis-3-(2,2-diclorovinil)-2,2-dimetilciclopropan carboxilat)<br />
from the 4 cis isomers of cypermethrine, as racemic mixture [7].<br />
Cl<br />
Cl<br />
(1R, cis)<br />
COO<br />
H CN<br />
(alfaS)<br />
O<br />
Cl<br />
Cl<br />
COO<br />
H CN<br />
(1S, cis)<br />
(alfaR)<br />
Scheme 1<br />
Besi<strong>de</strong> Fastac which was used in its commercial available form, all<br />
chemicals used in this study were analytical reagent gra<strong>de</strong> (phenol, alginic<br />
acid sodium salt, ethanol and CaCl2).<br />
Removal efficiencies (E, %), equation (1), and adsorption capacities<br />
(Q, mg/g), equation (2), were calculated in or<strong>de</strong>r to establish the effectiveness<br />
of the consi<strong>de</strong>red samples in the organics removal process (the calculated<br />
values of removal efficiencies and adsorption capacities should be regar<strong>de</strong>d<br />
according to the precision of the <strong>de</strong>termination methods we used). Q was<br />
calculated just in case of immobilized bentonite where phenol was <strong>de</strong>termined<br />
using the spectrophotometric procedure.<br />
where,<br />
C − C<br />
E =<br />
Ci<br />
C − Ct<br />
Q =<br />
m<br />
i t ⋅<br />
i ⋅<br />
Bentonite samples were suspen<strong>de</strong>d in phenol or Fastac solutions and<br />
contacted in three ways in batch conditions: immobile phases (static), mobile<br />
phases 3D shaker (GFL 3012) and magnetic stirring (FALC F60, 825 rpm) with a<br />
91<br />
100<br />
V<br />
1000<br />
Ci, initial organic concentration in solution, in mg/dm 3<br />
Ct, organic concentration in solution at time t, in mg/dm 3<br />
V, sample volume, 100 cm 3<br />
m, bentonite quantity, in g.<br />
Suspen<strong>de</strong>d bentonite<br />
O<br />
(1)<br />
(2)
A. MĂICĂNEANU, C. INDOLEAN, S. BURCĂ, M. STANCA, H. BEDELEAN, C. MAJDIK<br />
solid liquid ratio of 1:10 and 2:10. In or<strong>de</strong>r to <strong>de</strong>termine organics concentration<br />
in the aqueous solutions, water samples were collected every 24 hours, every<br />
15 minutes and every 30 minutes for batch conditions realised in static, 3D and<br />
magnetic stirring conditions respectively. The experiments were conducted<br />
in isothermal conditions at room temperature until equilibrium was reached.<br />
Organics concentration in solution was <strong>de</strong>termined as chemical oxygen<br />
<strong>de</strong>mand COD, using KMnO4 standard procedure. Prior to this <strong>de</strong>termination<br />
a centrifugation procedure at 5000 rpm (Hettich EBA21) was realised in or<strong>de</strong>r to<br />
remove solid particles from solution. We studied the influence of the bentonite<br />
provenience and quantity, and working conditions over the process efficiency.<br />
Immobilized bentonite<br />
ON and P bentonite samples pow<strong>de</strong>r were immobilized in alginate<br />
beads using the entrapment procedure with calcium alginate [18,19]. Thus,<br />
various quantities of bentonite (2, 4, 8, g) were immobilized in Ca-alginate<br />
beads. For phenol adsorption study we used aqueous solutions containing<br />
between 31 and 160 mg phenol/L. Concentration of phenol in solution was<br />
<strong>de</strong>termined using a Jenway 6305 UV/VIS spectrophotometer (UV, 270 nm)<br />
after a preliminary centrifugation (14000 rpm, Mikro 200R Hettich centrifuge).<br />
Phenol adsorption process was realized in batch conditions un<strong>de</strong>r magnetic<br />
stirring (FALC F60, 825 rpm) using 100 ml phenol solution of different<br />
concentrations, in which Ca-alginate bentonite beads obtained from the <strong>de</strong>sired<br />
quantity of adsorbent were suspen<strong>de</strong>d. In or<strong>de</strong>r to <strong>de</strong>termine the exact<br />
concentration of phenol and establish the evolution of the removal process,<br />
water samples from the supernatant, diluted as required, were collected at<br />
different time intervals, every 24 hours when we used immobile phases,<br />
and every 15 minutes for the first hour and next every 30 minutes when we<br />
used mobile phases (magnetic stirring), until equilibrium was reached. We<br />
studied the influence of the bentonite provenience and quantity, and phenol<br />
concentration in solution over the process efficiency in batch conditions.<br />
REFERENCES<br />
1. M. Ahmaruzzaman, D.K. Sharma, Journal of Colloid and Interface Science,<br />
2005, 287, 14.<br />
2. A. Knop, L.A. Pilato, Phenolic Resins-Chemistry. Applications and Performance,<br />
1985, Springer-Verlag Ed.<br />
3. WHO (World Health Organization), Gui<strong>de</strong>lines for Drinking Water Quality: Health<br />
Criteria and Supporting Information, World Health Organization, Geneva, Switzerland,<br />
1984, volume 2.<br />
92
ORGANICS REMOVAL FROM AQUEOUS SOLUTIONS USING SUSPENDED AND IMMOBILIZED …<br />
4. N.N. Dutta, S. Brothakur, R. Baruaha, Water Environmental Resources, 1998, 70, 4.<br />
5. *** Romanian Government <strong>de</strong>cision, HG 188/2002 modified with HG 352/2005;<br />
law 458/2002 modified with law 311/2004 (NTPA-001, -002, -013).<br />
6. C. Majdik, A. Măicăneanu, C. Indolean, S. Burcă, M. Stanca, Studia UBB Chemia,<br />
2010, LV, 115.<br />
7. A. Măicăneanu, H. Be<strong>de</strong>lean, M. Stanca, Zeoliţi naturali. Caracterizare <strong>şi</strong> aplicaţii<br />
în protecţia mediului, 2008, Presa Universitară Clujeană, Cluj-Napoca.<br />
8. S.-H. Lin, R.-S. Juang, Journal of Environmental Management, 2009, 90, 1336.<br />
9. S.K. Srivastava, R. Tyagi, N. Pal, D. Mohan, Journal of Environmental Engineering,<br />
1997, 123, 842.<br />
10. H.M. Asfour, O.A. Fadali, M.M. Nassar, M.S. El-Geundi, Journal of Chemical<br />
Technology and Biotechnology, 1985, 35a, 21.<br />
11. K. Srinivasan, N. Balasubramanian, T.V. Ramakrishna, Indian Journal of Environmental<br />
Health, 1988, 30, 376.<br />
12. A.V. Sivanandam, T.S. Anirudhan, Indian Journal of Chemical Technology, 1995,<br />
2, 137.<br />
13. M. Spysnskyy, T. Ligor, B. Buszewski, Journal of Hazardous Materials, 2008, 151,<br />
570.<br />
14. H. Be<strong>de</strong>lean, A. Măicăneanu, S. Burcă, S., M. Stanca, Clay Minerals, 2009, 44, 486.<br />
15. H.B. Senturk, D. Oz<strong>de</strong>s, A. Gundogdu, C. Duran, M. Soylak, Journal of Hazardous<br />
Materials, 2009, 172, 353.<br />
16. Q. Zhou, H.P. He, J.X. Zhu, W. Shen, R.L. Frost, P. Yuan, Journal of Hazardous<br />
Materials, 2008, 154, 1025.<br />
17. A. Măicăneanu, H. Be<strong>de</strong>lean, S. Burcă, M. Stanca, Studia UBB Chemia, 2009,<br />
54, 127.<br />
18. S. Schiewer, E. Fourest, K.H. Chong, B. Volesky, Biohydrometallurgical Processing,<br />
1995, 2, 219.<br />
19. Sz. Tonk, A. Măicăneanu, C. Indolean, S. Burcă, C. Majdik, Journal of Serbian<br />
Chemical Society, 2010, in press.<br />
93
STUDIA UBB CHEMIA, LVI, 1, 2011<br />
THE INFLUENCE OF TiO2 NANOPARTICLES ON MORPHO-<br />
STRUCTURAL AND ANTI-CORROSION PROPERTIES OF<br />
ELECTRODEPOSITED Zn-Ni COATINGS<br />
DIANA BLEJAN a , DANIEL MARCONI b , AUREL POP b ,<br />
LIANA MARIA MURESAN a*<br />
ABSTRACT. Composite Zn-Ni coatings incorporating TiO2 nanoparticles were<br />
obtained by electro<strong>de</strong>position on steel from alkaline solution containing<br />
triethanolamine (TEA) as complexing agent for Ni 2+ and polyethyleneglicol<br />
(PEG) in combination with vanillin, as leveling/brightening agents. The influence<br />
of TiO2 nanoparticles on phase composition and structure of Zn- Ni coatings<br />
were investigated by X-ray diffraction and SEM-EDAX methods. By using<br />
polarization measurements, the corrosion behaviour of the nanocomposite<br />
coatings was examined and the corrosion process on Zn-Ni-TiO2 composite<br />
coatings was found to be slower than on pure Zn-Ni surface.<br />
Keywords: Corrosion; Electro<strong>de</strong>position; Zinc-Nickel alloy; alkaline electrolyte<br />
INTRODUCTION<br />
Consi<strong>de</strong>rable efforts have been <strong>de</strong>voted over the years to provi<strong>de</strong><br />
improved corrosion protection to metallic surfaces. Zn alloys with Ni have<br />
attracted much attention because Zn-Ni coatings possess higher corrosion<br />
resistance and better mechanical characteristics than pure zinc and other zinc<br />
alloy coatings [1-4]. Corrosion studies have also indicated that Zn-Ni alloys<br />
may be useful as a substitute for cadmium <strong>de</strong>posits in marine environments [5].<br />
A relatively recent way for enhancing the corrosion resistance of<br />
zinc coatings consists in generating composite layers by electrolysis of<br />
plating solutions in which micron or sub-micron size inert particles (i.e. TiO2,<br />
Al2O3 etc.) are suspen<strong>de</strong>d [6,7]. The electro<strong>de</strong>position of metallic coatings<br />
containing inert particles produces corrosion resistant coatings with enhanced<br />
mechanical and tribological properties. The advanced physical properties of<br />
composite coatings quickly became clear during the 1990s, when new areas<br />
such as electrocatalysis and photoelectrocatalysis were consi<strong>de</strong>red [8].<br />
However, till now, there are only few <strong>papers</strong> focused on zinc-nickel composite<br />
coatings incorporating nanoparticles [9].<br />
a<br />
Department of Physical Chemistry, Babes-Bolyai University, 11 Arany Janos St., 400028<br />
Cluj-Napoca, Romania<br />
b<br />
Department of Physics, Babes-Bolyai University, M. Kogalniceanu St.1, 400084 Cluj-Napoca,<br />
Romania *limur@chem.ubbcluj.ro
96<br />
DIANA BLEJAN, DANIEL MARCONI, AUREL POP, LIANA MARIA MURESAN<br />
In this context, the aim of this work is to investigate the combined<br />
effect of Ni and TiO2 nanoparticles on the corrosion resistance of zinc coatings.<br />
Zn-Ni and Zn-Ni-TiO2 coatings were obtained by electro<strong>de</strong>position from an<br />
alkaline bath containing triethanolamine (TEA) as complexing agent for Ni 2+ and<br />
polyethyleneglicol (PEG) in combination with vanillin, as leveling/ brightening<br />
agents, selected based on our previous work [10].<br />
X ray diffraction (XRD) and SEM-EDAX methods were used to<br />
<strong>de</strong>termine the structure and the surface topography of the <strong>de</strong>posits. Polarization<br />
measurements were carried out in or<strong>de</strong>r to characterize the corrosion behavior<br />
of the coatings by using Tafel method.<br />
RESULTS AND DISCUSSION<br />
Electro<strong>de</strong>position<br />
As it can be seen from the polarization curves recor<strong>de</strong>d during the<br />
electro<strong>de</strong>position of Zn-Ni coatings (Fig. 1), no significant changes are observed<br />
in the kinetically controlled region of the curves, when adding TiO2 nanoparticles<br />
or when modifying their concentration, while a slight increase of the current<br />
<strong>de</strong>nsity is noticed in the mixed-control region. This could be due to a catalytic<br />
phenomenon initiated by <strong>de</strong>fects and dislocations or to chemical heterogeneities<br />
generated in the metallic matrix by the embed<strong>de</strong>d particles at high overpotentials.<br />
I/A<br />
1.0x10 -3<br />
5.0x10 -4<br />
0.0<br />
-5.0x10 -4<br />
-1.0x10 -3<br />
-1.5x10 -3<br />
-2.0x10 -3<br />
-2.5x10 -3<br />
Zn-Ni+PEG+Van+TiO 2 10g/l<br />
Zn-Ni+PEG+Van+TiO 2 5g/l<br />
Zn-Ni+PEG+Van+TiO 2 3g/l<br />
Zn-Ni+PEG+Van<br />
Zn-Ni<br />
-3.0x10<br />
-1.4 -1.2 -1.0 -0.8 -0.6 -0.4 -0.2 0.0<br />
-3<br />
E/V vs. Ag/AgCl/KCl sat.<br />
Figure 1. Polarization curves obtained during Zn-Ni electro<strong>de</strong>position in the<br />
absence and in the presence of TiO2 nanoparticles.<br />
Structural and morphological analysis<br />
Figure 2 shows XRD pattern for four Zn-Ni coated samples: S01 (in<br />
the absence of brightening agents and of TiO2), S0 (obtained in the presence<br />
of brightening agents but in the absence of TiO2), S5 and S10 (obtained in the<br />
presence of brightening agents and with 5 g/l and 10 g/l TiO2 nanoparticles,<br />
respectively, in the plating bath).
Zn-Ni ALLOY COATINGS FROM ALKALINE BATH CONTAINING TRIETHANOLAMINE<br />
Intensity [arb.units]<br />
30 40 50 60 70 80 90<br />
γ Ni 5 Zn 21 (222)<br />
γ Ni 5 Zn 21 (330)<br />
γ Ni 5 Zn 21 (411)<br />
α - Fe (110)<br />
0<br />
0<br />
30 40 50 60<br />
2θ [<strong>de</strong>grees]<br />
70 80 90<br />
Figure 2. XRD of samples S01 (in the absence of brightening agents and of TiO2),<br />
S0 (in the absence of TiO2 nanoparticles, x=0), S5 and S10<br />
(for x = 5 g/l and x = 10 g/l TiO2 nanoparticles).<br />
As can be seen from figure 2, the diffraction peaks for all samples<br />
obtained by using brightening agents and TiO2 nanoparticles correspond<br />
only to γ-phase (Ni5Zn21). It is well-known that, the high corrosion resistance<br />
of the Zn–Ni coatings might primarily be attributed to the existence of this<br />
phase. The absence of TiO2 peaks in the XRD spectra suggests that the<br />
concentration of phases associated with the nanoparticles is un<strong>de</strong>r the limit<br />
of <strong>de</strong>tection of XRD method. The obtained results are in accordance with<br />
those reported for alloys containing 19–20 at. % Ni [11] and with the zinc–<br />
nickel phase diagram for γ-Ni5Zn21 [12].<br />
Another aspect that should be emphasized is related to the crystal<br />
orientation in the <strong>de</strong>posit, which is consi<strong>de</strong>red to be an important factor in the<br />
corrosion process. It is common knowledge that the intensity of XRD peaks<br />
(characterized by Miller indices (hkl)) is proportional to the <strong>de</strong>nsity of oriented<br />
lattice planes. Consequently, the change of the grain orientations in presence<br />
of nanoparticles is indicated by changes of peak intensities. In the same<br />
time, the metal local coordination is correlated with planar packing <strong>de</strong>nsities.<br />
In the case of investigated Zn-Ni coatings, the small change in the<br />
intensities ratio I(330)/(I(330)+I(600)), presented in Table 1, shows the absence of<br />
textural modifications of <strong>de</strong>posits in the presence of TiO2 nanoparticles. The<br />
packing <strong>de</strong>nsity <strong>de</strong>creased in this or<strong>de</strong>r: ρ (110) > ρ (100), as in reference [13].<br />
The high value of the intensities ratio I(330)/(I(330)+I(600)) suggests a good packing<br />
γ Ni 5 Zn 21 (600)<br />
S 10<br />
S 5<br />
S 0<br />
S 01<br />
γ Ni 5 Zn 21 (444)<br />
γ Ni 5 Zn 21 (522)<br />
97
DIANA BLEJAN, DANIEL MARCONI, AUREL POP, LIANA MARIA MURESAN<br />
<strong>de</strong>nsity associated to more closely packed (330) (or (110)) planes. The XRD<br />
pattern of sample S10 is similar with the result reported for pure γ-phase<br />
<strong>de</strong>posits obtained from alkaline solutions [14].<br />
Previous investigations using XRD [15] indicated that <strong>de</strong>position of bcc<br />
zinc–nickel on a mild steel substrate with a {110} texture resulted initially in<br />
the nucleation of {110} orientated grains of bcc zinc–nickel at the substrate/<br />
<strong>de</strong>posit interface. Because the mild steel substrate has a {110} texture and<br />
the interplanar spacing of the mild steel {110} and of the zinc–nickel {330}<br />
are almost i<strong>de</strong>ntical, the nickel and zinc atoms in the bcc {110} planes can<br />
fit very closely to the recesses between atoms in the mild steel {110}. This<br />
process explains the high value of I(330)/(I(330)+I(600)) ratio in our samples.<br />
Crystallite size calculations were ma<strong>de</strong> by using the <strong>full</strong> width at half<br />
maximum (FWHM) of (110) peak, in the Scherer equation:<br />
0, 9λ<br />
D<br />
= Bcosθ<br />
where D is the grain size [nm], λ = λCuKα1 = 0,15406 nm), B is the line width<br />
and θ is the position for (110) peak. For all coatings, the profile of (110) peak<br />
exhibits Lorentz type behavior<br />
The calculated value for D (see Table 1) shows that the grain size<br />
<strong>de</strong>creases with increasing concentration x of TiO2 nanoparticles up to 5g/l<br />
TiO2, and slightly increases for x =10 g/l. The <strong>de</strong>crease of grain dimensions is<br />
due to the fact that the nanoparticles influence the competitive formation of<br />
metal nuclei and crystal growth. The TiO2 nanoparticles disturb the regular<br />
growth of metallic crystals and causes new nucleation sites to appear.<br />
Table 1. Parameters obtained from XRD and EDAX measurements.<br />
Sample<br />
I<br />
(<br />
I 330<br />
330 I<br />
+<br />
%<br />
600<br />
(<br />
)<br />
(<br />
Morphological observation of Zn-Ni nanocomposite coatings and<br />
their chemical composition were carried out by SEM and EDAX methods.<br />
Figure 3 shows the scanning electron micrographs of Zn–Ni <strong>de</strong>posits with<br />
different concentration of TiO2 nanoparticles.<br />
98<br />
)<br />
)<br />
D<br />
[nm]<br />
Ni<br />
wt.%<br />
S01 92 14.0 15.7<br />
S0<br />
(x=0 g/l TiO2)<br />
S5<br />
(x=5 g/l TiO2)<br />
S10<br />
(x=10 g/l TiO2)<br />
94 11.4 16.0<br />
95.5 10.7 16.5<br />
95 11.9 17.0
Zn-Ni ALLOY COATINGS FROM ALKALINE BATH CONTAINING TRIETHANOLAMINE<br />
x=0 g/l x=5 g/l x=10 g/l<br />
Figure 3. SEM micrographs of the Zn–Ni <strong>de</strong>posits, showing the change of<br />
morphology with TiO2 nanoparticle concentration.<br />
Thus, the plate-like shape morphology of the electro<strong>de</strong>posits slowly<br />
changes by increasing the concentration x of TiO2 nanoparticles. Similar<br />
results were obtained by Felloni et al. [16], who found that the platelet-type<br />
grains are closely related to the (330) (or (110)) component, and the pyramidal<br />
microstructure coinci<strong>de</strong>d with a preferential (600) orientation. The crystallographic<br />
preference for the (330) orientation that occurs in the presence of TiO2<br />
nanoparticles coinci<strong>de</strong>s with the formation of platelet-type structures.<br />
Figure 4 shows the results of EDAX analysis for Zn-Ni alloy samples<br />
with x = 0 g/l, 5 g/l and 10 g/l TiO2, respectively. The corresponding Ni content<br />
in the <strong>de</strong>posits (wt %) is presented in Table 1.<br />
S0<br />
S5<br />
S10<br />
Figure 4. EDAX analysis of Zn-Ni<br />
samples S0, S5 and S10 obtained with<br />
x=0 g/l; 5g/l and 10g/l of TiO2<br />
nanoparticles in the plating bath.<br />
99
100<br />
DIANA BLEJAN, DANIEL MARCONI, AUREL POP, LIANA MARIA MURESAN<br />
It was observed that the Ni content increases from 16% to 17% with<br />
increasing concentration of TiO2 nanoparticles. Literature reports mention that<br />
Ni–Zn alloy coatings on Fe substrates are relatively rich in Ni at the substrate/<br />
<strong>de</strong>posit interface [17].<br />
Electrochemical corrosion measurements<br />
Open circuit potential<br />
The open-circuit potentials (ocp) evolution in time for Zn-Ni and Zn-Ni-<br />
TiO2 samples recor<strong>de</strong>d after their immersion in Na2SO4 solution (pH 5) is<br />
presented in Fig. 5.<br />
E/V vs. Ag/AgCl/KCl sat.<br />
-0.2<br />
-0.3<br />
-0.4<br />
-0.5<br />
-0.6<br />
-0.7<br />
-0.8<br />
-0.9<br />
-1.0<br />
Zn-Ni<br />
Zn-Ni+PEG+Van<br />
Zn-Ni+PEG+Van+ 3g/l TiO 2<br />
Zn-Ni+PEG+Van+ 5g/l TiO 2<br />
Zn-Ni+PEG+Van+10g/l TiO 2<br />
-1.1<br />
0 1000 2000 3000 4000 5000 6000 7000 8000<br />
time/s<br />
Figure 5. Evolution of open<br />
circuit potentials for Zn-Ni<br />
coatings obtained in the<br />
absence and in the presence<br />
of TiO2 nanoparticles, after<br />
immersion in 0.2 g/l Na2SO4<br />
(pH 5).<br />
As expected, the ocp values noticed for Zn-Ni alloy are more positive<br />
than those observed in the same conditions for pure Zn coatings [18] suggesting<br />
a more noble character of the <strong>de</strong>posit, which could be associated to an<br />
inhibition of the anodic reaction and consequently to a higher corrosion<br />
resistance. The most positive shift was recor<strong>de</strong>d in the case when only PEG<br />
and Vanillin were used, due, probably, to the smaller roughness of the surface.<br />
The fact that Zn-Ni alloys became nobler with the immersion time could be<br />
attributed to a <strong>de</strong>zincification process [19].<br />
A shift of the ocp values towards more positive potentials is observed<br />
in some cases when TiO2 nanoparticles were present in the plating bath,<br />
as compared to Zn-Ni coatings obtained without additives, suggesting an<br />
interaction of TiO2 with the anodic reaction of the corrosion process.
Zn-Ni ALLOY COATINGS FROM ALKALINE BATH CONTAINING TRIETHANOLAMINE<br />
Polarization curves<br />
Polarization measurements performed in a potential range of ± 20 mV<br />
vs. ocp allowed the evaluation of the polarization resistance, Rp (Table 2).<br />
The higher values noticed in the presence of TiO2 are probably due to lowering<br />
of the surface area of the electro<strong>de</strong> by embed<strong>de</strong>d particles [20]. However, it<br />
should be mentioned that an increase of TiO2 concentration beyond 3 g/l<br />
does not lead to further increase of Rp, probably due to <strong>de</strong>fects and dislocations<br />
generated by the inclusion of nanoparticles in the metallic matrix.<br />
Table 2. Polarisation resistance values calculated as the reciprocal of the slope of<br />
polarization curves (ΔE/Δi) recor<strong>de</strong>d in a potential range of E = Ecorr ± 20 mV.<br />
Nr.<br />
crt.<br />
Electroplating solution<br />
Rp<br />
(Ohm)<br />
S01 Zn-Ni 8138<br />
S0 Zn-Ni+PEG+Van 8305<br />
S3 Zn-Ni+PEG+Van+TiO2 3g/L 9995<br />
S5 Zn-Ni+PEG+Van+TiO2 5g/L 9411<br />
S10 Zn-Ni+PEG+Van+TiO2 10g/L 9033<br />
The results of the polarization tests, carried out in a potential range of<br />
± 200 mV vs. ocp using the Zn-Ni coated steel electro<strong>de</strong>s prepared in presence<br />
of different TiO2 concentrations in the plating bath, are presented in Fig.6.<br />
lgi (A/cm 2 )<br />
-3.5<br />
-4.2<br />
-4.9<br />
-5.6<br />
-6.3<br />
-7.0<br />
-7.7<br />
-8.4<br />
Zn-Ni<br />
Zn-Ni+PEG+Van<br />
-9.1<br />
-9.8<br />
Zn-Ni+PEG+Van+ 3g/lTiO2 Zn-Ni+PEG+Van+ 5g/lTiO2 Zn-Ni+PEG+Van+10g/lTiO2 -1.2 -1.1 -1.0 -0.9 -0.8 -0.7 -0.6 -0.5 -0.4 -0.3<br />
E/V vs. Ag/AgCl/KCl sat.<br />
Figure 6. Polarization curve for the Zn-Ni coated steel obtained from a bath containing<br />
additives and TiO2 nanoparticles in different concentrations. Experimental conditions:<br />
electrolyte Na2SO4 0.2g/l (pH=5); scan rate 0.166 mV/s; PEG, 3ml/l; Vanillin, 10 mg/l.<br />
101
102<br />
DIANA BLEJAN, DANIEL MARCONI, AUREL POP, LIANA MARIA MURESAN<br />
The corresponding corrosion reaction equations are:<br />
Zn → Zn 2+ + 2e -<br />
Ni + ½ O2 → NiO<br />
for the anodic process, and<br />
½ O2 + 2H + + 2e - → H2O<br />
for the cathodic one.<br />
The values of the corrosion parameters of the coatings were calculated<br />
from the polarization curves based on the Stern - Geary theory [21], and by<br />
using Tafel interpretation (Table 3).<br />
As it can be observed, the addition of PEG and Vanillin in the plating<br />
bath gives rise to significant <strong>de</strong>crease of corrosion current <strong>de</strong>nsity as compared<br />
to Zn-Ni obtained without additives. This indicates that, as expected, the<br />
organic compounds strongly modified the quality of the cathodic <strong>de</strong>posit in<br />
terms of structure and morphology, producing more compact, fine-grained<br />
and consequently more corrosion resistant coatings.<br />
In what the effect of TiO2 nanoparticles is concerned, the addition of<br />
inert nanoparticles led to a <strong>de</strong>crease of corrosion current <strong>de</strong>nsities only in<br />
comparison with the pure Zn-Ni coating obtained from solution without additives.<br />
The <strong>de</strong>crease of corrosion currents could be due either to grain refinement<br />
of the <strong>de</strong>posit (see D values in Table 1), or to the fact that the incorporation<br />
of inert TiO2 nanoparticles in the coatings isolates them from the corrosion<br />
medium and distracts the corrosion current [22].<br />
Table 3. Kinetic parameters of the corrosion process obtained by non-linear regression<br />
using the Stern-Geary equation for interpretation of the polarization curves<br />
Electro<strong>de</strong> Zn-Ni<br />
icorr<br />
(A/cm 2 )<br />
ba*<br />
(V -1 )<br />
-bc*<br />
(V -1 )<br />
Ecorr<br />
(V/SCE)<br />
Zn-Ni +PEG+<br />
Vanillin<br />
Zn-Ni +PEG+<br />
Vanillin+<br />
3g/l TiO2<br />
Zn-Ni +PEG+<br />
Vanillin+<br />
5g/l TiO2<br />
Zn-Ni +PEG+<br />
Vanillin+<br />
10g/l TiO2<br />
4.0*10 -5 6.3*10 -6 5.0*10 -5 2.0*10 -5 1.0*10 -5<br />
25.13 11.86 2.00 17.07 13.37<br />
2.30 2.18 10.46 4.26 13.18<br />
-0.848 -0.469 -0.717 -0.646 -0.601<br />
*ba and bc are the Tafel anodic and cathodic activation coefficients, respectively.
Zn-Ni ALLOY COATINGS FROM ALKALINE BATH CONTAINING TRIETHANOLAMINE<br />
A <strong>de</strong>crease ten<strong>de</strong>ncy of corrosion current <strong>de</strong>nsities of the coatings<br />
was noticed with increasing TiO2 concentration in the plating bath. However, it<br />
should be mentioned that the differences between icorr values for the samples<br />
obtained from baths containing different amounts of TiO2 are not significant,<br />
being situated within limits of experimental errors. The acceleration of the<br />
corrosion process on Zn-Ni with additives and nanoparticles in comparison<br />
with the case of pure Zn-Ni could be due to <strong>de</strong>fects and dislocations or to<br />
chemical heterogeneities generated in the metallic matrix by the embed<strong>de</strong>d<br />
particles.<br />
CONCLUSIONS<br />
The analysis of the results led to the following conclusions:<br />
(i) A correlation between preferred crystallographic orientation and<br />
surface morphology and of the electro<strong>de</strong>posits was put on evi<strong>de</strong>nce. The<br />
platelet type grains are closely related to the (330) (or (100)) orientation.<br />
(ii) the corrosion process on Zn-Ni-TiO2 composite coatings is only<br />
slightly slower than on pure Zn-Ni surface and no significant <strong>de</strong>crease of<br />
corrosion current <strong>de</strong>nsities of the coatings were noticed with increasing TiO2<br />
concentration in the plating bath; this behaviour could be explained by the<br />
balance occurring between two contrary effects: on one si<strong>de</strong>, the embed<strong>de</strong>d<br />
inert oxi<strong>de</strong> particles diminish the active surface in contact with the corrosive<br />
environment and, on the other si<strong>de</strong>, they disturb the electrocrystallization<br />
process, by generating dislocations and <strong>de</strong>fects in the metallic matrix which<br />
act as chemical heterogeneities and favour the corrosion process.<br />
EXPERIMENTAL SECTION<br />
Electro<strong>de</strong>position<br />
Zn-Ni alloys were <strong>de</strong>posited from alkaline electrolytes (pH 13-14)<br />
containing 15 g/l ZnO (Merck, Germany), 130 g/l NaOH (Merck, Germany),<br />
80 g/l triethanolamine (TEA) (Sigma-Aldrich, Germany) and 6 g/l Ni2SO4*6H2O<br />
(Reactivul Bucuresti). 3 ml/l Polyethylene glycol (PEG) and 10 mg/l vanillin<br />
(Sigma-Aldrich, Germany) were used as brightening agents. TiO2 nanoparticles<br />
(99.5%, 21 nm, Degussa) were ad<strong>de</strong>d into the plating bath in or<strong>de</strong>r to obtain<br />
composite Zn-Ni-TiO2 coatings. The concentrations of TiO2 nanoparticles<br />
were x =0 (sample S0), x = 3 g L<br />
103<br />
-1 (sample S3), x = 5 g L -1 (sample S5) and<br />
x=10 g L -1 (sample S10), respectively.<br />
Experiments were carried out in a two compartments glass cell, with<br />
the capacity of 250 ml, un<strong>de</strong>r magnetic stirring. The working electro<strong>de</strong> was<br />
a steel (OL 37) disk electro<strong>de</strong>, (S = 0.502 cm 2 ) Ag/AgCl/KClsat was used as<br />
reference electro<strong>de</strong> and a Pt foil as counter electro<strong>de</strong>. Before using, the<br />
working electro<strong>de</strong> was wet polished on emery paper of different granulation
104<br />
DIANA BLEJAN, DANIEL MARCONI, AUREL POP, LIANA MARIA MURESAN<br />
and finally on felt with a suspension of alumina. Then, the electro<strong>de</strong> was<br />
ultrasonicated during 2 minutes, washed with acetone and distilled water in<br />
or<strong>de</strong>r to remove the impurities from the surface.<br />
Corrosion measurements<br />
For corrosion studies, a solution of 0.2 g L -1 (Na)2SO4 (Rie<strong>de</strong>l–<strong>de</strong> Haën,<br />
Germany) (pH 5) was used.<br />
Electrochemical measurements (open circuit potential and polarization<br />
curves) were carried out using a PC controlled potentiostat PARSTAT 2273<br />
(Princeton Applied Research, USA). Before the polarization measurements,<br />
the open circuit potential (ocp) was recor<strong>de</strong>d during 1 hour, until it was stabilized.<br />
For evaluation of corrosion resistance, polarization measurements<br />
were carried out in 0.2g/l Na2SO4, using a three electro<strong>de</strong> cell. The scan<br />
rate was 0.166 mV s -1 , and the sweep direction was from cathodic to anodic<br />
region. Corrosion tests were conducted at room temperature.<br />
Morphological and structural analysis<br />
The <strong>de</strong>posit structure and the preferred orientation of crystallites were<br />
<strong>de</strong>termined by X-ray diffraction (XRD) analysis, using a Brucker X-ray<br />
diffractometer with a Cu Kα (λ = 0,15406 nm) at 45 kV and 40 mA. The 2θ<br />
range of 20–100º was recor<strong>de</strong>d at the rate of 0.02º and 2θ /0.5 s. The<br />
crystal phases were i<strong>de</strong>ntified comparing the 2θ values and intensities of<br />
reflections on X-ray diffractograms with JCP data base using a Diffrac AT-<br />
Brucker program. The <strong>de</strong>posit morphology was <strong>de</strong>termined with a scanning<br />
electron microscope (SEM) (Philips XL-30). The chemical composition of the<br />
nanocomposite films was <strong>de</strong>termined by using an EDAX NEW XL30 (Philips)<br />
X-ray dispersive energy analyzer attached to the SEM.<br />
ACKNOWLEDGMENTS<br />
The authors grate<strong>full</strong>y acknowledge the financial support within the projects<br />
POSDRU/88/1.5/S/60185 – “Innovative doctoral studies in a Knowledge Based Society”<br />
Babeş-Bolyai University, Cluj-Napoca, Romania and PN II INOVARE No. 261/2008<br />
(ZINITECH).<br />
REFERENCES<br />
1. M.G. Hosseini, H. Asassi-Sorkhabi, H.A.Y. Ghiasvand, Surface & Coatings<br />
Technology, 2008, 202, 2897.<br />
2. M.G. Hosseini, H. Asassi-Sorkhabi, H.A.Y. Ghiasvand, Iranian Corrosion; ICA<br />
International Congress, Tehran: May 14-17, 2007.
Zn-Ni ALLOY COATINGS FROM ALKALINE BATH CONTAINING TRIETHANOLAMINE<br />
3. G. Roventi, R. Fratesi, Surface & Coatings Technology, 1996, 82, 158.<br />
4. M. Musiani, Electrochimica Acta, 2000, 45, 3397.<br />
5. M. Pushpavanam, S.R. Natarajan, K. Balakrishnan, and L.R. Sharma, Journal<br />
of Applied Electrochemistry, 1991, 21, 642.<br />
6. J. Fustes & A. Gomes & M.I. da Silva Pereira, Journal Solid State Electrochem.,<br />
2008, 12, 1435.<br />
7. B.M. Praveen, T.V. Venkatesha, Applied Surface Science, 2008, 254, 2418.<br />
8. R. Ramanauskas, Appllied Surface Science, 1999, 153, 53.<br />
9. C.G. Fink, J.D. Prince, Transactions of the American Electrochemical Society,<br />
1928, 54, 315.<br />
10. M. Si<strong>de</strong>r, C. Fan, D.L. Piron, Journal of Applied Electrochemistry, 2001, 31, 313.<br />
11. L.S. Tsybulskaya, T.V. Gaevskaya, O.G. Purvskaya, T.V. Byk, Surface & Coatings<br />
Technology, 2008, 203, 234.<br />
12. Metals Handbook, 9 th ed., ASM International, 1992, 3.<br />
13. F. Mansfeld, S. Gilman, Journal of the Electrochemical Society, 1970, 117, 588.<br />
14. M.S. Chandrasekar, S. Srinivasan, M. Pushpavanam, Journal of Solid State<br />
Electrochemistry, 2009, 13, 781.<br />
15. D.B. Lewis, C.E. Lehmberg, G.W. Marshall, Transactions of Institute of Metal<br />
Finishing, 2004, 82 (1–2), 64.<br />
16. L. Felloni, R. Fratesi, E. Quadrini, G. Roventi, Journal of Applied Electrochemistry,<br />
1987, 17, 574.<br />
17. E. Raub, F. Elser, Metalloberflache 1957, 11 (5), 165.<br />
18. M.S. Chandrasekar, S. Srinivasan, M. Pushpavanam, Journal of Solid State<br />
Electrochemistry, 2009, 13, 781.<br />
19. D.E. Hall, Plating & Surface Finishing, 1983, 70, 59.<br />
20. O. Kardos, D.G. Foulke, “Applications of mass transfer theory. Electro<strong>de</strong>position on<br />
small-scale profiles” in Advances in Electrochemistry and Electrochemical Engineering;<br />
Tobias, Ch.W.; Ed.; Publisher: Interscience New York, NY, 1966, 2, 145.<br />
21. L.M. Muresan, S.C. Varvara, “Leveling and Brightening mechanisms in Metal<br />
Electro<strong>de</strong>position” in Metal Electro<strong>de</strong>position, Ed. M. Nunez, Nova Science Publishers,<br />
Inc. New York, 2005, chapter 1.<br />
22. M. Stern, A. L. Geary, Journal of Electrochemical Society, 1957, 104, 56.<br />
105
STUDIA UBB CHEMIA, LVI, 1, 2011<br />
IN DEPTH VARIATION OF WATER PROPERTIES FOR ST. ANA<br />
LAKE – ROMANIA RELATED TO SEDIMENTS IN SUSPENSION<br />
RAMONA FLAVIA CÂMPEAN a , NELI KINGA OLAH b∗ , CLAUDIA TOMA c ,<br />
RISTOIU DUMITRU d , GEORGE ARGHIR e<br />
ABSTRACT. The minerals i<strong>de</strong>ntified in the sand shore and mud from the bottom<br />
of St. Ana Lake is: biotite, potassic feldspar, hornblen<strong>de</strong>, potassic muscovite,<br />
and hydrate silicate mixed with amorphous an<strong>de</strong>site. Such mineral particles<br />
were observed suspen<strong>de</strong>d in the water from an average <strong>de</strong>pth of 2 m to the<br />
bottom. The suspen<strong>de</strong>d particle average diameter and <strong>de</strong>nsity increases along<br />
with the water <strong>de</strong>pth, which may affect water properties. We found that the<br />
electrical conductivity is close to the distilled water in the upper layers and<br />
increases to the bottom due to the dissolved mineral ions. The turbidity is very<br />
low, at the surface and progressively increases at 4 meter <strong>de</strong>pth, because of<br />
the particle <strong>de</strong>nsity variation in lower water layer. The pH has an acid range.<br />
The pH values are slowly <strong>de</strong>creasing with the water <strong>de</strong>pth due to the acid pH<br />
of phylosilicates. The main metal found is Fe, the concentration is consi<strong>de</strong>rably<br />
below the standard limit. It increases with water <strong>de</strong>pth due to the increased<br />
concentration of biotite and hornblen<strong>de</strong> particles floating in the water. There<br />
were also i<strong>de</strong>ntified traces of Zn and Cu in very low concentrations and no traces<br />
of Pb and Cd. All measurements performed in July 2010 prove that the St. Ana<br />
Lake presents a normal state for a closed water system with no pollution trace.<br />
Keywords: volcanic lake, turbidity, electrical conductivity, pH, heavy metals<br />
INTRODUCTION<br />
St. Ana Lake is situated in Romania in the area of volcanic mountain<br />
chain Călimani - Gurghiu – Harghita. It represents the unique crater lake in the<br />
Eastern Europe formed by water accumulation in the Ciomadu Mare volcano<br />
cone. The earliest scientific reports on the volcanic origin of the lake were<br />
a<br />
Babeş-Bolyai University, Faculty of Environment Science, Str. Fântânele, No. 30, RO-400294<br />
Cluj-Napoca, Romania and SC PlantExtrakt SRL, 407059 Rădaia<br />
b<br />
"Vasile Goldis" West University of Arad, Faculty of Pharmacy, Department of Pharmaceutical<br />
Industry, 1 Feleacului Street, 300041, Romania and SC PlantExtrakt SRL, 407059 Rădaia<br />
∗<br />
correspon<strong>de</strong>nt author<br />
c<br />
"Vasile Goldis" West University of Arad, Faculty of Pharmacy, Department of Pharmacognosy,<br />
1 Feleacului Street, 300041, Romania<br />
d<br />
Babeş-Bolyai University, Faculty of Environment Science, Str. Fântânele, No. 30, RO-400294<br />
Cluj-Napoca,Romania<br />
e<br />
Technical University of Cluj-Napoca, Faculty of Materials Science and Engineering, Muncii Ave.,<br />
No. 103 – 105, RO-400641 Cluj-Napoca, Romania
RAMONA FLAVIA CÂMPEAN, NELI KINGA OLAH, CLAUDIA TOMA, RISTOIU DUMITRU, GEORGE ARGHIR<br />
published in 1956 and 1964 [1, 2]. Further the area presents a great geological<br />
interest. Some of the newest studies affect the geology of the area to Later<br />
Tertiary and Quaternary [3, 4].<br />
Geological drillings revealed two petrologic formations: the <strong>de</strong>eper layer<br />
containing amorphous volcanic glass with an<strong>de</strong>sites and pyroxenes. The<br />
second formation is situated at the surface containing amorphous volcanic glass<br />
with an<strong>de</strong>site, hornblen<strong>de</strong> and biotite [5]. However, pyroxene <strong>de</strong>gradation forms<br />
several minerals such hornblen<strong>de</strong> and biotite [6, 7] which could be found in<br />
the crater soil and gravel. Such soil and gravel forms the sand shore of St.<br />
Ana Lake and also covers the formation in the crater <strong>de</strong>pth.<br />
St. Ana Lake was formed exclusively by accumulation of precipitation<br />
having no other water sources. The structure of volcano cone is formed by<br />
pyroclastic rocks e.g. an<strong>de</strong>site, and pyroxenes bin<strong>de</strong>d with volcanic glass<br />
covered with sand and gravel resulted from upper formation’s erosion. This<br />
structure of the lake’s bottom is permeable due to the cracks in pyroclastites<br />
causing some water loss. Actually the water level is 6.4 m varying according to<br />
the precipitation amount [8, 9]. The average level of 6 m is sustained by an<br />
impermeable layer of mud <strong>de</strong>posed at the lake bottom having the maximum<br />
thickness of 4 m [8]. The variation of water level is related only to the infiltration<br />
in the shore pyroclastite, gravel and sand.<br />
The rain water presents a high level of purity very close to distilled<br />
water with a slighter acid pH due to CO2 dissolving from atmosphere and<br />
this unless there are some pollution traces [10, 11]. St. Ana lake has no other<br />
water sources than precipitations so the water in the lake must have physical –<br />
chemical properties similar to the distilled water. By natural way there are<br />
involved some interactions with shore sand, gravel and respectively with the<br />
mud from the bottom of the lake that could affect the water’s properties. On the<br />
other hand some research mentions some alteration of the local environment<br />
due to the intense touristy traffic mainly increased rates of lead pollution [8].<br />
The aim of present article is to investigate the mineralogical composition<br />
of St. Ana Lake shore and bottom related to the measured water properties<br />
at different <strong>de</strong>pths.<br />
RESULTS AND DISCUSSION<br />
Assuming all consi<strong>de</strong>rations concerning closed water systems results<br />
that the single minerals involved at St. Ana Lake are the sand shore and the<br />
mud from the bottom. The mineral composition was i<strong>de</strong>ntified by X-ray diffraction<br />
analysis. The obtained diffractograms are presented in Figure 1. Both spectra<br />
presents well <strong>de</strong>veloped diffraction peaks corresponding to the crystalline<br />
minerals and a curved baseline due to the amorphous volcanic glass. There<br />
were found the following minerals (in or<strong>de</strong>r of their amount): potassic feldspar,<br />
biotite, hornblen<strong>de</strong>, potassic muscovite, and hydrate silicate for both investigated<br />
samples.<br />
108
IN DEPTH VARIATION OF WATER PROPERTIES FOR St. ANA LAKE – ROMANIA RELATED …<br />
Figure 1. The X ray diffraction spectra for samples collected from St. Ana Lake:<br />
a) sand collected from the shore, and b) dry mud from the bottom of lake.<br />
Potassic feldspar is a tectosilicate based on tetrahedral [SiO4] 4-<br />
structure with a ¼ amount of Al 3+ ions which forms extra bounds [AlO4] 5- which<br />
fix alkaline ions such K + or Na + . The chemical formula for i<strong>de</strong>ntified potassic<br />
feldspar is: K(AlSi3O8). It has a triclinic crystal structure and appears in a bright<br />
white color in cross polarized light [6, 12]. This structure is more stabile than<br />
inosilicates and phylosilicates. There were found some altered form of potassic<br />
feldspar as hydrate silicate which have the chemical formula K4(H4Si4O12) [13].<br />
Another important mineral found is the hornblen<strong>de</strong>. It is an inosilicate<br />
having simple or double infinite chains of tetrahedral [SiO4] 4- mixed with extra<br />
bounds [AlO4] 5- . The free valence of Al 3+ in the chains structure bonds several<br />
ions such Mg 2+ , Ca 2+ , Fe 2+ , Fe 3+ , and others [6]. The chemical formula for<br />
i<strong>de</strong>ntified hornblen<strong>de</strong> is: Ca2(Fe2,Mg)4Al(Si7Al)O22(OH,F)2. The double chains<br />
are very resistant due to SiO2 units in the tetrahedral silica meanwhile Mg 2+ ,<br />
Ca 2+ , Fe 2+ , Fe 3+ ions have weaker bonds [14]. The hornblen<strong>de</strong> sheets appear in<br />
a greenish color in cross polarized light.<br />
It was also found a new class of silicate - phylosilicates. They are the<br />
result of <strong>de</strong>composed tectosilicates and inosilicates. In this case are formed very<br />
resistant pseudo-hexagonal planes of tetrahedral [SiO4] 4- bon<strong>de</strong>d by 3 common<br />
oxygen molecules. The free valences resulted are perpendicularly oriented<br />
to the planes which bounds ions such Al 3+ , Fe 2+ , Fe 3+ , Mg 2+ , K + which assure<br />
a monoclinic crystal structure [6]. One of the most important phylosilicate found<br />
is the biotite. The chemical formula of biotite is KFeMg2(AlSi3O10)(OH)2 [15].<br />
We notice the presence of Mg 2+ and Fe 2+ ions which gave a shiny black color<br />
109
RAMONA FLAVIA CÂMPEAN, NELI KINGA OLAH, CLAUDIA TOMA, RISTOIU DUMITRU, GEORGE ARGHIR<br />
of biotite crystals, which is also known as black mica. In cross polarized light it<br />
features an orange – red color with pleochroism. Similar to biotite we found<br />
muscovite, the common mica. The chemical formula is H2KAl3Si3O12 [16].<br />
The crystal structure is similar to biotite and the microscopic aspect is bright<br />
featuring a yellow colour in cross polarized light.<br />
Figure 2a presents the optical transmitted light microphotograph for the<br />
sand shore sample. We observe a wi<strong>de</strong> range of particle size. The occurrence<br />
of crystals in the sand is observed in cross polarized light microphotograph.<br />
There are revealed large green hornblen<strong>de</strong> particles having at least 75 μm<br />
diameter, reddish biotite and yellow muscovite particles with a planar average<br />
dimension of almost 100 μm, and several potassic feldspar particle featured in<br />
a bright white color having around of 50 μm diameter. There are also observed<br />
some traces of fine particles of similar occurrence having at least 10 μm.<br />
In Figure 2b are presented the optical microphotographs for the mud<br />
collected from the bottom of the lake. There are revealed formations of very<br />
fine particles having the average diameter between 5 and 10 μm. The particle<br />
refinement influence the color of cross polarized light where the formations<br />
appear in a diffuse light due to the small particle mixture. However there are<br />
observed some of bigger reddish biotite and potassic feldspar particles having<br />
around of 20 μm diameter [28].<br />
110<br />
Figure 2. Optical microphotographs for samples collected from St. Ana Lake:<br />
a) sand collected from the shore, and b) dry mud from the bottom of lake.
IN DEPTH VARIATION OF WATER PROPERTIES FOR St. ANA LAKE – ROMANIA RELATED …<br />
Optical microscopy reveals that the particles of sand are rough microscaled<br />
particles instead of small particles which are rather found in the mud<br />
from the bottom and they have similar mineralogical structure. Small particles<br />
of clays and inosilicates are able to release ions at longer exposure in wet<br />
environment [17, 18]. Some recent studies evaluate the clays ability of ions<br />
releasing in some pH controlled environment. There were noticed the releases<br />
of Al 3+ , Fe 2+ , Ti 2+ , and Zn 2+ in acid environment [19, 20].<br />
We i<strong>de</strong>ntify the following minerals that which release ions: the biotite,<br />
the muscovite, and the hornblen<strong>de</strong> due to their lamellar structure and weaker<br />
bonds between lamellae. The main released ions are Fe 2+ , K + , and Mg 2+ because<br />
of their positions as bonds between pseudo-hexagonal lamellae. Assuming<br />
the ions releasing as an emergent hypothesis the water properties of St. Ana<br />
Lake will vary according to the particles distribution at different <strong>de</strong>pths.<br />
The quantitative particle distribution measure is given by the average<br />
diameter and average percentage <strong>de</strong>nsity unit. Optical microscopy investigation<br />
prove that the water from the surface to 2 m <strong>de</strong>pth is free of micro-scaled<br />
particles, but they were found dispersed in water samples from 2 m to the<br />
bottom of the lake (4 m), Figure 3.<br />
Figure 3. Optical microphotographs for water sample collected from different<br />
<strong>de</strong>pths: a) 2 m, b) 3 m and c) 4m.<br />
The optical transmitted light microphotographs of water sample collected<br />
from 2, 3, and 4 m <strong>de</strong>pth are presented in Figure 3. At 2 meters we observe,<br />
Figure 3a, several very small micro-scaled particles, at 3 m they are bigger<br />
111
RAMONA FLAVIA CÂMPEAN, NELI KINGA OLAH, CLAUDIA TOMA, RISTOIU DUMITRU, GEORGE ARGHIR<br />
and finally at 4 m they are the biggest. In cross polarized light at 2 meters,<br />
particles are so small that appears as a low diffused light which could not allow<br />
i<strong>de</strong>ntifying of certain mineral. At 3 and 4 m <strong>de</strong>pth there could be observed in<br />
cross polarized light, Figure 3 b and c, some potassic feldspar, biotite and<br />
hornblen<strong>de</strong> particles. The quantitative analysis on optical microphotographs was<br />
performed by Image J processing soft and the results are plotted in Figure 4.<br />
The particles average diameter variation with water <strong>de</strong>pth, Figure 4a,<br />
was correlated with particle <strong>de</strong>nsity distribution presented in Figure 4b. In the<br />
water layer from 0 to 2 m <strong>de</strong>pth were found no micro-scaled particles proving<br />
that they are dispersed. At 2 m <strong>de</strong>pth we found an average particle size of<br />
5.53 μm related to a <strong>de</strong>nsity of 7 %, at 3 m <strong>de</strong>pth the particle average diameter<br />
became 10.60 μm related to a <strong>de</strong>nsity of 25 % meanwhile at 4 m <strong>de</strong>pth the<br />
average particle diameter is 14.58 μm corresponding to a <strong>de</strong>nsity of 55 %. The<br />
situation observed at 4 m <strong>de</strong>pth is very close to the mud from the bottom,<br />
the observed particle diameter is in good agreement. This difference is due<br />
to a lower particle <strong>de</strong>nsity than in the mud layer.<br />
112<br />
Figure 4. Particle distribution versus water <strong>de</strong>pth:<br />
a) Average diameter and b) Particle <strong>de</strong>nsity.<br />
Particle size distribution feature a parabolic shape related to a half –<br />
Gaussian distribution of <strong>de</strong>nsity which means a possibly exponential increasing<br />
of water turbidity with water <strong>de</strong>pth. Smallest particles related to a low <strong>de</strong>nsity,<br />
case at 2 m <strong>de</strong>pth, assure a low dispersion of light radiant flux in a turbidity<br />
nephelometer, respectively a low amount of scattered light. This situation leads<br />
to a low turbidity. Increased particle sizes and their <strong>de</strong>nsity lead to an average<br />
scattered light in a nephelometer, case of 4 m <strong>de</strong>pth, which gave an average<br />
turbidity. The usual turbidimeters have two ranges of measurements: for very<br />
low turbidity between 0 – 40 NTU (the sensor is set for scattered light) and for<br />
high turbidity between 40 – 4000 NTU. For high turbidity measurements it is<br />
used the direct light beam attenuation [21, 22].
IN DEPTH VARIATION OF WATER PROPERTIES FOR St. ANA LAKE – ROMANIA RELATED …<br />
In Figure 5a is presented the resulted variation of water turbidity versus<br />
<strong>de</strong>pth. We observe that all obtained values are below the limit of 40 NTU<br />
which means that the water in St. Ana Lake is clear. At the surface and at 1 m<br />
<strong>de</strong>pth were obtained turbidity values 2.18 and 2.55 NTU, very low values<br />
induced by possible nano - suspensions (e.g. particles with diameter un<strong>de</strong>r<br />
100 nm which could not appear at common optical microscopy inspection).<br />
The turbidity increases sensibly at 2 m resulting 3.03 NTU, a value still very low.<br />
The notable increasing turbidity is between 3 and 4 m <strong>de</strong>pth where it increases<br />
from values of 3.55 to 25.7 NTU. This strong increasing is due to the proximity<br />
of mud layer. The turbidity variation features a part of a logarithmic shape<br />
which probably leads to a constant value in the compact mud layer (a high<br />
turbidity domain). Based on the observation in Figure 5a, water turbidity is<br />
rather affected by the particle <strong>de</strong>nsity in the water layers than their size.<br />
Figure 5. Physical properties of water versus water <strong>de</strong>pth:<br />
a) Turbidity and b) Electrical conductivity.<br />
The other main physical property of water is the electrical conductivity.<br />
It is affected by salts dissolved in water such carbonates and chlori<strong>de</strong>s. The<br />
electrical conductivity increases proportionally to the amount of dissolved<br />
solids [23, 24]. Minerals i<strong>de</strong>ntified for St. Ana Lake shore and bottom mud are<br />
not soluble in water so the electrical conductivity must be preserved. However,<br />
as mention before minerals such biotite, hornblen<strong>de</strong> and feldspar are able to<br />
release ions at longer contact with water, fact favored by a lower pH value<br />
[17 – 20].<br />
The only water source of St. Ana Lake is the precipitation (e.g. rainfall<br />
and snow) which leads to an electrical conductivity similar to the rain water. This<br />
hypothesis is confirmed by the value obtained at the water surface 13.5 μS/cm.<br />
The electrical conductivity increases progressively with the suspen<strong>de</strong>d particle<br />
<strong>de</strong>nsity resulting 26.8 μS/cm at 4 m <strong>de</strong>pth, value comparable to the well water.<br />
113
RAMONA FLAVIA CÂMPEAN, NELI KINGA OLAH, CLAUDIA TOMA, RISTOIU DUMITRU, GEORGE ARGHIR<br />
The observed electrical conductivity variation proves the hypothesis of ions<br />
releasing, fact confirmed also by the variation of pH and Fe content.<br />
In Figure 6a is presented the variation of pH versus water <strong>de</strong>pth. The<br />
measurements points out a pH of 6.82 at water surface close to the neutral<br />
value. The pH value is typical for rain water which is slightly lower than<br />
neutral because of CO2 dissolved from atmosphere during the raining [10, 11].<br />
In the precipitation samples, the pH values range from 5.18 to 7.30 [29] and<br />
we observed similar values. The pH <strong>de</strong>creases directly proportional with the<br />
water <strong>de</strong>pth resulting at 4 m an acidic value of 5.80. Resulted values are in good<br />
agreement with the observations for other inactive volcanic crater lakes [25],<br />
while the active ones presents a lower pH due to intensive emission of SO2<br />
[26, 27].<br />
The observed acidic pH in the lower water layer of St. Ana Lake<br />
favors a slow and continuous releasing of Al 3+ , Fe 2+ , and Zn 2+ from biotite,<br />
hornblen<strong>de</strong>, and potassic feldspar proving the variation of electrical conductivity<br />
without solids dissolvation.<br />
114<br />
Figure 6. Chemical properties of water versus water <strong>de</strong>pth:<br />
a) pH and b) Fe content.<br />
We want it to prove that St. Ana lake has no pollution. The <strong>de</strong>termined<br />
heavy metals were chosen according to the environmental criteria. These<br />
heavy metals have a relevant impact on the environment and their absence<br />
is a sign that the lake is not polluted.<br />
The most important element involved in i<strong>de</strong>ntified minerals is the Fe<br />
due to its belonging of heavy metals which could be traced. The performed<br />
measurements pointed out significant amounts of Fe, but situated far below<br />
the maximum admitted level, Figure 6b. At the water surface and 1 m <strong>de</strong>pth<br />
the Fe content is un<strong>de</strong>r the <strong>de</strong>tection limit which is 2,02 ppm. The Fe content<br />
has an increasing ten<strong>de</strong>ncy with water <strong>de</strong>pth. The strongest increase is observed
IN DEPTH VARIATION OF WATER PROPERTIES FOR St. ANA LAKE – ROMANIA RELATED …<br />
between 3 and 4 m <strong>de</strong>pth from values of1.94 ppb to 6.96 ppb. Comparing<br />
with the turbidity evolution, the water with higher turbidity in St. Ana Lake<br />
features also a higher content of Fe.<br />
Heavy metals measurements found traces of Cu and Zn, resulted<br />
average values are Cu = 0.03 ppb and Zn = 0.05 ppb. The performed<br />
measurements show that in St. Ana Lake at investigation period (July 2010)<br />
are no traces of Cd and Pb, the samples results were: Cd is un<strong>de</strong>r the <strong>de</strong>tection<br />
limit which is 0,17 ppm and Pb is un<strong>de</strong>r the <strong>de</strong>tection limit which is 0,084 ppm.<br />
This situation is very good for the environment condition and proves a very<br />
good improvement from the state reported in 2008 by Duliu et al. [8]<br />
Cu and Zn traced in i<strong>de</strong>ntified minerals are in very low amounts.<br />
Because Cd and Pb are missing, the observed traces of Cu and Zn are rather<br />
found by natural reasons (similar to Fe content) than due to some pollution<br />
sources.<br />
All measurements prove that the water properties of St. Ana Lake<br />
varies with water <strong>de</strong>pth in a naturally manner due to the distribution of mineral<br />
particles suspen<strong>de</strong>d in water layer. At the investigation time, July 2010 results<br />
that there are no traces of pollution in aquatic environment.<br />
CONCLUSIONS<br />
The minerals i<strong>de</strong>ntified in the sand shore and mud from the bottom of<br />
St. Ana Lake is: biotite, potassic feldspar, hornblen<strong>de</strong>, potassic muscovite,<br />
and hydrate silicate mixed with amorphous an<strong>de</strong>site. Such mineral particles<br />
were observed suspen<strong>de</strong>d in the water from an average <strong>de</strong>pth of 2 m to the<br />
bottom. We found that the electrical conductivity is close to the distilled<br />
water for the upper layers and increases to the bottom due to the dissolved<br />
mineral ions, mainly Fe 2+ , released by phylosilicates and tectosilicates (e.g.<br />
biotite and hornblen<strong>de</strong>). The turbidity is very low at the surface and progressively<br />
increased at 4 meter <strong>de</strong>pth, because of the particle <strong>de</strong>nsity variation in lower<br />
water layers. The pH is in an acid range having a slight <strong>de</strong>creasing with the<br />
water <strong>de</strong>pth due to the acid pH of phylosilicates. The main metal found is Fe,<br />
the concentration is consi<strong>de</strong>rably un<strong>de</strong>r the standard limit. It increases with<br />
water <strong>de</strong>pth due to the increasing of biotite and hornblen<strong>de</strong> particles floating in<br />
water. There were also i<strong>de</strong>ntified traces of Zn and Cu in very low concentrations<br />
and no traces of Pb and Cd. All measurements performed in July 2010 prove<br />
that the St. Ana Lake presents a normal state for a closed water system<br />
with no pollution trace.<br />
EXPERIMENTAL SECTION<br />
The sand samples were collected from all exposed shore and mixed<br />
into an average sample representative for all regions. Mud samples were taken<br />
with a manual dredge from several points and mixed into a representative<br />
sample which was naturally dried.<br />
115
RAMONA FLAVIA CÂMPEAN, NELI KINGA OLAH, CLAUDIA TOMA, RISTOIU DUMITRU, GEORGE ARGHIR<br />
Representative average water samples were extracted with a specific<br />
<strong>de</strong>vice from top of water and from 1, 2, 3 and 4 m <strong>de</strong>pth. Water samples were<br />
transported to the lab in proof well sealed plastic bottles. Water samples were<br />
preserved with 1% HNO3 until conductivity and pH measurements were taken.<br />
The sand and mud samples were investigated by X – ray diffraction<br />
analysis using a DRON 3 diffractometer improved with registering module<br />
and professional analyzing soft. It was used a Co kα. monochrome radiation.<br />
Diffraction peaks i<strong>de</strong>ntification was done using standard database MATCH<br />
edited and compiled by Crystal Impact.<br />
Sand, mud and water samples were inspected by optical transmission<br />
light and cross polarized light using a Laboval 2 mineralogical microscope<br />
produced by Carl Zeiss Jena.<br />
Electrical conductivity and pH were measured with HI 255 Combined<br />
Meter & EC/TDS/NaCl Hanna Instruments. Turbidity was measured with a<br />
turbidity meter 4193414, Hanna Instruments. Water samples were preserved<br />
with 1% HNO3 until conductivity and pH measurements.<br />
The metal content was measured by emission spectrometry / flame<br />
atomic absorption AAS Sens Spectrophotometer, GBC Australia. For the<br />
heavy metals <strong>de</strong>termination, water samples were prepared as following: take<br />
50 ml of water and bring to dry, then resume with 10 mL 0.5 M HNO3. The<br />
used wavelengths are: for Cu - 324,70 nm, for Fe - 248,30 nm, for Zn - 213,90<br />
nm, for Pb - 217,00 nm and for Cd - 228,00 nm. Each sample <strong>de</strong>termination<br />
is repeated three times by the <strong>de</strong>vice. The results are the average readings.<br />
The quantitative <strong>de</strong>termination is ma<strong>de</strong> based on calibration curves constructed<br />
with standards.<br />
116<br />
REFERENCES<br />
1. D. Slavoaca, C. Avramescu, Aca<strong>de</strong>mia R.P.R., Comunicari, 1956, VI. 3.<br />
2. A. Lazar, E. Arghir, Comunicari Geologice, 1964, vol L/2, 87-101.<br />
3. S. Szakacs, I. Seghedi, Acta Vulcanologica, 1995, 7, 145–153.<br />
4. D. Karatson, Zeitschrift fur Geomorphologie, 1999, 114, 49–62.<br />
5. I. Seghedi, A. Szakacs, M. Kovacs, E. Rosu, Z. Pecskay, Sed inst. Geol. Geof.,<br />
1995, 76, no.7, 49-50.<br />
6. G. Arghir, L.M. Ghergari, Cristalografie – Mineralogie Indrumător <strong>de</strong> lucrări <strong>de</strong><br />
laborator, Litografia Institutului Politehnic din Cluj – Napoca,1983.<br />
7. I. Seghedi, H. Downes, Z. Pecskay, M.F. Thirlwall, A. Szakacs, M. Prychodko,<br />
D. Mattey, Lithos, 2001, 57, 237.<br />
8. O. Duliu, T. Brustur, Ş. Szobotka, G. Oaie, C. Ricman, V. Alexe, M. Iovea, S.<br />
Hodorogea, Geo-Eco-Marina, 2008, 14, supliment nr. 1, 181.
IN DEPTH VARIATION OF WATER PROPERTIES FOR St. ANA LAKE – ROMANIA RELATED …<br />
9. A.G. Pilbath, Z. Pal, Microregiunea Ciomad-Balvanyos, Ed. Green Steps România,<br />
2007.<br />
10. I. Haiduc, Chimia mediului ambiant. Controlul calităţii apei, Ed. Universităţii Babeş-<br />
Bolyai, Cluj-Napoca, 1996, 61.<br />
11. G. B. Lawrence, Atmospheric Environment, 2002, 36, 1589.<br />
12. ***, Feldspat potassic, Match Diffraction Database, Match PDF # 89-8572, Crystal<br />
Impact, 2008.<br />
13. ***, Potassic Hydrate Silicate, Match Diffraction Database, Match PDF # 72-1101,<br />
Crystal Impact, 2008.<br />
14. ***, Hornblen<strong>de</strong>, Match Diffraction Database, Match PDF # 71-1060, Crystal Impact,<br />
2008.<br />
15. ***, Biotite, Match Diffraction Database, Match PDF # 80-1106. Crystal Impact, 2008.<br />
16. ***, Muscovite, Diffraction Database, Match PDF # 02-1019. Crystal Impact, 2008.<br />
17. F. Tateo, V. Summa, M.L. Giannossi, G. Ferraro, Applied Clay Science, 2006,<br />
33, 181.<br />
18. F. Tateo, V. Summa, Applied Clay Science, 2007, 36, 64.<br />
19. J.R.O. Kikouama, K.L. Konan, A. Katty, J.P. Bonnet, L. Bal<strong>de</strong>a, N. Yagoubi, Applied<br />
Clay Science, 2009, 43, 135.<br />
20. F. Tateo, A. Ravaglioli, C. Andreoli, F. Bonina, V. Coiro, S Degetto, A. Giaretta,<br />
A. Menconi Orsini, C. Puglia, V. Summa, Applied Clay Science, 2009, 44, 83.<br />
21. ***, EPA, Quality criteria for water, Office of Water Regulations and Standards,<br />
Washington DC 20460, U.S., 1986.<br />
22. ***, Water Quality – Determination of turbidity, ISO European Standards, EVS-EN<br />
ISO 7027:2000, 2000.<br />
23. D. Masterman, K. Redding, Water Quality with Vernier, Vernier Software & Technology<br />
Gui<strong>de</strong>lines, 2006.<br />
24. I. Chicinaş, N. Jumate, V. Pop, Fizica materialelor meto<strong>de</strong> experimentale, Presa<br />
Universitară Clujeană, Cluj-Napoca, 2001.<br />
25. J.C. Varekamp, G.B. Pasternack, G.L. Rowe Jr, Journal of Volcanology and<br />
Geothermal Research, 2000, 97, 161.<br />
26. B.W. Christenson, Journal of Volcanology and Geothermal Research, 2000, 97, 1.<br />
27. M. Martınez, E. Fernan<strong>de</strong>z, J. Val<strong>de</strong>, V. Barboza, R. Van <strong>de</strong>r Laat, E. Duarte,<br />
E. Malavassi, L. Sandoval, J. Barquero, T. Marino, Journal of Volcanology and<br />
Geothermal Research, 2000, 97, 127.<br />
28. Ramona-Flavia Câmpean, Dumitru Ristoiu, George Arghir, Aspects Concerning<br />
the Nano-Sediments Compozition and Distribution in St Ana Lake-Romania, Studia<br />
UBB Ambientum, 2009, LIV, 1-2, p. 11.<br />
29. ***, Raport privind starea factorilor <strong>de</strong> mediu în ju<strong>de</strong>ţul Harghita, Semestru II,<br />
2010, Ministerul Mediului <strong>şi</strong> Pădurilor, Agenţia Naţională pentru Protecţia Mediului<br />
Bucureşti, Agenţia pentru Protecţia Mediului Harghita Miercurea Ciuc.<br />
117
STUDIA UBB CHEMIA, LVI, 1, 2011<br />
ELECTROCHEMICAL BEHAVIOUR OF YBaCo4O7<br />
IN NEUTRAL AQUEOUS SOLUTION<br />
MIRCEA DAN* a , NICOLAE VASZILCSIN a ,<br />
ANDREA KELLENBERGER a , NARCIS DUTEANU a<br />
ABSTRACT. Consi<strong>de</strong>ring the possibility to use YBaCo4O7 as oxygen sensor<br />
in different environments, the study of electrochemical behaviour of this<br />
compound was exten<strong>de</strong>d for neutral aqueous solution. Cyclic voltammetry and<br />
electrochemical impedance spectroscopy have shown that the compound<br />
behaviour in neutral solution is different than that in alkaline one. Compound<br />
porosity was <strong>de</strong>termined using BET technique and the results are in accordance<br />
with thermogravimetric studies carried out in oxygen flow for YBaCo4O7<br />
compound, emphasizing the oxygen intake / release by YBaCo4O7. Correlating<br />
all these results, an electrochemical mechanism for YBaCo4O7 oxidation in<br />
neutral aqueous solution has been proposed.<br />
Keywords: mixed oxi<strong>de</strong>s, YBaCo4O7, electrochemical behaviour of YBaCo4O7,<br />
cyclic voltammetry, electrochemical impedance spectroscopy,<br />
BET technique.<br />
INTRODUCTION<br />
Recent studies have revealed special structural, electrical and magnetic<br />
properties of Y-114 mixed cobalt oxi<strong>de</strong>. Due to these properties the mixed<br />
cobalt oxi<strong>de</strong>s can be used as membranes with high oxygen permeability,<br />
oxygen sensors and also as cathodic material in fuel cells [1-5].<br />
The compound YBaCo4O7, also named Y-114, has been extensively<br />
studied since 2002 by Valldor et al. [6,7].<br />
The electrochemical behaviour of Y-114 mixed oxi<strong>de</strong> has been studied<br />
in alkaline solutions [8] and had as starting point the electrochemical intercalation<br />
the oxygen insi<strong>de</strong> of transitional metal oxi<strong>de</strong> network, presented by J.C. Grenier<br />
et al. [9,10] as well as the experimental results regarding the electrochemical<br />
cobalt behaviour studied by cyclic voltammetry and electrochemical impedance<br />
spectroscopy [11].<br />
The aim of the present paper is to study the electrochemical behaviour<br />
of Y-114 mixed oxi<strong>de</strong> in neutral aqueous solution (Na2SO4 0.5 mol L -1 ) and to<br />
give an insight of its anodic oxidation mechanism. To the best of our knowledge,<br />
there are no studies <strong>de</strong>voted to the electrochemical behaviour of YBaCo4O7<br />
in aqueous neutral solutions.<br />
a University “POLITEHNICA”, Faculty of Industrial Chemistry and Environmental Engineering,<br />
P-ta Victoriei, Nr.6, RO- 300006 Timisoara, Romania, * mircea.dan@chim.upt.ro
120<br />
MIRCEA DAN, NICOLAE VASZILCSIN, ANDREA KELLENBERGER, NARCIS DUTEANU<br />
RESULTS AND DISCUSSION<br />
Due to Y-114 structural and morphological complexity, the shape of<br />
polarization curves <strong>de</strong>pends on the working conditions; a critical parameter<br />
is represented by the polarization rate.<br />
Cyclic voltammograms recor<strong>de</strong>d starting from -1.8 V versus Ag/AgCl<br />
are <strong>de</strong>picted in Fig. 1. All these curves were recor<strong>de</strong>d after a prior polarization<br />
at -1.8 V (versus Ag/AgCl) for 300 seconds in or<strong>de</strong>r to remove the superficial<br />
adsorbed oxygen.<br />
I [A]<br />
0.012<br />
0.010<br />
0.008<br />
0.006<br />
8<br />
0.004<br />
0.002<br />
0.000<br />
1<br />
2<br />
B<br />
-0.002<br />
5<br />
-0.004<br />
6 9<br />
7<br />
-0.006<br />
-2.0 -1.5 -1.0 -0.5 0.0 0.5 1.0 1.5 2.0<br />
E [V/Ag/AgCl]<br />
Figure 1. Cyclic voltammograms (A-first cycle; B-fifth cycle) on YBaCo4O7 working<br />
electro<strong>de</strong> in 0.5 mol L -1 Na2SO4 solution at 10 mV s -1 scan rate.<br />
Analyzing the voltammograms presented in Fig. 1, one can observe the<br />
appearance of an anodic peak (1) in the first cycle. This peak can be associated<br />
with oxidation of superficial adsorbed hydrogen or of absorbed hydrogen insi<strong>de</strong><br />
the mixed oxi<strong>de</strong> network during cathodic polarization. At more positive electro<strong>de</strong><br />
potential an anodic wave (2) appears. This wave is associated with cobalt<br />
oxidation (Co → Co II + 2e - ). When the electro<strong>de</strong> potential becomes more<br />
positive a second anodic wave (3) associated with oxidation of Co (II) ions<br />
(Co II → Co III + e - ) can be observed. Like in alkaline media, anodic oxidation<br />
of Co (II) ions consists in oxygen insertion into the mixed oxi<strong>de</strong> crystalline<br />
structure. When the electro<strong>de</strong> potential is over 1.17 V versus Ag/AgCl oxygen<br />
evolution on electro<strong>de</strong> surface can be noticed.<br />
On the backward scan a cathodic peak (5) associated with reduction<br />
of Co (III) ions to Co (II) ions was noticed, followed by a small current plateau (6)<br />
associated with reduction of Co (II) ions to Co. When the electro<strong>de</strong> potential<br />
becomes more negative the hydrogen evolution reaction was observed (7).<br />
A<br />
3<br />
4
ELECTROCHEMICAL BEHAVIOUR OF YBaCo4O7 IN NEUTRAL AQUEOUS SOLUTION<br />
The insertion of oxygen ions into the Y-114 crystalline structure leads<br />
to its compaction, resulting in the inhibition of redox processes at the Y-114 /<br />
electrolyte solution interface. Therefore, the peak height and also the limiting<br />
currents <strong>de</strong>crease during electrochemical polarization. In the fifth cycle, the<br />
polarization curves <strong>de</strong>tails are fading, except the anodic wave (8) associated<br />
with oxidation of Co (II) ions and also the reduction peak (9) associated with<br />
the reduction of Co (III) ions to Co (II).<br />
I [A]<br />
0.0015<br />
0.0010<br />
0.0005<br />
0.0000<br />
-0.0005<br />
-0.0010<br />
-0.0015<br />
-1.5 -1.0 -0.5 0.0 0.5 1.0 1.5 2.0 2.5<br />
E [V/Ag/AgCl]<br />
Figure 2. Cyclic voltammogram on YBaCo4O7 working electro<strong>de</strong> in<br />
0.5 mol L -1 Na2SO4 solution at 5 mV s -1 scan rate.<br />
When the cyclic voltammograms were recor<strong>de</strong>d at lower polarization<br />
rate ( 5 mV s -1 ), starting from open circuit potential (OCP) with polarization at<br />
OCP for 300 s (Fig. 2), the first peak 1 (Fig. 1) corresponding to the oxidation<br />
of Co to Co (II) was not obtained. The lower polarization rate, leads to higher<br />
quantities of electricity crossing the interface during the experiment. A further<br />
analysis of the CV shown in Fig. 2, reveals a net oxidation peak related to<br />
the oxidation of Co (II) ions to Co (III) ions, instead of the plateau recor<strong>de</strong>d at<br />
higher polarization speed (Fig. 1). This process is controlled by the diffusion<br />
of O 2- ions insi<strong>de</strong> of Y-114 mixed oxi<strong>de</strong> and not by the diffusion of different<br />
ionic species presented in the adjacent electrolyte solution. Quasi-irreversible<br />
nature of the oxidation of Co (II) ions is distinguishable both by the higher<br />
difference between potentials related with the oxidation and reduction peak<br />
potentials and also by the attenuation with almost 50% of the reduction peak<br />
height in comparison with the oxidation peak.<br />
121
122<br />
MIRCEA DAN, NICOLAE VASZILCSIN, ANDREA KELLENBERGER, NARCIS DUTEANU<br />
When cyclic voltammograms were recor<strong>de</strong>d at higher polarization<br />
scan rate (100 mV s -1 ) the anodic wave associated with the oxidation of the<br />
Co (II) ions is indistinct and overlapped over the oxygen evolution curve as<br />
is <strong>de</strong>picted in Fig. 3.<br />
I [A]<br />
0.008<br />
0.006<br />
0.004<br />
0.002<br />
0.000<br />
-0.002<br />
-0.004<br />
-0.006<br />
-2.0 -1.5 -1.0 -0.5 0.0 0.5 1.0 1.5 2.0<br />
E [V/Ag/AgCl]<br />
Figure 3. Cyclic voltammogram (5 cycles) on YBaCo4O7 working electro<strong>de</strong> in<br />
0.5 mol L -1 Na2SO4 solution at 100 mV s -1 scan rate.<br />
The compound porosity was <strong>de</strong>termined by the BET technique and<br />
the results are presented in Table 1.<br />
Table 1. BET surface area, pore diameter, and pore volume of the YBaCo4O7 sample<br />
Parameter Value<br />
BET Surface Area 0.3108 m² g -1<br />
BJH Desorption average pore diameter (4V/A) 11.0584 nm<br />
BJH Desorption cumulative volume of pores between 1.7000 nm<br />
and 300.0000 nm diameter<br />
0.000786 cm³ g -1<br />
This will lead to large specific surface and provi<strong>de</strong> channels favouring<br />
adsorption and <strong>de</strong>sorption of oxygen in time of electrochemical polarization.<br />
Compared with <strong>de</strong>nse bulk sample, this porous balls show fast oxygen adsorption<br />
and <strong>de</strong>sorption rates.<br />
SEM images obtained for YBaCo4O7 bar electro<strong>de</strong> used in this work<br />
are presented in Fig. 4. Analyzing the SEM images, a porous structure due to<br />
crystallites agglomeration can be observed. This structure equalizes with a<br />
large number of pores insi<strong>de</strong> of ceramic electro<strong>de</strong>. Large pores amount lead to<br />
a higher specific surface with channels which favour oxygen adsorption /<br />
<strong>de</strong>sorption process and lead to a high concentration of superficial active ions.
ELECTROCHEMICAL BEHAVIOUR OF YBaCo4O7 IN NEUTRAL AQUEOUS SOLUTION<br />
Figure 4. SEM images of the YBaCo4O7 electro<strong>de</strong>’s surface before electrochemical<br />
oxidation/reduction at 1000x(a) and 5000x(b) magnification<br />
Based on all information presented above we are presenting a<br />
mechanism for Co (II) to Co (III) global oxidation process in neutral aqueous<br />
solution in Fig. 5.<br />
This way the oxygen activity in the superficial layer becomes more<br />
pronounced than oxygen activity in the bulk of mixed oxi<strong>de</strong>. This activity<br />
gradient <strong>de</strong>termines to the oxygen diffusion from the surface of Y-114<br />
compound into the mass of mixed oxi<strong>de</strong>. Oxygen diffusion rate is much<br />
lower in comparison with charge transfer or hydroxyl ions diffusion from the<br />
electrolyte solution to the electro<strong>de</strong> surface.<br />
Therefore, the electrochemical oxidation of Co (II) to Co (III) actually<br />
consists in oxygen insertion into the crystalline structure of YBaCo4O7.<br />
Consequently, during oxidation the crystalline network of Y-114 mixed<br />
oxi<strong>de</strong> becomes more compact (<strong>de</strong>nse), so that oxygen diffusion is slower.<br />
Furthermore, the oxidation process of Co (II) to Co(III) is not complete.<br />
The constriction of the mixed oxi<strong>de</strong> layer induces a slight irreversible<br />
character to the oxidation of Co (II) ions, which leads to the disappearance of<br />
the oxidation plateau (3) and also to the attenuation of the reduction peak (6)<br />
in comparison with the oxidation peak (Fig. 1).<br />
According with the presented mechanism, at anodic polarization,<br />
after the OCP, the oxidation process is controlled by the charge transfer step;<br />
this is supported by the electrochemical impedance spectra.<br />
The electrochemical impedance spectra recor<strong>de</strong>d for the YBaCo4O7<br />
electro<strong>de</strong> during oxidation at E = 0.3 V in neutral solution are given in Fig.6.<br />
The experimental complex plane plots show distinct features <strong>de</strong>pending<br />
on the frequency range. Thus, the final part of an incomplete semicircle can be<br />
observed at high frequencies, between 100 kHz and 30.9 kHz, which is related<br />
to a charge transfer process. A slightly curved line related to a Gerischer element<br />
appears at intermediate frequencies, between 30.9 kHz and 141 Hz. Finally, a<br />
large semicircle is observed at low frequencies, between 141 Hz and 1 mHz.<br />
123
124<br />
MIRCEA DAN, NICOLAE VASZILCSIN, ANDREA KELLENBERGER, NARCIS DUTEANU<br />
Figure 5. Proposed mechanism for the electrochemical oxidation<br />
of YBaCo4O7 in neutral solutions:<br />
a) oxidation of Co 2+ ions at electro<strong>de</strong> interface;<br />
b) addition of water molecules at newly formed Co 3+ cations;<br />
c) elimination of H + ions;<br />
d) elimination of H2O and structural rearrangement of YBaCo4O7;<br />
e) diffusion of oxygen ions; lines- prepon<strong>de</strong>rant ionic interaction.<br />
Figure 6. Experimental Nyquist (a) and Bo<strong>de</strong> (b) plots for YBaCo4O7 at E = 0.3 V in<br />
0.5 mol L -1 Na2SO4. Inset: enlargement of the medium to high frequency domain.<br />
Open symbols are experimental points and continuous lines are simulated<br />
by the CNLS fitting according to the equivalent circuit.
ELECTROCHEMICAL BEHAVIOUR OF YBaCo4O7 IN NEUTRAL AQUEOUS SOLUTION<br />
The experimental impedance data were mo<strong>de</strong>lled using the equivalent<br />
circuit given in Fig. 7. It consists of an ohmic resistance ROhm in series with<br />
a parallel connection of a constant phase element (CPE) and the charge<br />
transfer resistance Rct followed by a Gerischer element (GE) and a parallel<br />
connection of a Warburg element (W) and a resistance (R) in series with a<br />
capacitor (C).<br />
Rohm CPE<br />
Rct<br />
GE W<br />
R C<br />
Figure 7. Equivalent electric circuit for mo<strong>de</strong>lling oxygen insertion<br />
into the YBaCo4O7 electro<strong>de</strong> in neutral solution.<br />
The ohmic resistance inclu<strong>de</strong>s the uncompensated solution resistance<br />
and a contribution from the resistance of the YBaCo4O7 electro<strong>de</strong>. The<br />
constant phase element replaces the double layer capacitance since it has<br />
been observed that it <strong>de</strong>scribes more accurately the behaviour of real<br />
electrochemical systems. The Gerischer element [13] is a diffusion element,<br />
similar to the Warburg impedance, which has been proposed to <strong>de</strong>scribe<br />
the alternating current response of an electrochemical system where a<br />
chemical reaction is preceding or following the electrochemical reaction. In<br />
its most simple form the impedance of a Gerischer element is given by:<br />
ZGE = Z0 / (k + jω) 1/2<br />
where Z0 is the magnitu<strong>de</strong> of the impedance at ω = 1 rad s -1 and k is a rate<br />
constant parameter.<br />
The experimental impedance data were fitted to the equivalent circuit<br />
using a complex non-linear least squares procedure. The results of the fitting<br />
are shown as continuous lines in Fig. 6 and the corresponding values of the<br />
circuit elements, together with their standard errors are given in Table 2.<br />
The high frequency part of the impedance spectra could be fitted<br />
only if the ohmic resistance was imposed to a fixed value. However, if the<br />
proposed mo<strong>de</strong>l is used to simulate the response at high frequencies up to<br />
10 8 Hz the whole semicircle is visible as a continuous line in the inset of<br />
Fig. 6a. The constant phase angle parameter n has a value of 0.52 and is<br />
consi<strong>de</strong>red to be related to surface inhomogeneities and porosity of the<br />
electro<strong>de</strong>. Values around 0.9 are common for metal electro<strong>de</strong>s, while lower<br />
values of 0.6 have been reported for porous electro<strong>de</strong>s [14].<br />
125
126<br />
MIRCEA DAN, NICOLAE VASZILCSIN, ANDREA KELLENBERGER, NARCIS DUTEANU<br />
Table 2. Experimental values of the circuit elements during oxidation<br />
of YBaCo4O7 in neutral solution<br />
Parameter Value<br />
ROhm [Ω] 25 (fixed)<br />
T [F s n-1 ] 7.04 × 10 -4 ± 2.54 × 10 -4<br />
n 0.52 ± 0.04<br />
Rct [Ω] 10.07 ± 0.89<br />
Z0 [Ω s 1/2 ] 0.00344 ± 6.2 × 10 -5<br />
k [s -1 ] 1.72 ± 0.03<br />
RW [Ω] 126.0 ± 2.2<br />
τD [s] 1.855 × 10 -6 ± 0.185 × 10 -6<br />
φ 0.5 (fixed)<br />
R [Ω] 34.57 ± 0.71<br />
C [F] 9.06 × 10 -4 ± 0.17 × 10 -4<br />
CONCLUSIONS<br />
Results obtained by cyclic voltammetry in neutral aqueous solution<br />
showed that the YBaCo4O7 mixed oxi<strong>de</strong> is sensitive to anodic or cathodic<br />
polarization. Based on the experimental data we can conclu<strong>de</strong> that the<br />
electrochemical oxidation of Co(II) ions consist in oxygen insertion in the<br />
mixed oxi<strong>de</strong> structure. Because of that during oxidation the Y-114 crystalline<br />
network becomes <strong>de</strong>nser, so that oxygen diffusion rate is lowered.<br />
The compaction of Y-114 during oxidation imposes a partial irreversible<br />
character of this process, and as a consequence the oxidation leads to<br />
disappearance of the oxidation plateau and also to the attenuation of the<br />
reduction peak.<br />
Based on the EIS spectra and the presented mechanism, the oxidation<br />
process is controlled by the charge transfer step. Thus, a complete structural<br />
characterization of the <strong>full</strong>y oxidized phase will be discussed in a forthcoming<br />
paper.<br />
EXPERIMENTAL SECTION<br />
The YBaCo4O7 compound was obtained using a solid state reaction, by<br />
mixing the precursor Y2O3, BaCO3 and CoO4/3 according to the stoichiometric<br />
cation ratio. After <strong>de</strong>carbonisation at 1000 ° C the pow<strong>de</strong>r was pressed in bars<br />
(2x2x10 mm). The bars were fired in air for 48h at 1200 ° C and then removed<br />
rapidly from furnace and set to ambient temperature. [1,3,4,6,12].
ELECTROCHEMICAL BEHAVIOUR OF YBaCo4O7 IN NEUTRAL AQUEOUS SOLUTION<br />
The electrochemical measurements were carried out using an Autolab<br />
PGSTAT 302N equipped with electrochemical impedance spectroscopy (EIS)<br />
module. The electrochemical cell was a conventional one-compartment, threeelectro<strong>de</strong><br />
glass cell with a volume of 50 mL. Two graphite counter electro<strong>de</strong>s<br />
were placed symmetrically next to the working electro<strong>de</strong> ma<strong>de</strong> of YBaCo4O7<br />
pressed bar and a Ag/AgCl(sat) electro<strong>de</strong> was used as reference. All potentials<br />
in this work are given versus the reference electro<strong>de</strong>. All electrochemical<br />
measurements were performed in 0.5 mol L -1 Na2SO4 electrolyte solution.<br />
Electrochemical impedance spectroscopy measurements were carried out<br />
using the FRA module of Autolab 302N, in the frequency range from 0.1 Hz to<br />
100 kHz and AC voltage amplitu<strong>de</strong> of 10 mV. For each spectrum 60 points<br />
were collected, with a logarithmic distribution of 10 points per <strong>de</strong>ca<strong>de</strong>. The<br />
experimental electrochemical impedance data were fitted to the electrical<br />
equivalent circuit by a complex non-linear least squares (CNLS) Levenberg –<br />
Marquardt procedure using ZView – Scribner Associates Inc. software.<br />
The surface area was <strong>de</strong>termined according to the Brunauer-Emmet-<br />
Teller (BET) method using a ASAP 2020 M (Micromeritics Instrument Corporation<br />
USA).<br />
REFERENCES<br />
1. E.V. Tsipis, D.D. Khalyavin, S.V. Shiryaev, K.S. Redkina, P. Núñez, Materials<br />
Chemistry and Physics, 2005, 92, 33.<br />
2. H. Hao, J. Cui, C. Chen, L. Pan, J. Hu, X. Hu, Solid State Ionics, 2006, 177, 631.<br />
3. H. Haoshan, Z. Limin, H Jie, H. Xing, H Hongwei, Journal of Rare Earths, 2009, 27,<br />
815.<br />
4. E.V. Tsipis, V.V. Kharton, J.R. Fra<strong>de</strong>, P. Núñez, Journal of Solid State Electrochemistry,<br />
2005, 9, 547.<br />
5. K. Zhang, Z. Zhu, R. Ran, Z Shao, V.V. Jin, S. Liu, Journal of Alloys and Compounds,<br />
2010, 492, 552.<br />
6. M. Valldor, M. An<strong>de</strong>rsson, Solid State Science, 2002, 4, 923.<br />
7. M. Valldor, Solid State Science, 2004, 6, 251.<br />
8. M. Dan, V. Pralong, N. Vaszilcsin, A. Kellenberger, N. Duteanu, Journal of Solid State<br />
Electrochemistry, published online, DOI 10.1007/s10008-010-1189-3.<br />
9. J.C. Grenier, A. Wattiaux, J.P. Doumerc, P. Dordor, L. Fournes, J.P. Chamina<strong>de</strong>, M.<br />
Pouchard, Journal of Solid State Chemistry, 1992, 96, 20.<br />
10. J.C. Grenier, J.M. Bassat, J. P. Doumerc, J. Etourneau, Z. Fang, L Fournes, S. Petit,<br />
M. Pouchard, A. Wattiaux, Journal of Materials Chemistry, 1999, 9, 25.<br />
11. K.M. Ismail, W.A. Badawy, Journal of Applied Electrochemistry, 2000, 30, 1303.<br />
12. M.D. Levi, H. Gizbar, E. Lancry, Y. Gofer, E Levi, D. Aurbach, Journal of<br />
Electroanalytical Chemistry, 2004, 569, 211.<br />
13. H. Gerischer, Zeitschrift für Physikalische Chemie, 1951, 198, 216.<br />
14. A. Kellenberger, N. Vaszilcsin, W. Brandl, Journal of Solid State Electrochemistry,<br />
2007, 11, 84.<br />
127
STUDIA UBB CHEMIA, LVI, 1, 2011<br />
EQUILIBRIUM AND KINETIC STUDIES OF IRON (II)<br />
REMOVAL FROM 34% CALCIUM CHLORIDE SOLUTIONS<br />
BY CHELATING RESIN PUROLITE S930<br />
CAMELIA POPA a , PETRU BULAI a , MATEI MACOVEANU a<br />
ABSTRACT. This work presents equilibrium, thermodynamic and kinetic studies<br />
of iron removal from 34% CaCl2 solution (that was obtained from electrolysis<br />
sludges) using chelating resin Purolite S930 with iminodiacetic acid functional<br />
groups.<br />
Batch sorption experiments were performed using both forms of the resin<br />
(S930-Na and S930-H) by varying the initial conditions such as initial solution<br />
pH (2.0-5.0), initial concentration of iron (20-400mg/L), solution temperature<br />
(22-40 0 C) and contact time (10 minutes up to 24 hours). The practical capacity<br />
of the resin increases with initial solution pH, temperature and the initial<br />
concentration of iron(II). Freundlich constants (n) had values bigger than 1 for<br />
the whole range of temperature that was studied, so, the sorbtion of iron on<br />
Purolite S930-Na form resin is a favourable one. The values of correlation<br />
coefficients (R 2 ) higher than 0,99 show that on the studied concentration<br />
(200-400mg Fe(II)/L) and temperature (295-313 K) range the data were more<br />
suitable to the LangmuirI mo<strong>de</strong>l. The values obtained for the Langmuir (RL)<br />
constant (0 < RL < 1) show a favourable isotherme for the whole range of<br />
temperature that was studied (295-313 K). The maximum sorption capacity<br />
(qmax) was 238 mg Fe(II)/g for pH5. The values of calculated thermodynamic<br />
parameters (ΔG 0 , ΔH 0 and ΔS 0 ) indicate that the sorption of iron onto Purolite<br />
S930 resin is an endothermic and spontaneous process. The kinetic data show<br />
that, initially, sorption increases rapidly, but after that, the rate becomes slower;<br />
the equilibrium can be consi<strong>de</strong>red attained after 24 hours. Kinetic studies<br />
reveal that the sorption of iron from 34% CaCl2 solution onto chelating resin<br />
follows a pseudo-second or<strong>de</strong>r mo<strong>de</strong>l.<br />
Keywords: Iron (II) removal, Purolite S 930, Sorption isotherm, Thermodynamics,<br />
Kinetics<br />
INTRODUCTION<br />
From chemical industry results important quantities of sludges. The<br />
most part of these sludges contain useful compounds that can be reused to<br />
obtain other chemical products. Depending on the method used to recover this<br />
compounds, the new chemical products may contain also heavy metals.<br />
a “Gh. Asachi” Technical University of Iasi, Faculty of Chemical Engineering & Environmental<br />
Protection, Department of Environmental Engineering & Management, 71 A, D. Mangeron Blvd.,<br />
700050 Iasi, Romania
130<br />
CAMELIA POPA, PETRU BULAI, MATEI MACOVEANU<br />
The presence of the heavy metals in the environment is a major problem,<br />
so to find another purification technique than chemical precipitation is very<br />
important in environmental protection.<br />
Ion exhange metho<strong>de</strong>s are profitable and ecological as purification<br />
metho<strong>de</strong>s and may be used for organic and inorganic compounds. Some<br />
advantages of these metho<strong>de</strong>s are: good percent of removal, safe operation,<br />
easy to use, no sludges and recovery of the sorbed. Ion exhangers have also<br />
great exchange capacity, long operating life and big number of operating<br />
cycles[1, 2].<br />
The aim of this work is to extend the application of Purolite S930<br />
chelating resin for the purification of 34% CaCl2 solution obtained from<br />
electrolysis sludges [3].<br />
The sorption characteristics of iron ions onto iminodiacetic resin<br />
Purolite S930 was studied in various operating conditions like: initial pH,<br />
initial iron concentration, contact time, temperature, ionic form of the resin<br />
and resin dose.<br />
RESULTS AND DISCUSSIONS<br />
Sorption isotherms. The relationship between the amount of Fe(II)<br />
sorbed onto Purolite S930 and equilibrium concentration in 34% CaCl2 solution<br />
is <strong>de</strong>scribed by the sorption isotherms. The analysis of equilibrium data was<br />
used to verify the sorption mo<strong>de</strong>ls and also to <strong>de</strong>termine the values of real<br />
sorption capacity.<br />
The sorption of Fe(II) by Purolite S930 resin was quantitatively<br />
evaluated by percent of Fe(II) removal R (%) and by amount of Fe(II)<br />
retained on resin, q (mg/g), according to Eqs.1 and 2:<br />
C0−Ce R = 100 ; (1)<br />
C0<br />
( C0−Ce) V<br />
q = ; (2)<br />
m<br />
where C0 and Ce are the initial and the equilibrium concentration of Fe(II) in<br />
the solution (mg/L), V is the volume of solution (L) and m is the amount of<br />
the resin (g).<br />
Figure 1 shows the sorption isotherms of iron (II) from 34% CaCl2<br />
solution onto sodium form of Purolite S930 resin, for different values of solution<br />
pH. The influence of the initial iron concentration on loading capacity of the<br />
resin is presented in Figure 2.
EQUILIBRIUM AND KINETIC STUDIES OF IRON (II) REMOVAL FROM 34% CALCIUM CHLORIDE …<br />
q, mg/g<br />
300<br />
200<br />
100<br />
0<br />
0 50 100 150 200 250<br />
Ce, mg/l<br />
pH 3 pH 4 pH 5<br />
Figure 1. Isotherm plot for Fe (II) sorption onto Purolite S930-Na resin;<br />
T=22 0 C, resin dose=1g/L, contact time=24h;<br />
q, mg/g<br />
250<br />
200<br />
150<br />
100<br />
50<br />
0<br />
0 50 100 150 200 250 300 350 400 450<br />
Co, mg/L<br />
pH3 pH4 pH5<br />
Figure 2. The influence of the initial iron concentration on loading capacity;<br />
T=22 0 C, resin dose=1g/L, contact time=24h;<br />
The equilibrium data obtained from sorption experiments were fitted<br />
using Freundlich, Langmuir and Dubinin mo<strong>de</strong>ls. The equation parameters of<br />
these mo<strong>de</strong>ls provi<strong>de</strong> important information about the sorption mechanism,<br />
the surface properties and the affinity of the sorbent [6].<br />
Freundlich mo<strong>de</strong>l<br />
The Freundlich equation is an empirical relationship established upon<br />
sorption onto a heterogeneous surface supposing that different site involve<br />
different sorption enegies.<br />
q = KF C 1/n (3)<br />
where KF (mg/g) and n are Freundlich constants witch incorporate all factors<br />
affecting the sorption process such as sorption capacity and intensity of<br />
sorption. These constants are <strong>de</strong>termined from the intercept and slope of<br />
linear plot of log qe versus log Ce [7].<br />
131
132<br />
CAMELIA POPA, PETRU BULAI, MATEI MACOVEANU<br />
1<br />
lg q = lg KF + lg Ce<br />
(4)<br />
n<br />
To <strong>de</strong>termine the values of Freundlich parameters (KF and n) the<br />
experimental data where plotted as log q versus log Ce, as shown in Figure 3.<br />
lg qe<br />
3,00<br />
2,50<br />
2,00<br />
1,50<br />
1,00<br />
0,50<br />
Freundlich<br />
-1,00 -0,50<br />
0,00<br />
0,00 0,50 1,00<br />
lg Ce<br />
1,50 2,00 2,50 3,00<br />
pH 3 pH 4 pH 5<br />
Figure 3. Freundlich isotherm plots for the sorption of iron (II) from 34%CaCl2 solution<br />
onto Purolite S930-Na resin; T=22 0 C, resin dose=1g/L, contact time=24h<br />
Langmuir mo<strong>de</strong>l<br />
Langmuir sorption isotherm shows the maximum sorption capacity<br />
supposing monolayer sorption on a surface with a finite number of i<strong>de</strong>ntical<br />
sites.<br />
Ce<br />
1 1<br />
= Ce<br />
+ (5a)<br />
q q K q<br />
max L max<br />
1 ⎛ 1 ⎞ 1 1<br />
= ⎜ ⎟ +<br />
(5b)<br />
q ⎝ KLqmax ⎠Ce<br />
qmax<br />
where qmax and KL are Langmuir isotherm constants. Thus, qmax show the<br />
maximum sorption capacity (mg/g) while KL is the equilibrium constant relating<br />
adsorption capacity (L/mg). Langmuir constants are evaluated from the slope<br />
and intercept of the Ce/qe versus Ce. The dimensionless parameter of the<br />
equilibrium RL was calculated using eq. 6.<br />
R<br />
L<br />
1<br />
= (6)<br />
1+<br />
K ⋅C<br />
L<br />
0<br />
where C0 (mg/L) is the initial metal ion concentration. This parameter may<br />
have four values: RL = 0 for an irreversible sorption isotherm, 0 < RL < 1 for<br />
a favourable sorption isotherm, RL = 1 for a sorption linear isotherm and RL >1<br />
for an unfavourable sorption [7].
EQUILIBRIUM AND KINETIC STUDIES OF IRON (II) REMOVAL FROM 34% CALCIUM CHLORIDE …<br />
The equilibrium data were also fitted to linear Langmuir I and Langmuir II<br />
equations (5a, 5b). The Langmuir parameters (qmax and KL) were <strong>de</strong>termined<br />
by plotting Ce/qe versus Ce (Fig. 3.4.) and 1/qe versus 1/Ce respectively (Figure<br />
4 and Figure 5).<br />
Ce/qe<br />
1,5000<br />
1,0000<br />
0,5000<br />
Langmuir I<br />
0,0000<br />
0,0000 50,0000 100,0000 150,0000 200,0000 250,0000<br />
Ce<br />
pH 3 pH4 pH 5 Linear (pH 5)<br />
Figure 4. Langmuir I isotherm plots for the sorption of iron(II) from 34%CaCl2 solution<br />
onto Purolite S930-Na resin; T=22 0 C, resin dose=1g/L, contact time=24h;<br />
1/qe<br />
0,0800<br />
0,0600<br />
0,0400<br />
0,0200<br />
0,0000<br />
Langmuir II<br />
0,0000 1,0000 2,0000 3,0000 4,0000 5,0000 6,0000<br />
1/Ce<br />
pH 3 pH 4 pH 5 Linear (pH 5)<br />
Figure 5. Langmuir II isotherm plots for the sorption of iron(II) from 34%CaCl2 solution<br />
onto Purolite S930-Na resin; T=22 0 C, resin dose=1g/L, contact time=24h;<br />
For <strong>de</strong>fining the mo<strong>de</strong>l wich <strong>de</strong>scribes in the best way possible the<br />
experimental data, there were used linear regression analysis.<br />
The values of isotherm parameters for different initial pH are presented<br />
in Table 1.<br />
The high coefficient of <strong>de</strong>termination (R 2 = 0.994) of the plot shows that<br />
the linear Langmuir equation gives the best fit to the sorption isotherm for<br />
the sorption of Fe(II) onto Purolite S930 resin at 295 K. For an initial pH = 5<br />
and a temperature of 295 K, the Langmuir maximum sorption capacity qmax<br />
was 238 mg Fe (II)/L and the Langmuir equilibrium constant KL, had a value<br />
of 0.178 L/g.<br />
133
134<br />
CAMELIA POPA, PETRU BULAI, MATEI MACOVEANU<br />
Table 1. pH <strong>de</strong>pen<strong>de</strong>nce of the isotherm parameters for iron(II) sorption onto<br />
Purolite S930 resin from 34% CaCl2 solutions at T = 295 K<br />
pH=3 pH=4 pH=5<br />
y=0.583x+0.887<br />
Freundlich R 2 =0.974<br />
n=1.71<br />
KF =7.72<br />
y=0.004x+0.336<br />
R<br />
Langmuir I<br />
2 =0.928<br />
qmax =222.2mg/g<br />
KL=0.107L/mg = 6000<br />
L/mol<br />
ΔG= - 21337.27 kJ/mol<br />
Langmuir II y=0.168x+0.0095<br />
R 2 =0.915<br />
Dubinin y=-0.0053x+7,30<br />
β=0.006mo l 2 /J 2<br />
qmax=793.14 mg/g<br />
R 2 =0.936<br />
E=9.12 kJ/mol<br />
y=0.342x+1.526<br />
R 2 =0.823<br />
n=2.92<br />
KF =33.59<br />
y=0.005x+0.072<br />
R 2 =0.937<br />
qmax =200 mg/g<br />
KL=0.069 L/mg =<br />
3872.75 L/mol<br />
ΔG= - 20263.5 kJ/mol<br />
y=0.039x+0.0041<br />
R 2 =0.966<br />
y=-0.0027x+6,25<br />
β=0.004mo l 2 /J 2<br />
qmax=384.9 mg/g<br />
R 2 =0.992<br />
E=11.18 kJ/mol<br />
y=0.202x+0.888<br />
R 2 =0.567<br />
n=4.92<br />
KF =77.57<br />
y=0.004x+0.023<br />
R 2 =0.994<br />
qmax =238.1 mg/g<br />
KL=0.178 L/mg =<br />
9974.04L/mol<br />
ΔG= - 22441.56 kJ/mol<br />
y=0.005x+0.0068<br />
R 2 =0.518<br />
y=-0.0041x+5,95<br />
β=0.002mo l 2 /J 2<br />
qmax=519.57 mg/g<br />
R 2 =0.797<br />
E=15.81kJ/mol<br />
Each ,,R 2 ” value, was calculated for 6 points of concentration: 20,<br />
50, 100, 200, 300, 400 mg Fe(II)/L.<br />
Figure 6 shows the variation of sorption intensity (RL) with initial<br />
metal concentration in the 34% CaCl2 solution, for the range of pH (3-5)<br />
and temperature 295 K.<br />
RL<br />
0,45<br />
0,4<br />
0,35<br />
0,3<br />
0,25<br />
0,2<br />
0,15<br />
0,1<br />
0,05<br />
0<br />
0 50 100 150 200 250 300 350 400 450<br />
C0, mg Fe(II)/L<br />
pH=3 pH=4 pH=5<br />
Figure 6. Variation of sorption intensity (RL) with initial metal concentration;<br />
34%CaCl2 solution, 1 g/L S930 - Na, contact time 24 h, pH = 3-5,<br />
temperature: 295 K
EQUILIBRIUM AND KINETIC STUDIES OF IRON (II) REMOVAL FROM 34% CALCIUM CHLORIDE …<br />
The values for sorption capacity qmax=200-238 mg/g are comparable<br />
with literature data that are <strong>de</strong>scribed in Table 2 [4].<br />
The Dubinin–Radushkevich isotherm is expressed in linear form as<br />
follows [8,9].<br />
2<br />
ln q = ln qmax<br />
− βε<br />
(7)<br />
where qmax is the maximum sorption capacity (mg/g), β, the activity coefficient<br />
related to mean sorption energy (mol 2 /J 2 ) and ε is the Polanyi potential<br />
(J/mol) equal to:<br />
1<br />
ε RT ln ( 1 +<br />
C<br />
e<br />
)<br />
= (8)<br />
where R is the gas constant and T is the temperature. The mean free<br />
energy of sorption, E (kJ/mol), can be estimated using the following equation:<br />
1<br />
E = (9)<br />
− 2β<br />
Table 2. Sorption capacity for Fe(III) on different kinds of resins<br />
Metal Resin Loading capacity, mg/g<br />
Fe(III) Amberlite IRC-50 200<br />
Fe(III) Amberlite IRC-76 235,2<br />
Fe(III) Dowex MAC-3 182,9<br />
Fe(III) Duolite C-433 231,5<br />
Fe(III) Duolite C-436 216,5<br />
Fe(III) Amberlite IRC-86 225,9<br />
The mean free energy of sorption E, gives information about the type<br />
of the sorption mechanism as chemical, ion-exchange or physical sorption.<br />
If ,,E” value is between 8 and 16 kJ/mol, the sorption process follows a<br />
chemical ion-exchange; if ,,E” value is less than 8 kJ/mol, the sorption is<br />
physical [7].<br />
To <strong>de</strong>termine the nature of sorption process (physical or chemical),<br />
the experimental data were fitted to the Dubinin isotherm mo<strong>de</strong>l based on<br />
the heterogeneous surface of the sorbate (Figure 7).<br />
The isotherm parameters were computed from the graphical<br />
representation of ln q = f(ε 2 ) equation. (Table 1). The value of the mean free<br />
energy of sorption E calculated with Eq. (9) was 11.62 KJ/mol indicating<br />
that the sorption process follow a chemical ion-exchange mechanism.<br />
The validity of Freundlich and Langmuir mo<strong>de</strong>ls within the range of<br />
295-313 K. The isotherms for this range of temperature are presented in<br />
Figure 8 and the results are shown in Table 3.<br />
135
136<br />
lgq<br />
7<br />
6<br />
5<br />
4<br />
3<br />
2<br />
1<br />
CAMELIA POPA, PETRU BULAI, MATEI MACOVEANU<br />
0<br />
0 200 400 600<br />
ε2<br />
800 1000 1200<br />
pH = 3 pH = 4 pH = 5<br />
Figure 7: D-R isotherm plots for the sorption of Fe (II) from CaCl2 34% solution,<br />
onto S930 – Na resin;1 g/L S930-Na, contact time 24 h, temperature: 22 ºC<br />
The high coefficient of <strong>de</strong>termination (R 2 ) of the plot shows that the<br />
linear Langmuir equation gives the best fit to the sorption isotherm for the<br />
sorption of Fe(II) onto Purolite S930 resin in the whole range of temperature<br />
that was studied.<br />
q, mg/g<br />
250<br />
200<br />
150<br />
100<br />
50<br />
0<br />
-50 0 50 100<br />
Ce, mg/L<br />
150 200 250<br />
T22 T40 T30<br />
Figure 8. Sorption isotherms from iron(II) onto Purolite S930-Na form resin,<br />
different temperatures, 34% CaCl2 solution<br />
Table 3. Temperature <strong>de</strong>pen<strong>de</strong>nce of the isotherm parameters for iron(II) sorption<br />
onto Purolite S930-Na form resin from 34% CaCl2 solutions at pH=5<br />
Freundlich y=0.202x+0.888<br />
R 2 =0.56<br />
n=4.92<br />
KF =77.5711<br />
T=295K T=303K T=313K<br />
y=0.271x+1.802<br />
R 2 =0.82<br />
n=3.68<br />
KF =63.44<br />
y=0.309+1.820<br />
R 2 =0.78<br />
n=3.24<br />
KF =66.17
EQUILIBRIUM AND KINETIC STUDIES OF IRON (II) REMOVAL FROM 34% CALCIUM CHLORIDE …<br />
Langmuir I y=0.004x+0.023<br />
R 2 =0.994<br />
qmax =238.1mg/g<br />
KL=0.178 L/mg =<br />
9974.04L/mol<br />
T=295K T=303K T=313K<br />
ΔG = - 22441.5 J/mol<br />
Langmuir II y=0.005x+0.006<br />
R 2 =0.519<br />
y=0.004x+0.005<br />
R 2 =0.939<br />
qmax =267.8 mg/g<br />
KL=0.183 L/mg =<br />
10265.62L/mol<br />
ΔG = - 23279.7 J/mol<br />
y=0.004x+0.004<br />
R 2 =0.990<br />
y=0.003x+0.016<br />
R 2 =0.937<br />
qmax =272.3 mg/g<br />
KL=0.206 L/mg =<br />
11540.46L/mol<br />
ΔG = - 24352.4 J/mol<br />
y=0.007x+0.002<br />
R 2 =0,77<br />
The values for sorption intensity (0 < RL < 1) <strong>de</strong>scribes a favourable<br />
isotherm for the whole range of temperature (295-313 K), Figure 9.<br />
RL<br />
0,25<br />
0,2<br />
0,15<br />
0,1<br />
0,05<br />
0<br />
0 100 200 300 400 500<br />
C0, mg Fe(II)/L<br />
T=303 K T=313 K<br />
Figure 9. The variation of sorption intensity (RL) with initial metal concentration for<br />
different temperatures; 1 g/L S930 – Na form, contact time 24 h, pH = 5.<br />
Thermodynamic studies<br />
The thermodynamic parameters for sorption of iron (II) on Purolite<br />
S930 chelating resin were evaluated using the Langmuir equilibrium constant,<br />
KL, which <strong>de</strong>pends on temperature. The free energy (ΔGº), was evaluated<br />
using equation [10].<br />
ΔG = −RT<br />
ln K L<br />
Ο<br />
(10)<br />
where R is the gas constant (j/mol*K) and T is the temperature ( 0 K). The<br />
standard enthalpy (ΔHº) and standard entropy (ΔSº) associated to the sorption<br />
process were calculated by Eq. (8) [7].<br />
Ο Ο<br />
ΔS<br />
ΔH<br />
ln K L = −<br />
(11)<br />
R RT<br />
137
138<br />
CAMELIA POPA, PETRU BULAI, MATEI MACOVEANU<br />
The Gibbs free energy change of sorption (ΔGº) values calculated<br />
using Eq.(7) for different temperatures are presented in Table 4.<br />
Table 4. Thermodynamic parameters for iron(II) sorption<br />
onto Purolite S930-Na form resin<br />
T, K<br />
ΔG 0 , kJ/mol ΔH 0 , kJ/mol ΔS 0 , J/mol.K<br />
295.15 -22.59<br />
303.15 -23.28<br />
6.31<br />
97.84<br />
313.15 -24.35<br />
The negative value of free energy ΔGº indicated us that sorption of<br />
Fe (II) onto Purolite S930-Na form resin is spontaneous from thermodynamical<br />
point of view. In addition, the <strong>de</strong>crease in ΔGº values with increase in<br />
temperature shows that the sorption was favourable at higher temperatures.<br />
The enthalpy change (ΔHº) and the entropy change(ΔSº) for the sorption<br />
process were obtained from the ln K versus 1/T plot (Figure 10). The enthalpy<br />
change (ΔHº) was 6.31 kJ/mol. The positive value indicates the endothermic<br />
nature of the sorption process. The positive value of the entropy change<br />
(ΔSº=97.84 j/mol K) proves the affinity for iron(II) sorption onto Purolite S930<br />
chelatic resin.<br />
ln KL<br />
9,60<br />
9,50<br />
9,40<br />
9,30<br />
9,20<br />
9,10<br />
9,00<br />
y = -0,7589x + 11,767<br />
R 2 = 0,9189<br />
3,15 3,2 3,25 3,3 3,35 3,4<br />
1000/T, 1000/K<br />
Figure 10. Depen<strong>de</strong>nce of ln KL vs. 1/T for Fe(II) sorption onto Purolite S930-Na<br />
Sorption kinetics<br />
The effect of the phases contact time on Fe (II) sorption onto sodium<br />
ionic form of the resin Purolite S930 is presented in Figure 11. The experiments<br />
were conducted using solutions of 200 mg Fe (II) /L at temperature 295 K<br />
and the initial pH = 5.<br />
The equilibrium was consi<strong>de</strong>red attained after 24 hours; a further<br />
increase in contact time has a negligible effect on the percent of removal.
EQUILIBRIUM AND KINETIC STUDIES OF IRON (II) REMOVAL FROM 34% CALCIUM CHLORIDE …<br />
The sorption of Fe (II) onto Purolite S930-Na form resin was investigated<br />
in terms of the kinetics of the sorption mechanism by using two mo<strong>de</strong>ls:<br />
Lagergren and Ho.<br />
q, mg/g<br />
210<br />
190<br />
170<br />
150<br />
130<br />
110<br />
90<br />
0 500 1000 1500 2000<br />
timp, minute<br />
Figure 11. Effect of contact time on the Fe (II) removal on S930-Na form resin:<br />
C0 = 200 mg Fe(II)/L, pH = 5, T = 295 K, resin dose = 1g/L<br />
Pseudo-first-or<strong>de</strong>r mo<strong>de</strong>l (Lagergren)<br />
The pseudo-first-or<strong>de</strong>r rate expression is presented in Eq. (12)<br />
k1<br />
log( qe qt<br />
) = log qe<br />
− t<br />
2,<br />
303<br />
− (12)<br />
where, qe is the amount of Fe (II) sorbed at equilibrium (mg/g), q is the amount<br />
of Fe (II) sorbed at time t (mg/g) and k1 is the rate constant of first or<strong>de</strong>r sorption<br />
(min -1 ).<br />
The values of pseudo-first-or<strong>de</strong>r mo<strong>de</strong>l parameters (k1 and qe) were<br />
<strong>de</strong>termined by plotting ln (qe −qt) versus t, and the values of pseudo-secondor<strong>de</strong>r<br />
mo<strong>de</strong>l parameters (k1 and qe) were <strong>de</strong>termined by plotting t/qt versus t<br />
(Figure 12 and Figure 13). The values of parameters calculated for various<br />
initial concentrations and various temperatures are presented in Table 5.<br />
Pseudo-second-or<strong>de</strong>r mo<strong>de</strong>l (Ho)<br />
The pseudo-second-or<strong>de</strong>r rate expression is presented in Eq. (13)<br />
t 1 1<br />
= + t<br />
2<br />
(13)<br />
q t k q q<br />
2 e e<br />
where k2 (g/mg min) is the rate constant of the second-or<strong>de</strong>r equation; qt (mg/g),<br />
the amount of sorption time t (min) and qe is the amount of adsorption equilibrium<br />
(mg/g).<br />
139
140<br />
CAMELIA POPA, PETRU BULAI, MATEI MACOVEANU<br />
The initial sorption rate, h (mg/ g. min), at t = 0 is <strong>de</strong>fined as:<br />
2<br />
2 e q k h = (14)<br />
where qe and h values were <strong>de</strong>termined from the slope and intercept of the<br />
plots of t/q against t.<br />
lg(q0-q), mg/g<br />
2,2<br />
2<br />
1,8<br />
1,6<br />
1,4<br />
1,2<br />
1<br />
y = -0,0026x + 2,0975<br />
R 2 = 0,9757<br />
0 100 200<br />
time, minutes<br />
300 400<br />
Figure 12. Lagergren-first-or<strong>de</strong>r mo<strong>de</strong>l, Fe(II) sorption onto Purolite S930-Na form<br />
resin, C0=200 mg Fe(II)/L, T=295 K<br />
9<br />
8<br />
7<br />
6<br />
5<br />
4<br />
3<br />
2<br />
1<br />
0<br />
t/q<br />
y = 0,0052x + 0,2914<br />
R 2 = 0,999<br />
0 500 1000<br />
time, minutes<br />
1500 2000<br />
Figure 13. Ho pseudo-second-or<strong>de</strong>r mo<strong>de</strong>l, Fe(II) sorbtion onto Purolite S930-Na<br />
resin, C0=200 mg Fe(II)/L, T=295 K<br />
Table 5. Pseudo first-or<strong>de</strong>r and pseudo-second-or<strong>de</strong>r parameters for the sorption of<br />
Cu (II) onto Purolite S930 at various temperatures and various initial concentrations<br />
T (<br />
Pseudo first-or<strong>de</strong>r mo<strong>de</strong>l Pseudo second-or<strong>de</strong>r mo<strong>de</strong>l<br />
0 K) k1, min -1 qmax, mg/g R 2<br />
k2, qmax, h,<br />
g/mg min mg/g mg/ g. min<br />
R 2<br />
C0 = 200 mg Fe(II)/L<br />
295 5.98·10 -3<br />
125.7 0.9757 7.87·10 -6 192.3 3.43 0.9999
EQUILIBRIUM AND KINETIC STUDIES OF IRON (II) REMOVAL FROM 34% CALCIUM CHLORIDE …<br />
The results presented Table 5 reveal that the pseudo-second-or<strong>de</strong>r<br />
kinetics is expected to be followed in the sorption of Fe(II) onto Purolite<br />
S930 resin since the values of R 2 (0.9999) are higher than values obtained<br />
for pseudo first-or<strong>de</strong>r. Also, the value for sorption capacity (qmax) for this mo<strong>de</strong>l<br />
is close to experimental sorption capacity values.<br />
EXPERIMENTAL<br />
Materials. The chelating resin used in the experiments was S930<br />
obtained from Purolite International Limited (Hounslow, UK). The main physical<br />
and chemical properties of the resin are presented in Table 6. The resin was<br />
dried in an oven at 65 ºC.<br />
Table 6. Proprietes of chelating resin *<br />
Polymer matrix structure Macro porous styrene divinylbenzene<br />
Functional groups Iminodiacetic acid<br />
Ionic Form (as shipped) Na +<br />
pH range (operating): H + form, Na + form 2 - 6; 6 - 11<br />
Maximum operating temperature 70ºC<br />
Particle size range + 1.0mm
142<br />
CAMELIA POPA, PETRU BULAI, MATEI MACOVEANU<br />
For kinetic experiments the samples were analyzed after a specified<br />
period of time. For thermodynamic studies the experiments were repeated<br />
in the same conditions but for different temperatures. The concentration of<br />
Fe(II) in solutions was measured using a spectrophotometric method with<br />
1,10-phenantroline and hydroxilaminochlorohidrat (λ=510nm) using Hach<br />
DR/2000 spectrophotometer [5]. Because in the presence of O2 from air a<br />
part of Fe(II) becomes Fe(III),all experiments measured the concentration<br />
of total iron as Fe(II).<br />
CONCLUSIONS<br />
The equilibrium data were analysed using Freundlich, Langmuir and<br />
Dubinin sorption isotherm mo<strong>de</strong>ls; sorption was best fitted by the Langmuir 1<br />
mo<strong>de</strong>l. The values of sorption intensity (0 < RL < 1) indicate that iron(II) sorption<br />
onto Purolite S930-Na form resin has a favourable sorption isotherm and the<br />
resin is a good sorbent for the sorption of iron(II) from 34% CaCl2 solution.<br />
Thermodynamic studies reveal the big affinity of the sorbent for<br />
Fe(II) ions from 34% CaCl2 solution and the endothermic nature of sorption<br />
process. The negative value of free energy ΔGº indicated us that sorption of<br />
Fe (II) onto Purolite S930-Na form resin is spontaneous from thermodynamical<br />
point of view. The positive value of enthalpy change (ΔHº = 6.31 kJ/mol)<br />
indicates the endothermic nature of the sorption process. The process is<br />
favourable at higher temperatures; the growth of temperature is favourable<br />
for the velocity constant (k). The positive values for ΔS 0 reveal the increasing<br />
disor<strong>de</strong>r of the system.<br />
The kinetic studies show that the sorption process of Fe(II) from<br />
34% CaCl2 solution onto Purolite S930-Na form resin follows a pseudosecond-or<strong>de</strong>r<br />
mo<strong>de</strong>l.<br />
REFERENCES<br />
1. M. Macoveanu, D. Bîlba, N. Bîlba, M. Gavrilescu, G. Şoreanu, "Ion Exchange<br />
Processes in Environment Protection", Matrix Rom Press, Bucharest, Romania,<br />
2002, chapter 1.<br />
2. T.D. Ionescu, "Ion exhangers," Technical Press, Bucharest, Romania, 1964.<br />
3. C. Scripcariu, S. Mironeasa, P. Bulai, M. Macoveanu, Annals of the Suceava<br />
University – Food Engineering, 2009, VIII, 30.<br />
4. P.A. Riveros, Hydrometallurgy, 2004, 72, 279.<br />
5. G. Popa, S. Moldoveanu, "Quantitative Chemical Analysis Using Organic Reagents",<br />
Technical Press, Bucharest, Romania, 1969.
EQUILIBRIUM AND KINETIC STUDIES OF IRON (II) REMOVAL FROM 34% CALCIUM CHLORIDE …<br />
6. V.C. Srivastava, M.M. Swamy, I.D. Mall, B. Prasad, I.M. Mishra, Colloids and<br />
Surfaces A: Physicochemical and Engineering Aspects, 2006, 272, 89.<br />
7. A. Sari, M. Tuzen, D. Citak, M. Soylak, Journal of Hazardous Materials, 2007,<br />
149, 283.<br />
8. L. Bulgariu, C. Cojocaru, B. Robu, M. Macoveanu, Journal of Environmental<br />
Engineering and Management, 2007, 6, 425.<br />
9. V.B.H. Dang, H.D. Doan, T. Dang-Vu, A. Lohi, Bioresource Technology, 2009,<br />
100, 211.<br />
10. Y. Zhang, J. Chen, X. Yan, Q. Feng, Journal of Chemical Thermodynamics,<br />
2007, 39, 862.<br />
143
STUDIA UBB CHEMIA, LVI, 1, 2011<br />
AMS RADIOCARBON DATING OF THE VERY LARGE<br />
PEDUNCULATE OAK OF CAJVANA<br />
ADRIAN PATRUT a, *, KARL F. VON REDEN b , VASILE SAVU c ,<br />
DANIEL A. LOWY d , RALUCA MITEA a , IOANA BARBUL a<br />
ABSTRACT. Using a new approach of dating live angiosperm trees, three<br />
wood samples collected from the inner cavity of the very large pedunculate<br />
oak (Quercus robur L.) of Cajvana, Romania, were processed and radiocarbon<br />
dated by AMS for <strong>de</strong>termining the age of the tree. The radiocarbon date of<br />
the ol<strong>de</strong>st sample was found to be 736 ± 23 BP, which corresponds to a<br />
calibrated calendar age of 735 ± 10 years. By consi<strong>de</strong>ring the original position<br />
of this sample in the hollow trunk, one can estimate that the age of the oak is<br />
around 810 years.<br />
Keywords: radiocarbon dating, accelerator mass spectrometry, <strong>de</strong>ndrochronology,<br />
pedunculate oak, tree growth.<br />
INTRODUCTION<br />
The pedunculate oak (Quercus robur L.), which belongs to the family<br />
Fagaceae, is consi<strong>de</strong>red to be one of the most longlived native European tree.<br />
The age limit of the pedunculate oak, based mainly on age estimates of the<br />
largest specimens, remains controversial. Mo<strong>de</strong>rn tree researchers consi<strong>de</strong>r<br />
that the upper limit of its age could be close to 1,000 years [1, 2].<br />
The age <strong>de</strong>termination of large oaks is a very difficult task. A complete<br />
ring counting on remaining stumps of old <strong>de</strong>ad specimens is usually not<br />
possible, due to the existence of large cavities in their trunks. The use of the<br />
size/diametre-age relation for oaks is very questionable and may generate<br />
large errors. Age estimates based mainly on ring counting or cross-dating<br />
of increment cores collected from the exterior of the trunk were done on<br />
several big live individuals. The obtained age values were extrapolated to the<br />
theoretical pith, which is assimilated to the geometric midpoint, according to<br />
different formulas which consi<strong>de</strong>r growth rate values based on research done<br />
on stumps and especially on younger live trees growing in somewhat similar<br />
conditions [3, 4]. Other estimates are based on growth rates <strong>de</strong>termined by<br />
a Babes-Bolyai University, Faculty of Chemistry and Chemical Engineering, 11 Arany Janos,<br />
RO-400028, Cluj-Napoca, Romania<br />
* Email: apatrut@gmail.com<br />
b NOSAMS Facility, Department of Geology & Geophysics, Woods Hole Oceanographic Institution,<br />
360 Woods Hole Rd., Mailstop 8, Woods Hole, MA 02543, U.S.A.<br />
c Cajvana School Group, RO-727100 Cajvana, Romania<br />
d FlexEl, LLC, College Park, MD 20742, U.S.A.
ADRIAN PATRUT, KARL F. VON REDEN, VASILE SAVU, DANIEL A. LOWY, RALUCA MITEA, IOANA BARBUL<br />
successive girth measurements of large individuals, performed over longer<br />
periods of time [1]. Even in such cases, the age estimate error, which remains<br />
unknown, can be important.<br />
The radiocarbon investigation of wood samples represents the most<br />
accurate method for dating trees without a continuous sequence of growth<br />
rings in the trunk [5, 6]. Ages of the ol<strong>de</strong>st radiocarbon dated samples are<br />
significantly greater than the relatively short tree-ring sequences of the increment<br />
cores collected from the exterior of the trunk; therefore, the necessary age<br />
extrapolation to the pith is less <strong>de</strong>manding in radiocarbon dating. Previously we<br />
<strong>de</strong>termined the age of the <strong>de</strong>ad historic pedunculate oak of Ţebea, Romania,<br />
by radiocarbon dating of wood samples originating from the upper part of its<br />
trunk, which was removed [7]. Traditionally, radiocarbon investigation was limited<br />
to dating wood samples from the remains of <strong>de</strong>ad or severely damaged trees.<br />
Recently, we exten<strong>de</strong>d consi<strong>de</strong>rably the possibility of ageing large angiosperm<br />
trees, by introducing a methodology which allows to date by radiocarbon standing<br />
and live specimens. This new approach is based on radiocarbon dating of wood<br />
samples collected from the inner cavities of live hollow trees [8].<br />
Here we present and discuss the AMS (accelerator mass spectrometry)<br />
radiocarbon dating results of three wood samples collected from the cavity of<br />
the largest Romanian pedunculate oak, located in Cajvana.<br />
RESULTS AND DISCUSSION<br />
The pedunculate oak of Cajvana and its location<br />
The Cajvana oak has a long history, han<strong>de</strong>d down from one generation<br />
to the other. It is stated that in 1476 the prominent Prince of Moldavia, Stephen<br />
the Great (1457-1504), accompanied by his soldiers, stopped un<strong>de</strong>rneath the<br />
tree. However, the history of the oak is claimed to be much ol<strong>de</strong>r. Resi<strong>de</strong>nts of<br />
the area believe that the oak originates from time of the Tartar invasion of<br />
1241. In this year, the entire male population of the settlement perished in the<br />
battle and was buried in a huge common grave. An oak was planted for<br />
marking the site; this would be the today’s giant oak. In 1942, the Romanian<br />
Aca<strong>de</strong>my nominated the Cajvana oak as a Monument of Nature.<br />
The city of Cajvana is situated in the NE part of Romania, in the<br />
centre of Suceava county, on the county road 178 D, at 36 km NW from<br />
Suceava. The city is crossed by the river Cajvana, which is a branch of the<br />
Soloneţ river. The mean annual temperature in the area is 7.6 ºC and the<br />
mean annual rainfall is 579 mm (Suceava station). The large pedunculate<br />
oak (Figure 1) is located on a hill just in the centre of the city, at a distance<br />
of ca. 120 m from the Cajvana river. Its GPS coordinates are 47º42.117' N,<br />
025º58.072' E; the altitu<strong>de</strong> is 399 m. The tree has a height of 20.1 m and a<br />
circumference at breast height (cbh; 1.30 m above ground level) of 11.01 m,<br />
which corresponds to a formal diametre (dbh) of 3.50 m.<br />
146
AMS RADIOCARBON DATING OF THE VERY LARGE PEDUNCULATE OAK OF CAJVANA<br />
The large trunk, which has an almost cylindrical shape, divi<strong>de</strong>s at the<br />
height of 3.45 m into two heavy branches with basal diametres of 1.85 and<br />
1.75 m (Figures 2 and 3), which rises quasi-vertically and divi<strong>de</strong> further<br />
forming a large canopy. The maximum dimensions of the canopy are of 22.4 m<br />
(in NE-SW direction) and 18.8 m (ca. 25 m before 2006, when a large secondary<br />
branch was cut; in NW-SE direction). A volume estimate indicates a total wood<br />
volume of around 85 m 3 , out of which 35 m 3 for the trunk, 39 m 3 for the two<br />
large primary branches and 11 m 3 for the smaller branches. The volume was<br />
over 90 m 3 in 2006, when a long secondary branch, which exten<strong>de</strong>d just<br />
over the county road and was partially damaged during a storm, was cut for<br />
security reasons.<br />
Figure 1. General view of the large oak of Cajvana taken from the south,<br />
during summer time.<br />
147
ADRIAN PATRUT, KARL F. VON REDEN, VASILE SAVU, DANIEL A. LOWY, RALUCA MITEA, IOANA BARBUL<br />
In present, the tree is in a stage of <strong>de</strong>cline, which started over a<br />
century ago. An investigation across the trunk revealed that three primary<br />
and several large secondary branches are missing; they broke off during<br />
storms and heavy winters or were cut by the local people. Around 1870, the<br />
tree was hit by lightning, it burst into flames and a part of the canopy broke off;<br />
a large vertical mark along the biggest primary branch testifies to this event.<br />
According to local sources, over the first half of the 20 th century the canopy<br />
was still twice larger than it is today and it was also significantly taller.<br />
148<br />
Figure 2. View of the oak of Cajvana taken from the east,<br />
showing its trunk and branches at the end of autumn.<br />
Consequently, we estimate that the overall wood volume of the Cajvana<br />
oak was once around 140 m 3 ; this value is close to the volume of the oak of<br />
Ivenack, Germany, which is consi<strong>de</strong>red to be the largest in Europe [1, 3].<br />
According to the above values, the tree of Cajvana is one of the biggest<br />
European oaks and the largest pedunculate oak in south-eastern Europe.
AMS RADIOCARBON DATING OF THE VERY LARGE PEDUNCULATE OAK OF CAJVANA<br />
Figure 3. The image taken from the west shows the trunk<br />
and the two remaining primary branches of the Cajvana oak.<br />
As of today, the percentage of <strong>de</strong>ad and dry branches in the remaining<br />
canopy is of over 15 %. The county road, located at only 10 m distance from<br />
the oak, is getting the busier and busier; the upgrading of the road around<br />
1985 required cutting a large root. In addition, no speed limit is enforced and<br />
no weight limit is imposed on truck trailers in the proximity of the old tree. All<br />
these factors likely sped up the <strong>de</strong>cline of the oak.<br />
The trunk has a large bell-shaped cavity, which extends vertically up<br />
to the second largest branch, reaching the height of 3.81 m. The cavity base at<br />
ground level is quasi-ellipsoidal, with the length of the two axis of 2.24 and<br />
1.82 m. Somewhat surprisingly, the big cavity has a small opening/ entrance<br />
toward east, with a width of only 0.23 m and a height of 0.50 m; however,<br />
these dimensions of the entrance are sufficient for allowing a skinny person<br />
to access the insi<strong>de</strong> of the cavity (Figure 4) wood at the surface of the cavity<br />
walls is partially rotten, showing that the cavitation process is still in progress.<br />
149
ADRIAN PATRUT, KARL F. VON REDEN, VASILE SAVU, DANIEL A. LOWY, RALUCA MITEA, IOANA BARBUL<br />
150<br />
Figure 4. The image shows the trunk of the Cajvana oak,<br />
with the small entrance to the cavity<br />
Three small wood samples collected from the cavity were pretreated<br />
and investigated by AMS radiocarbon analysis.<br />
AMS results and calibrated ages<br />
Fraction mo<strong>de</strong>rn values and radiocarbon dates of the three samples<br />
are presented in Table 1. Radiocarbon dates and errors were roun<strong>de</strong>d to the<br />
nearest year. Calibrated (cal) ages, which were <strong>de</strong>rived directly from fraction<br />
mo<strong>de</strong>rn values, are also listed in Table 1. The 1-σ probability distribution was<br />
selected to calculate calibrated age ranges. For sample 2, the 1-σ distribution<br />
corresponds only to one range. For sample 1 and 3, the 1-σ distribution
AMS RADIOCARBON DATING OF THE VERY LARGE PEDUNCULATE OAK OF CAJVANA<br />
corresponds to several ranges of calendar years. In this case, the confi<strong>de</strong>nce<br />
interval of one range (marked in bold) is much greater than of the others;<br />
therefore, it was selected as the most probable cal AD range of the respective<br />
sample, for the purpose of this discussion.<br />
For obtaining single calendar age values of samples, we <strong>de</strong>rived a mean<br />
calendar age of each sample from the 1-σ range with the highest probability.<br />
Calendar ages of samples represent the difference between AD 2010 and the<br />
mean value of the selected 1-σ range, with the corresponding error. Calendar<br />
ages of samples and errors were roun<strong>de</strong>d to the nearest 5 years.<br />
Sample<br />
co<strong>de</strong><br />
1<br />
Table 1. AMS dating results and calibrated calendar ages<br />
Height 1<br />
[m]<br />
Diametre 2<br />
[m]<br />
Fraction<br />
mo<strong>de</strong>rn<br />
[error]<br />
1.20 3.30 0.9621<br />
[± 0.0033]<br />
2 0.90 3.58 0.9125<br />
[± 0.0029]<br />
3 0.30 3.68 0.9822<br />
[± 0.0030]<br />
1 Height of sample above ground level.<br />
2 Diametre of the trunk at sampling height.<br />
Dating results of samples<br />
Radiocarbon<br />
date<br />
[error]<br />
( 14 C yr BP)<br />
Cal AD range(s)<br />
1-σ<br />
[confi<strong>de</strong>nce interval]<br />
Sample age<br />
[error]<br />
(cal yr)<br />
310 [± 26] 1521-1577 [45.8%] 460 [± 30]<br />
1582-1591 [6.1%]<br />
1621-1642 [16.3%]<br />
736 [± 23] 1263-1284 [68.2%] 735 [± 10]<br />
144 [± 24] 1678-1696 [10.3%]<br />
1726-1765 [22.2%]<br />
1772-1776 [2.0%]<br />
1800-1814 [8.1%]<br />
1837-1844 [2.9%]<br />
1852-1876 [9.2%]<br />
1918-1940 [13.7%]<br />
265 [± 25]<br />
The three samples were collected from the cavity at different heights<br />
above ground, according to the cavity shape and to the profile of walls.<br />
Even if the trunk is quasi-cylindrical from ground level up to breast height,<br />
there are some diametre differences, according to height and direction. The<br />
maximum and minimum diametre values at 1 m above ground are of 3.78<br />
and 3.22 m. The diametre at sampling height was consi<strong>de</strong>red to be the<br />
diametre of the trunk which passes by the geometric/symmetry centre of<br />
the trunk at this height and the sampling point. The sample heights and the<br />
diametres at sampling height are shown in Table 1. The cross-section of the<br />
trunk at 1 m above ground, showing also the inner cavity and the sampling<br />
positions is displayed in Figure 5.<br />
151
ADRIAN PATRUT, KARL F. VON REDEN, VASILE SAVU, DANIEL A. LOWY, RALUCA MITEA, IOANA BARBUL<br />
The black bark has a thickness of 4-10 cm, with a mean value of ca.<br />
6 cm. We used this value for calculating the three trunk diametres insi<strong>de</strong> bark<br />
at sampling height, which are 3.18, 3.46 and 3.56 m. Mention should be ma<strong>de</strong><br />
that the dated segment of each sample originates from a distance of 3 cm<br />
(for sample 1 and 2) and 5 cm (for sample 3) insi<strong>de</strong> wood from the sampling<br />
point.<br />
Figure 5. Schematic cross-section of the Cajvana oak’s trunk (at 1 m above ground;<br />
bark inclu<strong>de</strong>d), showing the inner cavity, the positions of the sampling points (labeled 1,<br />
2 and 3) and the geometric/ symmetry centre of the trunk (noticed by C). As a reference,<br />
the entrance to the cavity is also shown, even if it has a height of only 0.50 m.<br />
The radiocarbon dates of the three samples were found to be of 310 ± 26,<br />
736 ± 23 and 144 ± 24 BP (radiocarbon years before present, i.e. before AD 1950).<br />
These values correspond to calibrated calendar ages of 460 ± 30, 735 ± 10<br />
and 265 ± 25 years.<br />
152<br />
Growth rates<br />
For each sample, we calculated the distances from the dated segment<br />
to the bark and to the geometric centre of the trunk, respectively. For calculating<br />
and comparing growth rate values of the trunk, measured by the increase in<br />
radius, we converted all these values for a mean diametre of the trunk at<br />
breast height dbh = 3.50 m, which corresponds to a dbh value insi<strong>de</strong> bark<br />
of 3.38 m and to a radius insi<strong>de</strong> bark of 1.69 m.<br />
In this case, the distances from the dated segments of the three<br />
samples to the bark are of 0.68, 1.30 and 0.32 m, while the distances to the<br />
geometric centre are 1.01, 0.39 and 1.37 m. By consi<strong>de</strong>ring also the ages<br />
of the three samples, one can state that the radial increase of the trunk of<br />
Cajvana oak was of 0.32 m over the past ca. 265 years, 0.68 m over the<br />
past ca. 460 years and 1.30 m over the past ca. 735 years.
AMS RADIOCARBON DATING OF THE VERY LARGE PEDUNCULATE OAK OF CAJVANA<br />
Age of the tree<br />
For <strong>de</strong>termining the age of the investigated oak one should extrapolate<br />
the age of the ol<strong>de</strong>st sample, i.e. sample 2, to the geometric centre of the trunk<br />
at the respective height. As mentioned above, the converted distance from the<br />
dated segment of sample 2 to the geometric centre is 0.39 m. Therefore, for<br />
calculating the age of the tree, one should add to the age of sample 2 (735 ±<br />
10 years) the time nee<strong>de</strong>d by the trunk for growing from 0 to a radius of 0.39 m,<br />
i.e. a diametre dbh = 0.78 m.<br />
Since it started growing, the oak of Cajvana has probably been a solitary<br />
tree, without competition in its close proximity. According to research done in<br />
Europe at comparable latitu<strong>de</strong>s on solitary pedunculate oaks, growing in open<br />
conditions [9] and also to our research in Romania done on several stumps of<br />
isolated oaks and on live oaks of known age, we estimate that the time nee<strong>de</strong>d<br />
to the oak of Cajvana to reach a dbh of 0.78 m was 75 ± 15 years. One can also<br />
add a maximum additional error of ± 50 years, due to assigning the geometric<br />
centre of the trunk to the pith. Consequently, the final age value for the oak of<br />
Cajvana becomes 810 ± 75 years. One can state that the tree started growing<br />
around AD 1200, more precisely in the time frame 1125 – 1275.<br />
Therefore, the dating results do not exclu<strong>de</strong> the claim of the area’s<br />
resi<strong>de</strong>nts that the oak was planted in 1241, for marking the cruel Tartar invasion.<br />
On the other hand, the obtained dating results suggests that the oak of Cajvana<br />
could be even ol<strong>de</strong>r than this historic date.<br />
CONCLUSIONS<br />
Using our new approach of dating live angiosperm trees, three samples<br />
were collected from the cavity of the large pedunculate oak of Cajvana, Romania,<br />
and investigated by AMS radiocarbon dating. According to the age of the ol<strong>de</strong>st<br />
dated sample, i.e. 735 ± 10 years, the tree of Cajvana becomes one of the<br />
ol<strong>de</strong>st pedunculate oaks with accurate dating results. By consi<strong>de</strong>ring the<br />
position of the ol<strong>de</strong>st sample in the trunk, the calculated tree age is 810 ± 75<br />
years. This value is practically similar to that we <strong>de</strong>termined for the historic<br />
pedunculate oak of Ţebea, which died in 2005 [7]. The obtained results confirm<br />
that Romanian oaks can live to ages exceeding 800 years.<br />
Given that the majority of old oaks <strong>de</strong>velop open hollows in their trunks<br />
[10], this approach can be used on the large scale for getting accurate age<br />
estimates of big live specimens.<br />
EXPERIMENTAL SECTION<br />
Measurements. The external measurements of the tree and the<br />
measurements insi<strong>de</strong> the cavity were performed by using a Bosch DLE 70<br />
Professional laser rangefin<strong>de</strong>r and graduated tapes.<br />
153
ADRIAN PATRUT, KARL F. VON REDEN, VASILE SAVU, DANIEL A. LOWY, RALUCA MITEA, IOANA BARBUL<br />
Sample preparation. The standard acid-base-acid pretreatment method<br />
[11] was used to remove soluble and mobile organic components. The resulted<br />
cellulose samples were combusted to CO2, by using the closed tube combustion<br />
method [12]. Then, CO2 was reduced to graphite on iron catalyst, un<strong>de</strong>r hydrogen<br />
atmosphere [13]. Eventually, the graphite samples were analyzed by AMS.<br />
AMS measurements. Radiocarbon measurements were carried out at<br />
the National Ocean Sciences AMS Facility of the Woods Hole Oceanographic<br />
Institution, with the Pelletron ® Tan<strong>de</strong>m 500 kV AMS. The surface of the<br />
graphite samples was sputtered with cesium ions and the secondary negative<br />
ions were extracted and accelerated in the AMS system. 12 C and 13 C ions<br />
were measured in Faraday cups, where a ratio of their currents was recor<strong>de</strong>d.<br />
Simultaneously, 14 C ions were recor<strong>de</strong>d in a solid state <strong>de</strong>tector, so that<br />
instantaneous ratios of 14 C to 12 C were also recor<strong>de</strong>d. The raw signals were<br />
compared to ratios obtained with a known standard material (Oxalic Acid I,<br />
NIST-SRM-4990) and converted to a fraction mo<strong>de</strong>rn value. Fraction mo<strong>de</strong>rn<br />
values, corrected for isotopic fractionation with the normalized δ 13 C value of<br />
-25 0 /00, were converted to radiocarbon dates, expressed in years BP [14 ].<br />
Calibration. Fraction mo<strong>de</strong>rn values were calibrated and converted into<br />
calendar ages with the OxCal v4.1.5 for Windows [15], by using the IntCal09<br />
atmospheric data set [16].<br />
ACKNOWLEDGEMENTS<br />
This research was <strong>full</strong>y fun<strong>de</strong>d by CNCSIS-UEFISCDI un<strong>de</strong>r grant PN II – IDEI<br />
2354, Nr. 1092. AMS radiocarbon dating at the NOSAMS Facility is supported by<br />
the U.S. National Science Foundation un<strong>de</strong>r Cooperative Agreement OCE-0753487.<br />
We would like to thank Gheorghe Piţu for offering interesting information about the<br />
history of the city of Cajvana and its historic oak.<br />
154<br />
REFERENCES<br />
1. J. Pater, “Monumentale bomen in Europa”, Lannoo, 2006.<br />
2. A. le Hardÿ <strong>de</strong> Beaulieu, T. Lamant, “Le gui<strong>de</strong> illustré <strong>de</strong>s chênes”, Vol. 1-2, Huitième,<br />
Paris, 2007.<br />
3. Ullrich, U. Kühn, S. Kühn, “Unsere 500 ältesten Bäume“, BLV, München, 2009.<br />
4. S. Kühn, B. Ullrich, U. Kühn, “Deutschlands alte Bäume“, BLV, München, 2007.<br />
5. A. Patrut, K.F. von Re<strong>de</strong>n, D.A. Lowy, A.H. Alberts, J.W. Pohlman, R. Wittmann,<br />
D. Gerlach, L. Xu, C.S. Mitchell, Tree Physiol., 2007, 27, 1569.<br />
6. A. Patrut, K.F. von Re<strong>de</strong>n, D.A. Lowy, D.H. Mayne, K.E. El<strong>de</strong>r, M.L. Roberts,<br />
A.P. McNichol, Nuclear Instr. and Meth. B, 2010, 268, 910.<br />
7. A. Patrut, K.F. von Re<strong>de</strong>n, D.A. Lowy, S. Pasca, L. Kekedy-Nagy, I. Sovago,<br />
Studia UBB Chemia, 2010, 55, 113.
AMS RADIOCARBON DATING OF THE VERY LARGE PEDUNCULATE OAK OF CAJVANA<br />
8. A. Patrut, K.F.von Re<strong>de</strong>n, D.H. Mayne, D.A. Lowy, R. Van Pelt, A.P. McNichol,<br />
M.L. Roberts, D. Margineanu, Radiocarbon, 2010, 52, 717.<br />
9. E. Uhl, H-G. Metzger, T. Seifert, 18 Jahrestagung DVFFA, 2006, 46.<br />
10. T. Ranius, M. Niklasson, N. Berg, For. Ecol. Manage., 2009, 257, 303.<br />
11. I.U. Olsson, in B. Berglund (ed.), “Handbook of Holocene palaeoecolgy and<br />
palaeohydrology”, Wiley, Chichester, 1986, p. 273.<br />
12. Z. Sofer, Anal. Chem., 1980, 52, 1389.<br />
13. J.S. Vogel, J.R. Southon, D.E. Nelson, T.A. Brown, Nuclear Instr. and Meth. B,<br />
1984, 5, 289.<br />
14. A. Patrut, K. von Re<strong>de</strong>n, D.A. Lowy, P. Lin<strong>de</strong>que, A.H. Alberts, R. Wittmann, E.<br />
Forizs, D. Margineanu, J. Pohlman, L. Xu, D. Gerlach, C.S. Mitchell, Studia UBB<br />
Chemia, 2006, 51, 71.<br />
15. C. Bronk Ramsey, OxCal Program, v4.1.5, 2010, http://www.rlaha.ox.ac.uk/oxcal/<br />
oxcal.html.<br />
16. P.J. Reimer, M.G.L. Baillie, E. Bard, A. Bayliss, J.W. Beck, P.G. Blackwell, C.<br />
Bronk Ramsey, C.E. Buck, G.S. Burr, R.L. Edwards, M. Friedrich, P.M. Grootes,<br />
T.P. Guil<strong>de</strong>rson, I. Hajdas, T.J. Heaton, A.G. Hogg, K.A. Hughen, K.F. Kaiser,<br />
B. Kromer, F.G. McCormac, S.W. Manning, R.W. Reimer, D.A. Richards, J.R.<br />
Southon, S. Talamo, C.S.M. Turney, J. van <strong>de</strong>r Plicht, C.E. Weyhenmeyer,<br />
Radiocarbon, 2009, 51, 1111.<br />
155
STUDIA UBB CHEMIA, LVI, 1, 2011<br />
DEPENDENCE BETWEEN DETERMINATION COEFFICIENT<br />
AND NUMBER OF REGRESSORS: A CASE STUDY ON<br />
RETENTION TIMES OF MYCOTOXINS<br />
SORANA D. BOBLOACĂ a,∗ , LORENTZ JÄNTSCHI b,c ,<br />
RADU E. SESTRAŞ c, *<br />
ABSTRACT. In the present work, a <strong>de</strong>pen<strong>de</strong>nce analysis of the <strong>de</strong>termination<br />
coefficient and the number of regressors was carried out on a set of 65<br />
mycotoxins. The simple and multiple regression techniques were used to<br />
i<strong>de</strong>ntify the linear relationship between retention times and molecular<br />
<strong>de</strong>scriptors calculated with HyperChem from the optimized 3D structures.<br />
The highest number of regressors to be used in investigating the retention<br />
times as function of mycotoxins investigated properties must be equal to 5.<br />
As far as the <strong>de</strong>pen<strong>de</strong>nce between number of regressors and <strong>de</strong>termination<br />
coefficient was concerned, the analysis revealed that the best relationship<br />
is linear if the cutoff is set at 4 or 5 regressors while exponential for more than<br />
5 regressors. The results must be verified on other classes of compounds<br />
and other <strong>de</strong>pen<strong>de</strong>nt or in<strong>de</strong>pen<strong>de</strong>nt variables in or<strong>de</strong>r to be extrapolated.<br />
Keywords: mycotoxins; retention time; regression analysis.<br />
INTRODUCTION<br />
Mycotoxin, a secondary metabolite produced by a fungus [1,2], is<br />
produced according to the intrinsic and extrinsic environmental conditions [3,4].<br />
Aflatoxins, discovered in later 1950’s and early 1960’s [5], produced by species of<br />
Aspergillus (Aspergillus flavus, Aspergillus parasiticus), are known to act at the<br />
DNA level (e.g. gene point mutations, <strong>de</strong>letions and insertions, recombination,<br />
rearrangements and amplifications) as carcinogenetic substances [6,7].<br />
Trichothecenes, produced by species as Fusarium, Myrothecium, Tricho<strong>de</strong>rma,<br />
Trichothecium, Cephalosporium, Verticimonosporium, and Stachybotrys, proved<br />
to be <strong>de</strong>trimental to the neurological system [8,9]. Roquefortin, produced by<br />
fungi from Penicillium genus [10,11], proved to be toxic for animals [12,13].<br />
Ochratoxin, mycotoxins produced by some Aspergillus (e.g. Aspergillus<br />
a<br />
„Iuliu Haţieganu” University of Medicine and Pharmacy Cluj-Napoca, 13 Emil Isac, RO-400023<br />
Cluj-Napoca, sbolboaca@umfcluj.ro<br />
b<br />
Technical University of Cluj-Napoca, 28 Memorandumului, RO-400114 Cluj-Napoca, Romania,<br />
lori@aca<strong>de</strong>micdirect.org<br />
c<br />
University of Agricultural Sciences and Veterinary Medicine Cluj-Napoca, 3-5 Mănăştur Street,<br />
RO-400372 Cluj-Napoca, rsentras@usamvcluj.ro
158<br />
SORANA D. BOBLOACĂ, LORENTZ JÄNTSCHI, RADU E. SESTRAŞ<br />
ochraceus) and Penicillium species (e.g. Penicillium viridicatum) is accumulated<br />
in the meat of animals and is known to be a human carcinogen [14,15,16].<br />
Thus, mycotoxins proved to have important effects on animal and human<br />
health [17,18,19,20]. Moreover, a series of researches have been conducted<br />
to assess the cost and efficacy of public health interventions carried out in<br />
or<strong>de</strong>r to reduce the mycotoxin-induce human diseases [21,22,23].<br />
The present research was aimed to obtain the <strong>de</strong>pen<strong>de</strong>nce of<br />
<strong>de</strong>termination coefficient of retention times as function of the number of<br />
in<strong>de</strong>pen<strong>de</strong>nt variables, as properties obtained from the structure of a sample<br />
of mycotoxin. Starting with these results, the best <strong>de</strong>pen<strong>de</strong>nce between<br />
<strong>de</strong>termination coefficients and the number of regressors was investigated.<br />
RESULTS AND DISUSSIONS<br />
The search of the maximum <strong>de</strong>termination between retention times<br />
and some properties of the studied mycotoxins revealed the following:<br />
The distribution of the steps where an increase in <strong>de</strong>termination<br />
coefficient value was observed, is: 5 (1 in<strong>de</strong>pen<strong>de</strong>nt variable) - 3 (2 in<strong>de</strong>pen<strong>de</strong>nt<br />
variables) - 7 (3 in<strong>de</strong>pen<strong>de</strong>nt variables) - 4 (4 in<strong>de</strong>pen<strong>de</strong>nt variables) - 10<br />
(5 in<strong>de</strong>pen<strong>de</strong>nt variables) - 5 (6 in<strong>de</strong>pen<strong>de</strong>nt variables) - 3 (7 in<strong>de</strong>pen<strong>de</strong>nt<br />
variables) - 2 (8 in<strong>de</strong>pen<strong>de</strong>nt variables) - 6 (9 in<strong>de</strong>pen<strong>de</strong>nt variables) - 9 (10<br />
in<strong>de</strong>pen<strong>de</strong>nt variables).<br />
The <strong>de</strong>scending classification of the range (<strong>de</strong>fined as the difference<br />
between maximum and minimum value) of the <strong>de</strong>termination coefficient<br />
according to the same number of in<strong>de</strong>pen<strong>de</strong>nt variable was as follow: ▪ 0.3909<br />
(1 variable); ▪ 0.0977 (5 variables); ▪ 0.0647 (2 variables); ▪ 0.0605 (3 variables);<br />
▪ 0.0517 (4 variables); ▪ 0.0239 (6 variables); ▪ 0.0132 (9 variables); ▪ 0.0108<br />
(8 variables); ▪ 0.0102 (7 variables); and ▪ 0.0083 (10 variables). Note that<br />
all mo<strong>de</strong>ls were statistically significant at a significance level of 5%.<br />
The summary of the results obtained in the best regression when the<br />
<strong>de</strong>pen<strong>de</strong>nce between retention times and properties of the studied mycotoxins<br />
was investigated is presented in Table 1.<br />
The matrix of properties used as in<strong>de</strong>pen<strong>de</strong>nt variables in the<br />
regressions mo<strong>de</strong>ls when the highest value of the <strong>de</strong>termination coefficient<br />
was obtained is shown in Table 2.<br />
The <strong>de</strong>pen<strong>de</strong>nce between the number of regressors (in<strong>de</strong>pen<strong>de</strong>nt<br />
variables) and <strong>de</strong>termination coefficient was as follows:<br />
Case x ≤ 4, linear (Figure 1): ŷ = 6.797·10 -2 *x + 0.3270<br />
(r 2 = 0.9991, r 2 adjusted = 0.9987; F = 2299) Eq(1)<br />
where x = number of in<strong>de</strong>pen<strong>de</strong>nt variables; ŷ = estimated <strong>de</strong>termination<br />
coefficient.
DEPENDENCE BETWEEN DETERMINATION COEFFICIENT AND NUMBER OF REGRESSORS<br />
Case 4 < x ≤ 10, exponential (Figure 2): ŷ = 0.8173 - 0.7972*exp(-x/2.6772)<br />
(r 2 = 0.9998; r 2 adjusted = 0.99965; F = 7044) Eq(2)<br />
Table 1. Summary of linear regressions: mycotoxins dataset<br />
x<br />
x r 2 t p<br />
1 0.3935 6.39 1.13·10 -8<br />
2 0.4635 7.32 3.02·10 -10<br />
3 0.5343 8.37 5.17·10 -12<br />
4 0.5964 9.42 9.88·10 -14<br />
5 0.6943 11.58 4.04·10 -17<br />
6 0.7318 12.58 1.61·10 -18<br />
7 0.7599 13.43 1.32·10 -19<br />
8 0.7766 13.95 3.57·10 -20<br />
9 0.7898 14.38 1.41·10 -20<br />
10 0.7982 14.61 1.03·10 -20<br />
x = number of in<strong>de</strong>pen<strong>de</strong>nt variable; r 2 = <strong>de</strong>termination coefficient;<br />
t = t-value associated to r 2 ; p = p-value associated to t-value<br />
Table 2. Matrix of mycotoxins properties used in the mo<strong>de</strong>ls<br />
with highest <strong>de</strong>termination coefficients<br />
LogP<br />
InvHydE<br />
LnPol<br />
LnRefr<br />
Vol<br />
SAG<br />
LnMW<br />
negte<br />
dm<br />
negsae<br />
sce<br />
Invnegte<br />
Invnegsae<br />
Invnegsbe<br />
Lnnegsae<br />
Lnnegsbe<br />
Lnsce<br />
Lnnegsee<br />
1 0 0 1 0 0 0 0 0 0 0 0 0 0 0 0 0 0 0 1<br />
2 0 0 1 0 1 0 0 0 0 0 0 0 0 0 0 0 0 0 2<br />
3 0 0 0 0 0 0 1 0 0 0 1 0 1 0 0 0 0 0 3<br />
4 0 1 1 0 1 1 0 0 0 0 0 0 0 0 0 0 0 0 4<br />
5 0 1 1 0 1 0 0 1 0 0 0 0 0 0 0 0 0 1 5<br />
6 0 1 1 0 1 0 0 0 0 1 0 0 0 0 0 1 1 0 6<br />
7 0 1 1 0 1 0 0 0 1 1 0 0 0 0 0 1 1 0 7<br />
8 1 1 1 0 1 0 0 1 1 0 0 0 0 1 0 0 1 0 8<br />
9 1 1 1 1 1 0 0 1 1 0 0 0 0 1 0 0 1 0 9<br />
10 1 1 1 1 1 0 0 0 1 0 0 1 0 0 1 1 0 1 10<br />
Total 3 7 9 2 8 1 1 3 4 2 1 1 1 2 1 3 4 2 55<br />
LogP = octanol-water partition coefficient (log scale);<br />
HydE = hydration energy; Pol = polarizability; Refr = refractivity;<br />
Vol = volume; SAG = surface area grid; MW = molecular weight;<br />
te = total-energy; dm = dipole moment; sae = scf-atom-energy;<br />
sce = scf-core-energy; sbe = scf-binding-energy;<br />
see = scf-electronic-energy; ln = natural logarithm; inv = inverse value<br />
Total<br />
159
160<br />
SORANA D. BOBLOACĂ, LORENTZ JÄNTSCHI, RADU E. SESTRAŞ<br />
The regression between retention times and five mycotoxin properties<br />
also provi<strong>de</strong>d a linear <strong>de</strong>pen<strong>de</strong>nce between <strong>de</strong>termination coefficient and the<br />
number of regressors but the performance of the mo<strong>de</strong>l <strong>de</strong>creased with 0.005<br />
in terms of <strong>de</strong>termination coefficient of the overall mo<strong>de</strong>l:<br />
r 2 = 0.9941, r 2 adjusted = 0.9921; F = 504 Eq(3)<br />
The correlation between <strong>de</strong>termination coefficients and the number of<br />
regressors, presented in terms of correlation coefficient, t-value associated<br />
to correlation coefficient and its p-value, are shown in Table 3.<br />
Determination coefficient<br />
0.7<br />
0.6<br />
0.5<br />
0.4<br />
0.3<br />
0.2<br />
0.1<br />
0<br />
0 1 2 3 4 5<br />
No. in<strong>de</strong>pen<strong>de</strong>nt variables<br />
Figure 1. The <strong>de</strong>pen<strong>de</strong>nce between r 2 and the number of<br />
in<strong>de</strong>pen<strong>de</strong>nt variables for 1 ≤ x ≤ 4<br />
r^2<br />
0.82<br />
0.80<br />
0.78<br />
0.76<br />
0.74<br />
0.72<br />
0.70<br />
0.68<br />
4 5 6 7 8 9 10 11<br />
No in<strong>de</strong>pen<strong>de</strong>nt variables<br />
Figure 2. The <strong>de</strong>pen<strong>de</strong>nce between r 2 and the number of<br />
in<strong>de</strong>pen<strong>de</strong>nt variables for 4 < x ≤ 10
DEPENDENCE BETWEEN DETERMINATION COEFFICIENT AND NUMBER OF REGRESSORS<br />
Table 3. Summary of linear relation between <strong>de</strong>termination coefficient<br />
and the number of in<strong>de</strong>pen<strong>de</strong>nt variables<br />
x r t-value p-value<br />
3 > 0.9999 282.72 1.13·10 -3<br />
4 0.9996 47.95 2.17·10 -4<br />
5 0.9970 22.45 9.68·10 -5<br />
6 0.9964 23.54 9.66·10 -6<br />
7 0.9907 16.31 7.90·10 -6<br />
8 0.9808 12.31 8.75·10 -6<br />
9 0.9690 10.38 8.37·10 -6<br />
10 0.9557 9.19 7.96·10 -6<br />
x = number of regressors; r = correlation coefficient;<br />
t-value = Stu<strong>de</strong>nt statistics associated to r;<br />
p-value = significance associated to Stu<strong>de</strong>nt statistics<br />
The present study was aimed to answer to the following questions:<br />
“How many regressors (in<strong>de</strong>pen<strong>de</strong>nt variables) are nee<strong>de</strong>d to obtain a certain<br />
<strong>de</strong>termination of retention times as a function of mycotoxins properties?”<br />
and “Which is the type of relation between the <strong>de</strong>termination coefficient and<br />
the number of regressors able to estimate the mycotoxins retention times?”.<br />
The answers are as follows.<br />
All linear regression mo<strong>de</strong>ls, able to explain the retention times as<br />
function of investigated mycotoxins properties, where selected such as to<br />
accomplish the Hawkins principles [24]: highest correlation coefficient, highest<br />
Fisher parameter, lowest standard error of the estimate, and smallest possible<br />
number of significant parameters (n = 5·v, where n = sample size, v = number<br />
of variables in the mo<strong>de</strong>l).<br />
As expected, the highest <strong>de</strong>termination coefficient was obtained by a<br />
linear regression mo<strong>de</strong>l with 10 in<strong>de</strong>pen<strong>de</strong>nt variables. The number of acceptable<br />
mo<strong>de</strong>ls, i<strong>de</strong>ntified for a given number of in<strong>de</strong>pen<strong>de</strong>nt variables, varied, for the<br />
studied mycotoxins, from 2 to 9 (e.g., for v=8; 2 mo<strong>de</strong>ls while for v=10; 9 mo<strong>de</strong>ls).<br />
Naturally, the number of regressions increases with the number of in<strong>de</strong>pen<strong>de</strong>nt<br />
variables as well as the possible combinations of variables; in the present<br />
experiment, we limited the investigation at 10 in<strong>de</strong>pen<strong>de</strong>nt variables. Within<br />
such limits, no linear <strong>de</strong>pen<strong>de</strong>nce between the number of in<strong>de</strong>pen<strong>de</strong>nt variables<br />
and the number of significant mo<strong>de</strong>ls could be i<strong>de</strong>ntified on linking the retention<br />
times with mycotoxin selected properties.<br />
The results are as follows:<br />
The most important increase in <strong>de</strong>termination coefficient is observed<br />
when one in<strong>de</strong>pen<strong>de</strong>nt variable is used, followed by the case when 5 and<br />
respectively 2 in<strong>de</strong>pen<strong>de</strong>nt variables were used.<br />
161
162<br />
SORANA D. BOBLOACĂ, LORENTZ JÄNTSCHI, RADU E. SESTRAŞ<br />
The highest difference is observed when the best 4-regressors<br />
mo<strong>de</strong>l was compared to the best 5-regressors mo<strong>de</strong>l. The observed difference<br />
in <strong>de</strong>termination coefficient was of 0.0978. This observation suggest that the<br />
highest number of regressors to be used in investigation of the retention times<br />
as function of mycotoxin properties must not exceed 5. The use of more<br />
than 6 regressors is useless and will not bring a significant increasing of the<br />
<strong>de</strong>termination coefficient in explaining the retention times as function of<br />
mycotoxin properties.<br />
The most frequent mycotoxin property able to explain the retention<br />
times proved to be the polarizability (it appears in all mo<strong>de</strong>ls with one exception,<br />
the mo<strong>de</strong>l with 3 in<strong>de</strong>pen<strong>de</strong>nt variables), closely followed by the molecular<br />
volume (it appears in all mo<strong>de</strong>ls with two exceptions, the mo<strong>de</strong>l with one<br />
in<strong>de</strong>pen<strong>de</strong>nt variable and the mo<strong>de</strong>l with three in<strong>de</strong>pen<strong>de</strong>nt variables) and<br />
the inverse of hydration energy (it appears in all mo<strong>de</strong>l with more than three<br />
variables) (Table 2).<br />
The relationship between retention times and structural properties<br />
of mycotoxins has previously been studied. A set of 15 toxins with the<br />
trichothecene nucleus was investigated by applying a ComMFA (r 2 = 0.921) [25].<br />
Khosrokhavar et al. [26] had i<strong>de</strong>ntified, on a set of 67 mycotoxins, a multiple<br />
linear regression mo<strong>de</strong>l with a <strong>de</strong>termination of 0.931 that inclu<strong>de</strong>d the following<br />
<strong>de</strong>scriptors: the octanol/water partition coefficient, electronic energy, dipole<br />
length, and the LUMO energy. It is no doubt that the mo<strong>de</strong>ls reported in literature<br />
are better than mo<strong>de</strong>ls presented in this paper, in terms of <strong>de</strong>termination<br />
coefficient. However, the i<strong>de</strong>ntification of the linear relationship between the<br />
retention times and the investigated properties was performed in or<strong>de</strong>r to<br />
answer to the research questions.<br />
As far as <strong>de</strong>pen<strong>de</strong>nce between the number of regressors and<br />
<strong>de</strong>termination coefficient was concerned, the performed analysis revealed<br />
the following:<br />
The i<strong>de</strong>ntified linear mo<strong>de</strong>l (presented in Eq(1)) as well as the<br />
exponential mo<strong>de</strong>l (presented in Eq(2)) proved to be statistically significant<br />
(F > 2200).<br />
The linear relationship was i<strong>de</strong>ntified if the applied cutoff was set at<br />
4 regressors. For this regression, 99.91% of the variation of <strong>de</strong>termination<br />
coefficient proved to be explained by a linear relationship with the number of<br />
regressors (Eq(1)). The cutoff set to 5 regressors also led to a statistically<br />
significant linear regression between the number of regressors and <strong>de</strong>termination<br />
coefficient. In this case, 99.41% of variation in <strong>de</strong>termination coefficient could<br />
be explained (Eq(3)). Although the mo<strong>de</strong>ls presented in Eq(1) and Eq(3) are<br />
statistically significant, the F-statistics is almost 5 times smaller if the cutoff<br />
is set at 5 regressors compared to a cutoff set at 4 <strong>de</strong>scriptors.
DEPENDENCE BETWEEN DETERMINATION COEFFICIENT AND NUMBER OF REGRESSORS<br />
The best relationship between the <strong>de</strong>termination coefficient and<br />
regressors proved to be of exponential type. Almost 100% from variation of<br />
<strong>de</strong>termination coefficient could be explained, with a number of regressors<br />
between 4 < x ≤ 10 (Eq(2)).<br />
As far as the results presented in Table 3 are concerned, the minimum<br />
value of the significance was obtained for 1 ≤ x ≤ 7 (p = 7.90·10 -6 ). This means<br />
that the maximum number of regressors able to explain the relationship between<br />
retention times and investigated mycotoxin properties must not exceed 7.<br />
The present study was aimed to provi<strong>de</strong> answers to two main research<br />
questions: “How many regressors (in<strong>de</strong>pen<strong>de</strong>nt variables) are nee<strong>de</strong>d to<br />
obtain a certain <strong>de</strong>termination of retention times as a function of mycotoxin<br />
properties?” and “Which is the type of relation between the <strong>de</strong>termination<br />
coefficient and the number of regressors in case of linear regressions?”.<br />
Valid answers were i<strong>de</strong>ntified and the aim of the research was reached.<br />
However, a new questions arise: “Is the cutoff maintained as far as the number<br />
of regressors is concerned <strong>de</strong>pen<strong>de</strong>nt by the sample size?”, “The exponential<br />
relationship between the <strong>de</strong>termination coefficient and the number of<br />
regressors is valid only for the investigated set of structures or it is obeyed<br />
to any sets of compounds?” Current research in our laboratory is aimed to<br />
answer to these new questions.<br />
CONCLUSIONS<br />
In the present study, the <strong>de</strong>pen<strong>de</strong>nce of maximum value of <strong>de</strong>termination<br />
coefficient of the number of regressors, as well as the type of this relationship<br />
were investigated on a set of 65 mycotoxin properties. The most frequent<br />
mycotoxin properties able to explain the retention times proved to be the<br />
polarizability, closely followed by the molecular volume and inverse of hydration<br />
energy. The highest number of regressors to be used in investigation of the<br />
retention times as function of mycotoxin properties nee<strong>de</strong>d do not exceed 5.<br />
As far as the <strong>de</strong>pen<strong>de</strong>nce between number of regressors and <strong>de</strong>termination<br />
coefficient was concerned linear, the cutoff was set at 4, or > 4 for an exponential<br />
<strong>de</strong>pen<strong>de</strong>nce. The obtained results must be verified on other classes of<br />
compounds and other <strong>de</strong>pen<strong>de</strong>nt or in<strong>de</strong>pen<strong>de</strong>nt variables in or<strong>de</strong>r to be<br />
extrapolated.<br />
EXPERIMENTAL SECTION<br />
A sample of 65 mycotoxins was inclu<strong>de</strong>d in the present study. The<br />
structures of the mycotoxins were downloa<strong>de</strong>d from PubChem. The name<br />
of the investigated mycotoxins and the PubChem compound i<strong>de</strong>ntifier (CID)<br />
is listed in Table 4.<br />
163
164<br />
SORANA D. BOBLOACĂ, LORENTZ JÄNTSCHI, RADU E. SESTRAŞ<br />
A home ma<strong>de</strong> *.php program was used to transform the *.sdf files in<br />
*.hin files. Another *.php program was used to prepare the structures for<br />
mo<strong>de</strong>ling. This program used the HyperChem, release 8, software to prepare<br />
the mycotoxins for mo<strong>de</strong>ling. A three-step protocol was implemented in this<br />
respect: ▪ obtain the 3D structure of mycotoxins (1 st step); <strong>de</strong>fine the molecular<br />
mechanics mo<strong>de</strong>l (AMBER) and optimize the molecular structure (AM1 method<br />
[27], Polak-Ribiere algorithm [28]) (2 nd step); ▪ minimize the energy (3 rd step).<br />
Table 4. Mycotoxins and treir retention times<br />
Compound CID<br />
tR<br />
(min) Compound CID tR(min)<br />
Aflatoxins and their precursors Roquefortines<br />
1 Aflatoxicol I 104744 12.45 1 Agroclavine-1 73484 17.00<br />
2 Aflatoxin B1 14403 11.50 2 Auranthine 130919 10.51<br />
3 Aflatoxin B2 2724360 10.33 3 Aurantiamine 375594 10.49<br />
4 Aflatoxin B2 α 23648 6.60 4 Chanoclavine-I 5281381 8.59<br />
5 Aflatoxin G1 14421 10.16 5 Costaclavine 160462 17.00<br />
6 Aflatoxin G2 2724362 8.97 6 Cyclopenin 73525 11.60<br />
7 Aflatoxin G2α 105095 5.00 7 Cyclopenol 101201 6.20<br />
8 Aflatoxin M1 23236 7.21 8 Cyclopeptin n.a. 12.05<br />
9 Austocystin A 115307 21.57 9 Dihydroergotamine 10531 18.60<br />
10 Averufin 131171 25.65 10 Elymoclavine 11051 5.34<br />
11 5-Methoxysterigmatocystin 5379210 18.02 11 Epoxyagroclavine-1 133945 10.00<br />
12 Demethyl-diacetylsterigmatocystin<br />
151544 17.70 12 Ergocristine 31116 25.10<br />
13 Methoxysterigmatocystin 5351257 15.03 13 Ergotamine 3251 19.60<br />
14 Sterigmatocystin 5280389 18.91 14 Fumigaclavine C 173878 21.40<br />
15 Norsolorinic acid 25102 31.08 15 Marcfortine A 433181 19.59<br />
16 Parasiticol 90905 10.73 16 Marcfortine B n.a. 17.39<br />
Trichothecenes 17 Meleagrin 6437857 18.90<br />
1 Nivalenol 31829 1.27 18 Oxaline 6438440 21.60<br />
2 Fusarenone X 31763 2.35 19 Pyroclavine 3083578 14.81<br />
3 Deoxynivalenol 430147 1.54 20 Roquefortine C 21608802 20.50<br />
4 3-Acetyl<strong>de</strong>oxynivalenol 104759 5.21 21 Roquefortine D n.a. 6.09<br />
5 15-O-Acetyl-4<strong>de</strong>oxynivalenol<br />
16218854 5.10 22 Rugulovasine A and B 115153 8.43<br />
6 Scirpentriol 73495 1.82 23 Secoclavine n.a. 20.40<br />
7 15-Acetoxyscirpenol 105023 7.40 24 α-Ergocryptin 134551 19.20<br />
8 Diacetoxyscirpenol 422111 11.28 Ochratoxins<br />
9 3α-Acetyldiacetoxyscirpenol 11969469 15.56 1 Ochratoxin α 107911 5.60<br />
10 Neosolaniol 72650 3.19 2 Ochratoxin B-methyl ester 609664 20.00<br />
11 HT-2 Toxin 73050 13.69 3 Ochratoxin B-ethyl ester 609665 19.41<br />
12 T-2 Toxin 44575871 17.06 4 Ochratoxin α-methyl ester n.a. 16.16<br />
13 Acetyl-T-2 toxin 3034766 21.12<br />
14 Tricho<strong>de</strong>rmin 20806 16.13<br />
15 Tricho<strong>de</strong>rmol 114680 9.69<br />
16 7-α-Hydroxytricho<strong>de</strong>rmol 127380 2.59<br />
17 Verrucarol 5660 2.89<br />
18 4,15-Diacetylverrucarol 6451372 14.15<br />
19 Trichothecin 260779 16.29<br />
20 Trichothecolone 107974 3.63<br />
21 Trichoverrol A 6440574 10.16<br />
n.a. = not available in PubChem<br />
(these mycotoxins were drawn with<br />
HyperChem v. 8.0).
DEPENDENCE BETWEEN DETERMINATION COEFFICIENT AND NUMBER OF REGRESSORS<br />
The following properties were evaluated by HyperChem to be the<br />
regressors for mo<strong>de</strong>ling the retention times (experimental values were taken<br />
from ref. [29]) of the investigated mycotoxins: negative value of the totalenergy<br />
(abbreviated as negte), dipole moment (dm), negative value of the<br />
scf-atom-energy (negsae), negative value of the scf-binding-energy (negsbe),<br />
scf-core-energy (sce), negative value of the scf-electronic-energy (negsee),<br />
heat-of-formation (hf), molecular weight (MW), surface area (SA), surface area<br />
grid (SAG), volume (Vol), hydration energy (HydE), octanol-water partition<br />
coefficient (LogP), refractivity (Refr) and polarizability (Pol). The corresponding<br />
abbreviations are listed at the bottom of Table 2.<br />
Since the expression of <strong>de</strong>pen<strong>de</strong>nce of the retention times vs. one ore<br />
more mycotoxin properties could be inversed or logarithmical, the search<br />
was exten<strong>de</strong>d by including the following regressors: LogP, InvlogP, HydE,<br />
InvHydE, Invhf, Pol, LnPol, LnRefr, Vol, InvVol, LnVol, SAG, MW, InvMW,<br />
LnMW, negte, dm, negsae, negsbe, sce, negsee, Invnegte, Invdm, Invnegsae,<br />
Invnegsbe, Invsce, Invnegsee, Lnnegte, Lndm, Lnnegsae, Lnnegsbe, Lnsce,<br />
and Lnnegsee (where `ln` is for natural logarithm and `inv` for inverse value).<br />
A home ma<strong>de</strong> *.php program was <strong>de</strong>veloped in or<strong>de</strong>r to i<strong>de</strong>ntify the<br />
best regression (the main criterion used was r 2 = max, where r 2 is <strong>de</strong>termination<br />
coefficient) for every number of regressors (abbreviated as x, 1 ≤ x ≤ 10).<br />
Other objective of the current research was to find the mo<strong>de</strong>l of the <strong>de</strong>pen<strong>de</strong>nce<br />
between the <strong>de</strong>termination coefficient and the number of regressors. The<br />
Sli<strong>de</strong>Write software was used in or<strong>de</strong>r to i<strong>de</strong>ntify non-linear relationships (a<br />
significance level of 5% was used).<br />
ACKNOWLEDGEMENTS<br />
This paper is <strong>de</strong>dicated to Prof. Simion GOCAN on the occasion of his 80 th<br />
birthday.<br />
REFERENCES<br />
1. N.W. Turner, S. Subrahmanyam, S.A. Piletsky, Anal. Chim. Acta, 2009, 632(2), 168.<br />
2. J.L. Richard, Int. J. Food Microbiol., 2007, 119(1-2), 3.<br />
3. H.S. Hussein, J. M. Brasel, Toxicology, 2001, 167(2), 101.<br />
4. M. Reverberi, A. Ricelli, S. Zjalic, A.A. Fabbri, C. Fanelli, Applied Microbiology<br />
and Biotechnology, 2010, 87(3), 899.<br />
5. W.P. Blount, Journal of the British Turkey Fe<strong>de</strong>ration, 1961, 9, 55.<br />
6. M.C. Lancaster, F.P. Jenkins, J.M. Philp, Nature, 1961, 192, 1095.<br />
7. F.G. Peers, C.A. Linsell, Ann. Nutr. Aliment., 1977, 31, 1005.<br />
8. E. Karunasena, M.D. Larrañaga, J.S. Simoni, D.R. Douglas, D.C. Straus,<br />
Mycopathologia, 2010, 170(6), 377.<br />
9. B.B. Jarvis, J.D. Miller, Appl. Microbiol. Biotechnol., 2005, 66(4), 367.<br />
165
166<br />
SORANA D. BOBLOACĂ, LORENTZ JÄNTSCHI, RADU E. SESTRAŞ<br />
10. A.A. El-Banna, J.I. Pitt, L. Leistner, Systematic and Applied Microbiology, 1987,<br />
10(1), 42.<br />
11. M. Kokkonen, M. Jestoi, A. Rizzo, International Journal of Food Microbiology,<br />
2005, 99(2), 207.<br />
12. D.L. Arnold, P.M. Scott, P.F. McGuire, Food and Cosmetics Toxicology, 1978,<br />
16(4), 369.<br />
13. I.M.L.D. Storm, J.L. Sørensen, R.R. Rasmussen, K.F. Nielsen, U. Thrane, Stewart<br />
Postharvest Review, 2008, 4(6), 1.<br />
14. O.O.M. Iheshiulor, B.O. Esonu, O.K. Chuwuka, A.A. Ome<strong>de</strong>, I.C. Okoli, I.P.<br />
Ogbuewu, Asian Journal of Animal Sciences, 2011, 5(1), 19.<br />
15. R.R. Paterson, N. Lima, EXS, 2010, 100, 31.<br />
16. A. Pfohl-Leszkowicz, Arhiv za Higijenu Rada i Toksikologiju, 2009, 60(4), 465.<br />
17. A.K. Bingham, T.D. Phillips, J.E. Bauer, J. Am. Vet. Med. Assoc., 2003, 222(5), 591.<br />
18. R. Krska, Analytical and Bioanalytical Chemistry, 2009, 395(5), 1203.<br />
19. G.H. Degen, Journal of Veterinary Pharmacology and Therapeutics, 2009, 32<br />
(SUPPL. 1), pp. 28.<br />
20. C. Raghaven<strong>de</strong>r, B. Reddy, World Mycotoxin Journal, 2009, 2(1), 23.<br />
21. P. Khlangwiset, F. Wu, Food Addit. Contam. Part A Chem. Anal. Control Expo.<br />
Risk Assess., 2010, 27(7), 998.<br />
22. F. Wu, P. Khlangwiset, Food Addit. Contam. Part A Chem. Anal. Control Expo.<br />
Risk Assess., 2010, 27(5), 658.<br />
23. D.L. Park, T.C. Troxell, Adv. Exp. Med. Biol., 2002, 504, 277.<br />
24. D.M. Hawkins, J. Chem. Inf. Comput. Sci., 2004, 44(1), 1.<br />
25. W.E. Steinmetz, C.B. Rodarte, A. Lin, European Journal of Medicinal Chemistry,<br />
2009, 44(11), 4485.<br />
26. R. Khosrokhavar, J.B. Ghasemi, F. Shiri, International Journal of Molecular Sciences,<br />
2010, 11(9), 3052.<br />
27. M.J.S. Dewar, E.G. Zoebisch, E.F. Healy, J.J.P. Stewart, J. Am. Chem. Soc., 1985,<br />
107, 3902.<br />
28. B. Polak, G. Ribiere, Rev. Fr. Imform. Rech. Oper., 1969, 16, 35.<br />
29. K.F. Nielsen, J. Smedsgaard, J. Chromatog. A, 2003, 1002, 111.
STUDIA UBB CHEMIA, LVI, 1, 2011<br />
EVALUATION OF A RURAL SETTLEMENT WELL WATERS BASED<br />
ON THE QUANTIFICATION OF SOME PHYSICAL AND<br />
CHEMICAL PARAMETERS. A CASE STUDY<br />
LADISLAU KÉKEDY-NAGY a AND GYÖNGYI PETŐ a<br />
ABSTRACT. Water samples from 30 wells from Remetea Oaşului village<br />
(Satu Mare county, Romania) have been characterized by the <strong>de</strong>termination<br />
of 2 physical parameters (temperature and electrical conductivity) and of<br />
19 chemicals (the Na, K, Li, Rb, Ca, Mg, Zn, Cu, Fe, Pb, Cd, Cl – – +<br />
, NO3 , NH4 ,<br />
2–<br />
SO4 content, pH, total hardness (D,°G), alkalinity (Alk.) and chemical oxygen<br />
<strong>de</strong>mand (COD). The chemical composition of the waters shows their suitability<br />
for household and agriculture purposes. Among the <strong>de</strong>termined constituents<br />
–<br />
only the Cd, Cu and NO3 content exceed the concentration limits for drinking<br />
water, being inappropriate for human and animal consumption. The hierarchical<br />
cluster analysis shows that the water samples are classified best based on<br />
the Pb, Cd, Zn, Cu, COD content, the well waters are grouped in 5 clusters.<br />
The waters can be only partially classified; wells from different zones are not<br />
separated. Consi<strong>de</strong>ring the most eight significant variables, they are grouped<br />
in two factors, which cover 90.78 % of the total variance.<br />
Keywords: well water, chemical composition, pollution, cluster analysis,<br />
factor analysis<br />
INTRODUCTION<br />
The freshwater plays a vital role in our life and in the everyday (industrial,<br />
agronomical and household) activity. In our days, the water consumption<br />
exhibits an increasing trend worldwi<strong>de</strong>; being obtained from surface and<br />
un<strong>de</strong>rground sources. For rural and remote settlements the driven or sunken<br />
wells assure the water for everyday use, including for human and animal<br />
consumption. The quality and the quantity of the available drinking water<br />
from healthcare point of view are consi<strong>de</strong>red as one of the measure of the<br />
wellbeing and civilization [1]. From this point of view the drinking water must<br />
fulfill the most restrictive conditions, including the physical, chemical and<br />
biological parameters. The United Nations World Health Organization (WHO),<br />
the European Union’s as well as the Romanian legislations set exactly the<br />
quality of the drinking water, the nature and the quantity of different substances<br />
that could be contained [2]. The characteristics of well waters are diverse,<br />
a Universitatea Babeş-Bolyai, <strong>Facultatea</strong> <strong>de</strong> <strong>Chimie</strong> <strong>şi</strong> <strong>Inginerie</strong> <strong>Chimică</strong>, Str. Kogălniceanu,<br />
Nr. 1, RO- 400084 Cluj-Napoca, Romania, lkekedy@chem.ubbcluj.ro
168<br />
L. KÉKEDY-NAGY, GY. PETŐ<br />
<strong>de</strong>pending on many factors, such as: geological structure of the rocks and<br />
their chemical composition, the position of the aquifer layer, the environmental<br />
temperature, the geochemical reactions, meteorological conditions and on<br />
the mo<strong>de</strong> of water extraction, human activity, etc. Usually, the water brought to<br />
the surface is used for different purposes without any further treatment, <strong>de</strong>spite<br />
of its physical, chemical and biological characteristics. For the unequivocal<br />
characterization of the waters a series of standardized <strong>de</strong>terminations must<br />
be carried out [3-5]. From the data one can predict the utility of the water, the<br />
effect on the health, the chemical composition of the rocks, including the<br />
aquifers, the origin of the water source, etc.<br />
In or<strong>de</strong>r to reveal of the hid<strong>de</strong>n relationships among the data statistical<br />
and chemometrical methods are employed efficiently in large scale [6]. The<br />
cluster-, factor- and principal component analysis, as well as the linear<br />
discriminant analysis allow the classification of the waters based on the physical<br />
and chemical data; to establish the similarity among the water sources; to<br />
get the main parameters on which the classification is performed; to i<strong>de</strong>ntify<br />
the aquifer layers, the pollutants, etc. [7-13].<br />
The aim of this work is to evaluate the well water quality of a rural<br />
settlement, to i<strong>de</strong>ntify the most frequent inorganic pollutants by the quantification<br />
of the inorganic components and to estimate the structure of the aquifer layers.<br />
In or<strong>de</strong>r to reveal the hid<strong>de</strong>n relationships the chemometric approach of the<br />
data has been proposed.<br />
RESULTS AND DISCUSSION<br />
The results of the quantification data are summarized in the Tables 1-3.<br />
Water samples exhibit medium hardness and salinity, with low organic<br />
matter content. The NH4 + -ion is present only in 4 samples (noted 9, 11, 26 and<br />
27) probably due to infiltration of manure liquor. The NO3 - -ion is present in all<br />
samples, exceeding many times the maximum allowable quantity of 44.2 mg/L<br />
sets by WHO for drinking water. The infiltration of the long term used ammonium<br />
nitrate as fertilizer could be responsible for this fact. The Cd content of the<br />
waters is also too high for drinking water, exceeding with about two or<strong>de</strong>rs of<br />
magnitu<strong>de</strong> the WHO set value (0.003 mg/L). The abnormal high Cd-content<br />
is the consequence of the corrosion of the galvanized iron pipes and buckets<br />
used for water outtake. Taking into account the high Cd and NO3 - -ion content it<br />
is not recommen<strong>de</strong>d to use these waters for human and animal consumption.<br />
In or<strong>de</strong>r to reveal the hid<strong>de</strong>n relationships among the parameters, and<br />
to classify the wells, first the cluster analyses have been performed. Three of<br />
the parameters were exclu<strong>de</strong>d from the calculations (T, Rb and NH4 + content),<br />
being irrelevant. The tree diagram (the Eucli<strong>de</strong>an distance as similarity measure<br />
and complete linkage) is presented in the Figure 1.
EVALUATION OF RURAL SETTLEMENT WELL WATERS<br />
Table 1. The physical data of the well water samples<br />
Sample Zone T (°C) pH D (°G)<br />
TDS Alk.<br />
(mg / L)<br />
COD<br />
1 A1 1 7.24 13.0 188 4.04 1.62<br />
2 A1 3 6.94 5.8 68 2.10 1.75<br />
3 A1 1 7.10 12.7 160 3.90 3.24<br />
4 A1 1 7.12 27.3 402 6.20 3.16<br />
5 A1 0 7.03 8.4 150 2.74 3.00<br />
6 B 4 6.97 18.4 206 5.16 0<br />
7 B 5 6.36 6.47 82 1.50 1.22<br />
8 B 1 6.54 22.3 355 3.70 1.00<br />
9 B 1 6.71 9.3 142 1.88 4.05<br />
10 B 1 6.74 28.0 355 5.13 1.62<br />
11 B 4 7.01 26.3 316 6.65 1.75<br />
12 B 5 7.03 14.4 159 4.33 1.38<br />
13 B 3 6.62 13.0 211 2.03 1.75<br />
14 C1 1 6.81 11.5 203 2.91 1.46<br />
15 C1 3 6.90 13.0 308 4.14 3.73<br />
16 C2 0 5.90 1.9 23 0.34 2.19<br />
17 C2 2 7.10 14.8 164 4.68 1.21<br />
18 C2 1 6.53 18.0 329 1.80 2.03<br />
19 C2 2 6.90 23.2 340 4.97 3.80<br />
20 C2 2 6.47 13.0 247 3.13 2.43<br />
21 C2 2 7.26 22.5 297 5.55 2.84<br />
22 C2 1 7.26 9.6 157 2.86 2.35<br />
23 A2 3 6.72 15.8 281 4.00 2.02<br />
24 A2 1 6.83 11.0 149 2.89 4.05<br />
25 A2 5 6.90 17.8 267 3.46 1.05<br />
26 A2 3 7.05 8.6 115 1.20 3.80<br />
27 A2 2 7.37 26.3 363 3.12 3.32<br />
28 A2 1 7.41 31.3 490 7.24 4.21<br />
29 A2 3 7.44 14.3 148 3.84 2.68<br />
30 A2 3 6.44 35.0 491 2.64 2.84<br />
Table 2. The metal content of the well water samples<br />
Sample Zone<br />
Na K<br />
Concentration (mg / L)<br />
Rb Mg Ca Cu<br />
1 A1 29 3.1 0 26.2 27.4 1.4<br />
2 A1 7.4 2.5 0 4.5 7.9 1.4<br />
3 A1 15.8 6.8 0 26.2 43.3 1.5<br />
4 A1 90.3 4.3 0 36.2 66.5 1.4<br />
5 A1 38.5 14.6 0 12.7 27.0 1.4<br />
6 B 20.0 1.4 0 28.4 57.0 1.5<br />
7 B 12.0 0.8 0 8.5 16.0 1.4<br />
8 B 72.5 0.7 0 26.8 62.4 1.5<br />
9 B 19.8 6.0 0 12.4 34.7 1.6<br />
169
170<br />
L. KÉKEDY-NAGY, GY. PETŐ<br />
Sample Zone<br />
Na K<br />
Concentration (mg / L)<br />
Rb Mg Ca Cu<br />
10 B 34.2 4.8 0 38.8 67.4 1.5<br />
11 B 44.6 2.7 0 40.9 59.7 1.5<br />
12 B 14.2 0.5 0 18.8 48.8 1.6<br />
13 B 39.1 17.9 0 15.4 16.0 1.6<br />
14 C1 31.1 49.5 0.1 15.4 19.7 1.5<br />
15 C1 45.3 113 0.1 21.3 19.2 1.6<br />
16 C2 2.5 2.2 0 4.6 3.8 1.5<br />
17 C2 20.4 24.8 0 25.4 37.0 1.5<br />
18 C2 80.5 13.6 0 21.2 14.7 1.6<br />
19 C2 48.5 22.2 0 30.5 42.9 1.6<br />
20 C2 29.2 67.7 0.1 18.5 14.7 1.7<br />
21 C2 43.2 36.9 0 33.0 43.3 1.7<br />
22 C2 28.7 32.2 0 13.0 16.0 1.7<br />
23 A2 52.3 57.6 0.1 19.5 30.6 1.6<br />
24 A2 31.5 15.7 0 14.3 9.2 1.7<br />
25 A2 31.2 31.1 0 27.0 34.7 1.7<br />
26 A2 5.6 6.3 0 11.6 33.8 1.8<br />
27 A2 46.8 14.2 0 40.5 65.1 1.7<br />
28 A2 84.6 3.3 0.1 56.5 72.9 1.8<br />
29 A2 16.2 2.0 0 24.3 42.9 1.9<br />
30 A2 73.2 1.6 0 55.1 78.3 1.7<br />
Table 3. The metal and the anion content of the well water samples (cont.)<br />
Sample Zone<br />
Zn Pb<br />
Concentration (mg / L)<br />
Cd NH4 + Cl¯ SO4 2- NO3 -<br />
1 A1 0.48 0.0001 0.42 0 33.0 20.0 119.3<br />
2 A1 0.52 0.0002 0.04 0 2.2 0.0 25.7<br />
3 A1 0.52 0.0002 0.04 0 12.7 17.7 64.8<br />
4 A1 0.52 0.0002 0.39 0 128.8 27.6 445.2<br />
5 A1 3.41 0.0002 0.45 0 27.7 10.0 172.7<br />
6 B 0.65 0.0002 0.39 0 12.5 0.0 209.1<br />
7 B 0.45 0.0001 0.55 0 6.8 8.8 106.1<br />
8 B 0.45 0.0002 0.36 0 146 10.0 589.2<br />
9 B 0.45 0.0002 0.33 0.1 35.5 14.6 201.6<br />
10 B 0.45 0.0002 0.42 0 111.0 29.7 342.5<br />
11 B 0.45 0.0001 0.80 0.1 47.7 27.4 57.0<br />
12 B 0.68 0.0002 0.17 0 6.0 0.0 48.7<br />
13 B 0.45 0.0002 0.33 0 62.0 14.1 973.4<br />
14 C1 0.62 0.0003 0.61 0 38.5 18.2 524.2<br />
15 C1 0.68 0.0002 0.77 0 73.2 29.4 682.8<br />
16 C2 0.62 0.0003 0.77 0 2.1 16.7 114.5<br />
17 C2 0.62 0.0002 1.27 0 3.6 0.0 212.6<br />
18 C2 0.68 0.0019 0.61 0 154.0 29.2 831.7<br />
19 C2 0.68 0.0003 0.30 0 73.4 29.4 837.3<br />
20 C2 0.65 0.0001 0.30 0 62.0 25.2 640.8
EVALUATION OF RURAL SETTLEMENT WELL WATERS<br />
Sample Zone<br />
Zn Pb<br />
Concentration (mg / L)<br />
Cd NH4 + Cl¯ SO4 2- NO3 -<br />
21 C2 0.68 0.0001 1.14 0 71.8 20.9 44.3<br />
22 C2 0.75 0.0002 0.52 0 24.6 0.0 328.5<br />
23 A2 0.91 0.0002 0.64 0 80.2 9.4 690.0<br />
24 A2 0.75 0.0002 0.83 0 35.6 0.0 108.6<br />
25 A2 1.34 0.0002 0.42 0 77.6 2.7 643.5<br />
26 A2 1.11 0.0002 0.04 0.2 47.0 1.2 368.3<br />
27 A2 0.94 0.0002 0.39 0.1 182.4 29.3 290.8<br />
28 A2 0.81 0.0003 0.39 0 192.4 20.9 235.7<br />
29 A2 0.75 0.0000 0.23 0 7.7 0.0 481.7<br />
30 A2 1.27 0.0002 0.26 0 260 30.1 1060<br />
.<br />
Linkage Distance<br />
250<br />
200<br />
150<br />
100<br />
50<br />
0<br />
NO 3 -<br />
TDS<br />
Cl -<br />
Ca<br />
Na<br />
K<br />
O Mg G<br />
2- SO4 Cd<br />
Pb<br />
Zn<br />
Cu Alk.<br />
COD pH<br />
Figure 1. The tree diagram for the 16 variables consi<strong>de</strong>red<br />
The variables are grouped in 5 groups, according to linkage distances,<br />
the greatest distances being for NO3 - , TDS and Cl - (in <strong>de</strong>scending or<strong>de</strong>r),<br />
variables, less proper for classification. The most suitable variables for this<br />
purpose are Cd, Pb, Zn, Cu and COD content of the water samples.<br />
Significant correlation exists between the variables Na and Cl - -ion content<br />
(r = 0.83) and Mg and Ca content (r = 0.87), respectively. Using all the 16<br />
variables the classification of the wells (cases) is represented in the Figure 2.<br />
The diagram shows that the wells have close similar chemical<br />
composition, being grouped in 4 main groups. Wells from different zones,<br />
some of them situated at 200-300 m distance to each other, take part close,<br />
in the same subgroup. This suggests that the wells are feed by the same<br />
171
172<br />
L. KÉKEDY-NAGY, GY. PETŐ<br />
aquifer layers, they communicate between each other (an important feature<br />
of public health aspect). The differences seem to appear mainly due to the<br />
distinct mo<strong>de</strong> of exploitation by the owners, such as the distinct frequency<br />
and water withdrawal quantity from the well.<br />
Linkage Distance<br />
1200<br />
1000<br />
800<br />
600<br />
400<br />
200<br />
0<br />
A2 C2 A2 B C2 C1 C2 C1 A1 B C2 C2 B B A2<br />
C2 B A2 A2 A2 A2 A2 B C2 A1 B B A1 A1 A1<br />
Figure 2. The tree diagram for the 30 well water samples<br />
In the next step the factor analysis was carried out. Based on the scree<br />
plot data, 5 factors were retained, also the first three factors cover 95.77 %<br />
of the variance. The factor loadings for each variable are synthesized in the<br />
Table 4.<br />
Table 4. Factor Loadings (Varimax normalized)<br />
Factor 1 Factor 2 Factor 3 Factor 4 Factor 5<br />
pH 0.207563 0.770780 0.236369 0.008961 0.215662<br />
Alk. 0.667291 0.598495 -0.112624 0.233278 -0.110554<br />
COD 0.129281 0.072931 0.638477 0.075670 0.412815<br />
O G 0.971984 0.103140 0.060046 -0.081636 -0.079986<br />
TDS 0.967382 -0.101480 0.175258 0.079374 -0.009263<br />
Na 0.851140 -0.277206 0.051300 0.138125 0.179426<br />
K -0.083540 -0.149300 0.398450 0.790085 -0.068063<br />
Mg 0.933271 0.231893 0.086673 -0.073718 -0.042683<br />
Ca 0.816476 0.351372 -0.022124 -0.344708 -0.048337<br />
Cu 0.106008 0.113988 0.859824 -0.067920 -0.055023<br />
Zn -0.045120 -0.004045 0.063097 -0.053661 0.882874
EVALUATION OF RURAL SETTLEMENT WELL WATERS<br />
Factor 1 Factor 2 Factor 3 Factor 4 Factor 5<br />
Pb -0.163514 0.647606 0.126985 -0.072130 -0.196369<br />
Cd 0.043922 0.085520 -0.274024 0.798977 0.005318<br />
Cl - 0.842973 -0.339580 0.244909 -0.119279 0.098616<br />
SO4 2- 0.659487 -0.349934 0.023661 0.244843 0.002926<br />
NO3 - -0.346795 0.651629 -0.433585 -0.044882 0.139131<br />
highlighted loadings > 0.700<br />
The first factor (covering 62.08 %, inclu<strong>de</strong>s the variables Alk., D( O G),<br />
TDS, Na, Mg, Ca and Cl - , the main components of the waters; the second one<br />
inclu<strong>de</strong>s only the pH (covering 28.68 % of total variance), the followings<br />
each inclu<strong>de</strong>s only one variable: Cu, Cd, and Zn, respectively.<br />
CONCLUSIONS<br />
The well waters take part of medium mineralized and hardness waters,<br />
being suitable for household and agriculture purposes. The high Cd and NO3 - -<br />
ion content make the waters unsuitable for human and animal consumption.<br />
The well waters have similar chemical composition, the wells being fed by the<br />
same aquifer layers. The hierarchical cluster analysis shows that the waters<br />
could be classified best based on the Pb, Cd, Zn, Cu, COD content; the wells<br />
being grouped in 5 clusters. They can be only partially classified; wells from<br />
different zones could not be separated. 8 variables could be grouped in two<br />
factors, which cover 90.78 % of the total variance.<br />
EXPERIMENTAL SECTION<br />
Selection of the settlement<br />
In or<strong>de</strong>r to get representative results, the followings were taken into<br />
account in the selection of the sampling site: to have a population greater<br />
than 500 inhabitants, the freshwater water supply realized by wells, constant<br />
everyday water consumption. All these conditions were fulfilled by Remetea<br />
Oaşului village (Satu Mare county), located in the north-western part of Romania<br />
with the following geographic coordinates: Latitu<strong>de</strong> - 47° 52' 60 N, Longitu<strong>de</strong> -<br />
23° 19' 0 E, altitu<strong>de</strong>: 200 m above the sea level. The village lies in the Turstream<br />
valley, surroun<strong>de</strong>d by 50-100 m high hills, with about 600 habitants.<br />
The people <strong>de</strong>al with animal breeding, plant cultivation; the well waters are<br />
used for agricultural, stock-raising, household purposes, including human and<br />
animal consumption. The wells are placed usually in the farmyards, and are<br />
covered with lids; the water is brought to the surface using metal buckets or<br />
immersion pumps.<br />
173
L. KÉKEDY-NAGY, GY. PETŐ<br />
Sampling and sample handling<br />
Waters of 30 private wells from village were sampled. Three different<br />
zones of the settlement were selected, situated evenly along the main- and<br />
the neighboring si<strong>de</strong> roads plots. There were collected 13 samples from the<br />
southern zone (labeled A), 8 samples from the northern zone (labeled B)<br />
and 9 samples from the central zone (labeled C) of the village. The samples<br />
were collected during November 2007 period in according to the EPA<br />
prescriptions: collected in 500 mL PET bottles, conserved on the spot with<br />
1 mL of conc. HNO3 and kept at 4 °C.<br />
Instrumentation<br />
The quantification of the metals was carried out with a Perkin Elmer<br />
373 (Waltham, MA, USA) flame atomic absorption spectrophotometer. The<br />
original burner head for C2H2 – air flame was replaced with a home ma<strong>de</strong><br />
one for CH4 – air flame [14]. The instrumental parameters for each element<br />
were optimal, set as indicated in the manufacturer’s prospect. The chlori<strong>de</strong>ion<br />
content, the alkalinity (Alk.) and the total hardness (D) were <strong>de</strong>termined<br />
by potentiometric titration (670 Titroprocessor, Mettler, Herisau, Swiss). The<br />
electric conductivity was quantified by using an OK – 102/1 (Ra<strong>de</strong>lkis, Budapest,<br />
Hungary) conductometer. The total dissolved salts (TDS) values were calculated<br />
by converting the conductivity data. The chemical oxygen <strong>de</strong>mand (COD) has<br />
been <strong>de</strong>termined by using the Kubelka method. The quantification of the<br />
SO4 2- , NO3 - and NH4 + ions were performed in molecular absorption mo<strong>de</strong>, at<br />
λ = 490 nm, 210 nm and 401 nm respectively, using a double beam UV-Vis<br />
spectrophotometer (T80+, PG Instruments Ltd., UK) [3, 4].<br />
Chemicals<br />
All stock standard solutions were of 1000 mg/L, prepared from RbCl,<br />
CsCl, Li2CO3 (Merck, Darmstadt, Germany), NaCl, KCl, KNO3, NH4Cl (Reactivul,<br />
Bucuresti, Romania), CaCO3, Cd, Fe, Cu, Zn and Mg (Specpure, Johnson<br />
Matthey Chemicals Limited, England), HCl, H2SO4, HNO3 (analytical gra<strong>de</strong>,<br />
Merck, Darmstadt, Germany)), respectively. The calibration solutions were<br />
obtained by diluting a given volume of stock solution with double distilled<br />
water. The diluted solutions were prepared just before measurements. KMnO4,<br />
C2H2O4.2H2O, AgNO3 and EDTA 0.1 N solutions are all manufacturer-ma<strong>de</strong><br />
volumetric solutions and were used as received (Reactivul, Bucharest, Romania).<br />
Procedure<br />
The temperature, electric conductivity and the pH values were<br />
<strong>de</strong>termined in the field; the other parameters were quantified in the laboratory.<br />
For the flame AES, AAS and spectrophotometric quantifications the standard<br />
calibration method was used in all cases. The titrations were carried out in the<br />
174
EVALUATION OF RURAL SETTLEMENT WELL WATERS<br />
dynamic automatic titration mo<strong>de</strong>, using appropriate potentiometric sensors.<br />
Three parallel measurements were ma<strong>de</strong>, the mean, and the SD were<br />
calculated. The statistical and chemometrical processing of the data was<br />
carried out by using the Statistica software program, version 6, (StatSoft.Inc.,<br />
OK, USA).<br />
REFERENCES<br />
1. C. Baird, Environmental Chemistry (2nd edition), W.H. Freeman & Company, New<br />
York, 1999, chapter 2.<br />
2. Ordin 161/16.02.2006, Normativ privind clasificarea calităţii apelor <strong>de</strong> suprafaţă<br />
în ve<strong>de</strong>rea stabilirii stării ecologice a corpurilor <strong>de</strong> apă.<br />
3. L.S. Clesceri, A.E. Greenberg, R.R. Trussel (Eds.), Standard Methods for examination<br />
of water and wastewater, 17 th Edition, APHA – AWWA – WPCF, 1989, chapter 6.<br />
4. W. Fresenius, K.E. Quentin, W. Schnei<strong>de</strong>r (Eds.), Water Analysis, Springer-Verlag,<br />
Berlin, Hei<strong>de</strong>lberg, New York, London Paris Tokyo, 1987, chapter 3.<br />
5. United Nations Environment Programme, Analytical Methods for Environmental<br />
Water Quality, UNEP Global Environment Monitoring System (GEMS)/Water<br />
Program and International Atomic Energy Agency, New York, 2004, chapter 4.<br />
6. R.G. Brereton, Applied Chemometrics for Scientists, John Wiley & Sons Ltd,<br />
Chichester, 2007, chapter 4.<br />
7. M.L. Wu, Y.S. Wang, C.C. Sun, et al., Oceanologia, 2009, 51, 217.<br />
8. H. Juahir, T.M. Ekhwan, S.M. Zain, et al., American-Eurasian J. Agric. & Environ.<br />
Sci., 2008, 4, 258.<br />
9. A.R. Kumar, P. Riyazuddin, Current Sci., 2008, 94, 1012.<br />
10. E. Vončina, D.B. Vončina, N. Mirkovič, et al., Acta Chim. Slov., 2007, 54, 119.<br />
11. R. Bro, Anal. Chim. Acta, 2003, 500, 185.<br />
12. T. Jerič, A.M.L. Marechal, D. Kavšek, A.D.B. Vončina, Nova Biotech., 2009, 9, 155.<br />
13. A.R. Kumar, P. Riyazuddin, Curr. Sci., 2008, 94, 1012.<br />
14. E.A. Cordoş, L. Kékedy-Nagy, Studia UBB Chemia, 1992, 37, 61.<br />
175
STUDIA UBB CHEMIA, LVI, 1, 2011<br />
STRUCTURAL INVESTIGATIONS OF AG2O-B2O3-CAO-P2O5<br />
GLASS AND GLASS-CERAMIC SYSTEM<br />
RĂZVAN ŞTEFAN* a , IOAN BRATU b , GHEORGHE BORODI b ,<br />
NICOLAE LEOPOLD c , VIORICA SIMON c<br />
ABSTRACT. The paper investigated the 1.5Ag2O·98.5[0.47B2O3(0.53-x)<br />
CaOxP2O5] system prepared in vitreous state using the rapid melt quenching<br />
method. In or<strong>de</strong>r to obtain glass-ceramic samples, the glass was heat treated<br />
to 650ºC during 6 hours. The structural units BO3 and BO4 which build the<br />
vitreous network and the modifications occurred following partial crystallization<br />
were clearly highlighted by Raman and IR spectroscopy. The analysis by<br />
X-ray diffraction showed the vitreous features of the samples before the heat<br />
treatment and reveals that the crystalline phase <strong>de</strong>veloped into the vitreous<br />
matrix is Ca10 (PO4)6 (OH)2. The structural changes before and after the heat<br />
treatment have been investigated consi<strong>de</strong>ring the B2O3/P2O5 ratio.<br />
Keywords: glass, glassceramic, phosphorous oxi<strong>de</strong>, silver<br />
INTRODUCTION<br />
The boron oxi<strong>de</strong> was generally studied [1-4] due to its capacity to build<br />
vitreous network. The main structural units in glass were i<strong>de</strong>ntified and has<br />
been <strong>de</strong>monstrated that the boron may be tetra- and three coordinated. The<br />
oxi<strong>de</strong> matrix on B2O3 are used in tissue engineering as structural scaffold for<br />
cell growth that are to be implanted into the body, having direct clinical<br />
implications in cartilage, skin and vascular system restoration [4].<br />
The oxi<strong>de</strong> glass containing silver oxi<strong>de</strong> are used in the infections<br />
treatment, due to their bacteriostatic and bacterici<strong>de</strong> properties [5], but also<br />
in implantology, these two aforesaid properties are also beneficial in this last<br />
mentioned medical field. Due to the silver properties, these materials are<br />
consi<strong>de</strong>red as a separate class of oxi<strong>de</strong> materials, being difficult to obtain,<br />
because metallic silver separates in drops on the surface of the new formed<br />
glass, during cooling process. The glass doped with Ag + can be prepared<br />
using the surface ionic exchange method, sol-gel method [6] and using<br />
rapid melt quenching method [7].<br />
a University of Agricultural Science and Veterinary Medicine, Biophysics Department, Calea<br />
Manastur 3-5, Cluj-Napoca, Romania, Tel. +40 264 596 384, Int. 207, Fax +40 264 593 792,<br />
rstefan@usamvcluj.ro<br />
b National Institute for Research and Development of Isotopic and Molecular Technologies,<br />
Donath 65-103, Cluj-Napoca, Romania<br />
c Babes-Bolyai University, Faculty of Physics, Kogalniceanu 1, Cluj-Napoca, Romania
RĂZVAN ŞTEFAN, IOAN BRATU, GHEORGHE BORODI, NICOLAE LEOPOLD, VIORICA SIMON<br />
The vitreous materials based on phosphorus are wi<strong>de</strong>ly used [1, 8] for<br />
growth stimulation of bone tissues, leading to the formation of hidroxyapatite<br />
(HA) layer between the organic tissue and inorganic material. The presence<br />
of vitreous network modifiers as CaO in the vitreous material structure helps<br />
the formation of bioactive glass which can be used in implants [9] without<br />
“non-self” rejection or in stimulation of bone tissue regenerations. The bond<br />
between inorganic and organic component is stronger than the bone itself.<br />
The Raman and IR spectroscopy are extremely sensitive techniques<br />
for the structural analysis and for the modifications occurring after the heat<br />
treatment, allowing the i<strong>de</strong>ntification of structural units [10] in vitreous structure<br />
and for <strong>de</strong>tecting of (HA) formation on the surface of material tested “in vitro”<br />
conditions.<br />
The aim of this paper was to obtain a vitreous oxi<strong>de</strong> material based<br />
on B2O3 which to homogenous inclu<strong>de</strong> silver ions in a molar content as large<br />
as possible and its structural characterization using Raman and IR spectroscopy<br />
in or<strong>de</strong>r to i<strong>de</strong>ntify the structural units which are formed in the new materials.<br />
The paper is an investigation of vitreous network structure changes occurred<br />
following the modification of the molar ratio of two classical forming compounds<br />
of vitreous network B2O3 and P2O5. Also the possibility that their structural<br />
units participate together to the formation of vitreous network has been studied.<br />
The research aims to obtain a new system, useful in medical area to <strong>de</strong>liver<br />
sufficient ions content for having bacterici<strong>de</strong> and bacteriostatic effect and to<br />
build (HA) layer in contact with bone tissue.<br />
RESULTS AND DISCUSSION<br />
X-ray pow<strong>de</strong>r diffraction patterns for the thermally untreated samples<br />
are shown in Figure 1. One can see that the all investigated samples are in<br />
amorphous state. The samples with x = 0 and 0.02 are characterized by<br />
two halos which are specific to amorphous samples, the most intense<br />
maximum being located at 29.6º ( 2 θ ). The relation between the most<br />
frequently occurring interatomic distance R and the position of the strongest<br />
5λ<br />
observable maximum is given by the relationship [11]: R = , where<br />
8 sin( θ)<br />
λ is the wavelength of X-ray beam and θ is the diffraction angle. From this<br />
relation R= 3.76Å for samples x = 0 and x = 0.02.<br />
For samples with x ≥ 0.05 a new halo appears for 2 θ ~21.7º value.<br />
The frequently corresponding interatomic distances for this maximum is<br />
R = 5.11Å. The appearance of an additional maximum at a smaller angle<br />
suggests a supplementary or<strong>de</strong>r between atoms corresponding to some<br />
larger distances.<br />
178
STRUCTURAL INVESTIGATIONS OF AG2O-B2O3-CAO-P2O5 GLASS AND GLASS-CERAMIC SYSTEM<br />
Figure 1. X-ray pow<strong>de</strong>r diffraction patterns for the thermally untreated samples<br />
of 1.5%Ag2O 98.5%[0.47B2O3(0.53-x)CaOxP2O5] system<br />
The X-ray pow<strong>de</strong>r diffraction patterns for heat treated samples are<br />
presented in Figure 2. The samples with x = 0 and x = 0.02 contain only<br />
amorphous phase, while samples x = 0.05 and x = 0.08 contain both crystalline<br />
and vitreous phase. The crystalline phase was i<strong>de</strong>ntified as being Ca10(PO4)6O,<br />
as listed in PDF 89-6495, which crystallizes in hexagonal system having the<br />
following [12] lattice parameters: a = 9.432 Å and c = 6.881 Å. One can<br />
remark that for the samples which have an additional halo at 21.7º ( 2 θ )<br />
before heat treatment, after heat treatment they contain both crystalline and<br />
amorphous phase. CaO reacts with B2O3 and P2O5 the two classical vitreous<br />
network formers <strong>de</strong>pending on their optical basicity [13], thus it is natural that<br />
the crystalline state containing PO4 to be formed.<br />
The IR spectra of vitreous samples (Figure 3) from the oxi<strong>de</strong> system<br />
1.5Ag2O98.5[0.47B2O3(0.53-x)CaOxP2O5] with 0 ≤ x ≤ 0.08 mol% content in<br />
glass matrix, present absorption bands in the spectral domain 1600-400 cm -1 .<br />
The wi<strong>de</strong> bands structure points to the structural disor<strong>de</strong>r within the system<br />
itself, i.e., for each molar ratio among its components.<br />
As shown [14] the glass exclusively based on B2O3 is composed of<br />
boroxol rings which form a vitreous network [15], with local or<strong>de</strong>r and of<br />
BO3 triangles. The vitreous structure based on boroxol rings is maintained<br />
also <strong>de</strong>pending on the quantity and type of the network modifier oxi<strong>de</strong><br />
introduced in the starting matrix up to 25% molar content.<br />
179
RĂZVAN ŞTEFAN, IOAN BRATU, GHEORGHE BORODI, NICOLAE LEOPOLD, VIORICA SIMON<br />
180<br />
Figure 2. X-ray pow<strong>de</strong>r diffraction patterns for the thermally treated samples<br />
of 1.5%Ag2O98.5%[0.47B2O3(0.53-x)CaOxP2O5] system<br />
Figure 3. IR spectra of 1.5%Ag2O 98.5% [0.47B2O3(0.53-x)CaO xP2O5]<br />
vitreous system
STRUCTURAL INVESTIGATIONS OF AG2O-B2O3-CAO-P2O5 GLASS AND GLASS-CERAMIC SYSTEM<br />
In the investigated vitreous system 1.5%Ag2O98.5%[0.47B2O3<br />
(0.53-x)CaOxP2O5], one expects the occurrence of the bands characteristic<br />
to other borate units, resulting for the fragmentation of the network, together<br />
with the modification of the oxi<strong>de</strong>s ratio. These are as follow diborate (B4O7 2- ),<br />
tetraborate (B8O13 2- ), pentaborate (B5O8 - ) etc. and the boron atoms will exist<br />
in both three- and four-coordinated states.<br />
The samples with x ≤ 0.02 reveal i<strong>de</strong>ntical absorption bands in the<br />
entire spectral range with the exception with the small wave numbers range<br />
400-600 cm -1 . Thus, if in x = 0 and x = 0.02 spectra, there is a wi<strong>de</strong> IR band<br />
at ~510 cm -1 , in x = 0.02 sample a new band at ~560 cm -1 appears, in the<br />
same spectral domain. The band at ~510 cm -1 was assigned to the B-O-B<br />
bending vibration [16], this vibration type being more possible when there<br />
are no boroxol rings B3O6 in glass structure.<br />
While the P2O5 content increases in the B2O3-CaO-P2O5 matrix, the<br />
intensity of the band at ~560 cm -1 increases without modifying its spectral<br />
position and the broad band at 510 cm -1 become invisible in spectra. The<br />
band at ~560 cm -1 was assigned to the characteristic bands of bending<br />
vibration of P-O-P linkage in basic units of phosphate glasses [17-19].<br />
Around 700 cm -1 it is the domain of B-O-B bending vibrations in<br />
borate networks [20] and the IR band at ~706 cm -1 was assigned to B-O-B<br />
linkage in borate networks [13], this vibration may be assigned to a certain<br />
linkage between two trigonal boron atoms [21]. The intensity and width of<br />
this band <strong>de</strong>pend on the matrix composition and its position shifts towards<br />
smaller wave numbers with the increase of P2O5 in the oxi<strong>de</strong> matrix, which<br />
<strong>de</strong>monstrate that the borate network has a limited vibrational freedom in the<br />
presence of phosphate groups.<br />
The band has a shoul<strong>de</strong>r at 761 cm -1 (x = 0) that <strong>de</strong>creases in<br />
intensity, being inclu<strong>de</strong>d in the line assigned to B-O-B vibration (~700 cm -1 ),<br />
was attributed to the O3B-O-BO4 linkage bending vibrations [22, 23], while<br />
to the B-O bond stretching vibration in BO4 - units, was associated with the<br />
band at ~870 cm -1 [17].<br />
The wi<strong>de</strong> band at ~1028 cm -1 becomes more clearly <strong>de</strong>fined and<br />
more intense as the P2O5 molar content increases into the oxi<strong>de</strong> matrix and<br />
move towards larger wave numbers. This is the characteristic of BO4 units,<br />
specifically to the stretching vibration of B-O bond in BO4 tetrahedron [24].<br />
Once with the further addition of the P2O5 content (the number of BO4 units<br />
increases) the band moves towards larger wave numbers, for x = 0.08<br />
reaching to ~1080 cm -1 , last frequency is also assigned to (PO3)as vibrations<br />
[25]. This band movement assigned to boron towards larger wave numbers<br />
shows that the borate network is more fragmented and has a larger freedom<br />
of motion.<br />
181
RĂZVAN ŞTEFAN, IOAN BRATU, GHEORGHE BORODI, NICOLAE LEOPOLD, VIORICA SIMON<br />
The binary glass based on boron contains triangular BO3 units besi<strong>de</strong>s<br />
BO4 tetrahedron units. These can be comprised in BO3 - orthoborate dimmer<br />
units and the band at ~1240 cm -1 is assigned for them [26]. This band intensity<br />
<strong>de</strong>creases once with the reduction of molar ratio B/P into the matrix, but for<br />
x > 0.02 has the same intensity with the BO4 units typical band.<br />
For larger wave numbers there is a wi<strong>de</strong> band at ~1366 cm -1 . The band<br />
line width remains unchanged in the whole composition domain researched<br />
and was attributed to asymmetric stretching mo<strong>de</strong> of borate triangles BO3<br />
occurring in complex units [26].<br />
The modification of CaO/P2O5 ratio into the oxi<strong>de</strong> matrix leads to<br />
modification of the ratio between three coordinate boron (1240 cm -1 ) and<br />
tetracoordinate boron (1080 cm -1 ) and isomerisation occurs in boron based<br />
species.<br />
Due to the formation of Ag-O covalent bond in the glass, the absorption<br />
band appears at ~620 cm -1 [16]. This peak is absent here, thus we cannot<br />
establish that these bonds are forming, or their number is very small and<br />
have no influence upon the glass network vibration.<br />
The influence of heat treatment (t = 650°C) upon vitreous samples<br />
from 1.5%Ag2O98.5%[0.47B2O3(0.53-x)CaOxP2O5] system cannot be observed<br />
in all spectra of the investigated samples. Thus for x ≤ 0.02 the samples IR<br />
spectra are i<strong>de</strong>ntical with those of the samples of vitreous system (Figure 4).<br />
182<br />
Figure 4. IR spectra of 1.5%Ag2O98.5%[0.47B2O3(0.53-x)CaOxP2O5]<br />
heat treated system
STRUCTURAL INVESTIGATIONS OF AG2O-B2O3-CAO-P2O5 GLASS AND GLASS-CERAMIC SYSTEM<br />
For x ≥ 0.05 the heat treatment effect is obvious in IR spectra, due<br />
to the occurrence of a new band at ~604 cm -1 near the band at ~560 cm -1<br />
and disappearance of the band at 508 cm -1 . The band at ~560 cm -1 and at<br />
~604 cm -1 was assigned to the bending vibrations of the P-O-P phosphate<br />
structural units occurring in oxi<strong>de</strong> glass [17]. In this compositional domain<br />
the band at ~560 cm -1 is more intense and narrow than the one appearing at<br />
the same wave number in the vitreous structures and the band at ~604 cm -1 is<br />
localized. The shape of the two bands reveals the appearance of the structural<br />
or<strong>de</strong>r at distance and of the crystalline phases containing P2O5 as shown by<br />
the X-rays.<br />
Following the thermal treatment, the spectral domain ν ∈ [850-1100] cm -1 ,<br />
assigned to the B-O bond bending vibrations from BO4 units, is restructured<br />
through the occurrence of a significant number of bands into the samples<br />
sensitive to thermal treatment.<br />
The IR band at ~961 cm -1 is due to the groups containing BO4 units<br />
[21] especially in diborate groups.<br />
Thus, starting from the same concentration of P2O5 in the vitreous<br />
matrix, in the spectral range, three IR bands are revealed: at ~1020 cm -1 ,<br />
~1055 cm -1 and ~1088 cm -1 , which replace the wi<strong>de</strong> band at ~1020 cm -1 (x = 0).<br />
According to Gaafar [17] this spectral domain is associated with the B-O bond<br />
stretching vibrations of BO4 - tetrahedral (830-1120 cm -1 ).<br />
In the IR spectra we are expecting the occurrence of the bands due<br />
to the isolated tetrahedral ionic PO4 3- (Q 0 ) units or PO4 2- (Q 1 ) for any molar<br />
content of P2O5 in glass, reason for which we assigned the band at 1088 cm -1<br />
to the Q 1 units [27].<br />
Bands restructuring in the spectral domain 1000-1080 cm -1 and the<br />
occurrence of a narrow bands at ~560 cm -1 and ~604 cm -1 , lead to conclusion<br />
that the structural local or<strong>de</strong>r is established by the occurrence of crystalline<br />
volume domains and the formation of glass-ceramic structures.<br />
The spectral domain specific to the BO3 structural units stretching<br />
vibrations remains unchanged, the groups containing trigonal boron are<br />
unaffected by thermal treatment.<br />
The Raman spectra (Figure 5) of the samples of<br />
1.5%Ag2O⋅98.5%[0.47B2O3(0.53-x)CaOxP2O5] vitreous system are dominated<br />
in intensity by two bands located into the 900-1100 cm -1 spectral interval.<br />
Thus, if the sample x = 0 has a wi<strong>de</strong> band centered around the ~960 cm -1<br />
value, more intense than any other spectrum band, the sample with x = 0.02<br />
reveals two bands in this spectral range at ~992 cm -1 respectively at ~960 cm -1 .<br />
The Raman band at ~960 cm -1 was associated to the borate groups [28,<br />
29], and the separation occurs due to the vibrations caused by the groups<br />
containing phosphorus.<br />
183
RĂZVAN ŞTEFAN, IOAN BRATU, GHEORGHE BORODI, NICOLAE LEOPOLD, VIORICA SIMON<br />
The band at 992 cm -1 was assigned to symmetric stretching vibrations<br />
of the final units PO3 2- (Q 1 species) connected to a borate ring, through<br />
B-O-P linkage and/or to the orthophosphate ions PO4 3- (Qº species) [20, 23].<br />
Because the band at ~992 cm -1 becomes the most intense and narrow line<br />
in the spectra, with the increase of x, one may say that the number of B-O-P<br />
linkages increases in the vitreous network with the increase of the available<br />
phosphorus quantity into the glass composition.<br />
Isolated ions PO4 3- are responsible for the band at ~952 cm -1 [20]<br />
this one being assigned to P-O - bond vibrations in Qº species.<br />
These two aforesaid bands are well <strong>de</strong>fined and narrow comparing<br />
with the other bands occurring in Raman spectra which reveals the existence<br />
of several well <strong>de</strong>fined P2O5 structural units.<br />
184<br />
Figure 5. Raman spectra of 1.5%Ag2O 98.5%[0.47B2O3(0.53-x)CaOxP2O5]<br />
vitreous system<br />
The absence of Raman band at 806 cm -1 indicate the absence of<br />
boroxol rings in the glass structure [15], this band is usually assigned to the<br />
breathing vibrations of this ring and the result is in good agreement with IR<br />
spectral data.<br />
In the spectral range 765-785 cm -1 a relative wi<strong>de</strong> band may be observed<br />
for all the investigated samples, which was assigned [11] to symmetrical<br />
vibrations B-O-B which involves the displacement of oxygen atoms in boroxol
STRUCTURAL INVESTIGATIONS OF AG2O-B2O3-CAO-P2O5 GLASS AND GLASS-CERAMIC SYSTEM<br />
ring only, where one or two BO3 triangles were replaced by BO4 tetrahedral<br />
units or as shown [13] the band at 780 cm -1 has to be correlated with the BO4<br />
units vibrations.<br />
The wi<strong>de</strong> Raman band centered at ~470 cm -1 (x=0) was assigned to<br />
diborate groups and BO4 groups lost by the network [22].<br />
After heat treatment of investigated oxi<strong>de</strong> system significant changes<br />
of Raman spectra can be observed (Figure 6).<br />
Figure 6. Raman spectra of 1.5%Ag2O 98.5%[0.47B2O3(0.53-x)CaOxP2O5]<br />
heat treated system<br />
At x = 0 in the spectral range υ ∈ [900-1100] cm -1 a wi<strong>de</strong> band<br />
assigned to orthoborate units [30] appears, although it is characteristic for pure<br />
borate glass, its origin could not be precisely <strong>de</strong>termined [23]. The band at<br />
~960 cm -1 becomes more intense and sharp with the increase of P2O5 molar<br />
content and the simultaneous presence of Raman bands at ~429 cm -1 ,<br />
~587 cm -1 reveals that the PO4 3- ions vibrations appear into the glass [31]<br />
starting with x = 0.02.<br />
The gradual sharpening of Raman band ~959 cm -1 assigned to (Qº<br />
species) and its increase in intensity represents a spectroscopic confirmation<br />
that the system crystalline domains are due to the structural units that involves<br />
P2O5 and also that the crystalline units number increases as well as the glass<br />
structure changes in glass-ceramics.<br />
185
RĂZVAN ŞTEFAN, IOAN BRATU, GHEORGHE BORODI, NICOLAE LEOPOLD, VIORICA SIMON<br />
The PO4 3- may react with the calcium oxi<strong>de</strong> and form individual groups.<br />
The Raman band at 587 cm -1 was assigned to the symmetric stretching vibrations<br />
of P-O - [13] bonds and appears just once in vitroceramic samples.<br />
In the whole investigated concentration range 0 ≤ x ≤ 0.08, the<br />
structural units building the borate glass network, orthoborate at ~900 cm -1<br />
and dipentaborate [21] at ~759 cm -1 , maintain their position and intensities<br />
which proves that the heat treatment affect only phosphate units.<br />
After the heat treatment a new band at ~1035 cm -1 appears in the<br />
Raman spectra, being assigned to the stretching mo<strong>de</strong> of PO3 symmetric<br />
vibrations (chained end groups) [20, 32]. The band becomes narrow at further<br />
addition of P2O5 into the matrix and has an increased intensity.<br />
In the Raman spectra of heated samples, starting with x = 0.05, on<br />
these frequencies the bands become narrower and the boron ones, diminish<br />
for investigates Ca/P ratio.<br />
The structural modifications highlighted by the Raman spectra following<br />
the heat treatment support the results obtained by means of IR spectroscopy,<br />
meaning that the ten<strong>de</strong>ncy of the vitreous system for crystallization increases<br />
as much as the P2O5 concentration increases, starting with x = 0.05.<br />
CONCLUSIONS<br />
The X-rays diffractogram revealed that the researched system samples<br />
are non-crystalline (vitreous) in the whole composition system researched.<br />
The heat treatment at 650°C for 6 h <strong>de</strong>termined the appearance of crystalline<br />
islands with the following composition: Ca10 (PO4)6 (OH)2.<br />
Glasses from 1.5%Ag2O 98.5%[0.47B2O3(0.53-x)CaOxP2O5] system<br />
were prepared with high modifier glass oxi<strong>de</strong> content. The IR spectra reveal<br />
the existence of BO3 and BO4 groups in different structural units for all<br />
the investigated glasses and glass-ceramics. Raman spectra showed the<br />
crystallization of isolated PO4 3- units as well as the formation of B-O-P linkages.<br />
Structural changes for x ≥ 0.04% induced by heat treatment are revealed by<br />
both spectroscopic techniques.<br />
EXPERIMENTAL<br />
The oxi<strong>de</strong> glass of the 1.5%Ag2O 98.5%[0.47B2O3(0.53-x)CaO xP2O5]<br />
system with 0 ≤ x ≤ 0.08 mol% have been prepared using start materials:<br />
Ag2O, CaCO3, P2O5, H3BO3 of reagent gra<strong>de</strong> purity. The mixtures were melted<br />
in air at 1250°C, in sintered corundum crucibles, and kept for 15 min. at this<br />
temperature. The oxi<strong>de</strong> glasses were partially crystallized by heat treatment<br />
of the samples at 650°C in a single step.<br />
186
STRUCTURAL INVESTIGATIONS OF AG2O-B2O3-CAO-P2O5 GLASS AND GLASS-CERAMIC SYSTEM<br />
X-ray pow<strong>de</strong>r diffraction data were obtained with Bruker D8 Advanced<br />
Diffractometer equipped with Si monochromator for inci<strong>de</strong>nt beam in or<strong>de</strong>r<br />
to obtain only Cu Kα radiation.<br />
The obtained materials were grin<strong>de</strong>d as pow<strong>de</strong>r and mixed with KBr<br />
in or<strong>de</strong>r to obtain 0.3 mm thick discs using the tablet forming technique.<br />
The FTIR spectra characteristic for the vitreous samples and the heat samples<br />
were recor<strong>de</strong>d using a JASCO 6100 spectrometer in the spectral domain<br />
4000-400 cm -1 with a resolution of 4 cm -1 .<br />
The FT-Raman spectra were recor<strong>de</strong>d in backscattering geometry<br />
with a FRA 106/S (Bruker) Raman accessory equipped with nitrogen cooled<br />
Ge <strong>de</strong>tector. The 1064 nm Nd:YAG laser was used as excitation source, and<br />
the laser power was set at 300 mW. The FT-Raman spectra were recor<strong>de</strong>d<br />
with a resolution of ~4 cm -1 .<br />
ACKNOWLEDGMENTS<br />
This work was supported by CNCSIS–UEFISCDI, project number 1117<br />
PNII – IDEI co<strong>de</strong> 2528/2008.<br />
REFERENCES<br />
1. R.K. Brow, J. Non-Cryst. Solids, 1996, 194, 267.<br />
2. C. Dem, I. Ar<strong>de</strong>lean, D. Maniu, T. Iliescu, Asian Chemistry Letters, 1999, 3, 275.<br />
3. E. Culea, Al. Nicula, I. Bratu, Phys. Status Solidi A, 1984, K15, 83.<br />
4. W. Liang, Y. Tu, H. Zhou, C. Liu, C. Rüssel, J. Non-Cryst. Solids, 2011, 357, 958.<br />
5. I. Ahmed, D. Ready, M. Wilson, J. C. Knowles, J. Biomed. Mater. Res.–A, 2006,<br />
79, 618.<br />
6. M. Kawashita, S. Tsuneyama, F. Miyaji, T. Kokubo, H. Kozuba, K. Yamamoto,<br />
Biomaterials, 2000, 21, 393.<br />
7. Y. Xu, J. Cheng, W. Zheng, D. Gao, J. Non-Cryst. Solids, 2008, 354, 1341.<br />
8. Y.B. Peng, D.E. Day, Glass Technol.-Eur. J. Glass Sci. Technol. Part A, 1991,<br />
32, 166.<br />
9. L.L. Hench, J. Mater. Sci.-Mater. M., 2006, 17, 967.<br />
10. L. Baia, R. Stefan, J. Popp, S. Simon, W. Kiefer, J. Non-Cryst. Solids, 2003,<br />
324, 109.<br />
11. H.P. Klug, L.E. Alexan<strong>de</strong>r, “X –ray diffraction procedure for polycrystalline and<br />
amorphous materials”, John Wiley, New York, London, 1974.<br />
12. P.A. Henning et al., Acta Crystallogr. B, 1999, 55, 170.<br />
13. S. Agathopoulos, D.U. Tulyaganov, J.M.G. Ventura, S. Kannan, A. Saranti,<br />
M.A. Karakassi<strong>de</strong>s, J. M. F. Ferreira, J. Non-Cryst. Solids, 2006, 352, 322.<br />
187
RĂZVAN ŞTEFAN, IOAN BRATU, GHEORGHE BORODI, NICOLAE LEOPOLD, VIORICA SIMON<br />
14. J. Krogh-Moe, Phys. Chem. Glasses, 1962, 3, 101.<br />
15. S.P. Yawale, S.V. Paka<strong>de</strong>, C.S. Adgaonkar, Indian J. Pure Ap. Phy., 1995, 33, 34.<br />
16. R. C. Lucacel, C. Marcus, V. Timar, I. Ar<strong>de</strong>lean, Solid State Sci., 2007, 9, 850.<br />
17. M.S. Gaafar, H.A. Afifi, M.M. Mekaway, Physica B, 2009, 404, 1668.<br />
18. L. Kou<strong>de</strong>lka, P. Mośner, Mater. Lett., 2000, 42, 194.<br />
19. S. Rani, S. Sanghi, A. Agarwal, N. Ahlawat, J. Alloy. Compd., 2009, 477, 504.<br />
20. A. Saranti, I. Koutselas, M.A. Karakassi<strong>de</strong>s, J. Non-Cryst. Solids, 2006, 352, 390.<br />
21. E.I. Kamitsos, M.A. Karakassi<strong>de</strong>s, G.D. Chryssikos, J. Phys. Chem. A, 1987, 91,<br />
1073.<br />
22. R.C. Lucacel, I. Ar<strong>de</strong>lean, J. Non-Cryst. Solids, 2007, 353, 2020.<br />
23. J.F. Ducel, J.J. Vi<strong>de</strong>au, M. Couzi, Phys. Chem. Glasses-B, 1993, 34, 212.<br />
24. L. Baia, R. Stefan, W. Kiefer, S. Simon, J. Raman Spectrosc., 2005, 36, 262.<br />
25. A. Chahine, M. Et-Tabirou, M. Elbenaissi, M. Haddad, J.L. Pascal, Mater. Chem.<br />
Phys., 2004, 84, 341.<br />
26. Y. Dimitriev, A. Bachvarova-Ne<strong>de</strong>lcheva, R. Iordanova, Mater. Res. Bull., 2008, 43,<br />
1905.<br />
27. A.M. Efimov, J. Non-Cryst. Solids, 1997, 209, 209.<br />
28. H. Li, H. Lin, W. Chen, L. Luo, J. Non-Cryst. Solids, 2006, 352, 3069.<br />
29. K. Knoblochova, H. Ticha, J. Schwarz, L. Tichy, Opt. Mater., 2009, 31, 895.<br />
30. T. Iliescu, S. Simon, D. Calugar, J. Mol. Struct., 1992, 267, 231.<br />
31. L. Kou<strong>de</strong>lka, P. Mošner, J. Pospisil, L. Montagne, G. Palavit, J. Solid State Chem.,<br />
2005, 178, 1837.<br />
32. A. Moguš-Milanković, A. Santić, S.T. Reis, K. Furić, D.E. Day, J. Non-Cryst. Solids,<br />
2005, 351, 3246.<br />
188
STUDIA UBB CHEMIA, LVI, 1, 2011<br />
STRUCTURAL INVESTIGATION OF<br />
xFE2O3·(70-x)B2O3 ·15ZNO·15CAO GLASSES<br />
BY INFRARED SPECTROSCOPY AND DFT CALCULATIONS<br />
RĂZVAN ŞTEFAN* a , EMIL VINŢELER* b , ALEXANDRU MARCU b ,<br />
GEORGETA TARALUNGA a , SILVANA POPESCU a , IOAN BRATU c<br />
ABSTRACT. The vitreous system xFe2O3·(70-x)B2O3·15ZnO·15CaO with<br />
0 ≤ x ≤ 25 mol% was prepared using the rapid melt quenching method.<br />
The effect of Fe2O3 on the borate glass structure was investigated by IR<br />
spectroscopy and illustrated by Density Functional Theory (DFT) method. The<br />
boron atoms are situated in trigonal [BO3] and tetragonal [BO4] groups and<br />
their ratio <strong>de</strong>pends on Fe2O3 content. Two structural mo<strong>de</strong>ls were built, using<br />
DFT method, in agreement with IR experimental data, one for base glass<br />
70B2O3·15ZnO·15CaO (x = 0 mol%) and another for the highest iron content<br />
in sample 25Fe2O3·45B2O3·15ZnO·15CaO (x = 25 mol%). Calculations with<br />
DFT method show that the addition of iron <strong>de</strong>termines the breaking of B-O<br />
bonds in borate network and increases the number of [BO3] groups.<br />
Keywords: glass, chemical synthesis, infrared spectroscopy<br />
INTRODUCTION<br />
Boron glass network has been investigated and the main structural<br />
units highlighted by different techniques, one of the most important being the<br />
infrared spectroscopy [1]. The borate glass network is built from trigonal [BO3]<br />
units, where every boron atom is situated at the centre of a triangle of oxygen<br />
atoms, and boroxol rings (B3O3Ø3) 0 , which are six-membered planar and<br />
regular B3O3 rings, connected by three bridging oxygens Ø atoms [1,2].<br />
The addition of oxi<strong>de</strong>s (CaO, ZnO or Fe2O3) in the borate glass network<br />
<strong>de</strong>termines the formation of new structural units such as pentaborate<br />
(B5O6Ø4) - , diborate (B4O5Ø4) 2- , triborate (B3O4Ø4) - and ditriborate (B3O5Ø4) 2-<br />
units. These new structural units, containing four-coordinated boron [BO4]<br />
sites, can be revealed by nuclear magnetic resonance [2].<br />
a<br />
University of Agricultural Science and Veterinary Medicine, Biophysics Department, Calea<br />
Mănăştur 3-5, RO-400372 Cluj-Napoca, Romania, Tel. +40 264 596 384, Int. 207, Fax +40 264<br />
593 792, rstefan@usamvcluj.ro<br />
b<br />
Babeş-Bolyai University, Faculty of Physics, Str. M. Kogălniceanu 1, RO-400084 Cluj-Napoca,<br />
Romania, evinteler@phys.ubbcluj.ro<br />
c<br />
National Institute for R&D of Isotopic and Molecular Technology, P.O. Box 700, RO-400293<br />
Cluj-Napoca, Romania
190<br />
R. ŞTEFAN, E. VINŢELER, A. MARCU, G. TARALUNGA, S. POPESCU, I. BRATU<br />
One can obtain in the binary (100-x)Fe2O3·xB2O3 system [3], various<br />
crystalline phases such as: FeBO3, FeBO3-Fe3BO6, α-Fe2O3-Fe3BO6, <strong>de</strong>pending<br />
on preparation condition and compounds ratio. This item of information,<br />
about crystalline phases is rather important as it is used in Density Functional<br />
Theory (DFT) simulations.<br />
Fe2O3 is not a glass network former and this feature makes relatively<br />
difficult to prepare glasses containing a high iron oxi<strong>de</strong> content, but for low<br />
concentration it acts like a network modifier [4], when it is introduced within<br />
borate glass. The glass-forming region of the ternary Fe2O3–Bi2O3–B2O3<br />
system [5] shows that the glass structure can be obtained, in the binary<br />
Fe2O3–B2O3 system, only for molar content of Fe2O3 lower than 5%. The<br />
addition of zinc, barium and calcium oxi<strong>de</strong>s enlarges the glass formation<br />
domain in Fe2O3–B2O3 system up to 25 mol% Fe2O3 [6-8].<br />
In the present work, glasses with the molar composition<br />
xFe2O3·(70-x)B2O3·15ZnO·15CaO, with 0 ≤ x ≤ 25 mol%, were prepared.<br />
The structure and the effects of Fe2O3 on the glass network were investigated<br />
by IR spectroscopy. For x = 0 mol% and 25 mol%, two mo<strong>de</strong>ls were built by<br />
using DFT method.<br />
RESULTS AND DISCUSSION<br />
IR Spectra of vitreous xFe2O3·(70-x)B2O3·15ZnO·15CaO system<br />
Figure 1 shows the FT-IR spectra of the xFe2O3·(70-x)B2O3·15ZnO·<br />
15CaO with 0 ≤ x ≤ 25 mol%. The borate glasses FT-IR spectra within range<br />
of 400-1600 cm -1 were divi<strong>de</strong>d in three main regions [1, 9] associated with:<br />
bending of B-O-B linkages in the borate network between 400–790 cm -1 ;<br />
B-O bond stretching in tetrahedral [BO4] units between 790–1140 cm -1 and<br />
asymmetric B-O stretching vibration in triangular [BO3] units in the spectral<br />
range 1140–1600 cm -1 .<br />
Usually in glass IR spectra appear as overlapping bands belonging<br />
to various borate units and this feature makes difficult to <strong>de</strong>tect a separate<br />
and clear vibrations by IR analysis.<br />
In the above mentioned spectral range, the shapes of bands (Fig. 1)<br />
are <strong>de</strong>pen<strong>de</strong>nt on Fe2O3 molar content, being more narrow for base glass<br />
70B2O3·15ZnO·15CaO, while for high iron concentration broad bands<br />
appear in the same spectral range.<br />
Thus the shoul<strong>de</strong>r at 1212 cm -1 , attributed to B-O bond vibrations in<br />
metaborate chains, increases in relative intensity when comparing with band<br />
at 1405 cm -1 , attributed to B-O bond vibration in [BO3] units, with the increase<br />
of Fe2O3 content [10-13]. This <strong>de</strong>notes the increase in metaborate chains<br />
(B3O5Ø2) 3- number.
STRUCTURAL INVESTIGATION OF xFE2O3·(70-x)B2O3 ·15ZNO·15CAO GLASSES BY INFRARED …<br />
The <strong>de</strong>crease in relative intensity of the broad band at ~958 cm -1 ,<br />
when comparing with bands at ~849 cm -1 and ~1091 cm - 1, indicates the<br />
<strong>de</strong>crease of diborate units number, with the increase of Fe2O3. The absorption<br />
band at 683 cm -1 , attributed to B-O-B linkage bending vibration [10] become<br />
higher than the envelope that contain [BO4] specific vibration, i.e., 790-1140<br />
cm -1 , during the replacement of B2O3 by Fe2O3 in the glass composition [9].<br />
Figure 1. The FT-IR absorption spectra of xFe2O3·(70-x)B2O3·15ZnO·15CaO glasses<br />
with 0 ≤ x ≤ 25 mol%. In the inset picture the <strong>de</strong>convolution bands of FT-IR<br />
spectrum for x = 0 mol% is presented<br />
The structural changes associated with the Fe2O3 addition have been<br />
analyzed on the basis of the ratio Ar = A4/A3, A4 and A3 being calculated as the<br />
integral of the absorption signal in the 790-1140 cm -1 (A4) and 1140-1600 cm -1<br />
(A3) spectral ranges [14]. The quantities A4 and A3 reflect the relative content<br />
of tetrahedral [BO4] and triangular [BO3] borate species, respectively. The Ar<br />
ratio versus Fe2O3 content is given in Figure 2.<br />
For all the investigated glasses, the Ar values are lower than 1, showing<br />
the prevalence of [BO3] units in these glass structures. The presence of [BO4]<br />
units, for x = 0 mol%, in the absence of iron in the glass bulk and the continuous<br />
<strong>de</strong>crease of the Ar ratio <strong>de</strong>monstrates that the [BO4] units are replaced by<br />
[BO3] units when the Fe2O3 content increases in the glass composition as<br />
well as the network modifying role played by Fe cations [6].<br />
191
192<br />
R. ŞTEFAN, E. VINŢELER, A. MARCU, G. TARALUNGA, S. POPESCU, I. BRATU<br />
Figure 2. Values of the Ar ratio versus x in xFe2O3·(70-x) B2O3·15ZnO·15CaO<br />
A more in-<strong>de</strong>pth study of the FT-IR spectra, presenting large bands,<br />
characteristic for glasses, needs spectra <strong>de</strong>convolution. In the inset of<br />
Figure 1 is presented the <strong>de</strong>convolution of FT-IR spectrum in the region<br />
400-1600 cm -1 for x = 0 mol%. Thus in the region 400-1600 cm -1 <strong>de</strong>convolution<br />
reveals the appearance of 10 bands (for x = 0 mol%) at ~570 cm -1 , ~691 cm -1 ,<br />
~776 cm -1 , ~836 cm -1 , ~958 cm -1 , ~1103 cm -1 , ~1212 cm -1 , ~1273 cm -1 ,<br />
~1394 cm -1 and ~1503 cm -1 , respectively. The <strong>de</strong>convoluted spectra for all<br />
investigated samples, with characteristic <strong>full</strong> widths at half maximum (FWHM)<br />
and relative areas, are presented in Table 1. The relative area is the component<br />
band area divi<strong>de</strong>d by the area of the <strong>full</strong> spectrum in the region 400-1600 cm -1 .<br />
The wavenumber bands in spectral range 400-790 cm -1 , assigned to<br />
borate network bending vibrations, maintain the same spectral position within<br />
the investigated compositional range.<br />
The band at ~1212 cm -1 (Table 1) shifts to 1181 cm -1 , attributed to<br />
B-O bond vibrations in pyro- (B2O5) 4- and orthoborates (BO3) 3 , indicating the<br />
gradual transformation of metaborate chains into pyro- and orthoborates units.<br />
The band at ~1273 cm -1 , attributed to B-O bond vibrations in tri- (B3O4Ø4) - ,<br />
tetra- (B8O10Ø6) - and pentaborate (B5O6Ø4) - groups [9, 10, 11], shifts to 1297 cm -1 ,<br />
attributed to B-O bond vibrations [11-13] in pyro- and orthoborates, indicating<br />
the transformation of previous mentioned groups into pyro- and orthoborates.<br />
The shift to lower wanumber values of the band at around 1103 cm -1<br />
(Table 1) attributed to B-O vibration in [BO3] units, <strong>de</strong>monstrates the strong<br />
influence of Fe2O3 on borate network.
STRUCTURAL INVESTIGATION OF xFE2O3·(70-x)B2O3 ·15ZNO·15CAO GLASSES BY INFRARED …<br />
Table 1. Deconvolution parameters of the experimental infrared spectra of<br />
xFe2O3·(70-x)B2O3·15ZnO·15CaO glasses (C is the component band centre (cm -1 ),<br />
W is the band <strong>full</strong> width at half maximum (cm -1 ) and A is the relative area (%)<br />
of the component band).<br />
x=0 C<br />
W<br />
A<br />
x=0.5 C<br />
W<br />
A<br />
x=1 C<br />
W<br />
A<br />
x=5 C<br />
W<br />
A<br />
x=7 C<br />
W<br />
A<br />
x=15 C<br />
W<br />
A<br />
x= 25 C<br />
W<br />
A<br />
570<br />
158<br />
6<br />
570<br />
158<br />
6<br />
570<br />
158<br />
7<br />
570<br />
158<br />
5<br />
570<br />
158<br />
4<br />
570<br />
136<br />
3<br />
570<br />
141<br />
4<br />
691<br />
121<br />
9<br />
691<br />
121<br />
9<br />
691<br />
109<br />
9<br />
691<br />
109<br />
9<br />
688<br />
109<br />
10<br />
690<br />
113<br />
12<br />
694<br />
100<br />
10<br />
776<br />
97<br />
2<br />
776<br />
85<br />
2<br />
776<br />
73<br />
1<br />
-<br />
-<br />
-<br />
-<br />
-<br />
-<br />
-<br />
-<br />
-<br />
-<br />
-<br />
-<br />
836<br />
109<br />
4<br />
836<br />
109<br />
4<br />
848<br />
97<br />
4<br />
836<br />
121<br />
5<br />
843<br />
121<br />
5<br />
868<br />
110<br />
4<br />
889<br />
98<br />
4<br />
958<br />
230<br />
24<br />
958<br />
219<br />
23<br />
958<br />
218<br />
22<br />
958<br />
218<br />
22<br />
963<br />
218<br />
19<br />
989<br />
183<br />
14<br />
993<br />
130<br />
8<br />
1103<br />
133<br />
8<br />
1103<br />
145<br />
9<br />
1091<br />
145<br />
9<br />
1091<br />
133<br />
8<br />
1087<br />
133<br />
7<br />
1076<br />
92<br />
4<br />
1066<br />
88<br />
4<br />
1212<br />
73<br />
3<br />
1212<br />
73<br />
2<br />
1212<br />
84<br />
3<br />
1212<br />
85<br />
3<br />
1204<br />
85<br />
5<br />
1189<br />
112<br />
9<br />
1181<br />
114<br />
11<br />
1273<br />
145<br />
12<br />
1261<br />
145<br />
11<br />
1261<br />
158<br />
12<br />
1261<br />
170<br />
13<br />
1268<br />
170<br />
12<br />
1299<br />
188<br />
29<br />
1297<br />
185<br />
34<br />
1394<br />
194<br />
14<br />
1406<br />
170<br />
15<br />
1394<br />
194<br />
13<br />
1394<br />
218<br />
18<br />
1344<br />
218<br />
9<br />
1403<br />
116<br />
10<br />
1410<br />
121<br />
15<br />
1503<br />
230<br />
18<br />
1503<br />
230<br />
19<br />
1503<br />
230<br />
20<br />
1503<br />
230<br />
17<br />
1469<br />
230<br />
29<br />
1500<br />
133<br />
15<br />
1500<br />
102<br />
10<br />
The introduced iron ions break the B-O bond in the vitreous<br />
structure and the [BO3] number increase as well as the nonbridging oxygen<br />
atoms O ¯ . The more disor<strong>de</strong>red glass structure is illustrated by broa<strong>de</strong>ning<br />
of the IR absorption lines (Fig. 1) in spectral range 1140-1600 cm -1 .<br />
Density Functional Theory Calculations<br />
The spectroscopic results reveal a complex network of iron borate<br />
glasses with zinc and calcium formed from di- (B4O5Ø4)<br />
193<br />
2- , meta- chain<br />
(B3O5Ø2) 3- , pyro- (B2O5) 4- and orthoborate (BO3) 3- groups.<br />
For the construction of the mo<strong>de</strong>ls the crystallographic data were<br />
utilized for iron borate crystals: vonsenite Fe3BO5, Fe3BO6 isostructural with<br />
nobergite, and FeBO3, isostructural with calcite [16-18]. Thus in the crystal<br />
Fe3BO6, the iron atoms are six-coordinated by oxygen atoms and are disposed<br />
in distorted octahedra and the boron atom is exclusively tetrahedral-coordinated<br />
by oxygen atoms. In FeBO3 and Fe3BO5 crystals, the boron atom is trigonalcoordinated<br />
by oxygen atoms.
194<br />
R. ŞTEFAN, E. VINŢELER, A. MARCU, G. TARALUNGA, S. POPESCU, I. BRATU<br />
Two <strong>full</strong>y optimized structural mo<strong>de</strong>ls were constructed and are shown<br />
in Figures 3a and 3b. The first and the second mo<strong>de</strong>l simulates the structure<br />
of random network of 5B2O3·1ZnO·1CaO glass (mo<strong>de</strong>l I in Fig. 3a with<br />
71.43%B2O3, 14.285%ZnO and 14.285% CaO) and 2Fe2O3·3B2O3·1ZnO·1CaO<br />
glass (mo<strong>de</strong>l II in Fig. 3b with 28.57% Fe2O3, 42.86% B2O3, 14.285% ZnO and<br />
14.285% CaO), respectively.<br />
The utilized simulation method is able to provi<strong>de</strong> a realistic <strong>de</strong>scription of<br />
the iron borate glass with zinc and calcium xFe2O3·(70-x)B2O3·15ZnO· 15CaO<br />
for x = 0 mol% and x = 25 mol%.<br />
For each proposed mo<strong>de</strong>l we performed direct optimization of the<br />
geometry with the help of B3LYP/LanL2DZ [19-26] method and using Gaussian<br />
09 program [27].<br />
Frequency analysis followed all optimizations in or<strong>de</strong>r to establish<br />
the nature of the stationary points found, so that all the reported structures<br />
in this study are genuine minima on the potential energy surface, without any<br />
imaginary frequencies. For the proposed mo<strong>de</strong>ls we calculated vibrational<br />
frequencies with IR absorption intensities using the same method and basis set.<br />
The simulated vibrational frequencies are listed in Table 2 and compared<br />
with the values obtained from the <strong>de</strong>convolution of experimental spectra for<br />
x = 0 and x = 25 mol% (x = moles number of Fe2O3 content in glass). A scaling<br />
factor of 0.961 was applied to the infrared simulated frequencies.<br />
The bands assignment is in agreement with previous IR studies on<br />
borate glasses [9-15].<br />
The two investigated mo<strong>de</strong>ls, <strong>de</strong>scribing the random network in the<br />
xFe2O3·(70-x)B2O3·15ZnO·15CaO glass with x=0 and x=25 mol% are highly<br />
possible. The probability to find the simulated structure in vitreous state is higher<br />
for a more stable structure with a lower energy per atom. We obtained for,<br />
mo<strong>de</strong>l I without iron, and for mo<strong>de</strong>l II with iron, the Hartree-Fock energy<br />
value per atom E = -50.968 au/atom and E = -65.662 au/atom, respectively.<br />
Table 2. Infrared vibrational properties of xFe2O3·(70-x) B2O3·15ZnO·15CaO<br />
glasses for x = 0 mol% and x = 25 mol% inferred from Gaussian <strong>de</strong>convolution of<br />
the experimental results and quantum-chemical calculations.<br />
Experimental Frequency<br />
[cm -1 Theoretical Frequency<br />
]<br />
[cm -1 ]<br />
IR assignment<br />
x = 0 x = 25 x = 0 x = 25<br />
570 570 591 568 O-B-O bond bending vibrations<br />
691 694 679 710<br />
B-O-B bond bending vibrations between<br />
two [BO3] units<br />
776 - 777 774<br />
B-O-B bond bending vibrations between<br />
[BO3] and [BO4] units<br />
836 839<br />
B-O symmetric stretching vibrations in<br />
[BO4] units in borate rings
STRUCTURAL INVESTIGATION OF xFE2O3·(70-x)B2O3 ·15ZNO·15CAO GLASSES BY INFRARED …<br />
Experimental Frequency<br />
[cm -1 Theoretical Frequency<br />
]<br />
[cm -1 ]<br />
x = 0 x = 25 x = 0 x = 25<br />
958<br />
889 872<br />
928<br />
960<br />
992<br />
IR assignment<br />
B-O symmetric stretching vibrations in [BO4]<br />
units from tri-, tetra- and pentaborate groups<br />
B-O bond vibrations in diborate groups<br />
993<br />
933<br />
972<br />
B-O symmetric stretching vibrations in pyroand<br />
orthoborates shifted by Fe cations<br />
1066<br />
1067<br />
1102<br />
B-O asymmetric stretching vibrations in pyroand<br />
orthoborates shifted by Fe cations<br />
1103<br />
1105<br />
1121<br />
B-O asymmetric stretching vibrations in [BO4]<br />
units in tri-, tetra- and pentaborate groups<br />
1212 1173 B-O bond vibrations in metaborate chains<br />
1181 1210 B-O bond vibrations in pyro- and orthoborates<br />
1234<br />
B-O asymmetric stretching vibrations in<br />
1273<br />
1256<br />
[BO3] units in tri-, tetra- and pentaborate<br />
1274<br />
groups<br />
1297<br />
1256<br />
1307<br />
1346<br />
B-O asymmetric stretching vibrations in<br />
[BO3] units in pyro- and orthoborates<br />
1394<br />
1383<br />
1399<br />
1428<br />
B-O asymmetric stretching in [BO3] units in<br />
various borate rings<br />
1410<br />
1413<br />
1428<br />
B-O asymmetric stretching vibrations in<br />
[BO3] units in ortho-borates<br />
1503 1500<br />
1468<br />
1538<br />
B-O - bond vibrations<br />
The borate network of mo<strong>de</strong>l I is build from (Fig. 3a):<br />
i) one diborate unit (B4O5Ø4) 2- formed from two trigonal boron<br />
atoms B1 and B4 and two tetrahedral boron atoms B2 and<br />
B3 linked by a common oxygen atom,<br />
ii) one borate ring unit (B4O4Ø5) - formed from three trigonal boron<br />
atoms B4, B5 and B6 and one tetrahedral boron atom B2,<br />
iii) one metaborate chain unit (B3O5Ø2) 3- formed from four<br />
trigonal boron atoms B<br />
7, B8, B9 and B10,<br />
iv) one zinc cation (two-coordinated) and one calcium cation<br />
(four-coordinated).<br />
195
196<br />
R. ŞTEFAN, E. VINŢELER, A. MARCU, G. TARALUNGA, S. POPESCU, I. BRATU<br />
a<br />
Figure 3. The optimized structures of two possible mo<strong>de</strong>ls obtained by DFT<br />
computations: a) 5B2O3·1ZnO·1CaO glass (mo<strong>de</strong>l I);<br />
b) 2Fe2O3·3B2O3·1ZnO·1CaO glass (mo<strong>de</strong>l II).<br />
The borate network of mo<strong>de</strong>l II is build from (see Fig. 3b):<br />
i) four orthoborate units (BO3) 3- containing the trigonal boron<br />
atoms B1, B2, B3 and B4,<br />
ii) one pyroborate unit (B2O5) 4- containing the trigonal boron<br />
atoms B5 and B6,<br />
iii) four iron cations (three-coordinated), one zinc cation<br />
(two-coordinated) and one calcium cation (four-coordinated).<br />
CONCLUSIONS<br />
The addition of iron oxi<strong>de</strong> (0 ≤ x ≤ 25 mol%) to borate 70B2O3·<br />
15ZnO·15CaO glasses, with a high content of B2O3, <strong>de</strong>termines important<br />
changes in the boron network at intermediate-distance or<strong>de</strong>r. By using the<br />
infrared spectroscopy the main structural units [BO4] and [BO3] of the glass<br />
network have been studied and also the gradual conversion of tetrahedral<br />
boron units in trigonal ones.<br />
DFT calculations show that the conversion of structural groups as well<br />
as creation of new groups at intermediate distance, is due to the insertion<br />
of iron cations and the break-up of B-O bonds in borate network as well.<br />
DFT calculations are in good agreement with IR experimental spectra of<br />
xFe2O3·(70-x)B2O3·15ZnO·15CaO vitreous system for x = 0 mol% and x = 25<br />
mol%.<br />
b
STRUCTURAL INVESTIGATION OF xFE2O3·(70-x)B2O3 ·15ZNO·15CAO GLASSES BY INFRARED …<br />
EXPERIMENTAL SECTION<br />
Samples from xFe2O3·(70-x)B2O3·15ZnO·15CaO vitreous system with<br />
0 ≤ x ≤ 25 mol% were prepared using pure reagent-gra<strong>de</strong> compounds, i.e.,<br />
H3BO3, Fe2O3, ZnO and CaO, in appropriate ratios. The mixtures corresponding<br />
to the <strong>de</strong>sired compositions were melted in air, in sintered corundum crucibles,<br />
in an electric furnace at 1200ºC, t = 15 min. The melts were quickly cooled<br />
to room temperature by pouring onto stainless-steel plates.<br />
The structure of the samples was examined by means of X-ray diffraction<br />
using a standard Bruker X D8 Advance diffractometer with a Si monochromator<br />
for inci<strong>de</strong>nt beam in or<strong>de</strong>r to obtain only CuKa radiation (λ = 1.5406 Å). The<br />
diffractograms have been measured in the range of 2θ = 0-90º. The analysis<br />
was ma<strong>de</strong> on pow<strong>de</strong>red samples to satisfy the diffraction condition of Bragg.<br />
The amorphous nature of the glass un<strong>de</strong>r investigation was confirmed by<br />
the absence of any sharp peaks in X-ray diffraction patterns.<br />
The Fourier-Transform infrared (FT-IR) absorption spectra were recor<strong>de</strong>d<br />
with a JASCO 6100 spectrophotometer, at room temperature, in the range<br />
400-4000 cm -1 , with a resolution of 4 cm -1 , using the KBr pellet technique.<br />
For each proposed mo<strong>de</strong>l of xFe2O3·(70-x)B2O3·15ZnO·15CaO with<br />
x=0 mol% and x=25 mol% we performed direct optimization of the geometry<br />
with the help of B3LYP/LanL2DZ method and using Gaussian 09 program [27].<br />
Dangling bonds of outer atoms of the mo<strong>de</strong>ls were saturated with hydrogen<br />
atoms. After attaining the equilibrium configuration of the mo<strong>de</strong>ls, we calculated<br />
vibrational frequencies with IR absorption intensities using the same method<br />
and basis set.<br />
ACKNOWLEDGMENTS<br />
This work was supported by CNCSIS–UEFISCSU, project number 1117<br />
PNII – IDEI co<strong>de</strong> 2528/2008.<br />
REFERENCES<br />
1. Y.D. Yiannopoulos, G.D. Chryssikos, E.I. Kamitsos, Phys. Chem. Glass, 2001,<br />
42, 164.<br />
2. P.J. Bray, Inorg. Chim. Acta, 1999, 289, 158.<br />
3. H. Makram, L. Touren, J. Loners, J. Cryst. Growth, 1972, 585, 13.<br />
4. L. Baia, R. Stefan, J. Popp, S. Simon, W. Kiefer, J. Non-Cryst. Solids, 2003, 324, 109.<br />
5. H.H. Qiu, T. Ito, H. Sakata, Mater. Chem. Phys., 1999, 58, 243.<br />
6. I. Ar<strong>de</strong>lean, P. Pascuta, Mater. Lett., 2004, 58, 3499.<br />
7. M. To<strong>de</strong>raş, S. Filip, I. Ar<strong>de</strong>lean, J. Optoelectron. Adv. M., 2006, 8(3), 1121.<br />
197
198<br />
R. ŞTEFAN, E. VINŢELER, A. MARCU, G. TARALUNGA, S. POPESCU, I. BRATU<br />
8. S. Hiroshi, J. Jpn. I. Met., 2004, 68(2), 152.<br />
9. C.P. Varsamis, E.I. Kamitsos, G.D. Chryssikos, Solid State Ionics, 2000, 136, 1031.<br />
10. E.I. Kamitsos, M.A. Karakassi<strong>de</strong>s, G.D. Chryssikos, Phys. Chem. Glass., 1986,<br />
90, 4528.<br />
11. S.G. Motke, S.P. Yawale, S.S. Yawale, Bull. Mater. Sci., 2002, 25, 75.<br />
12. J.F. Ducel, J.J. Vi<strong>de</strong>au, M. Couzi, Phys. Chem. Glasses, 1993, 34, 212.<br />
13. S.P. Yawale, S.V. Paka<strong>de</strong>, C.S. Adgaonka, Indian J. Pure Ap. Phy., 1995, 33, 34.<br />
14. M.S. Gaafar, H.A. Afifi, M.M. Mekaway, Physica B, 2009, 404, 1668.<br />
15. E.I. Kamitsos, M.A. Karakassi<strong>de</strong>s, G.D. Chryssikos, J. Phys. Chem., 1987, 91, 1073.<br />
16. J.S. Swinnea, H. Steinfink, Am. Mineral., 1983, 68, 827.<br />
17. J.G. White, A. Miller, R.E. Nielsen, Acta Crystallogr., 1965, 19, 1060.<br />
18. R. Diehl, Solid State Commun., 1975, 17(6), 74.<br />
19. A.D. Becke, J. Chem. Phys., 1993, 98, 1372.<br />
20. A.D. Becke, Phys. Rev. A, 1988, 38 (6), 3098.<br />
21. Chengteh Lee, Weitao Yang and Robert G. Parr, Phys. Rev. B, 1988, 37, 785.<br />
22. S.H. Vosko, L. Wilk and M. Nusair, Can. J. Phys., 1980, 58, 1200.<br />
23. T.H. Dunning Jr., P.J. Hay, In: Mo<strong>de</strong>rn Theoretical Chemistry, H. F. Schaefer III,<br />
Vol. 3 Plenum, New York, 1976, 1.<br />
24. P.J. Hay and W.R. Wadt, J. Chem. Phys., 1985, 82, 270.<br />
25. P.J. Hay and W.R. Wadt, J. Chem. Phys., 1985, 82, 299.<br />
26. W.R. Wadt and P.J. Hay, J. Chem. Phys., 1985, 82, 284.<br />
27. M.J. Frisch, G.W. Trucks, H.B. Schlegel, G.E. Scuseria, M.A. Robb, J.R. Cheeseman,<br />
G. Scalmani, V. Barone, B. Mennucci, G.A. Petersson, H. Nakatsuji, M. Caricato,<br />
X. Li, H.P. Hratchian, A.F. Izmaylov, J. Bloino, G. Zheng, J.L. Sonnenberg, M. Hada,<br />
M. Ehara, K. Toyota, R. Fukuda, J. Hasegawa, M. Ishida, T. Nakajima, Y. Honda,<br />
O. Kitao, H. Nakai, T. Vreven, J. A. Montgomery, Jr., J.E. Peralta, F. Ogliaro,<br />
M. Bearpark, J.J. Heyd, E. Brothers, K.N. Kudin, V.N. Staroverov, R. Kobayashi,<br />
J. Normand, K. Raghavachari, A. Ren<strong>de</strong>ll, J.C. Burant, S.S. Iyengar, J. Tomasi,<br />
M. Cossi, N. Rega, J.M. Millam, M. Klene, J.E. Knox, J.B. Cross, V. Bakken,<br />
C. Adamo, J. Jaramillo, R. Gomperts, R.E. Stratmann, O. Yazyev, A.J. Austin,<br />
R. Cammi, C. Pomelli, J.W. Ochterski, R.L. Martin, K. Morokuma, V.G. Zakrzewski,<br />
G.A. Voth, P. Salvador, J.J. Dannenberg, S. Dapprich, A.D. Daniels, Ö. Farkas,<br />
J.B. Foresman, J.V. Ortiz, J. Cioslowski, D.J. Fox, Gaussian 09, Revision A.1,<br />
Gaussian, Inc., Wallingford CT, 2009.
STUDIA UBB CHEMIA, LVI, 1, 2011<br />
STRUCTURE AND VIBRATIONAL SPECTRUM OF L-LEUCINE:<br />
A DFT-PCM INVESTIGATION<br />
CAMELIA BERGHIAN GROŞAN* a , VALER ALMĂŞAN a<br />
ABSTRACT. The structure of L-Leucine in solution was examined using<br />
Density Functional Theory coupled with the Polarized Continuum Mo<strong>de</strong>l<br />
(DFT-PCM). The geometry of L-Leucine zwitterion was studied with the<br />
B3LYP/6-311++G(d,p)-PCM method and the results were compared with<br />
those previously reported in the literature for X-ray diffraction of L-Leucine.<br />
The vibrational frequencies calculated on the most stable zwitterionic<br />
conformer of L-Leucine at B3LYP/6-311++G(d,p) were unscaled and in<br />
good agreement with the experimental data.<br />
Keywords: L-Leucine, zwitterions, DFT-PCM, vibrational spectroscopy<br />
INTRODUCTION<br />
L-Leucine ((2S)-2-Amino-4-methylpentanoic acid) is an essential<br />
Branched-Chain Amino Acid (BCAA) like L-Isoleucine and L-Valine.<br />
COO-<br />
+<br />
H3N C H<br />
CH<br />
H 3C CH 3<br />
COO<br />
-<br />
+<br />
H3N C H<br />
H 3C<br />
CH 2<br />
CH<br />
CH 3<br />
COO<br />
-<br />
+<br />
H3N C H<br />
HC<br />
CH 2<br />
CH 3<br />
L-Valine L-Leucine<br />
L-Isoleucine<br />
Scheme 1.<br />
It is a non-polar and hydrophobic amino acid occurring in proteins<br />
about 9.1 % [1]. It is synthesized in living systems being involved in regulations<br />
of blood sugar levels and muscular tissue repairing process. Leucine also<br />
has a significant contribution in the binding of hydrophobic ligands (lipids)<br />
playing an important role in the substrate recognition [2].<br />
a National Institute for Research and Development of Isotopic and Molecular Technologies<br />
65-103 Donath Str., RO-400293 Cluj-Napoca, Romania, *camelia.grosan@itim-cj.ro<br />
CH 3
CAMELIA BERGHIAN GROŞAN, VALER ALMĂŞAN<br />
According to [1, 3] in solution at neutral pH, L-Leucine has a predominant<br />
zwitterionic form when the amino group is protonated (-NH3<br />
200<br />
+ ) and the<br />
carboxyl group is <strong>de</strong>protonated (-COO - ) while the occurance of the nonionic<br />
form with amine (-NH2) and carboxyl (-COOH) groups is insignificant.<br />
On the other hand, it is know that vibrational spectroscopy is able as<br />
well to provi<strong>de</strong> information on the general aspects of proteins i.e. structure<br />
and dynamics [4]. Thus, due to the protein sensitivity to infrared irradiation<br />
(e.g. vibrational spectroscopic measurements are responsive to pH, phase,<br />
solvent polarity and temperature), the use of a mo<strong>de</strong>l substrate, such as an<br />
amino acid, is essential. In addition, a theoretical study is usually required<br />
in or<strong>de</strong>r to facilitate the interpretation of infrared spectra.<br />
To the best of our knowledge, but a few theoretical (conformational<br />
and vibrational) studies focused on L-Leucine were published [2, 5-7].<br />
Recently, Rai et al. [2] proposed for L-Leucine fifteen stable conformers<br />
in the gas phase, obtained by geometry optimization at the B3LYP/6-311++G(d,p)<br />
level. Thus, they analyzed the predicted vibrational infrared spectra of various<br />
nonionic L-Leucine conformers. Next, they realized a systematic search on<br />
the existence of zwitterionic form of L-Leucine in gas phase and found that<br />
the zwitterionic structures revert spontaneously into the canonical form on<br />
optimization.<br />
Lin<strong>de</strong>r et al. [5] investigated, by experimental and theoretical methods,<br />
the gas-phase IR spectra of some natural amino acid including L-Leucine.<br />
Since they used high temperature (570 K), their study consi<strong>de</strong>red limited<br />
conformational states and non-hydrogen bon<strong>de</strong>d structures to assume that<br />
different conformations would have similar spectra.<br />
In 2010, Dokmaisrijan et al. [7] proposed the eight minimum energy<br />
conformers of L-Leucine obtained at MP2/6-311++G(2d,2p) level in the gas<br />
phase. Their results, relative stability or<strong>de</strong>r and some conformational properties<br />
of the most stable conformer, were significantly different from the above<br />
ones of Rai et al. [2]. They also analyzed the effects of intermolecular H-bond<br />
and si<strong>de</strong>-chain orientations on the relative stability of L-Leucine.<br />
It is worth to emphasize that these studies [2, 5, 7] consi<strong>de</strong>red but the<br />
gas-phase state of L-Leucine. This approach may be insufficient as ina<strong>de</strong>quate<br />
for the complete <strong>de</strong>scription of biological molecules in their natural medium,<br />
aqueous solution.<br />
In or<strong>de</strong>r to accomplish such a theoretical simulation, it is possible to<br />
take into account the solvent effect in two ways i) a certain number of solvent<br />
molecules are placed around the solute and ii) the solvent is consi<strong>de</strong>red as<br />
a continuum medium (with specific physical properties) and the solute molecule<br />
is placed in a cavity within the solvent [8].<br />
Vibrational analysis of L-Leucine in hydrated media was previously<br />
reported by Derbel et al. [6]. They found that if the amino acid was surroun<strong>de</strong>d<br />
by twelve water molecules, a good correlation between theoretical calculation<br />
at B3LYP/6-31++G(d) level of theory and experimental data occurred.
STRUCTURE AND VIBRATIONAL SPECTRUM OF L-LEUCINE: A DFT-PCM INVESTIGATION<br />
Hence, in or<strong>de</strong>r to study the stability of L-Leucine zwitterions in aqueous<br />
solution, for the present exploration we applied a <strong>de</strong>nsity functional method<br />
(DFT/B3LYP) in conjunction with a continuum solvation mo<strong>de</strong>l, Polarized<br />
Continuum Mo<strong>de</strong>l (PCM). This mo<strong>de</strong>l uses a cavity of overlapping spheres<br />
centered on the solute atoms and apparent surface charges that <strong>de</strong>pend on<br />
the dielectric constant ε of the solvent.<br />
We also reporte herein the calculated I.R. spectrum of L-Leucine<br />
zwitterion at the B3LYP/6-311++G(d,p) level together with a tentative assignment<br />
of its vibrational mo<strong>de</strong>s. Thus, all our calculations were carried out using<br />
Gaussian03 Package [9]. To display the molecular structure and the simulated<br />
I.R. spectra, the Program we used for visualization was Gabedit 2.3.0 [10]. The<br />
Avogadro 1.0.1 Program provi<strong>de</strong>d information on vibrational mo<strong>de</strong>s [11].<br />
RESULTS AND DISCUSSION<br />
1. Molecular geometry<br />
The atom numbering and the most stable zwitterionic conformer of<br />
L-Leucine optimized at B3LYP/6-311++G(d,p) in aqueous solution employing<br />
PCM mo<strong>de</strong>l (DFT-PCM) are shown in Figure 1.<br />
The calculations were realized on two geometries i) the X-ray zwitterionic<br />
L-Leucine from leucin01 [12] and ii) the zwitterionic structure obtained by<br />
transferring the proton from the carboxyl group to the amino group in the<br />
lowest-energy gas-phase conformer reported by Rai et al [2].<br />
Starting from structures i) and ii), two optimized geometries were<br />
obtained. For these geometries, we performed frequency calculations in or<strong>de</strong>r<br />
to assess which one represents the global minima. The results revealed<br />
that the geometry of X-ray zwitterionic L-Leucine optimized using PCM, to<br />
inclu<strong>de</strong> the effect of water, at the B3LYP/6-311+G(d,p) level is not a global<br />
minimum because we found three imaginary frequencies.<br />
Next, no imaginary frequency was found for the second zwitterionic<br />
structure optimized at the DFT-PCM (water) level; that is, the geometry<br />
<strong>de</strong>picted in Figure 1 is a true minimum on the Potential Energy Surface (PES).<br />
Table 1 lists the selected optimized geometrical parameters of the<br />
structure studied in aqueous solution by DFT-PCM. Our results are compared<br />
with the DFT data previously reported for L-leucine + 12H2O (DFT in hydrated<br />
media) [6] and the corresponding experimental X-ray values [12].<br />
The intramolecular N-H...O interaction is a characteristic feature for<br />
several α-amino acids both in crystal state and in solution. The two or threecenter<br />
intermolecular N-H...O hydrogen bonds are met in crystal structures<br />
of non-polar amino acids (L-Leucine crystallizes as hydrogen-bon<strong>de</strong>d dimmers)<br />
[13]. In solution, our theoretical study revealed a value of 1.87 Å for the<br />
201
202<br />
CAMELIA BERGHIAN GROŞAN, VALER ALMĂŞAN<br />
intramolecular hydrogen bond between one ammonium hydrogen and one<br />
carboxylic oxygen atom (H-9-O-2, Figure 1). Following this intramolecular<br />
hydrogen bond interaction, in our mo<strong>de</strong>l, the atoms N-6, C-4, C-1, O-2 were<br />
close to planarity, with a N-6-C-4-C-1-O-2 dihedral angle of -9.3 <strong>de</strong>gree<br />
meanwhile in the X-ray structure the N-6-C-4-C-1-O-2 dihedral angle is<br />
about -31.7 <strong>de</strong>gree.<br />
Figure 1. Optimized molecular structure of L-Leucine using PCM<br />
(water) mo<strong>de</strong>l at B3LYP/6-311++G(d,p) level of theory.<br />
In our PCM mo<strong>de</strong>l, the optimized values for the N-H bond lengths<br />
were shorter than the corresponding ones issued from the DFT calculation<br />
in hydrated media or from experimental X-ray data, see Table 1. However,<br />
the N-H bond lengths values obtained by us were in good agreement with<br />
those obtained by [6], the difference being less than 2.28%.<br />
In our mo<strong>de</strong>l, the N-6-H-9 bond length value (1.044 Å) was longer<br />
than the other two N-H bonds (Table 1) and we supposed that happened<br />
because the hydrogen atom, H-9, is involved in the intramolecular hydrogenbonding<br />
H-9-O-2 (Figure 1).<br />
As shown in Table 1, the bond length N-6-C-4 (1.515 Å) obtained<br />
using our mo<strong>de</strong>l was longer than the standard C-N bonds (1.47 Å) [14], this<br />
situation being characteristic for the C-NH3 + bond from amino acids [15]. In<br />
the two theoretical mo<strong>de</strong>ls, our DFT-PCM mo<strong>de</strong>l and the DFT in hydrated<br />
media mo<strong>de</strong>l, the C-N bond lengths (1.515 Å and 1.508 Å) were longer<br />
than the experimental value (1.497 Å), but the theoretical and experimental<br />
values were in a good agreement.<br />
The COO - bond lengths are stretched, but our theoretical values<br />
were more closer to the experimental ones than the values reported by [6]<br />
for DFT in hydrated media mo<strong>de</strong>l.
STRUCTURE AND VIBRATIONAL SPECTRUM OF L-LEUCINE: A DFT-PCM INVESTIGATION<br />
Table 1. Selected parameters of zwitterionic L-Leucine. Comparison between our<br />
results obtained with DFT-PCM mo<strong>de</strong>l and the results reported by [6] and [12].<br />
Energies<br />
L-Leucine<br />
B3LYP/<br />
Zwitterionic structure<br />
Leucine+12H2O<br />
B3LYP/<br />
L-Leucine<br />
Experimental<br />
6-311++G(d,p) PCM 6-31++G(d) [6] X-ray [12]<br />
Ee (Hartrees)<br />
Bond Lengths (Å)<br />
-441.851 -1359.009 -<br />
N-6-H-7<br />
1.029<br />
1.040<br />
1.080<br />
N-6-H-8 1.029 1.053 1.081<br />
N-6-H-9 1.044 1.046 1.080<br />
N-6-C-4 1.515 1.508 1.497<br />
C-4-H-5 1.092 1.094 1.080<br />
C-4-C-1 1.561 1.560 1.539<br />
C-1-O-2 1.261 1.270 1.254<br />
C-1-O-3 1.247 1.254 1.237<br />
C-4-C-10 1.531 1.528 1.550<br />
C-10-C13 1.543 1.546 1.508<br />
C-13-C-15 1.535 1.538 1.539<br />
C-13-C-19<br />
Valence Angles (<br />
1.536 1.538 1.481<br />
o )<br />
H-7-N-6-H-8<br />
107.7<br />
105.6<br />
109.4<br />
H-7-N-6-H-9 109.9 106.97 109.4<br />
H-8-N-6-H-9 108.3 105.9 109.4<br />
H-7-N-6-C-4 114.1 116.4 119.4<br />
H-8-N-6-C-4 112.4 111.8 107.1<br />
H-9-N-6-C-4 104.2 109.6 101.5<br />
N-6-C-4-H-5 107.2 106.3 111.5<br />
N-6-C-4-C-1 106.5 105.0 109.9<br />
H-5-C-4-C-1 108.3 107.3 107.5<br />
C-4-C-1-O-2 115.7 114.5 115.7<br />
C-4-C-1-O-3 116.0 119.96 116.5<br />
O-2-C-1-O-3 128.3 125.5 127.7<br />
C-4-C-10-C-13 116.2 116.1 114.9<br />
C-10-C-13-C-15 112.2 112.4 113.7<br />
C-10-C-13-C-19<br />
Torsion Angles (<br />
109.6 109.5 108.4<br />
o )<br />
N-6-C-4-C-1-O-2<br />
-9.3<br />
-<br />
-31.7<br />
N-6-C-4-C-1-O-3 171.2 - 148.8<br />
O-2-C-1-C-4-C-10 112.2 - 85.7<br />
O-3-C-1-C-4-C-10 -67.4 - -93.7<br />
The C-4-C-1 bond was stretched whereas the C-4-C-10 was<br />
shortened compared to the experimental values (Table 1); this situation<br />
was encountered in the mo<strong>de</strong>l reported by Derbel too [6], but our values<br />
were more closer to the experimental data. The other bond lengths and<br />
angles computed by us showed satisfactory agreement with experiment.<br />
203
204<br />
CAMELIA BERGHIAN GROŞAN, VALER ALMĂŞAN<br />
2. Vibrational data<br />
The Leucine contains 22 atoms and according to the 3N-6 rule (Nthe<br />
number of atoms), it exhibits 60 normal mo<strong>de</strong>s of vibration.<br />
In Figure 2, the theoretical vibrational spectrum at B3LYP/6-311++G(d,p)<br />
level for zwitterionic L-Leucine previously optimized at PCM (water)-B3LYP/6-<br />
311++G(d,p) is presented. The I.R. spectrum was simulated on the region<br />
0-4000 cm -1 .<br />
Vibrational proposed spectral assignments for zwitterionic L-Leucine are<br />
presented in Table 2, together with its computed unscaled frequencies at<br />
B3LYP/6-311++G(d,p) level of theory and the experimental I.R. spectrum. The<br />
vibrational assignments were achieved by combining i) the motions observed<br />
using Avogadro Program, ii) the infrared band intensities with iii) L-Leucine<br />
experimental I.R spectra [16, 17] and iv) previously tentative assignments<br />
[6, 16, 17]. Thus, for the experimental values, we were interested only in<br />
L-Leucine I.R. spectra measured in aqueous solution (500-1800 cm -1 ) [16] or<br />
film sample obtained from aqueous solutions at different pH (0-700 cm -1 ) [17].<br />
Figure 2. Simulated infrared spectrum of zwitterionic<br />
L-Leucine at B3LYP/6-311++G(d,p) level.<br />
The I.R. spectra of the amino acid are characterized by the absorption<br />
due to the carbonyl asymmetric and symmetric vibration (ν COO - ) and the<br />
stretches and bends of ammonium group (NH3 + ).
STRUCTURE AND VIBRATIONAL SPECTRUM OF L-LEUCINE: A DFT-PCM INVESTIGATION<br />
Carbonyl (COO - ) vibrations<br />
Wolpert et al. [16] assigned for the group COO - of the amino acids<br />
the following arbitrary positions (cm -1 ): 1530 (antisymmetric stretching, νas),<br />
1410 (symmetric stretching, νs) for most significant mo<strong>de</strong>s and ∼ 800 (β COO -<br />
scissoring), ∼ 650 (w COO - wagging) and ∼ 650-600 (r COO - rocking) for<br />
other mo<strong>de</strong>s.<br />
In our exploration, by B3LYP/6-311++G(d,p) level of theory, the three<br />
bending vibrations of COO - group were predicted at 681 (δ COO - , w COO - ),<br />
527 (δ COO - , w COO - ) and 398 (r COO - ) cm -1 . These values were in good<br />
agreement with the experimental frequencies (670, 535, 343 cm -1 ). We did not<br />
find the other <strong>de</strong>formation mo<strong>de</strong>s (629, 586, 579, 364 cm -1 ) assigned in the<br />
literature [16, 17] for the COO - group (Table 2). For asymmetric COO - stretch<br />
(νas) we found the absorption at 1679 cm -1 while the symmetric COO - stretches<br />
(νs) occur at 1414 (strong), 1401 (weak), 1376 (weak), and 1354 (weak) cm -1 .<br />
These bands are in agreement with the values reported in the literature for<br />
the strong COO - stretching (near 1600 cm -1 for asymmetric and near 1400 cm -1<br />
for symmetric vibration [18]) and with the values reported by Wolpert for<br />
L-Leucine in aqueous solution at pH= 3 (Table 2) [16].<br />
Ammonium (NH3 + ) vibrations<br />
The amino acids exhibit NH3 + stretching and <strong>de</strong>formation vibrations<br />
that appear in the region 3200-3000 cm -1 (asymmetric stretch), near 2700<br />
and 2100 cm -1 (symmetric stretch, these bands are not always present),<br />
1660-1590 cm -1 (asymmetric <strong>de</strong>formation, δas), 1550-1485 cm -1 (symmetric<br />
<strong>de</strong>formation, δas) and 1295-1090 cm -1 (rocking vibration, r), [19].<br />
In our study, the NH3 + asymmetric stretching vibrations appeared<br />
in the range 3426-3078 cm -1 , while for the symmetric stretching we did not<br />
find any band. The bands due to the NH3 + asymmetric <strong>de</strong>formation were<br />
observed at 1679, 1660 and 1632 cm -1 as the NH3 + symmetric <strong>de</strong>formations<br />
occur at 1428 and 1414 cm -1 . In the region 1238-1009 cm -1 , rocking vibrations<br />
of NH3 + group were observed. These frequencies are in agreement with the<br />
previous literature data [19] and the infrared spectra reported for L-Leucine<br />
in aqueous solution (Table 2) [16].<br />
C-N, C-C, C-H vibrations<br />
The C-N stretching absorptions of L-Leucine at B3LYP/6-311++G(d,p)<br />
occur at 874, 842, 746 cm -1 . These vibrations were coupled with CH or COO -<br />
<strong>de</strong>formations or C-C stretching vibrations (Table 2).<br />
205
206<br />
CAMELIA BERGHIAN GROŞAN, VALER ALMĂŞAN<br />
Tabel 2. Vibrational wave numbers obtained at B3LYP/6-311++G(d,p) level,<br />
experimental FTIR Spectra for zwitterionic L-Leucine and vibrational assignments<br />
Vibrational mo<strong>de</strong><br />
number obtained from<br />
DFT simulation<br />
Unscaled wavenumbers<br />
(cm -1 )<br />
B3LYP/6-311++G(d,p)<br />
Experimental<br />
(cm -1 )<br />
[16, 17]<br />
Vibrational<br />
assignments<br />
1 55 53 τ NH3, τ CH3, δ CH<br />
2 61 73 τ NH3, τ CH3, τ COO -<br />
3 108 107 τ NH3, τ CH3, τCH2, τ COO -<br />
- - 122 τ COO - , τ CC, rotational<br />
4 151 138 τ COO - , τ CC<br />
- - 170 τ COO -<br />
5 208 203 r NH3, δ CCN, τ CH3<br />
6 232 223 δ CH2, w CH3<br />
7 254 - δ CH(CH3)2<br />
8 260 - r CH3, w CH3, w NH3, δ CH2<br />
9 295 - w NH3, δ CCC<br />
- - 330 δ CCN, δ CCC<br />
10 344 - δ CH, δ CCN<br />
11 398 343 r COO - , δ CCN, δ CCC<br />
- - 364 r COO - , δ CCN<br />
- - 402 δ CCC<br />
12 411 442 δ CCC<br />
13 454 456 δ CH(CH3)2<br />
14 527 535 δ COO - , w COO - , δ CCN<br />
- - 579 γ OCO -<br />
- - 586 δ COO -<br />
- - 629 w COO -<br />
15 681 670 δ COO - , w COO - , δ CCN<br />
- - 716 -<br />
16 746 736 δ CH, ν CN<br />
17 806 834 ν CC, r CH2, w NH3<br />
18 842 848 δ COO - , ν CC, ν CN<br />
19 874 - δ CH, ν CC, ν CN<br />
20 924 907 r CH3, ν CC<br />
21 934 943 ν CCN, ν CC<br />
22 953 - δ CH<br />
23 969 973 ν CC, r CH3<br />
24 1009 1003 r NH3, r CH3, ν CC<br />
- - 1031 ν CN
STRUCTURE AND VIBRATIONAL SPECTRUM OF L-LEUCINE: A DFT-PCM INVESTIGATION<br />
Vibrational mo<strong>de</strong><br />
number obtained from<br />
DFT simulation<br />
Unscaled wavenumbers<br />
(cm -1 )<br />
B3LYP/6-311++G(d,p)<br />
Experimental<br />
(cm -1 )<br />
[16, 17]<br />
Vibrational<br />
assignments<br />
25 1043 - δ CH, r NH3<br />
26 1096 - δ CCN, r NH3, ν CC<br />
27 1137 1135 r CH3, ν CC, δ CCN<br />
28 1186 1174<br />
+<br />
r NH3 , δ CH<br />
29 1198 1185<br />
+<br />
r NH3 , r CH3, ν CC<br />
30 1238 1239<br />
+<br />
r NH3 , t CH2, r CH3, ν C-COO -<br />
- - 1295 t CH2<br />
31 1279 1316 δ CH<br />
32 1322 - ν CC, t CH2<br />
33 1330 1340 ν CC, t CH2<br />
34 1354 1353 νs COO - , δ CH<br />
35 1376 1372 νs COO - , δs CH3<br />
36 1401 1392 νs COO - , ν CC, δ COO -<br />
37 1406 - δ CH(CH3)2<br />
- - 1412 νs COO -<br />
38 1414 - νs COO - +<br />
, δs NH3<br />
39 1428 -<br />
+<br />
δs NH3 , δ CH2, δas CH3<br />
- - 1440 δ CH2<br />
- - 1455 -<br />
- - 1471 δas CH3<br />
40 1480 - δ CH, δ CH2, δas CH3<br />
41 1488 δ CH (C-4), δ CH2, δas CH3<br />
42 1496 - δ CH (C-4), δ CH2, δas CH3<br />
43 1507 - δ CH2, δas CH3<br />
44 1512 - δ CH2, δas CH3<br />
- - 1520 -<br />
+<br />
- - 1538 δas NH3<br />
5 1632 1625<br />
+<br />
δas NH3<br />
46 1660 -<br />
+<br />
δas NH3 + δ CH<br />
47 1679 1598 νas COO - +<br />
, δas NH3<br />
48 2948 - ν CH3<br />
49 3007 - ν CH<br />
50 3016 - ν CH3, ν CH2<br />
51 3020 - ν CH3, ν CH2<br />
52 3075 - ν CH<br />
53 3078 -<br />
+<br />
ν NH3 / ν CH<br />
+<br />
54 3082 - ν NH3 / ν CH<br />
207
Vibrational mo<strong>de</strong><br />
number obtained from<br />
DFT simulation<br />
CAMELIA BERGHIAN GROŞAN, VALER ALMĂŞAN<br />
Unscaled wavenumbers<br />
(cm -1 )<br />
B3LYP/6-311++G(d,p)<br />
Experimental<br />
(cm -1 )<br />
[16, 17]<br />
Vibrational<br />
assignments<br />
55 3084 - ν CH<br />
56 3087<br />
+<br />
ν NH3 / ν CH<br />
57 3088<br />
+<br />
ν NH3 / ν CH<br />
58 3094<br />
+<br />
ν NH3 / ν CH<br />
59 3366<br />
+<br />
ν NH3<br />
60 3426<br />
+<br />
ν NH3<br />
ν: streching, δ: <strong>de</strong>formation, γ: out of plane <strong>de</strong>formation, τ: torsion, w: wagging,<br />
r: rocking, t: twisting; a: antisymmetric, s: symmetric.<br />
According to Barth [20], the aliphatic si<strong>de</strong> chain of amino acids gives<br />
several characteristic absorbance bands of medium to weak intensity. In<br />
solid phase, the characteristic vibrations δas CH3, δ CH2, δs CH3 appear near<br />
1465, 1450, 1475 cm -1 and are not coupled to other vibrational mo<strong>de</strong>s while<br />
the δ CH and γ CH2 are often coupled to other mo<strong>de</strong>s. In solution, Wolpert [16]<br />
assigned the δas CH3, δ CH2, δs CH3 vibrations at 1471, 1440, 1372 cm -1<br />
respectively; the latter is coupled with ν COO - . Our finding consists of the δas<br />
CH3 to be coupled with δ CH2, δ CH vibrations and appeared in the range<br />
1512-1428 cm -1 while δs CH3 appeared at 1376 cm -1 together with νs COO -<br />
vibration. Our theoretical I.R. spectrum revealed bands in the region 3094-<br />
2948 cm -1 for the CH stretching (ν CH) that it is in good agreement with the<br />
experimental data (3000-2850 cm -1 ) [19].<br />
The band below 500 cm -1 was mainly assigned to the CCN and<br />
CCC skeletal <strong>de</strong>formation and torsional vibrations.<br />
CONCLUSIONS<br />
The present work <strong>de</strong>scribed a theoretical study of the structure and<br />
I.R. spectrum of zwitterionic L-Leucine. In or<strong>de</strong>r to obtain reasonable<br />
information about this amino acid at physiological conditions, we optimized<br />
the zwitterionic structure of L-Leucine using a <strong>de</strong>nsity functional method<br />
[DFT/B3LYP/6-311++G(d,p)] in conjunction with a continuum solvation mo<strong>de</strong>l,<br />
Polarized Continuum Mo<strong>de</strong>l (PCM). The comparison between our theoretical<br />
results and experimental structural parameters indicates that our data are<br />
in good agreement with the experimental values.<br />
Vibrational frequencies, calculated by B3LYP/6-311++G(d,p), agree very<br />
well with the I.R. spectra of L-Leucine in aqueous solution. Thus, tentative<br />
assignments of this zwitterionic amino acid normal mo<strong>de</strong>s of vibrations were<br />
performed.<br />
208
STRUCTURE AND VIBRATIONAL SPECTRUM OF L-LEUCINE: A DFT-PCM INVESTIGATION<br />
Our study <strong>de</strong>monstrates the performance of DFT-PCM methods in<br />
calculating molecular structure and frequencies of L-Leucine in aqueous<br />
solution.<br />
EXPERIMENTAL SECTION<br />
The calculations were carried out using Gaussian03 package [9].<br />
The programs used for visualization were: Gabedit 2.3.0 to display molecular<br />
structure and simulated infrared spectra [10] and Avogadro 1.0.1 to obtain<br />
information on vibrational mo<strong>de</strong>s [11].<br />
The zwitterionic L-Leucine was optimized using a <strong>de</strong>nsity functional<br />
method (DFT/B3LYP/6-311++G(d,p)) in conjunction with a continuum solvation<br />
mo<strong>de</strong>l, Polarized Continuum Mo<strong>de</strong>l (PCM).<br />
Vibrational frequencies were simulated at B3LYP/6-311++G(d,p) level<br />
of theory. An approximate assignment of vibrational frequencies was realized<br />
by analysis of normal mo<strong>de</strong>s motion using Avogadro program. Our results were<br />
compared with the previously tentative assignments for L-Leucine [6, 16, 17].<br />
ACKNOWLEDGMENTS<br />
We are thankful to the financial support of CNCSIS (the National University<br />
Research Council) through Human Resources-Postdoctoral Program (PD_585/2010).<br />
We grate<strong>full</strong>y acknowledge to Data Center of NIRDIMT (National Institute for<br />
Research and Development of Isotopic and Molecular Technologies) Cluj-Napoca for<br />
providing computer facilities.<br />
The authors would like to express their very sincerely thanks to the reviewer<br />
for his valuable many comments and suggestions.<br />
REFERENCES<br />
1. D.L. Nelson, M.M. Cox, “Lehninger Principles of Biochemistry”, Fourth Edition,<br />
W. H. Freeman and Co., New York, 2004, chapter 3.<br />
2. A.K. Rai, C. Song, Z. Lin, Spectrochimica Acta Part A, 2009, 73, 865.<br />
3. J.M. Berg, J.L. Tymoczko, L. Stryer “Biochemistry”, Sixth Edition, W. H. Freeman<br />
and Co., New York, 2007, chapter 2.<br />
4. F. Siebert, P. Hil<strong>de</strong>brandt, “Vibrational Spectroscopy in Life Science”, Wiley-VCH,<br />
Weinheim, 2008, chapter 5.<br />
5. R. Lin<strong>de</strong>r, M. Nispel, T. Haber, K. Kleinermanns, Chemical Physics Letters, 2005,<br />
409, 260.<br />
6. N. Derbel, B. Hernan<strong>de</strong>z, F. Pfluger, J. Liquier, F. Geinguenaud, N. Jaidane,<br />
Z.B. Lakhdar, M. Ghomi, J. Phys. Chem. B, 2007, 111, 1470.<br />
209
210<br />
CAMELIA BERGHIAN GROŞAN, VALER ALMĂŞAN<br />
7. S. Dokmaisrijan, V.S. Lee, P. Nimmanpipug, Journal of Molecular Structure:<br />
THEOCHEM, 2010, 953, 28.<br />
8. S. Tiwari, P.C. Mishra, Spectrochimica Acta Part A, 2009, 73, 719.<br />
9. Gaussian 03, Revision C.02. M.J. Frisch, G.W. Trucks, H.B. Schlegel, G.E. Scuseria,<br />
M.A. Robb, J.R. Cheeseman, J.A. Montgomery, Jr., T. Vreven, K.N. Kudin, J.C. Burant,<br />
J.M. Millam, S.S. Iyengar, J. Tomasi, V. Barone, B. Mennucci, M. Cossi, G. Scalmani,<br />
N. Rega, G.A. Petersson, H. Nakatsuji, M. Hada, M. Ehara, K. Toyota, R. Fukuda, J.<br />
Hasegawa, M. Ishida, T. Nakajima, Y. Honda, O. Kitao, H. Nakai, M. Klene, X. Li,<br />
J.E. Knox, H.P. Hratchian, J.B. Cross, C. Adamo, J. Jaramillo, R. Gomperts,<br />
R.E. Stratmann, O. Yazyev, A.J. Austin, R. Cammi, C. Pomelli, J.W. Ochterski,<br />
P.Y. Ayala, K. Morokuma, G.A. Voth, P. Salvador, J.J. Dannenberg, V.G. Zakrzewski,<br />
S. Dapprich, A.D. Daniels, M.C. Strain, O. Farkas, D.K. Malick, A.D. Rabuck, K.<br />
Raghavachari, J.B. Foresman, J.V. Ortiz, Q. Cui, A.G. Baboul, S. Clifford, J.<br />
Cioslowski, B.B. Stefanov, G. Liu, A. Liashenko, P. Piskorz, I. Komaromi, R.L. Martin,<br />
D.J. Fox, T. Keith, M.A. Al-Laham, C.Y. Peng, A. Nanayakkara, M. Challacombe,<br />
P.M.W. Gill, B. Johnson, W. Chen, M.W. Wong, C. Gonzalez, and J.A. Pople,<br />
Gaussian, Inc., Wallingford CT, 2004.<br />
10. A.R. Allouche, Journal of Computational Chemistry, 2011, 32, 174.<br />
11. Avogadro: an open-source molecular buil<strong>de</strong>r and visualization tool. Version 1.0.1,<br />
http://avogadro.openmolecules.net/<br />
12. M. Coll, X. Solans, M. Font-Altaba, J.A. Subirana, Acta Crystallographica Section C,<br />
1986, 42, 599.<br />
13. H.B. Burgi, J.D. Dunitz, “Structure Correlation”, VCH, Weinheim, 1994, chapter 11.<br />
14. G.W. Gokel, “Dean’s Handbook of Organic Chemistry”, McGraw-Hill, New York,<br />
2004, chapter 3.<br />
15. T. Hahn, Zeitschrift für Kristallographie, 1957, 109, 438.<br />
16. M. Wolpert, P. Hellwig, Spectrochimica Acta Part A, 2006, 64, 987.<br />
17. A. Trivella, T. Gaillard, R.H. Stote, P. Hellwig, J. Chem. Phys., 2010, 132, 115105.<br />
18. D.L. Pavia, G.M. Lampman, G.S. Kriz, J.R. Vyvyan, “Introduction to Spectroscopy”,<br />
Fourth Edition, Brooks/Cole, 2009, chapter 2.<br />
19. G. Socrates, “Infrared and Raman Characteristic Group Frequencies: Tables<br />
and Charts”, Third Edition, John Wiley & Sons, 2004, chapter 23.<br />
20. A. Barth, Progress in Biophysics & Molecular Biology, 2000, 74, 141.
STUDIA UBB CHEMIA, LVI, 1, 2011<br />
SEM CHARACTERIZATION OF STARCH GRANULES<br />
OSSI HOROVITZ a, *, NICOLAE CIOICA b , NICOLAE JUMATE c ,<br />
MARIA POJAR-FENEŞAN d , ANA BALEA d , VICTOR LITEANU a ,<br />
AURORA MOCANU a , MARIA TOMOAIA-COTIŞEL a<br />
ABSTRACT. Maize and potato starch samples were investigated by three<br />
scanning electron microscopy techniques (secondary electron imaging, Everhart<br />
Thornley secondary electron <strong>de</strong>tection, backscattered electron imaging) at<br />
different magnifications. The starch granules were visualized and their shapes,<br />
surface morphology and size were revealed. From the SEM images the size<br />
distribution of the granules was inferred and compared for the different<br />
samples. These investigations will contribute to the characterization of native<br />
starches as raw materials for the production of bio<strong>de</strong>gradable plastics.<br />
Keywords: potato starch; maize starch; SEM; granulometry<br />
INTRODUCTION<br />
In the current search for “green” alternatives to petrochemical based<br />
plastic products, starch remains in the top of the options. This biopolymer<br />
presents numerous advantages, such as its abundance, low cost and<br />
bio<strong>de</strong>gradability [1]. Excepting its use as filler in starch-filled polymer blends [2],<br />
in the production of bio<strong>de</strong>gradable plastics, native granular starch has to be<br />
modified (<strong>de</strong>structured), giving thermoplastic starch or foamed starch [3-5]. It is<br />
also used in various blends with synthetic polymers, both non-bio<strong>de</strong>gradable<br />
(such as polyethylene) and bio<strong>de</strong>gradable (polylactic acid, PLA, polycaprolactone,<br />
PCL etc.).<br />
Starch is a polysacchari<strong>de</strong>, consisting of D-glucose units, linked together<br />
into two different macromolecules: amylose and amylopectin. Amylose contains<br />
linear or sparsely branched chains based on α-1,4 glucosidic bonds and has a<br />
molecular mass of 10 5 -10 6 ; the chains configuration is that of single or double<br />
helixes. Amylopectin, on the other hand, is based on both α-1,4 bonds and<br />
α-1,6 linkages, the latter giving the branch points of the chain, at every 20-25<br />
glucose units The molecular mass of this multiple branched polymer [6-8] is<br />
as high as 10 7 -10 9 , and it is present in the semi-crystalline structure of the<br />
starch granule, amylose being amorphous [9].<br />
a Babeş-Bolyai University, Faculty ofChemistry and Chemical Engineering,11, Arany J. Str.,<br />
RO-400028 Cluj-Napoca, Romania, * ossihor@yahoo.com<br />
b INMA, 59 Al. Vaida-Voievod Str., 400436 Cluj-Napoca, Romania<br />
c Technical University of Cluj-Napoca, Faculty of Material Science and Engineering, 103, Muncii<br />
Bd., 400641, Cluj-Napoca, Romania<br />
d Raluca Ripan Institute of Chemistry, 30 Fantanele Str., 400294 Cluj-Napoca, Romania
O. HOROVITZ, N. CIOICA, N. JUMATE, M. P.-FENEŞAN, A. BALEA, V. LITEANU, A. MOCANU, M. T.-COTIŞEL<br />
Starch is known to be the main storage substance in plants (cereals,<br />
legumes and tubers). Main sources for separation of starch granules are potato,<br />
maize, wheat, rice, pea, cassava (manioc) etc. The amylose/amylopectin ratio<br />
in starch granules varies according the resource, the starch from most cereals<br />
containing 20-30% amylose. In waxy maize (Zea mais cerata) and waxy rice,<br />
starch contains almost only amylopectin (98%), while high amylose maize<br />
starch and some species of peas contain 60-80% amylase [10]. Native starch<br />
granules from different plants have dimensions between 0.5 and 175 μm and<br />
various shapes: spherical, oval, disk, polygonal, rods [11, 12]. Within the starch<br />
granule, amylose and amylopectin molecules seem to be interdispersed [9],<br />
while amylose is concentrated at the periphery of the granule, where a tightly<br />
associated amylose and amylopectin network is formed [13, 14].<br />
The surface morphology, size and shape of starch granules are<br />
therefore important topics to be known for the different practical applications of<br />
starch. Scanning electron microscopy (SEM) proved itself to be a valuable<br />
method in the study of the granulate microstructure and surface characteristics<br />
of starch and for the investigation of the enzymes effect on starch granules<br />
[15-23]. This technique allows for an observation of the sample characteristics<br />
at nanometric scale, as compared with the 0.2 μm resolution available in the<br />
optical microscope. Previously, we reported on the surface characteristics<br />
of starch granules using atomic force microscopy (AFM) investigations [24].<br />
The goal of the present work is to reveal, by SEM observations, the<br />
size, shape and surface morphology of starch granules from native maize and<br />
potato starches, which are used for the production of bio<strong>de</strong>gradable plastics.<br />
RESULTS AND DISCUSSION<br />
Some of the SEM images of the starch granules from potatoes in the<br />
thin film examined by the secondary electron imaging (SEI) technique are<br />
given in Figure 1 for different magnifications. The analogous pictures of<br />
starch granules from maize are given in Figure 2.<br />
From the sizes of a great number of particles (some hundreds),<br />
measured on the SEM images, the average size (equivalent diameter of the<br />
granules) and the standard <strong>de</strong>viation (SDEV) were calculated and are given in<br />
Table 1, together with the extreme values of the granule sizes. The histograms<br />
providing the size distribution of starch granules, obtained from SEM pictures,<br />
are given in Figure 3. The size distribution is similar in the two samples, i.e.<br />
there are no significant differences between the potato (Fig. 3a) and maize<br />
(Fig. 3b) starch granules.<br />
From these histograms, the granulometry of the starch samples was<br />
<strong>de</strong>rived and given in Table 2, both for number of particles and particles weight.<br />
While in the potato starch pow<strong>de</strong>r the fraction with granule diameters between<br />
212
SEM CHARACTERIZATION OF STARCH GRANULES<br />
10 and 12 μm are predominant both in number (Fig. 3a) and in weight<br />
(Table 2), for the maize starch the granules with diameters between 8 and<br />
10 μm are the most numerous (Fig. 3b), but the major contribution to the<br />
weight is given by the larger particles, with diameters in the 12...14 μm range.<br />
Figure 1. Potato starch granules (sample 1) visualized by SEM (SEI technique),<br />
the bar lengths are respectively: 50 μm (a); 10 μm (b); 5 μm (c); 5 μm (d).<br />
Table 1. SEM characterization of starch granules<br />
Sample Average size of<br />
granules [μm]<br />
Potato starch, sample 1, thin film<br />
Maize starch, sample 2, thin film<br />
Potato starch, sample 1, compact tablet<br />
Maize starch, sample 2, compact tablet<br />
Potato starch, sample 1, from BSE<br />
Maize starch, sample 2, from BSE<br />
Maize purified starch, sample 3<br />
10.3<br />
9.3<br />
9.5<br />
9.3<br />
8.6<br />
9.2<br />
11.1<br />
SDEV<br />
[μm]<br />
2.7<br />
2.9<br />
3.5<br />
3.3<br />
3.4<br />
3.9<br />
6.6<br />
Extreme values<br />
[μm]<br />
3.8 ... 16.2<br />
3,7 ... 16.0<br />
2.2 ... 23.7<br />
2.2 ... 22.8<br />
2.3 …19.1<br />
3.2 …21.8<br />
2.3 …37.3<br />
213
O. HOROVITZ, N. CIOICA, N. JUMATE, M. P.-FENEŞAN, A. BALEA, V. LITEANU, A. MOCANU, M. T.-COTIŞEL<br />
Figure 2. Maize starch granules (sample 2) visualized by SEM (SEI technique),<br />
the bar lengths are respectively: 50 μm (a); 10 μm (b); 5 μm (c); 5 μm (d).<br />
a. b.<br />
Figure 3. Histograms of size distribution of granules in the potato starch sample 1<br />
(a) and the maize starch – sample 2 (b) thin films<br />
Some of the SEM images at different magnification ratios, obtained<br />
with the SEM-ETD technique on compact starch tablets, are given in Figure 4<br />
for the potato starch (sample 1) and in Figure 5 for the maize starch (sample 2).<br />
The sizes of the granules, measured from the SEM images, are given in<br />
Table 1 and the histograms for the size distribution are presented in Figure 6.<br />
214
SEM CHARACTERIZATION OF STARCH GRANULES<br />
Table 2. Granulometry (size distribution) of potato and maize starch samples<br />
in thin films<br />
% particles number % particles weight<br />
Diameter (μm) Potato starch Maize starch Potato starch Maize starch<br />
(sample 1) (sample 2) (sample 1) (sample 2)<br />
2-4<br />
1.8<br />
2.4<br />
0.0<br />
0.1<br />
4-6<br />
3.2<br />
8.6<br />
0.3<br />
1.0<br />
6-8<br />
13.6<br />
22.4<br />
3.4<br />
7.1<br />
8-10<br />
23.9<br />
33.6<br />
12.8<br />
22.6<br />
10-12<br />
30.1<br />
11.3<br />
29.4<br />
13.8<br />
12-14<br />
18.1<br />
12.6<br />
29.2<br />
25.5<br />
14-16<br />
7.7<br />
7.6<br />
19.1<br />
23.6<br />
16-18<br />
1.6<br />
1.4<br />
5.8<br />
6.3<br />
a. b. c.<br />
Figure 4. Potato starch granules (sample 1) visualized by SEM with ETD<br />
technique in compacted tablet; bar lengths: 30 μm (a); 10 μm (b); 5 μm. (c).<br />
a. b. c.<br />
Figure 5. Maize starch granules (sample 2) visualized by SEM with ETD<br />
technique in compacted tablet; bar lengths: 30 μm (a); 10 μm (b); 5 μm. (c).<br />
Some of the starch granules visualized in the SEM images (Figs. 1,<br />
2, 4, 5) present smooth surfaces, for other the surface roughness is rather<br />
pronounced. A variety of particle shapes can be observed on the images, from<br />
spherical and oval to irregular polygonal shape. These shapes are more or<br />
215
O. HOROVITZ, N. CIOICA, N. JUMATE, M. P.-FENEŞAN, A. BALEA, V. LITEANU, A. MOCANU, M. T.-COTIŞEL<br />
less conserved in the compact tablets (Figs. 4, 5), but some of the particles are<br />
fragmented or present cracks (see for instance Fig. 4 c, d). These observations<br />
are consistent with the results of AFM investigations on similar starch samples<br />
[24]. AFM allows for a more <strong>de</strong>tailed visualization of the ultrastructure of the<br />
granules surface. While the average size of the granules is little affected by<br />
compression, particularly for the maize starch, the distribution of the diameters<br />
is enlarged in the tablets (as seen from the standard <strong>de</strong>viation and the extreme<br />
values in Table 1). Smaller particles are present as result of the fragmentation<br />
of granules, but also larger particles result by the aggregation of granules.<br />
216<br />
a. b.<br />
Figure 6. Histograms of size distribution of granules in the potato starch<br />
– sample 1 (a) and the maize starch – sample 2 (b) tablets<br />
The SEM images obtained with the BSE technique for the same two<br />
starch samples (1 and 2) give also a clear visualization of the starch granules,<br />
as seen from the examples given in Figure 7. The size distribution is similar<br />
to that seen from the other SEM imaging techniques.<br />
a. b.<br />
Figure 7. Potato starch – sample 1 (a) and maize starch – sample 2 (b) granules<br />
visualized by SEM - BSE technique; the bar length in the images is 10 μm.
SEM CHARACTERIZATION OF STARCH GRANULES<br />
The purified maize starch (sample 3) was also investigated by the<br />
BSE technique; a typical image is given in Figure 8, along with the histogram<br />
of the particles distribution. The size distribution of the granules in particles<br />
numbers and in particles weights is given in Table 3.<br />
As compared with sample 2, there are more small granules, but there<br />
are also a few very large granules, so that the distribution is larger (from 2 to<br />
37 μm, standard <strong>de</strong>viation 6.6 μm) and the average size is somewhat higher<br />
(11.1 μm).<br />
a. b.<br />
Figure 8. Maize starch granules (sample 3) visualized by SEM - BSE technique;<br />
the bar length is 10 μm (a), and histogram of size distribution of granules (b)<br />
Table 3. Granulometry of maize purified starch (sample 3) from SEM-BSE imaging<br />
CONCLUSIONS<br />
Diameter (μm) % granules number % granules weight<br />
2-5<br />
5-10<br />
10-15<br />
15-20<br />
20-25<br />
25-30<br />
30-35<br />
35-37<br />
16.8<br />
36.6<br />
24.4<br />
13.0<br />
4.6<br />
2.3<br />
1.5<br />
0.8<br />
0.1<br />
4.7<br />
14.6<br />
21.3<br />
16.0<br />
14.6<br />
15.7<br />
12.9<br />
Knowing the granulate microstructure of starch is imperative for the<br />
correct specification of the processing conditions in the production process of<br />
bio<strong>de</strong>gradable materials, based on thermoplastic starch.<br />
The investigation by three SEM techniques, viz. secondary electron<br />
imaging (SEI) technique on gold sputtered samples, the use of the Everhart<br />
Thornley secondary electron <strong>de</strong>tector (ETD) on starch tablets and backscattere<strong>de</strong>lectron<br />
(BSE) imaging technique has enabled us to characterize commercial<br />
native starch samples from two different sources, potato and maize, as well as<br />
purified maize starch. SEM allows for a good visualization of the starch granules,<br />
217
O. HOROVITZ, N. CIOICA, N. JUMATE, M. P.-FENEŞAN, A. BALEA, V. LITEANU, A. MOCANU, M. T.-COTIŞEL<br />
revealing their shapes, their surfaces morphology and sizes. Thus, some<br />
Romanian starches were investigated for the first time and their granulometry<br />
was established from histograms based on the measurement of granules<br />
sizes by SEM images. We could also follow the effect of compression on<br />
the morphology of starch granules.<br />
The present SEM studies complete our AFM observations on the same<br />
type of starches, which helped to better un<strong>de</strong>rstanding of the ultrastructure<br />
of the granule surfaces. These techniques will be applied in our laboratories to<br />
characterize the thermoplastic starch products obtained from the investigated<br />
native starch samples.<br />
EXPERIMENTAL SECTION<br />
The investigations were ma<strong>de</strong> on commercial native potato (sample 1)<br />
and maize (sample 2) starches, and on purified maize starch (sample 3).<br />
The moisture of the starch samples was about 12%.<br />
The granulate microstructure of the samples was analyzed by scanning<br />
electron microscopy (SEM), with three imaging techniques, namely scanning<br />
electron microscope, JEOL JSM 5510 LV, Japan, using the secondary electron<br />
imaging technique (SEI); scanning electron microscope, FEI Company,<br />
Netherlands, with the Everhart Thornley Seconday Electron Detector (ETD)<br />
[25]; scanning electron microscope, JEOL JSM 5600 LV, Japan, using the<br />
backscattered-electron (BSE) imaging technique.<br />
For the SEI imaging, the starch pow<strong>de</strong>r was <strong>de</strong>posited in thin layer<br />
on an adhesive metallic support and then was gold sputtered in the AGAR,<br />
Auto Sputter Coater. The thin gold coating (thickness 10 nm) was sputtered<br />
in 3 sputtering cycles taking about 10 s each. These metallized samples were<br />
examined on the SEM, with accelerating voltage of 10 kV, working distance<br />
between 10.3 and 10.7 mm and a spot size of 3 to 3.5 μm, at magnification<br />
ratios from 100 to 10,000 times.<br />
With the Everhart Thornley Secondary Electron Detector (ETD), compact<br />
starch tablets can be used, without metallization. The starch tablets were<br />
prepared as follows: the starch pow<strong>de</strong>r (around 1g) is crushed in a hydraulic<br />
press in vacuum, without any binding agent. The accelerating voltage was<br />
also 10 kV, the working distance 21-22 mm and the spot size 12 μm. Images<br />
were obtained with magnification ratios between 800 and 12,000 times.<br />
For the BSE imaging, the samples were <strong>de</strong>posited as an uniform layer<br />
on the adhesive graphitized tape and were examined in low vacuum (20 – 25<br />
Pa), with an accelerating voltage of 15 kV, a working distance of 20 mm, an<br />
electron spot size of 40 or 50 μm, at magnification ratios from 500 to 1,000 times.<br />
ACKNOWLEDGMENTS<br />
This research was financially supported by the project 31-039 from the 2<br />
218<br />
nd<br />
National Program.
SEM CHARACTERIZATION OF STARCH GRANULES<br />
REFERENCES<br />
1. M. Thunwall, A. Boldizar, M. Rigdahl, Carbohydrate Polymers, 2006, 11, 419.<br />
2. G.L. Griffin, Advances in Chemical Research, 1973, 134, 159.<br />
3. H.F. Zobel, Starch/Stärke, 1988, 40, 1.<br />
4. K. Poutanen, P. Forssell, Trends in Polymer Science - TRIP, 1966, 4(4), 128.<br />
5. R. van Tuil, J. van Heemst, G. Schennink, In „Biorelated polymers. Sustainable<br />
polymer science and technology”, E.Chiellini et al. Edts., Kluwer Aca<strong>de</strong>mic/ Plenum<br />
Publ., New York, 2001, pp.3-17.<br />
6. H.F. Zobel, Starch/Stärke, 1988, 40(2), 44.<br />
7. D.J.Gallant, B. Bouchet, A. Buleon, S. Perez, European Journal of Clinical Nutrition,<br />
1992, 46, 316.<br />
8. S. You, J. Jane, Carbohydrate Polymers, 2001, 49, 307.<br />
9. J. Jane, J. Appl. Glycosci., 2006, 53, 205.<br />
10. N. Singh, J. Singh, L. Kaur, N. Singh Sodhi, B. Singh Gill, Food Chemistry, 2003,<br />
81, 219.<br />
11. D. French, In “Starch: chemistry and technology”, Whistler, R.L, Bemiller, J.N.,<br />
Paschall, E.F., Eds.; Aca<strong>de</strong>mic Press: London, 1984, pp. 183-247.<br />
12. J. Jane, T. Kasemsuwan, S. Leas, H. Zobel, J.F. Robyt, Starch/Stärke, 1994, 46,<br />
121.<br />
13. J. Jane, J.J. Shen, Carbohydrate Research, 1993, 247, 279.<br />
14. D.D. Pan, J. Jane, Biomacromolecules, 2000, 1, 126.<br />
15. J.M.V. Blanshard, In “Starch: Properties and Potential”, T. Galliard, Edit., J. Wiley<br />
and Sons: Brisbane, 1987, pp. 16-54.<br />
16. H. Fuwa, Y. Sugimoto, T. Takaya, Z. Nikuni, Carbohydrate Research, 1979, 70, 233.<br />
17. M.R. Sandhya Rani, K.R. Bhattachrya, Starch/Stärke, 1995, 47, 334.<br />
18. R.S. Policegoudra, S.M. Aradhya, Food Hydrocolloids, 2008, 22, 513.<br />
19. S. Wang, J.L. Yu, O. Zhu, J. Yu, F. Jin, Food Hydrocolloids, 2009, 23, 426.<br />
20. J. Szymonska, M. Targosz-Korecka, F. Ktok, Journal of Physics: Conference Series,<br />
2009, 146, 012027.<br />
21. M. Sujka, J. Jamroz, LWT – Food Science and Technology, 2009, 42, 1219.<br />
22. F.H. Cisneros, R. Zevillanos, L. Cisneros-Zevillanos, Journal of Agricultural and<br />
Food Chemistry, 2009, 57, 7363.<br />
23. H.Yan, G.U. Zhengbiao, Food Research International, 2010, 43, 767.<br />
24. M. Tomoaia-Cotisel, N. Cioica, C. Cota, Cs. Racz, I. Petean, L.D. Bobos, A. Mocanu,<br />
O. Horovitz, Studia UBB Chemia, 2010, 55 (2), 313.<br />
25. T.E. Everhart, R.F.M. Thornley, Journal of Scientific Instruments, 1960, 37 (7), 246.<br />
219
STUDIA UBB CHEMIA, LVI, 1, 2011<br />
DETERMINATION OF THE ABSOLUTE CONFIGURATION OF<br />
3-AMINO-3-(TETRAHYDROFURAN) CARBOXYLIC ACID<br />
BY VIBRATIONAL CIRCULAR DICHROISM<br />
AND DFT CALCULATION<br />
SHENGLI MA a , SHERRY SHEN a , ZHENGXU HAN a , YIBO XU a ,<br />
HEEWON LEE a , DHILEEPKUMAR KRISHNAMURTHY a ,<br />
CHRIS SENANAYAKE a , NELU GRINBERG a,*<br />
ABSTRACT. The absolute configuration of 3-amino-3-(tetrahydrofuran)<br />
carboxylic acid was <strong>de</strong>termined using vibrational circular dichroism and DFT<br />
calculation. The conformation of 3-amino-3-(tetrahydrofuran) carboxylic acid in<br />
gas phase and aqueous solution was calculated, along with the vibrational<br />
circular dichroism (VCD) and infrared (IR) spectra. In addition, experimental<br />
VCD and IR spectra were collected in aqueous solution. Each calculated<br />
IR and VCD spectra was compared to the experimental spectra. The band<br />
assignment was unambiguously <strong>de</strong>termined from the DFT calculation. Based<br />
on the calculation and the experimental data it was <strong>de</strong>termined that the absolute<br />
configuration of the compound was (S)-enantiomer.<br />
Keywords: VCD, absolute configuration, THF amino acid, DFT<br />
INTRODUCTION<br />
Amino acids are essential building blocks for proteins. In addition they<br />
have been extensively used as intermediates in the synthesis of many chiral<br />
molecules.[1-9] Heterocyclic amino acids are of particular interest, as<br />
exemplified by 3-amino-3-(tetrahydrofuran) carboxylic acid (THF amino acid 1),<br />
which possesses diverse physiological activities and has been utilized as a<br />
building block for a large number of chiral drug molecules.[1,10-15] As such,<br />
the absolute configuration of amino acid is critical; yet very few methods can be<br />
applied for such <strong>de</strong>termination. Single crystal X-ray is the straightforward way;<br />
however, sometimes it is very difficult, if not impossible, to get single crystals.<br />
Another method for the <strong>de</strong>termination of absolute configuration is NMR; however,<br />
the technique requires chiral reagents for the formation of diastereomeric<br />
species, and the reagents are often not readily available.<br />
Recently we have synthesized a tetrahydrofuran (THF) amino acid<br />
1 and used it as a building block in the synthesis of a series of chiral drug<br />
candidates.[11,12] In or<strong>de</strong>r to pursue the synthesis in the subsequent steps it<br />
a Chemical Development Department, Boehringer Ingerheim Pharmaceuticals Inc., Ridgefield,<br />
CT USA 06877, *nelu.grinberg@boehringer-ingelheim.com
S. MA, S. SHEN, Z. HAN, Y. XU, H. LEE, D. KRISHNAMURTHY, C. SENANAYAKE, N. GRINBERG<br />
was important to <strong>de</strong>termine the absolute configuration of the starting material.<br />
The polar nature of the compound ren<strong>de</strong>red it solubile only in water. Using<br />
such solvent, the generation of a single crystal amenable to X-ray analysis was<br />
not possible.<br />
Vibrational circular dichroism (VCD) is a spectroscopic method that<br />
was <strong>de</strong>veloped in the 1970s. VCD is a chiroptical technique which measures the<br />
difference in absorbance of a chiral molecule upon interacting with a left versus<br />
right circularly polarized light in the infrared part of the spectrum. As such the<br />
technique is very sensitive not only to structural changes in biomacromolecules<br />
and small molecules, but also to the mutual orientation of different chemical<br />
groups within it. VCD is also very sensitive to changes in the bond strength,<br />
bond distortion during the catalytic reaction, etc.[16] As a result, VCD provi<strong>de</strong>s<br />
a wealth of information about the structure and absolute configuration of chiral<br />
compounds.[17,18]<br />
The theories of IR and VCD were first <strong>de</strong>veloped <strong>de</strong>ca<strong>de</strong>s ago and<br />
significant progress has been ma<strong>de</strong> since then. Although the theoretical<br />
predication of VCD of large molecules such as proteins is still a difficult task,<br />
the ab initio quantum chemical calculations applied to small to medium size<br />
molecules have become fast and reliable even on PC computers.[19-21] Such<br />
advancements have greatly enhanced the application of VCD as a tool to<br />
elucidate the structure, and especially the absolute configuration (AC), of<br />
chiral molecules.<br />
The calculation of VCD intensity for a chiral molecule becomes routine<br />
with the availability of commercial software such as Gaussian 98/03.[22] The<br />
<strong>de</strong>nsity functional theory (DFT) method provi<strong>de</strong>s electron correlation by<br />
including an exchange correlation that is a function of the electron <strong>de</strong>nsity, thus<br />
implicitly accounting for electron correlation. Numerous studies have shown<br />
that <strong>de</strong>nsity functional theory (DFT) with a hybrid functional such as B3LYP<br />
and a basis set of 6-31G(d) provi<strong>de</strong>s the best combination of spectral accuracy<br />
and calculation expense. The commercial software Gaussian 03 computes VCD<br />
spectra along with performing the geometry optimization, which is achieved at<br />
the same level as the calculation of the VCD spectrum, generating the molecular<br />
geometry at a stationary point on the potential energy surface. Once the optimized<br />
geometry is obtained, corresponding dipole strengths, rotational strengths and<br />
vibrational frequencies are calculated based on the magnetic field perturbation<br />
(MFP) theory. [23,24]<br />
In this paper, we present the <strong>de</strong>termination of the absolute configuration<br />
and conformation of amino acid 1 by VCD, along with DFT calculation. Since<br />
amino acid 1 is only soluble in water, experimental VCD was performed in<br />
aqueous solution. The DFT calculation was first carried out on zwitterionic form,<br />
in gas phase. The comparison between the calculated and experimental results<br />
were not in agreement. We further exten<strong>de</strong>d the DFT calculation with the<br />
polarizable continuum mo<strong>de</strong>l and ad<strong>de</strong>d explicit water molecules surrounding<br />
the amino acid 1. It is <strong>de</strong>monstrated that this mo<strong>de</strong>l provi<strong>de</strong>s dramatically more<br />
222
DETERMINATION OF THE ABSOLUTE CONFIGURATION OF 3-AMINO-3-(TETRAHYDROFURAN) …<br />
accurate results, allowing for a better correlation between the experimental<br />
and calculated results and consequently for the <strong>de</strong>termination of absolute<br />
configuration and solution conformation.<br />
RESULTS AND DISCUSSION<br />
To study the absolute configuration of amino acid 1, we first performed<br />
the DFT calculations in gas phase with the assumption that the compound<br />
is not self-interacting and is in the neutral state. In<strong>de</strong>ed, the DFT calculation<br />
of the zwitterionic species led to a neutral structure, indicating that the stable<br />
form in gas phase is not the zwitterionic specie, but a neutral specie in which the<br />
carboxy group is a carboxyl and the amine is in the form of NH2 (Fig. 1). The<br />
calculated VCD spectra and its comparison with the experimental results is<br />
presented in Fig. 2. All major VCD bands were labeled with numbers for clarity.<br />
The spectral region between 1700-1600 cm<br />
223<br />
-1 , presents in the experimental<br />
spectra a (+,-,+) feature (band # 1, 1’ and 2) (1674 cm -1 , 1662 cm -1 and<br />
1627cm -1 , respectively).<br />
The calculation, however, showed only two negative peaks in the same<br />
spectral region (band #1 and # 2) (1674 and 1627 cm -1 ), corresponding to C=O<br />
stretching and –NH2 bending mo<strong>de</strong>s, respectively. In the spectral region between<br />
1600-1400 cm -1 , only band #3 was observed in both the experimental and<br />
calculated spectra. This band corresponds to the methylene vibration from the<br />
THF ring. Large discrepancies between the calculated and experimental spectra<br />
were observed in the region of 1400-1200 cm -1 . In particular, the bands # 4’ and 4<br />
display intense negative peaks in the calculated spectra, while the experimental<br />
spectra show very weak bands in this region. These two bands correspond to the<br />
vibrations of carboxylic –OH and –NH2 respectively, coupled with THF ring.<br />
In the region between 1200-1000 cm -1 , calculated VCD shows three<br />
positive peaks (bands #5, #6 and #7), with relative intensities quite different<br />
from the experimental spectra. For example, band #7 (corresponding to -NH2<br />
bending coupled with ring vibration) shows intense intensity in the calculated<br />
spectra, while in the experimental spectra, only broad bands are observed.<br />
Similar disagreements were observed when comparing experimental and<br />
calculated IR spectra. Un<strong>de</strong>r these circumstances, the absolute configuration of<br />
amino acid 1 cannot be accurately <strong>de</strong>termined due to the discrepancies<br />
between the experimental and calculated spectra.<br />
The broa<strong>de</strong>ning of the bands observed in the experimental spectra<br />
can be attributed to the interaction of water with the functional groups of the<br />
amino acid. As a consequence, the DFT simulation was performed introducing<br />
molecules of water in the calculation in this case. The method involves the<br />
use of a self-consistent reaction field (SCRF). Molecules of water were placed<br />
in an environment that had the same dielectric constant as the <strong>de</strong>sired solvent.<br />
There are several types of SCRF which range in complexity from a single<br />
dielectric sphere around the whole molecule, to individual spheres around<br />
each atom of the molecule, which can each be polarized in<strong>de</strong>pen<strong>de</strong>ntly.
S. MA, S. SHEN, Z. HAN, Y. XU, H. LEE, D. KRISHNAMURTHY, C. SENANAYAKE, N. GRINBERG<br />
Gaussian 03 provi<strong>de</strong>s the functions for VCD calculation using the<br />
polarizable continuum mo<strong>de</strong>l (PCM). [25-27] We used PCM to simulate the<br />
water solvent environment. In addition, three water molecules were placed at sites<br />
in which hydrogen bonding occurred (NH2, COOH and ether oxygen).[28,29] It<br />
is preferable to use the minimum number of water molecules that can still<br />
produce agreement with the experimental data, because calculation times<br />
increase dramatically with the number of atoms in the molecule. Thus, water<br />
molecules were placed according to Fig. 3, and the calculation was pursued.<br />
Un<strong>de</strong>r these parameters the calculation approximates the experimental<br />
spectrum very well, in peak frequency as well as both relative and absolute<br />
intensity (Fig. 4). This calculation also showed a reduction of the VCD intensities<br />
of bands #4, #4’ and #7, previously observed without water molecules<br />
docked to the amino acid. The addition of these three molecules of water,<br />
hydrogen bon<strong>de</strong>d to the carboxyl, amino and ether oxygen, accounted for a<br />
better correlation between the experimental and the calculated spectrum.<br />
In addition to the VCD results, the mo<strong>de</strong>l with three explicit water<br />
molecules offers a significant improvement in the calculated IR spectra.<br />
This formation of the water bridges also affected the low intensity of these<br />
groups in the experimental VCD spectrum. From the close agreement between<br />
the experimental and calculated VCD spectra, the absolute configuration of<br />
amino acid 1 can be unambiguously assigned as (S)-enantiomer.<br />
224<br />
H 2N<br />
O<br />
Scheme 1<br />
Figure 1. Structure of neutral form of amino acid 1<br />
O<br />
OH
DETERMINATION OF THE ABSOLUTE CONFIGURATION OF 3-AMINO-3-(TETRAHYDROFURAN) …<br />
Δε X 10 3<br />
Molar Absorptivity, ε<br />
30<br />
20<br />
10<br />
0<br />
-10<br />
-20<br />
-30<br />
800<br />
500<br />
200<br />
1<br />
1<br />
1'<br />
2<br />
2<br />
Calculated VCD<br />
Calculated IR<br />
3<br />
3<br />
Observed VCD<br />
1800 1600 1400 1200 1000<br />
Wavenumber (cm -1 )<br />
4<br />
4<br />
5 6 7<br />
Observed IR<br />
Figure 2. Comparison of calculated and experimental VCD and IR<br />
spectra of amino acid 1: calculation on neutral form.<br />
Figure 3. Structure of amino acid 1 with three explicit water molecules<br />
4'<br />
5<br />
6<br />
7<br />
8<br />
4<br />
0<br />
-4<br />
-8<br />
0.2<br />
0.1<br />
0.0<br />
ΔA x 10 5<br />
Absorbance<br />
225
S. MA, S. SHEN, Z. HAN, Y. XU, H. LEE, D. KRISHNAMURTHY, C. SENANAYAKE, N. GRINBERG<br />
226<br />
Δε X 10 3<br />
Molar Absorptivity, ε<br />
100<br />
60<br />
20<br />
-20<br />
1800<br />
1300<br />
800<br />
300<br />
1<br />
Calculated VCD<br />
1<br />
1<br />
1'<br />
1'<br />
2<br />
1<br />
2<br />
2<br />
2<br />
3<br />
Calculated IR<br />
3<br />
3<br />
3<br />
Observed VCD<br />
Observed IR<br />
1800 1600 1400 1200 1000<br />
Wavenumber (cm -1 )<br />
Figure 4. Comparison of calculated and experimental VCD and IR spectra<br />
of amino acid 1: calculation on PCM with three explicit water molecules<br />
surrounding amino acid 1.<br />
CONCLUSIONS<br />
The experimental and calculated VCD spectra of amino acid 1 are<br />
reported and the absolute configuration is <strong>de</strong>termined. The PCM mo<strong>de</strong>l with the<br />
addition of specific water molecules produces accurate VCD and IR calculated<br />
spectra for the amino acid. The mo<strong>de</strong>l can be exten<strong>de</strong>d to other molecules such<br />
as pepti<strong>de</strong>s. This protocol presents a promising approach for the <strong>de</strong>termination<br />
of the absolute configuration of amino acids in aqueous solution.<br />
EXPERIMENTAL SECTION<br />
The chiral amino acid was prepared from its butyl ester by hydrolysis in<br />
MeOH with NaOH, followed by purification on the column.[11,13]<br />
4<br />
4<br />
4<br />
4<br />
5<br />
5<br />
5<br />
4'<br />
4'<br />
6<br />
5<br />
6<br />
6<br />
6<br />
7<br />
7<br />
7<br />
7<br />
8<br />
4<br />
0<br />
-4<br />
-8<br />
0.3<br />
0.1<br />
-0.1<br />
-0.3<br />
-0.5<br />
ΔA x 10 5<br />
Absorbance
DETERMINATION OF THE ABSOLUTE CONFIGURATION OF 3-AMINO-3-(TETRAHYDROFURAN) …<br />
To compute the structure of the amino acid, we used Hyperchem<br />
software (Hypercube, Inc., Gainesville, FL). All structural and spectroscopic<br />
calculations were performed using Gaussian 03. Structural optimizations were<br />
conducted un<strong>de</strong>r the polarizable continuum mo<strong>de</strong>l (PCM) self-consistent<br />
reaction field (SCRF). Once a standard optimization was performed with PCM,<br />
the molecule was consi<strong>de</strong>red to be <strong>full</strong>y optimized. The VCD spectrum of the<br />
molecule was calculated in PCM, and this calculation was exten<strong>de</strong>d to find<br />
the VCD spectra of 1. Calculations were repeated for systems with zero or three<br />
explicit water molecules using B3LYP/6-31G(d) basis sets and functionals.<br />
Spectra were analyzed and compared. Mo<strong>de</strong> assignments are based on the<br />
animation of vibrations in Gaussview 3.1.<br />
All VCD measurements were performed on a ChiralIR spectrometer<br />
(BioTools, FL, USA). The amino acid was dissolved in H2O solution at the<br />
concentration of 1.3 M. Spectra were collected for 4 hours in a 9 µm path length<br />
cell. The final VCD spectra were corrected by subtracting the corresponding<br />
solvent spectra (water) measured in the same conditions.<br />
REFERENCES<br />
1. R. Pfau, H. Priepke, K. Gerlach, W. Wienen, A. Schuler-Metz, H. Nar, S. Handschuh,<br />
in, (Boehringer Ingelheim International G.m.b.H., Germany; Boehringer Ingelheim<br />
Pharma G.m.b.H. & Co. K.-G.). Application: WO, 2005, 268 pp.<br />
2. T. Ziegler, D. Roseling, L.R. Subramanian, Tetrahedron: Asymmetry, 2002, 13, 911.<br />
3. S.J. Zuend, M.P. Coughlin, M.P. Lalon<strong>de</strong>, E.N. Jacobsen, Nature (London, U. K.)<br />
2009, 461, 968.<br />
4. T.K. Chakraborty, S. Ghosh, S. Jayaprakash, Curr. Med. Chem., 2002, 9, 421.<br />
5. S. Kotha, Acc. Chem. Res., 2003, 36, 342.<br />
6. M.G. Natchus, X. Tian, Org. Synth.: Theory Appl., 2001, 5, 89.<br />
7. K. Plankensteiner, H. Reiner, B.M. Ro<strong>de</strong>, Curr. Org. Chem., 2005, 9, 1107.<br />
8. F. Schweizer, Angew. Chem., Int. Ed., 2002, 41, 230.<br />
9. J. Yoneda, A. Andou, K. Takehana, Curr. Rheumatol. Rev., 2009, 5, 252.<br />
10. A. Grauer, A. Spaeth, D. Ma, B. Koenig, Chem.--Asian J., 2009, 4, 1134.<br />
11. Z. Han, K. Gerlach, D. Krishnamurthy, B. Matthes, H. Nar, H. Priepke, A. Schuler-<br />
Metz, C.H. Senanayake, P. Sieger, W. Tang, W. Wienen, Y. Xu, N.K. Yee, in,<br />
(Boehringer Ingelheim International G.m.b.H., Germany; Boehringer Ingelheim<br />
Pharma Gmbh & Co. K.-G.; Pfau, Roland), 2008, WO 2008080891.<br />
12. N. Hauel, A. Ceci, H. Doods, I. Konetzki, J. Mack, H. Priepke, A. Schuler-Metz, R.<br />
Walter, D. Wie<strong>de</strong>nmayer, in, (Boehringer Ingelheim International GmbH, Germany).<br />
2010097372.<br />
13. K. Lavrador, D. Guillerm, G. Guillerm, Bioorg. Med. Chem. Lett., 1998, 8, 1629.<br />
227
S. MA, S. SHEN, Z. HAN, Y. XU, H. LEE, D. KRISHNAMURTHY, C. SENANAYAKE, N. GRINBERG<br />
14. D.D. Long, M.D. Smith, A. Martin, J.R. Wheatley, D.G. Watkin, M. Mueller, G.W.J.<br />
Fleet, J. Chem. Soc., Perkin Trans., 2002, 1, 1982.<br />
15. D.M. Walker, E.W. Logusch, Tetrahedron Lett., 1989, 30, 1181.<br />
16. S. Ma, C.A. Busacca, K.R. Fandrick, T. Bartholomeyzik, N. Haddad, S. Shen, H. Lee,<br />
A. Saha, N. Yee, C. Senanayake, N. Grinberg, Org. Lett., 2010, 12, 2782.<br />
17. T.B. Freedman, X. Cao, R.K. Dukor, L.A. Nafie, Chirality, 2003, 15, 743.<br />
18. P.J. Stephens, F.J. Devlin, J.-J. Pan, Chirality, 2008, 20, 643.<br />
19. C.S. Ashvar, F.J. Devlin, K.L. Bak, P.R. Taylor, P.J. Stephens, J. Phys. Chem.,<br />
1996, 100, 9262.<br />
20. J.R. Cheeseman, M.J. Frisch, F.J. Devlin, P.J. Stephens, Chem. Phys. Lett., 1996,<br />
252, 211.<br />
21. P.J. Stephens, C.S. Ashvar, F.J. Devlin, J.R. Cheeseman, M.J. Frisch, Mol. Phys.,<br />
1996, 89, 579.<br />
22. M. Frisch, in Gaussian 03, Revision B. 03, 2003.<br />
23. P.J. Stephens, J. Phys. Chem., 1985, 89, 784.<br />
24. P.J. Stephens, J. Phys. Chem., 1987, 91, 1712.<br />
25. F. Floris, M. Persico, A. Tani, J. Tomasi, Chem. Phys. Lett., 1992, 199, 518.<br />
26. S. Miertus, V. Frecer, M. Majekova, J. Mol. Struct.: THEOCHEM, 1988, 48, 353.<br />
27. A.J. Duben, S. Miertus, Chem. Phys. Lett., 1982, 88, 395.<br />
28. E. Deplazes, W. van Bronswijk, F. Zhu, L.D. Barron, S. Ma, L.A. Nafie, K.J. Jalkanen,<br />
Theor. Chem. Acc., 2008, 119, 155.<br />
29. K.J. Jalkanen, I.M. Degtyarenko, R.M. Nieminen, X. Cao, L.A. Nafie, F. Zhu, L.D.<br />
Barron, Theor. Chem. Acc., 2008, 119, 191.<br />
228
STUDIA UBB CHEMIA, LVI, 1, 2011<br />
INVESTIGATION OF INITIAL PEROXIDE INDEX VALUE<br />
INFLUENCE ON AFB1, AFB2, AFG2 AND T-2 MYCOTOXINS<br />
DECOMPOSITION IN SUNFLOWER OIL<br />
PAUL ŞERBAN AGACHI a , GOMBOS SÁNDOR b<br />
ABSTRACT. In this paper, experiments were conducted to investigate<br />
mycotoxins homogenous photo<strong>de</strong>gradation using various peroxi<strong>de</strong> in<strong>de</strong>x (IP,<br />
caused by peroxi<strong>de</strong>s and hydroperoxi<strong>de</strong>s) in or<strong>de</strong>r to assess the efficiency of<br />
sunflower oil <strong>de</strong>contamination by ultravilolet light irradiation. Was studied the<br />
UV assisted peroxi<strong>de</strong>s activation, their contribution to <strong>de</strong>compose mycotoxins,<br />
to <strong>de</strong>crease their concentration. Was proposed a mathematical mo<strong>de</strong>l of the<br />
process, mo<strong>de</strong>l parameters were i<strong>de</strong>ntified and adjusted with software<br />
environment. The photo<strong>de</strong>gradation process efficiency increased differentiated<br />
using sunflower oil with higher peroxi<strong>de</strong> in<strong>de</strong>xes; there exist optimal values of<br />
peroxi<strong>de</strong> in<strong>de</strong>x for each investigated mycotoxin. This way, the observed rate<br />
constants can be increased and the residual mycocotoxin concentration can<br />
be <strong>de</strong>creased. Using favorable peroxi<strong>de</strong> in<strong>de</strong>x value in <strong>de</strong>contamination<br />
process provi<strong>de</strong>s an effective technology for the removal of mycotoxins from<br />
contaminated sunflower oil. The rapid <strong>de</strong>gradation is related to the inherently<br />
contented peroxi<strong>de</strong>s transformation in reactive free radicals, this radicals<br />
reacting with mycotoxins. With the elaborated mo<strong>de</strong>l is possible to predict<br />
the concentrations of residual mycotoxins in different operating conditions<br />
<strong>de</strong>pending on initial peroxi<strong>de</strong> in<strong>de</strong>x values.<br />
Keywords: Mycotoxins, Aflatoxin B1, Aflatoxin B2, Aflatoxin G2, T-2 toxin,<br />
photochemical <strong>de</strong>gradation, ultraviolet light, sunflower oil, peroxi<strong>de</strong><br />
in<strong>de</strong>x, HPLC.<br />
INTRODUCTION<br />
The term "mycotoxin" is usually reserved for toxic chemicals produced<br />
by fungi which commonly colonize crops [1]. Most plant parasitic fungi use<br />
oxygen and are found almost everywhere in small quantities, as a result of<br />
dispersion of spores. They metabolize organic substances, they <strong>de</strong>velops where<br />
humidity and temperature are favorable. Species of fungi can produce different<br />
mycotoxins, and/or a mycotoxin may be produced by several species [2]. In 1971,<br />
Turner systematized 500 species of fungi and 1200 secondary metabolites.<br />
Hawksworth (1991) i<strong>de</strong>ntified 69000 species of fungi, representing only 5%<br />
of all species, said the availability of the 1,5 million secondary metabolites.<br />
a Babeş-Bolyai University, Faculty of Chemistry and Chemical Engineering, 11. Arany Janos,<br />
RO-400028 Cluj-Napoca, Romania, sagachi@staff.ubbcluj.ro<br />
b Sapientia University Cluj-Napoca, Faculty of Sciences Miercurea Ciuc, 1. Piata Libertatii,<br />
RO-530104 Miercurea Ciuc, Romania, gombossandor@sapientia.siculorum.ro
230<br />
PAUL ŞERBAN AGACHI, GOMBOS SÁNDOR<br />
Other assessments have evaluated approximately 100000 secondary<br />
metabolites. Mycotoxins can appear in the food chain as a result of fungal<br />
infection of crops, that are consumed by humans or used as animal feeds.<br />
Even at extreme temperatures of processing, such as by boiling or roasting in<br />
the preparation process of foods (100-200 °C), mycotoxins <strong>de</strong>compose very<br />
slowly. International Commission seeks to achieve regulatory universal limit<br />
standards for mycotoxins concentrations in foods. Currently over 100 countries<br />
have adopted regulations for mycotoxins, special attention are accor<strong>de</strong>d to<br />
food industry, in which 13 groups of mycotoxins are reason of concern [3].<br />
Based on chemical structure, mycotoxins can be classified in coumarin<br />
<strong>de</strong>rivatives, malonates, mevalonates, acetates and unsaturated lactones [4].<br />
Figure 1 shows the molecular formulas of the most important<br />
representatives of the family of mycotoxins.<br />
CH3<br />
C O<br />
O<br />
O<br />
O<br />
O H<br />
CH2<br />
CH3 O<br />
O<br />
C CH3<br />
C CH3 O<br />
O<br />
O O<br />
OCH3<br />
O<br />
O O<br />
O<br />
O O<br />
O<br />
O<br />
OCH3<br />
O<br />
O O<br />
T-2 Toxin Aflatoxin G2 Aflatoxin B1 Aflatoxin B2<br />
Figure 1. Chemical structure of studied mycotoxins<br />
Table 1 shows the molecular formulas, molar masses and melting<br />
temperatures of the investigated mycotoxins.<br />
Table 1. Molecular formulas, molar masses and melting temperatures<br />
of the investigated mycotoxins<br />
Mycotoxin Molecular formula Molar mass, Melting temperature,<br />
g/mol<br />
(ºC)<br />
AFB1 C17 H12O6 312 268-269<br />
AFB2 C17 H14O6 314 286-289<br />
AFG2 C17 H14O7 330 237-240<br />
T-2 C24 H34O9 466 282<br />
Mathematical mo<strong>de</strong>l<br />
The inactivation of mycotoxins by ultraviolet light involves two stages.<br />
In the first stage, the mycotoxins have to difuse to the radiation exposed area.<br />
If the mycotoxin molecule reaches a sufficiently small distance (λ) of surface<br />
irradiance, the photons are absorbed mainly by mycotoxins and peroxi<strong>de</strong>s,<br />
peroxi<strong>de</strong> molecules generates free radicals, free radicals reacts with excited<br />
state mycotoxins, this way mycotoxins are inactivated. Distance λ is the<br />
penetration <strong>de</strong>pth of radiation, where the photon flux is 10% of the initial<br />
flow at the surface radiation I0.<br />
O<br />
O<br />
O CH3<br />
O
INVESTIGATION OF INITIAL PEROXIDE INDEX VALUE INFLUENCE ON AFB1, AFB2, AFG2 AND T-2 …<br />
Un<strong>de</strong>r UV <strong>de</strong>contamination process, unsaturated fatty acids specific<br />
autoxidation reactions not take place due to lack of contact with atmospheric<br />
oxygen and dissolved oxygen in sunflower oil, preliminary was removed the<br />
dissolved oxygen by vacuum <strong>de</strong>gassing. Instead, must cosi<strong>de</strong>r hydroperoxi<strong>de</strong>s<br />
and peroxi<strong>de</strong>s which are inherently present in sunflower oil due to storage<br />
and manufacturing process steps and the peroxi<strong>de</strong>s and hydroperoxi<strong>de</strong>s<br />
possible <strong>de</strong>composition reactions by the action of UV radiation.<br />
Parameters and refining stages can <strong>de</strong>cisively influence the effectiveness<br />
of UV treatment (UV absorbance, peroxi<strong>de</strong> in<strong>de</strong>x). The peroxi<strong>de</strong> in<strong>de</strong>x is usually<br />
expressed in meq/kg, also the peroxi<strong>de</strong> in<strong>de</strong>x can be expressed in SI units<br />
as milimoles per kilogram. The value expressed in milimoles/kg is half of that<br />
expressed in meq/kg. The method is based on the properties of peroxi<strong>de</strong>s<br />
and hydroperoxi<strong>de</strong>s to free molecular iodine in the acidic environment from<br />
potassium iodi<strong>de</strong>. Released iodine is very reactive and can be linked by double<br />
bonds of unsaturated fatty acids, which will lead to an error in <strong>de</strong>termining the<br />
peroxi<strong>de</strong> in<strong>de</strong>x. To block this reaction is carried out in chloroform and glacial<br />
acetic acid (2:1). High acidity environment <strong>de</strong>terminine virtually blocking of the<br />
double bonds of unsaturated fatty acids. According to Daneshvar et al. studies [5],<br />
high concentrations of peroxi<strong>de</strong>s can lead reactions between peroxi<strong>de</strong>s and<br />
generated free radicals, <strong>de</strong>creasing the <strong>de</strong>contamination capacity. Therefore,<br />
high concentrations of peroxi<strong>de</strong>s and hydroperoxi<strong>de</strong>s does not offer benefits,<br />
on the other hand are not even allowed in the finished product (CMA 3.0 mEq/kg).<br />
253,7 nm wavelength is most effective in terms of excitation of mycotoxins,<br />
since photons are efficiently absorbed by mycotoxins at this specific wavelength.<br />
UV light with wavelengths below 230 nm is most effective for the dissociation<br />
of peroxi<strong>de</strong>s and hydroperoxi<strong>de</strong>s [6].<br />
In limited area of concentrations of investigated mycotoxins can be<br />
performed the <strong>de</strong>gradation kinetics linearization, especially if it seeks to<br />
minimize changes of essential fatty acids, which logically require a<br />
relatively short irradiation times. We can write the equation:<br />
[ ]<br />
d MT<br />
− = kapMT [ MT]<br />
dt<br />
231<br />
(1)<br />
For each mycotoxin, [ MT ] represent the actual concentration of<br />
mycotoxin, k apMT is the pseudo-first or<strong>de</strong>r transformation constant, t is the<br />
time of irradiation [7]. According to the analytical <strong>de</strong>terminations carried out,<br />
peroxi<strong>de</strong>s and hydroperoxi<strong>de</strong>s (which concentrations are expressed by peroxi<strong>de</strong><br />
in<strong>de</strong>x) <strong>de</strong>composes un<strong>de</strong>r the action of UV radiation, their <strong>de</strong>composition<br />
generating free radicals that contribute to the <strong>de</strong>gradation of mycotoxins.<br />
The relation between kapMT and peroxi<strong>de</strong> in<strong>de</strong>x (IP) can be mo<strong>de</strong>led by linear<br />
regression. The mo<strong>de</strong>l can be <strong>de</strong>fined by consi<strong>de</strong>ring ineffective the inhibitory
232<br />
PAUL ŞERBAN AGACHI, GOMBOS SÁNDOR<br />
reactions caused by the direct irradiation of the mycotoxins. This account is<br />
very plausible, because in an inert environment, even if mycotoxins are<br />
irradiated, they <strong>de</strong>composing just very slowly. In conclusion, k apMT can be<br />
expressed as:<br />
a[ IP] / [ MT]<br />
0 0<br />
k = (2)<br />
apMT<br />
2<br />
1 + b( IP / MT ) + c( IP / MT )<br />
[ ] [ ] [ ] [ ]<br />
0 0 0 0<br />
where k is the <strong>de</strong>pen<strong>de</strong>nt variable, a, b and c are mo<strong>de</strong>l parameters,<br />
apMT<br />
and [ IP] is the initial peroxi<strong>de</strong> in<strong>de</strong>x value is the reaction mass. The<br />
0<br />
calculated values of Reynolds criteria for the flow regimes clearly indicate<br />
the laminar flow in the UV reactor. Therefore, it might be consi<strong>de</strong>red as<br />
operating with an i<strong>de</strong>al tubular reactor [8]. For a PFR (tubular) reactor, the<br />
equation that <strong>de</strong>scribes the operation can be <strong>de</strong>scribed as follows:<br />
[ ]<br />
d MT r<br />
dV ν<br />
MT<br />
− = − , (3)<br />
π 2 2<br />
d MT<br />
where V = ( d − d 0 i ) l,<br />
and − r = −<br />
(4)<br />
AMT<br />
4<br />
dt<br />
In previous relations V, ν 0 ,d0, di and l are the volume, volume flow,<br />
inner diameter, outer diameter and the length of photochemical reactor [9].<br />
From the last two equations we get:<br />
2 2<br />
[ ] π /4( d − d 0 i ) [ ]<br />
0<br />
[ ]<br />
d MT<br />
−<br />
dl<br />
=<br />
ν 0<br />
⎛ d MT<br />
⎜− ⎝ dt<br />
⎞<br />
⎟<br />
(5)<br />
⎠<br />
With the additional use of previous equations, the obtained mo<strong>de</strong>l is:<br />
2 2<br />
d[ MT]<br />
π /4 ( d − d 0 i ) ⎛ a[ IP] / [ MT]<br />
⎞<br />
0 0<br />
− =<br />
⎜ [ MT ]<br />
2<br />
dl ν ⎜ ⎟<br />
1 + b( 0 [ IP] / [ MT ] ) + c( [ IP] / [ MT ] ) ⎟<br />
⎝ 0 0 0 0 ⎠<br />
(6)<br />
EXPERIMENTAL SECTION<br />
Materials<br />
AFB1, AFB2, AFG2 and T-2 toxin standards were purchased from<br />
Makor Chemicals Ltd. (Jerusalem, Israel), sunflower oil was purchased<br />
from SC Expur SA, methanol (HPLC gra<strong>de</strong>) was purchased from Sigma-<br />
Aldrich (Redox Lab Supplies Com SRL), and carbon dioxi<strong>de</strong> was purchased<br />
from Lin<strong>de</strong> Gaz România SRL.
INVESTIGATION OF INITIAL PEROXIDE INDEX VALUE INFLUENCE ON AFB1, AFB2, AFG2 AND T-2 …<br />
Reactor system<br />
The <strong>de</strong>gradation experiments were conducted in reactor system,<br />
100 ml plug-flow photoreactor was serial connected with a jacketed vessel,<br />
used for temperature control and stirring. The scheme of the used experimental<br />
treatment system is presented in figure 2.<br />
Figure 2. The used experimental system<br />
1- PFR photoreactor;<br />
2- storage vessel;<br />
3- ultrathermostat;<br />
4- adjustable flow pump;<br />
5- pump control unit;<br />
6- stabilized power supply;<br />
7- UV power source control unit;<br />
8- CO 2 cylin<strong>de</strong>r.<br />
In the UV activation experiment, a 20 W Philips-LPMHO (Low Pressure<br />
Mercury High Output) was used as the light source. UV source measured<br />
emission power was 29,8 mW/cm 2 at 5 cm distance, volume flow was 185<br />
ml/min, system temperature was 20 °C. All experiments were carried out in<br />
same conditions. Carbon dioxi<strong>de</strong> gas adding was used to remove of atmospheric<br />
oxygen.<br />
Analysis<br />
The <strong>de</strong>gradation of mycotoxins was monitored by HPLC. The reaction<br />
mass samples were processed using Hettich Micro 20 centrifuge (13000 rot/min,<br />
5 minutes), was split the higher <strong>de</strong>nsity oil phase, which was pipetted into<br />
233
234<br />
PAUL ŞERBAN AGACHI, GOMBOS SÁNDOR<br />
an extraction bottle, it was <strong>de</strong>termined the mass, after this was performed<br />
methanol extraction of mycotoxins in 8 steps, obtained mixtures were separated<br />
with Hettich Universal 32 centrifuge (3400rot./min, 5 minutes), alcoholic liquid<br />
phases were pipetted and unified. Since resulted alcoholic mixtures were<br />
cloudy, a new set of centrifugations were carried out to realise the perfect<br />
separation. Obtained methanolic extracts were subjected to evaporation, and<br />
portions of extracts was injected in Varian Pro Star HPLC, using fluorescent<br />
and UV <strong>de</strong>tector, Supelcosil LC 18 column, flow rate was 0,9 ml/min, without<br />
<strong>de</strong>rivatization. HPLC equipment was controlled with Varian Star Chromatography<br />
Workstation Version 6.00 software. The eluent was water-methanol-acetonitrile<br />
mixture, with 130:70:40 ratio. Fluorescence <strong>de</strong>tector was set for excitation at<br />
365 nm, and the emission at 435 nm. Based on HPLC chromatograms provi<strong>de</strong>d<br />
by the HPLC, we can evaluate the concentration of MT in the samples, which<br />
is proportional to the area un<strong>de</strong>r the signal curve offered by that component.On<br />
the basis of changes in <strong>de</strong>creasing concentrations of mycotoxins, taking into<br />
account the fact that the concentration of mycotoxins is much smaller than the<br />
concentration of peroxidies who are sensitive to UV irradiation, as previously<br />
we found a 12-27% reduction in the amount of IP in the time of UV treatment,<br />
we assumed that the <strong>de</strong>termining factor of <strong>de</strong>composition speed may be the<br />
initial peroxi<strong>de</strong> (IP0) of sunflower oil un<strong>de</strong>r photochemical <strong>de</strong>contamination.<br />
Because IP0 have <strong>de</strong>terminant influence on the kinetics of photo<strong>de</strong>gradation<br />
process, we performed a series of experimental <strong>de</strong>terminations<br />
with contaminated sunflower oil, starting with different initial concentrations<br />
of peroxi<strong>de</strong>s, peroxi<strong>de</strong> in<strong>de</strong>x, respectively. Initial, the sunflower oil IP value was<br />
IP0 = 0,89 and for the next experimental <strong>de</strong>terminations became necessary<br />
preparation of sunflower oil with higher IP values. To this, in sunflower oil was<br />
introduced dry air until was reached a higher peroxi<strong>de</strong> in<strong>de</strong>x, after that was<br />
applied preparation of mixtures between the original sunflower oil and artificially<br />
increased IP oil [10], were prepared samples with required peroxi<strong>de</strong> in<strong>de</strong>xes<br />
(1-10) for further <strong>de</strong>terminations.<br />
RESULTS AND DISCUSSION<br />
Variations of mycotoxins HPLC areas (AMT) by the starting IP (IP0)<br />
are shown in table 2, mycotoxins concentrations variation (dcAFB1, dcAFB2) and<br />
apparent photo<strong>de</strong>gradation constant variation (kapAFB1, kapAFB2) according on<br />
ratio between initial peroxi<strong>de</strong> in<strong>de</strong>x value (IP0) and initial mycotoxin concentration<br />
([MT]0) are shown in table 3 and 4.<br />
Variations in concentrations (c/c0 MT) of the studied mycotoxins by<br />
the starting IP (IP0) of the reaction mass (with equal times of irradiation) are<br />
shown in figure 3.
INVESTIGATION OF INITIAL PEROXIDE INDEX VALUE INFLUENCE ON AFB1, AFB2, AFG2 AND T-2 …<br />
Table 2. Variations of mycotoxins HPLC areas (AMT) according<br />
on initial peroxi<strong>de</strong> in<strong>de</strong>x (IP0) of sunflower oil<br />
IP 0 A AFB1 A AFB2 A AFG2 A T2<br />
1 147994 96304 98251 132562.00<br />
2 146805 95859 97528 131734.00<br />
3 145794 95347 96734 130763.00<br />
4 144758 94985 96045 130095.00<br />
5 142894 94438 95264 129264.00<br />
6 141634 93985 94467 128321.00<br />
7 140421 93589 93793 127563.00<br />
8 139452 93245 93049 126635.00<br />
9 138253 92675 92330 125865.00<br />
10 137045 92236 91524 125058.00<br />
Table 3. AFB1, AFB2 concentrations variation (cAFB1, cAFB2) according on ratio between<br />
initial peroxi<strong>de</strong> in<strong>de</strong>x value (IP0) and initial mycotoxin concentration ([MT]0)<br />
c AFB1 c AFB2 IP 0/[MT] 0<br />
2.00000 2.00000 0.5<br />
1.98393 1.99076 1.0<br />
1.97027 1.98013 1.5<br />
1.95627 1.97261 2.0<br />
1.93108 1.96125 2.5<br />
1.91405 1.95184 3.0<br />
1.89766 1.94362 3.5<br />
1.88456 1.93647 4.0<br />
1.86836 1.92463 4.5<br />
1.85203 1.91552 5.0<br />
Table 4. AFG2, T-2 concentrations variation (cAFB1, cAFB2) according on ratio between<br />
initial peroxi<strong>de</strong> in<strong>de</strong>x value (IP0) and initial mycotoxin concentration ([MT]0)<br />
c AFG2 c T2 IP 0/[MT] 0<br />
2.00000 2.00000 0.5<br />
1.98528 1.98751 1.0<br />
1.96912 1.97286 1.5<br />
1.95509 1.96278 2.0<br />
1.93920 1.95024 2.5<br />
1.92297 1.93601 3.0<br />
1.90925 1.92458 3.5<br />
1.89411 1.91058 4.0<br />
1.87947 1.89896 4.5<br />
1.86307 1.88679 5.0<br />
235
236<br />
PAUL ŞERBAN AGACHI, GOMBOS SÁNDOR<br />
Figure 3. Variations of relative concentrations of MT (c/c0MT)<br />
<strong>de</strong>pending on the initial IP value of reaction mass (IP0)<br />
Variations of the mycotoxins (AFB1, AFB2, AFG2 and T-2) concentrations<br />
(dcMT) <strong>de</strong>pending on the ratio between initial peroxi<strong>de</strong> in<strong>de</strong>x and initial mycotoxin<br />
concentration (IP0/[MT]0) are presented in figure 4.<br />
Figure 4. Variations of AFB1, AFB2, AFG2 and T-2 concentrations (dcMT)<br />
<strong>de</strong>pending on the ratio between initial peroxi<strong>de</strong> in<strong>de</strong>x and initial<br />
mycotoxin concentration (IP0/[MT]0)<br />
Variations of the studied MT photo<strong>de</strong>gradation apparent coefficients<br />
(kapAFB1, kapAFB2, kapAFG2 and kapT2) <strong>de</strong>pending on the initial peroxi<strong>de</strong> in<strong>de</strong>x of<br />
the reaction mass (IP0) are presented in figure 5.
INVESTIGATION OF INITIAL PEROXIDE INDEX VALUE INFLUENCE ON AFB1, AFB2, AFG2 AND T-2 …<br />
Figure 5. Variations of the studied MT photo<strong>de</strong>gradation apparent coefficients<br />
(kapAFB1, kapAFB2, kapAFG2 and kapT2) <strong>de</strong>pending on the initial peroxi<strong>de</strong><br />
in<strong>de</strong>x of the reaction mass (IP0)<br />
To obtain the individual kinetic parameters for MT, we adjusted the<br />
experimental data to the proposed mo<strong>de</strong>l by Polymath software environment.<br />
Using the mo<strong>de</strong>l equation, the parameters of individual mo<strong>de</strong>ls with 95%<br />
confi<strong>de</strong>nce level and using the sum of the squares error method (SSE) as a<br />
function of error were obtained by nonlinear regression; results are presented<br />
in Figures 6, 7, 8 and 9.<br />
k apAFB1<br />
Figure 6. AFB1 experimental data adjustment<br />
237
k apAFB2<br />
k apAFG2<br />
238<br />
kapT − 2<br />
PAUL ŞERBAN AGACHI, GOMBOS SÁNDOR<br />
Figure 7. AFB2 experimental data adjustment<br />
Figure 8. AFG2 experimental data adjustment<br />
Figure 9. T-2 experimental data adjustment
INVESTIGATION OF INITIAL PEROXIDE INDEX VALUE INFLUENCE ON AFB1, AFB2, AFG2 AND T-2 …<br />
Values obtained by regression of the parameters a, b and c is presented<br />
in Table 5.<br />
Table 5. Values obtained by regression of the mo<strong>de</strong>l parameters<br />
for the MT photo<strong>de</strong>gradation<br />
Parameter AFB1 AFB2 AFG2 T-2<br />
a 0,0029 0,0155 0,0028 0,0030<br />
b 0,4489 0,2642 0,3454 0,4407<br />
c 0,0498 0,0808 0,0562 0,0820<br />
RESULTS AND DISCUSSION<br />
On the basis of changes in <strong>de</strong>creasing concentrations of mycotoxins,<br />
taking into account the fact that the concentration of mycotoxins is much<br />
smaller than the concentration of peroxidies who are sensitive to UV irradiation,<br />
as previously we found a 12-27% reduction in the amount of IP in the time of<br />
UV treatment, we assumed that the <strong>de</strong>termining factor of <strong>de</strong>composition speed<br />
may be the initial peroxi<strong>de</strong> (IP0) of sunflower oil un<strong>de</strong>r photochemical <strong>de</strong>contamination.<br />
Because IP0 have <strong>de</strong>terminant influence on the kinetics of photo<strong>de</strong>gradation<br />
process, we performed a series of experimental <strong>de</strong>terminations<br />
with contaminated sunflower oil, starting with different initial concentrations<br />
of peroxi<strong>de</strong>s, peroxi<strong>de</strong> in<strong>de</strong>x, respectively. Initial, the sunflower oil IP value was<br />
IP0 = 0,89 and for the next experimental <strong>de</strong>terminations became necessary<br />
preparation of sunflower oil with higher IP values. To this, in sunflower oil was<br />
introduced dry air until was reached a higher peroxi<strong>de</strong> in<strong>de</strong>x, after that was<br />
applied preparation of mixtures between the original sunflower oil and artificially<br />
increased IP oil, were prepared samples with required peroxi<strong>de</strong> in<strong>de</strong>xes (1-10)<br />
for further <strong>de</strong>terminations.<br />
CONCLUSIONS<br />
The proposed mo<strong>de</strong>l for prediction of AFB1 photo<strong>de</strong>gradation has a<br />
maximum for k at around 3,0 for the apAFB1<br />
[ IP] / [ AFB 1]<br />
ratio, which is in<br />
0 0<br />
good agreement with experimental data obtained for AFB1, which resulted for<br />
k a 2,5 value of the ratio. The proposed mo<strong>de</strong>l for prediction of AFB2<br />
apAFB1<br />
photo<strong>de</strong>gradation has a maximum for k at around 2,5 for the apAFB 2<br />
[ IP] / [ AFB 2]<br />
0 0<br />
ratio, which is in good agreement with experimental data obtained for AFB2,<br />
k a 2,0 value of the ratio. The proposed mo<strong>de</strong>l for<br />
which resulted for apAFB 2<br />
239
240<br />
PAUL ŞERBAN AGACHI, GOMBOS SÁNDOR<br />
prediction of AFG2 photo<strong>de</strong>gradation has a maximum for k at around 2,5<br />
apAFG 2<br />
for the [ IP] / [ AFG 2]<br />
ratio, which is in good agreement with experimental data<br />
0 0<br />
obtained for AFG2, where resulted for k a 2,0 value of the ratio. The<br />
apAFG 2<br />
proposed mo<strong>de</strong>l for prediction of T-2 photo<strong>de</strong>gradation has a maximum for<br />
k at around 3,0 for the apT −2 [ IP] / [ T − 2]<br />
ratio, which is in good agreement<br />
0 0<br />
with experimental data obtained for T-2, where resulted for k a 2,5 value<br />
apT −2 of the ratio.<br />
The constructed mo<strong>de</strong>ls are useful to estimate the initial IP <strong>de</strong>mand<br />
(IP0) for the efficient photochemical <strong>de</strong>gradation of mycotoxins in each case.<br />
On the other hand, it becomes obvious need for the sunflower oil refining<br />
such that when performing <strong>de</strong>contamination of mycotoxins, to achieve the<br />
photo<strong>de</strong>gradation with low UV doses, must have IP0 values between certain<br />
limits, <strong>de</strong>pending on the nature of the present mycotoxins.<br />
The necessary IP0 values for <strong>de</strong>contamination at the same time<br />
require restrictions on storage conditions and storage period of sunflower<br />
seeds in silos.<br />
After substituting the appropriate values of a, b and c for each mycotoxin,<br />
using d0 and di, we can be obtain the mycotoxins concentrations at different<br />
lengths of the photoreactor, starting from initial concentrations of mycotoxins<br />
and from the initial value of IP, for different flow speeds through the fotoreactor.<br />
As we can see, it is possible to predict the concentrations of mycotoxins in<br />
different operating conditions <strong>de</strong>pending on IP0.<br />
Based on obtained experimental data, on the four investigated molecular<br />
species of mycotoxins, un<strong>de</strong>r i<strong>de</strong>ntical conditions, by comparing obtained data,<br />
we may notice some differences and similarities in the photochemical<br />
behavior of these mycotoxins. Highest sensitivity to the effect of peroxi<strong>de</strong>s<br />
and hydroperoxi<strong>de</strong>s <strong>de</strong>cay occurs in case of AFB1, followed by T-2 toxin, AFB2,<br />
and finally, AFB1 showing the lowest sensitivity to peroxi<strong>de</strong> in<strong>de</strong>x increase<br />
(at usual values), and at the same time it can be observed the existence for<br />
AFB1 of a favorable IP0 for photo<strong>de</strong>gradation process, which may be in<br />
correspon<strong>de</strong>nce with the behavior of other chemical species which are<br />
present in the matrix of sunflower oil.<br />
ACKNOWLEDGMENTS<br />
The authors are in<strong>de</strong>bted to the referee for some critical suggestions lea<strong>de</strong>d<br />
us to correct our main result. This work was partially supported by the Sapientia University<br />
Cluj-Napoca, Faculty of Sciences Miercurea Ciuc.
INVESTIGATION OF INITIAL PEROXIDE INDEX VALUE INFLUENCE ON AFB1, AFB2, AFG2 AND T-2 …<br />
REFERENCES<br />
1. N.W. Turner, S. Subrahmanyam, S.A. Piletsky, Anal. Chim. Acta, 2009, 632-2,<br />
168-80.<br />
2. C.A. Robbins, L.J. Swenson, M.L. Nealley, R.E. Gots, B.J. Kelman, Applied<br />
Occupational and Environmental Hygiene, 2000, 15, 773.<br />
3. H.P. van Egmond, R.C. Schothorst, M.A. Jonker, Anal Bioanal Chem, 2007, 389<br />
(1), 147.<br />
4. K. Gasztonyi, R. Lásztity, "<strong>Chimie</strong> alimentară", Ed. Mezőgazda, Budapesta, 1992.<br />
5. N. Daneshvar, M. Rabbani, N. Modirshahla, M.A. Behnajady, J. Hazard. Mater.<br />
2005, 118, 155.<br />
6. S. Clarke, W. Bettin, Army Center for Health Promotion and Preventive Medicine,<br />
2006, 31-006-0206, 15, Aber<strong>de</strong>en Proving Ground, MD.<br />
7. S. Gombos, A. Szép, 15 th International Conference of Chemistry, 2009, Tîrgu Mures,<br />
21-22.<br />
8. Z. Ye, "UV disinfection between concentric cylin<strong>de</strong>rs", 2007, PhD Thesis, Georgia<br />
Institute of Technology.<br />
9. J.R. Bolton, K.G. Lin<strong>de</strong>n, J. Environ. Eng., 2003, 129, 209.<br />
241
STUDIA UBB CHEMIA, LVI, 1, 2011<br />
PRELIMINARY INVESTIGATIONS ON CLINOPTILOLITE USAGE<br />
AS SELECTIVE ADSORBENT FOR WASTEWATER ANALYSIS<br />
CLAUDIA CIMPOIU a, *, ANDRADA MĂICĂNEANU a ,<br />
ANAMARIA HOSU a , HOREA BEDELEAN b<br />
ABSTRACT. This work presents some preliminary studies regarding natural<br />
zeolite, namely clinoptilolite (from volcanic zeolitic tuff) as selective adsorbent.<br />
This material was used to separate organic isomers of industrial interest<br />
(dichlorobenzenes, dinitrobenzenes, chloronitrobenzenes). The quality of the<br />
separations achieved were sufficiently encouraging as to promote further<br />
investigations of its potential as selective adsorbent both for bulk liquid<br />
separations and in analytical applications. These preliminary results showed<br />
that good chromatographic resolutions were obtained - RS,o,p-DCB=3.53;<br />
RS,o,p-DNB=3.09 and RS,o,p-CNB=4.25 and seem to be very promising in or<strong>de</strong>r<br />
to use this natural zeolite as selective adsorbent in different applications.<br />
Keywords: natural zeolite, clinoptilolite, selective adsorbent, dichlorobenzenes,<br />
dinitrobenzenes, chloronitrobenzene<br />
INTRODUCTION<br />
Zeolites are a group of hydrated aluminosilicates of the alkali or alkaline<br />
earth metals (sodium, potassium, magnesium, calcium), with a three-dimensional<br />
crystalline framework. Zeolite structure has a special characteristic, the aluminosilicate<br />
framework, which is formed from [SiO4] 4- and [AlO4] 5- tetrahedra, where<br />
each of the oxygen atoms belong to two neighboring tetrahedral (bonding<br />
oxygens), with the exception of those situated in the exterior of the crystal.<br />
While each [SiO4] 4- tetrahedra is charged neutral, each [AlO4] 5- tetrahedra<br />
contain an extra negative charge. This excess charge is compensated by<br />
cations, such as Na + , K + , Ca 2+ , Mg 2+ , which will be placed in the framework<br />
gaps, coordinated by a <strong>de</strong>fined number of water molecules. Silica and alumina<br />
tetrahedras are bon<strong>de</strong>d in rings, therefore the zeolite structure will contain<br />
channel and pores with diameters between 3 and 10 Å. These channels (gaps)<br />
are filled with cations and water molecules with a higher or lower mobility,<br />
<strong>de</strong>pending on the intensity of the bonds which are linked to the residual valence<br />
of the alumina tetrahedra.<br />
a<br />
Universitatea Babeş-Bolyai, <strong>Facultatea</strong> <strong>de</strong> <strong>Chimie</strong> <strong>şi</strong> <strong>Inginerie</strong> <strong>Chimică</strong>, Str. Kogălniceanu,<br />
Nr. 1, RO-400084 Cluj-Napoca,Romania, * ccimpoiu@chem.ubbcluj.ro<br />
b<br />
Universitatea Babeş-Bolyai, <strong>Facultatea</strong> <strong>de</strong> Biologie <strong>şi</strong> Geologie, Str. Kogălniceanu, Nr. 1,<br />
RO-400084 Cluj-Napoca, Romania
244<br />
CLAUDIA CIMPOIU, ANDRADA MĂICĂNEANU, ANAMARIA HOSU, HOREA BEDELEAN<br />
The main consequence of this structure type is represented by the<br />
reversibility of hydration and cation exchange processes that preserve the<br />
original network. These channels also allow easy movement (after removal<br />
of the zeolitic water) of different molecules <strong>de</strong>pending on their size. Molecules<br />
with a diameter smaller that the channel diameter will be retained insi<strong>de</strong> the<br />
zeolite framework, while higher molecules will remain in the exterior. Due to<br />
this type of selectivity towards the components of a mixture (molecule size,<br />
channel diameter), zeolites are also called molecular sieves. The existence<br />
of a negative charge in the alumina tetraedra, allows also the uses of zeolites<br />
as acid-basic catalysts. In hydrated conditions, on the surface of the zeolite<br />
Brönsted centers are formed due to the water adsorption on Al 3+ site, while<br />
upon <strong>de</strong>hydration the same site became a Lewis center [1].<br />
Natural zeolites are important aluminosilicates in sorption processes<br />
[2,3] because of their low cost and selectivity. In environmental applications,<br />
natural zeolites have been studied extensively to remove harmful substances<br />
from wastewater by adsorption and ion exchange processes [4,5].<br />
The sedimentary zeolitic rocks from Romania are represented by<br />
volcanic tuffs of Neogene age. The main zeolite present in these rocks is<br />
clinoptilolite.<br />
Clinoptilolite is a natural occurring zeolite, a hydrated aluminosillicate<br />
member of the heulandite group. Heulandite group zeolites, including mineral<br />
clinoptilolite and heulandite and their synthetic analogues, have the same<br />
framework topology (structure co<strong>de</strong> HEU) characterized by infinite threedimensional<br />
frameworks of aluminium, silicon and oxygen. The distinction<br />
between the clinoptilolite and the heulandite is based on the Si/Al ratio, i.e.,<br />
clinoptilolite if Si/Al > 4 and heulandite if Si/Al < 4 [6]. The chemistry of these<br />
two species varies almost continuously between [7]:<br />
(Na, K, Ca0,5)10(Al10Si26O72)·24H2O (heulandite, Si:Al=2,6)<br />
(Na, K, Ca0,5)5,4(Al5,4Si30,6O72)·20H2O (clinoptilolite, Si:Al=5,7)<br />
Clinoptilolite was used as adsorbent in many applications, namely:<br />
as solid-phase material for removal of some radionucli<strong>de</strong>s from low-level<br />
radioactive liquid waste [8], as a novel drug carrier for the flavonoid aglycone<br />
constituents [9] and antibiotics [10], as adsorbent for low concentration of<br />
lindane and aldrin removal from wastewater [11], as cation exchanger [12],<br />
as catalyst in the estherification of glycerol with oleic acid [13] etc.<br />
The aim of this paper was to investigate the potential of a natural<br />
zeolite, clinoptilolite (from volcanic zeolitic tuff) as selective adsorbent. A variety<br />
of aromatic isomeric structures found in wastewaters, such as dichlorobenzenes,<br />
dinitrobenzenes and chloronitrobenzene were chosen for this study.
PRELIMINARY INVESTIGATIONS ON CLINOPTILOLITE USAGE AS SELECTIVE ADSORBENT ...<br />
RESULTS AND DISCUSSION<br />
Prior chemical and mineralogical investigations realised on the zeolitic<br />
volcanic tuff samples collected from the same area, showed that: tuff samples<br />
contain high quantity of secondary and hydrated material (zeolite and probably<br />
smectitic clay minerals) as indicated by the high values of loss of ignition (L.O.I.)<br />
<strong>de</strong>termined by bulk chemical analyses; tuff samples have a vitric and vitric<br />
crystal texture and are zeolitized and they consist of 60-70% of volcanic<br />
glass, 10-25% of crystals and lithic fragments in subordinate amounts (2-3%);<br />
the zeolites are present mainly as tabular clinoptilolite; the zeolite content<br />
reached values between 70% and 80% from the crystallized fractions of the<br />
tuff (semi-quantitative estimation from the X-ray diffraction patterns); FTIR<br />
spectra indicates presence of specific zeolite peaks; specific surface area<br />
(BET) is around 35 m 2 /g [1,14].<br />
Chromatographic separation<br />
Dichlorobenzenes (DCBs), dinitrobenzenes (DNBs) and chloronitrobenzene<br />
(CNBs) are important organic intermediates which are extensively<br />
used in the production of dyes, pestici<strong>de</strong>s, pharmaceuticals and rubber<br />
chemicals. In the viewpoint of clean technology, the recovery of valuable<br />
chemicals from the wastewaters is superior to the treatment of wastewater<br />
using <strong>de</strong>gradation techniques. Based on high toxicity and stability of DCBs,<br />
DNBs and CNBs, they are resistant to bio<strong>de</strong>gradation. The application of<br />
polymeric adsorbents in the recovery of DCBs, DNBs and CNBs from the<br />
wastewaters is limited because the recovered chemicals mainly consist of a<br />
mixture of isomers, and further purification by distillation or/and crystallization is<br />
necessary to obtain pure compounds. Therefore, the exploration and utilization<br />
of selective adsorbents is highly <strong>de</strong>sirable to directly recover chemicals in<br />
high purity from wastewaters.<br />
The optimum separation of o- and p-DCB was performed using heptane<br />
mixed with 0.1% ethanol as mobile phase (Figure 1a). The retention volumes<br />
were VR,o-DCB = 0.24 mL and VR,p-DCB = 0.59 mL. These results showed that<br />
the 1,4 isomer was more strongly adsorbed on stationary phase than 1,2 isomer.<br />
The or<strong>de</strong>r of elution was preliminary <strong>de</strong>termined using standard solution of<br />
each isomer.<br />
The o- and p-DNB were best separated by elution with heptane mixed<br />
with 1% ethanol (Figure 1b). In this case the retention parameters were:<br />
VR,p-DNB = 0.15 mL and VR,o-DNB = 0.57 mL. Introduction of the nitro-groups<br />
constituted an increase in polarity and it necessitated an increase in mobile<br />
phase polarity. The o-DNB was most preferred isomer, clinoptilolite having<br />
reverse or<strong>de</strong>r of elution, compared to DCBs and CNBs.<br />
245
246<br />
20<br />
CLAUDIA CIMPOIU, ANDRADA MĂICĂNEANU, ANAMARIA HOSU, HOREA BEDELEAN<br />
0<br />
o -DCB<br />
p -DCB<br />
0 0,1 0,2 0,3 0,4 0,5 0,6 0,7 0,8<br />
Volume (mL)<br />
25<br />
0<br />
p -DNB<br />
o -DNB<br />
0 0,1 0,2 0,3 0,4 0,5 0,6 0,7<br />
Volume (mL)<br />
a b<br />
Figure 1. Separation of: a) DCBs using 0.1% ethanol in heptane as eluent and<br />
b) DNBs using 1% ethanol in heptane as eluent.<br />
30<br />
0<br />
o -CNB p -CNB<br />
0 0,1 0,2 0,3<br />
Volume (mL)<br />
0,4 0,5 0,6<br />
Figure 2. Separation of CNB isomers using heptane as eluent.<br />
The following retention volumes were obtained for the o- and p-CNB<br />
using heptane as mobile phase: VR,o-CNB = 0.09 mL and VR,p-CNB = 0.48 mL.<br />
Elution or<strong>de</strong>r was the same as with DCBs compounds, p-isomer being the<br />
most strongly boun<strong>de</strong>d (Figure 3).<br />
From these preliminary experimental data it could be observed that<br />
good chromatographic resolutions were obtained: RS,o,p-DCB=3.53; RS,o,p-DNB=3.09<br />
and RS,o,p-CNB=4.25. These results seem to be very promising in or<strong>de</strong>r to use<br />
this adsorbent as stationary phase in liquid chromatography.<br />
In or<strong>de</strong>r to completely establish the potential of natural zeolite as<br />
stationary phase in liquid chromatography further investigation such as:<br />
studies of the retention mechanism and the reproducibility of the retention<br />
parameters and comparison with other stationary phases are required.
PRELIMINARY INVESTIGATIONS ON CLINOPTILOLITE USAGE AS SELECTIVE ADSORBENT ...<br />
CONCLUSIONS<br />
The separations of DCBs, DNBs and CNBs previously observed on<br />
synthetic zeolites are confirmed here [15]. The purpose of the work reported<br />
here was to make a broadly based study of natural zeolite to assess its<br />
potential to perform bulk separations of important organic molecules. Liquid<br />
chromatography was chosen as a convenient approach, and also raised<br />
the possibility that the clinoptilolite could find use as stationary phases for<br />
this analytical technique.<br />
The results will need further study if a <strong>de</strong>tailed un<strong>de</strong>rstanding of all the<br />
factors involved in the separations is to be attained. The zeolitic tuff presented<br />
mainly as tabular clinoptilolite, is a natural zeolite with a great potential for<br />
use as stationary phase in liquid chromatography. Moreover, the quality of the<br />
separations achieved were sufficiently encouraging as to promote further<br />
investigations of its potential as solid phases both for bulk liquid separations<br />
and in analytical applications.<br />
In or<strong>de</strong>r to completely establish the potential of natural zeolite as<br />
stationary phase in liquid chromatography further investigation such as: studies<br />
of the retention mechanism and the reproducibility of the retention parameters<br />
and comparison with other stationary phases are required.<br />
EXPERIMENTAL SECTION<br />
The chromatographic separations were performed on a 20 cm glass<br />
column with internal diameter of 5 mm filled with clinoptilolite, laboratory<br />
ma<strong>de</strong>. The zeolitic volcanic tuff representative sample was collected from Măcicaş<br />
(M) quarry (Cluj County, Romania). In or<strong>de</strong>r to use this material as a stationary<br />
phase, the zeolitic volcanic tuff sample was subjected to a physical treatment<br />
(crushing, grinding, size separation) in or<strong>de</strong>r to obtain clinoptilolite samples<br />
with a grain diameter smaller than 0.2 mm.<br />
Chromatographic analyses were optimised by using a series of<br />
mobile phases (heptane 100%, heptane mixed with 0.1% and 1% ethanol).<br />
The isomers used were from the purest materials available and injected first as<br />
individual standard, and then were injected simultaneously, as mixtures, onto<br />
the columns as 25 μL stock solution, using an automatic pipette. Standard<br />
stock solutions containing 0.1 mg/mL of o- and p-DCB, o- and p-DNB and o-<br />
and p-CNB were prepared in absolute ethanol. The compound separations<br />
were monitoring using TLC and UV <strong>de</strong>tection at 254nm. For this purpose,<br />
equal fractions of the effluent were collected and then, spots from 0.03mL<br />
to 0.03mL were applied on the chromatographic plate and were examined<br />
un<strong>de</strong>r UV light. The intensity of the spots colour was examined and the spots<br />
area was <strong>de</strong>termined using ImageJ software.<br />
247
248<br />
CLAUDIA CIMPOIU, ANDRADA MĂICĂNEANU, ANAMARIA HOSU, HOREA BEDELEAN<br />
REFERENCES<br />
1. A. Măicăneanu, H. Be<strong>de</strong>lean, M. Stanca, “Zeoliţii naturali. Caracterizare <strong>şi</strong> aplicaţii<br />
în protecţia mediului”, Editura Presa Universitară Clujeană, Cluj-Napoca, 2008,<br />
chapter 1-3.<br />
2. V. Arambula-Villazana, M. Solache-Rios, M.T. Olguin, Journal of Inclusion Phenomena<br />
and Macrocyclic Chemistry, 2006, 55, 237.<br />
3. M.R. El-Naggar, A.M. El-Kamash, M.I. El-Dessouky, A.K. Ghonaim, Journal of<br />
Hazardous Materials, 2008, 154, 963.<br />
4. A. Abusafa, H. Yucel, Journal of Separation and Purification Technology, 2002,<br />
28, 103.<br />
5. P. Chutia, S. Kato, T. Kojima, S. Satokawa, Journal of Hazardous Materials, 2009,<br />
162, 204.<br />
6. D.S. Coombs, A. Alberti, T. Armbruster, G. Artioli, C. Colella, E. Galli, J.D. Grice,<br />
F. Liebau, J.A. Mandarino, H. Minato, E.H. Nickel, E. Passaglia, D.R. Peacor,<br />
S. Quartieri, R. Rinaldi, M. Ross, R.A. Sheppard, E. Tillmanns, G, Vezzalini,<br />
Mineralogical Magazine, 1998, 35, 1571.<br />
7. D.L. Bish, J.M. Boak, “Clinoptilolite-Heulandite nomenclature”, in: D.L. Bish, D.W. Ming<br />
(Eds.), Reviews in Mineralogy and Geochemistry, Natural Zeolites, Occurrence,<br />
Properties, Applications, 2001, 45, 207.<br />
8. E.H. Borai, R. Harjula, L. Malinen, A. Paajanen, Journal of Hazardous Materials,<br />
2009, 172, 416.<br />
9. S. Göktaş, S. Ülkü, O. Bayraktar, Applied Clay Science, 2008, 40, 6.<br />
10.G. Cerri, M. <strong>de</strong> Gennaro, M.C. Bonferoni, C. Caramella, Applied Clay Science,<br />
2004, 27, 141.<br />
11.M. Sprynskyy, T. Ligor, B. Buszewski, Journal of Hazardous Materials, 2008, 151,<br />
570.<br />
12.S. Hajialigol, M.A. Taher, A. Malekpour, Adsorpion Science and Technology, 2006,<br />
24, 487.<br />
13. M. Akgül, A. Karabakan, Microporous and Mesoporous Materials, 2010, 131, 238.<br />
14.H. Be<strong>de</strong>lean, A. Măicăneanu, S. Burcă, M. Stanca, Studia UBB Geologia, 2010,<br />
55, 9.<br />
15. Z. Guo, S. Zheng, Z. Zheng, F. Jiang, W. Hu, L. Ni, Water Research, 2005, 39, 1174.
STUDIA UBB CHEMIA, LVI, 1, 2011<br />
THE EFFECT OF BENTONITE ON AFB1, AFB2, AFG2 AND T-2<br />
MYCOTOXINS DECOMPOSITION IN SUNFLOWER OIL UNDER<br />
THE IRRADIATION OF ULTRAVIOLET LIGHT<br />
GOMBOS SÁNDOR a , PAUL ŞERBAN AGACHI b<br />
ABSTRACT. Bentonite was used as a photocatalyst in the <strong>de</strong>gradation of<br />
mycotoxins in sunflower oil, un<strong>de</strong>r UV-illumination. The objective of this study<br />
was to investigate and evaluate the efficiency of bentonite adding to sunflower<br />
oil to <strong>de</strong>compose the solubilised B1, B2, G2 aflatoxins and T-2 toxin by UV<br />
light irradiating, as solution to increase vegetable oil quality. I<strong>de</strong>ntification<br />
of <strong>de</strong>contaminating process particularities consists in the formulation of<br />
mathematical mo<strong>de</strong>l which <strong>de</strong>scribes the influence of process parameters<br />
on the <strong>de</strong>composition of mycotoxins. In the present work, <strong>de</strong>contamination<br />
process was studied at laboratory scale using a plug-flow photoreactor, serial<br />
connected with a buffer vessel, at constant operating temperature and<br />
irradiating time. The kinetics of photocatalytic process was assumed to follow a<br />
pseudo-first-or<strong>de</strong>r rate law. The apparent photo<strong>de</strong>gradation rate constant<br />
<strong>de</strong>pend strongly on the present mycotoxin, the bentonite catalyst contribute to<br />
obtain much lower mycotoxin concentrations. The mo<strong>de</strong>l predicted maximum<br />
values of apparent photo<strong>de</strong>gradation constants were compared with the<br />
experimental data, the mo<strong>de</strong>l was verified.<br />
Keywords: Mycotoxins, Aflatoxin B1, Aflatoxin B2, Aflatoxin G2, T-2 toxin,<br />
photochemical <strong>de</strong>gradation, ultraviolet light, sunflower oil, kinetics,<br />
reaction mechanism, HPLC.<br />
INTRODUCTION<br />
There is a growing negative reaction of the consumer public to ad<strong>de</strong>d<br />
synthetic chemical compounds or existence of toxic chemicals in foods, such<br />
as for mycotoxins [1]. To approach the challenges and problems of the food<br />
industry, there are alternative possibilities of current food processing, these<br />
options usually are more sophisticated, often several ways of processing are<br />
investigated, and then the most appropriate is chosen [2]. As a method for<br />
<strong>de</strong>contaminating, the food irradiation with ultraviolet light (UV) can play an<br />
important role; there are large interests for this method. U.S. Food and Drug<br />
Administration (USFDA) and U.S. Department of Agriculture conclu<strong>de</strong>d that<br />
UV irradiation is safe [3, 4].<br />
a Babeş-Bolyai University, Faculty of Chemistry and Chemical Engineering, 11. Arany Janos,<br />
RO-400028 Cluj-Napoca, Romania, sagachi@staff.ubbcluj.ro<br />
b Sapientia University Cluj-Napoca, Faculty of Sciences Miercurea Ciuc, 1. Piata Libertatii,<br />
RO-530104 Miercurea Ciuc, Romania, gombossandor@sapientia.siculorum.ro
250<br />
GOMBOS SÁNDOR, PAUL ŞERBAN AGACHI<br />
In 2000, the FDA approved the use of UV light treatment as an<br />
alternative to thermal pasteurization of fresh fruit juices. In addition, the<br />
USFDA issued 21CFR179.41 Co<strong>de</strong> [5], which approved the use of UV light<br />
in the production, processing and handling of foods. Health Canada has<br />
conducted an assessment of UV treatment of apple juice and ci<strong>de</strong>r, and<br />
conclu<strong>de</strong>d that there is no reason for concern [6]. In Europe, UV irradiation<br />
is already used to disinfect water and air in the food industry. In addition, in<br />
2004, the National Advisory Committee for Microbiological Criteria of Food<br />
(NACMCF) of USDA has reviewed the concept of “pasteurization” of foods.<br />
This term now inclu<strong>de</strong>s any process of treatment, or a combination thereof,<br />
which is applied to foods, to reduce contamination levels [7, 8]. Many scientific<br />
publications are available on the UV treatment; we can see that there is a<br />
need for new methods of food treatment. However, in the literature insufficient<br />
data are available to integrate basic knowledge, for example, there is insufficient<br />
data about the interaction of UV light with foods, there are available performance<br />
evaluation systems of UV technologies, there are few recommendations for UV<br />
photoreactor practical <strong>de</strong>sign, there are few gui<strong>de</strong>lines for selecting commercial<br />
UV sources, <strong>de</strong>scriptions and application prospects for successful food handling<br />
are poor. Meesuk and Vorasith [10] showed that activated betonies can absorb<br />
efficiently the sunflower oil peroxi<strong>de</strong>s, starting from this premise it follows<br />
logically that can be adsorbed on the surface of betonies simultaneously<br />
micotoxins and peroxi<strong>de</strong>s, the free radicals formed by the photochemical<br />
<strong>de</strong>composition of peroxi<strong>de</strong>s can react much easier with mycotoxins.<br />
Process mechanism<br />
The case of photochemical <strong>de</strong>gradation of mycotoxins in presence of<br />
bentonite (B) is based on the following assumptions: mycotoxins (MT) are<br />
<strong>full</strong>y dissolved in the liquid phase (in the sunflower oil), the reaction mass is<br />
irradiated after being sufficiently mixed to form the adsorption equilibrium<br />
with bentonite on the active surface (Langmuir adsorption isotherm), where<br />
mycotoxin with bentonite forms an adsorption complex (MTB); there are no<br />
motive forces of the mycotoxins in the excited state which are dissolved or<br />
adsorbed on bentonite, photochemical reactions are not occurring if bentonite<br />
is not ad<strong>de</strong>d to the sunflower oil. In fact, as it will be <strong>de</strong>monstrated later,<br />
photochemical reactions take place even without the presence of bentonite.<br />
Adsorption process can be <strong>de</strong>scribed as follows:<br />
MT + B → MTB <strong>de</strong>scribed by r = k1[ΜT][B] (1)<br />
The <strong>de</strong>sorption process can be <strong>de</strong>scribed as follows:<br />
MTB → MT + B <strong>de</strong>scribed by r = k-1[MTB] (2)<br />
There is also an ineffective absorption of light, in a first step it<br />
occurs with absorption of light quanta:
THE EFFECT OF BENTONITE ON AFB1, AFB2, AFG2 AND T-2 MYCOTOXINS DECOMPOSITION …<br />
MT + hν → MT* <strong>de</strong>scribed by Iabs MT (3)<br />
After this, relaxation can occur through the phenomenon of excited<br />
state fluorescence of MT:<br />
MT* → MT + Δ <strong>de</strong>scribed by r = kD[D*] (4)<br />
Formed complex may also to absorb a quantum of light:<br />
MTB+ hν → MTB* <strong>de</strong>scribed by Iabs MTB (5)<br />
After this, can occur the phenomenon of relaxation excited state<br />
fluorescence of MTB:<br />
MTB* → MTB + Δ <strong>de</strong>scribed by r = kD[MTB*] (6)<br />
The effectiveness photochemical processes are:<br />
Photochemical excitation of bentonite:<br />
B + hν → B* <strong>de</strong>scribed by Iabs B* (7)<br />
After this, may occur the relaxation of excited state of bentonite:<br />
B* → B + Δ <strong>de</strong>scribed by r = kB[B*] (8)<br />
Photochemical reaction of MT with bentonite located in the excited<br />
state:<br />
B* + MT → Products <strong>de</strong>scribed by r = kR[B*][MT] (9)<br />
It may also take place an excitement of the adsorption complex:<br />
MTB + hν → MTB* <strong>de</strong>scribed by Iabs MTB (10)<br />
Relaxation of excited complex adsorption state with <strong>de</strong>composition:<br />
MTB* → Products <strong>de</strong>scribed by r = kR[ΜΤB*] (11)<br />
Real system is more complex, better accuracy should be taken into<br />
account the presence of peroxi<strong>de</strong>s and hydroperoxi<strong>de</strong>s who are inherently<br />
present in the sunflower oil [9]. For simplicity, subsequent experimental<br />
measurements were ma<strong>de</strong> from the sunflower oil with constant peroxi<strong>de</strong><br />
in<strong>de</strong>x.<br />
Mathematical mo<strong>de</strong>l<br />
We consi<strong>de</strong>r that Iabs MT , Iabs B and Iabs MTB represents the absorbed<br />
monochromatic light by the liquid phase components (moles of photons, s -1 ·dm -3 ),<br />
[MT], [B] and [MTB] are the current concentrations of the MT, B and MTB<br />
components at t reaction time (mol/dm 3 ). Speed of photo<strong>de</strong>gradation process<br />
can be <strong>de</strong>scribed by the equation:<br />
251
252<br />
GOMBOS SÁNDOR, PAUL ŞERBAN AGACHI<br />
[ ] [ ] B [ ]<br />
[ ] B [ ]<br />
d MT d Products k K c MT<br />
r=- = = I<br />
dt dt k + k K MT + k K C MT ⋅<br />
R 1 0 B<br />
abs<br />
B B 1 R 1 0<br />
Concentration of the adsorption complex which is formed:<br />
B<br />
Kc 1 0[<br />
MT]<br />
[ MTB]<br />
=<br />
1+<br />
K MT<br />
1<br />
[ ]<br />
(12)<br />
(13)<br />
where K1 = k1/k-1, c0 B = [B] + [MTB], c0 MT = [MT] + [MTB], and the reaction<br />
speed at the beginning of irradiation is <strong>de</strong>scribed by equation (ϕ0 is the<br />
reaction constant):<br />
( 0)<br />
( 0) 0 0(<br />
1 10 ) total<br />
λ S<br />
− A<br />
r = ϕ I −<br />
V<br />
(14)<br />
Monochromatic light is absorbed by the MTB complex (εTD), by the<br />
bentonite (εB) and by the present mycotoxins MT (εMT) in the reaction mass.<br />
Consi<strong>de</strong>ring that L is the optical path through the system, the total absorbance<br />
is:<br />
Atotal(0) = (εMTB[MTB]0 + εMT[MT]0 +εB[B]0)L (15)<br />
This relation expresses the total absorbed light, where I0 is inci<strong>de</strong>nt<br />
light intensity (moles of photons·s -1 ·dm -2 ). If S is the illumination area (dm 2 ),<br />
V is the active volume of the reactor (dm 3 ), then:<br />
total S<br />
Iabs ( 0)<br />
= I0<br />
V<br />
(16)<br />
Usually, we can accept the assumption that light is absorbed in the<br />
reaction mass (Atotal(0)>2) early entry into the reactor [11]. This simplification is<br />
valid for the use of bentonite, but could not be used for thin film reactor in<br />
the absence of bentonite.<br />
The equation which <strong>de</strong>scribes the initial absorption of light by bentonite is:<br />
( 0)<br />
( 0) 0<br />
( 1 10 )<br />
total<br />
T S<br />
T − A<br />
Iabs = I<br />
−<br />
(17)<br />
V ε MT ε B ε MTB<br />
ε [ B]<br />
0<br />
[ ] + [ ] + [ ]<br />
MT 0 B 0 MTB 0<br />
Theoretically, the relation between r(0) and [MT]0 is predictable [12],<br />
where r(0) = 0 if [MT]0 = 0:<br />
1 0[ ] 0<br />
( 0)<br />
1[ ] [ ]<br />
0 1 0 0<br />
[ ] 0<br />
( 0)<br />
0<br />
( 1 10 )<br />
total<br />
T<br />
kRK c MT S<br />
r = ⋅ ⋅<br />
B<br />
kB + kBK MT + kRK c MT V<br />
(18)<br />
εT<br />
B<br />
− A<br />
⋅I⋅ ⋅ −<br />
ε MT + ε B + ε MTB<br />
[ ] [ ] [ ]<br />
MT 0 B 0 MTB 0
THE EFFECT OF BENTONITE ON AFB1, AFB2, AFG2 AND T-2 MYCOTOXINS DECOMPOSITION …<br />
Simplified: ( )<br />
0 1 10 0 0<br />
total<br />
S<br />
r = ϕ I −<br />
V<br />
− A ( 0)<br />
( )<br />
(19)<br />
but r(0) = 0 if [D]0 → ∞ [13]. Function has a maximum (rmax, [D]0 opt ), which<br />
can be calculated from the following relation, where:<br />
b = kB K1 + kR K1 c0 B , c = εMT - εMTB , d = εB [B]0 + εMTB c0 MT<br />
dr ( 0)<br />
[ ] 0<br />
d MT<br />
= 0 hence [ MT ]<br />
opt B<br />
0<br />
kd<br />
=<br />
bc<br />
⎛ ⎞<br />
⎜ ⎟<br />
⎝ ⎠<br />
1/2<br />
(20)<br />
Relations are valid for monochromatic light with a specific λ, and for<br />
polychromatic light may be used an integration [14], where we can <strong>de</strong>fine<br />
the initial integration constant (Φ0) and the total initial rate of <strong>de</strong>gradation of<br />
mycotoxins (R0), resulting in the following equation:<br />
λ<br />
λ S − Atotal<br />
( 0)<br />
∑ rr0 = RR0<br />
=∑ ϕ0<br />
I0(<br />
1−10 )<br />
λ<br />
λ V<br />
(21)<br />
The used light source was with mercury vapour, emission spectral<br />
bands are characteristic of mercury. Reaction rate equation at the beginning of<br />
irradiation (rr0) and location of maximum (rr0 max , [MT]0 opt ) <strong>de</strong>pend on the<br />
wavelength and intensity of light emitted by the source. Knowing that MT<br />
had significant absorbance at the characteristic wavelength of the UV<br />
source, it became possible to carry out practically <strong>de</strong>contamination. The<br />
integral reaction speed RR0 in response to polychromatic light source was<br />
λ λ<br />
obtained by summing rr0 (RR0 = ∑ rr0 ). Function maximum (RR0 max ) at a<br />
concentration of dissolved MT, for known dissolved MT concentration can<br />
be predicted the [MT]0 opt if all experimental constants are known (s, V, I0 λ ),<br />
physical constants (εMT, εB, εMTB) and chemical constants (K1, kd,r). Kinetic<br />
mo<strong>de</strong>l reveals that the rate of <strong>de</strong>gradation of mycotoxins <strong>de</strong>pends very<br />
much on the active surface affinity of bentonite. The ratio between the<br />
bentonite and mycotoxins must be adjusted according to need of process,<br />
but basically it cannot be used high doses of bentonite, there appear major<br />
difficulties of pumping. The scientific literature contains very few data on the<br />
optical properties of mycotoxins, suspensions of bentonite and bentonitesunflower<br />
oil organogels. In limited area of concentrations of investigated<br />
mycotoxins can be performed the <strong>de</strong>gradation kinetics linearization, especially<br />
if it seeks to minimize changes of essential fatty acids, which logically require<br />
a relatively short irradiation times. We can write the equation:<br />
[ ]<br />
d MT<br />
− = kapMT MT<br />
dt<br />
[ ]<br />
(22)<br />
253
254<br />
GOMBOS SÁNDOR, PAUL ŞERBAN AGACHI<br />
For each mycotoxin in part, [ MT ] represent the actual concentration<br />
of mycotoxin, k is the pseudo-first or<strong>de</strong>r transformation constant, t is the<br />
apMT<br />
time of irradiation.<br />
For a PFR (tubular) reactor, the equation that <strong>de</strong>scribes the operation<br />
can be <strong>de</strong>scribed as follows [15]:<br />
[ ]<br />
d MT rMT<br />
− = − , (23)<br />
dV ν 0<br />
π 2 2<br />
d[ MT]<br />
where V = ( d − d 0 i ) l,<br />
and − r = − . (24)<br />
AMT<br />
4<br />
dt<br />
In previous relations V, ν 0 ,d0, di and l are the volume, volume flow,<br />
inner diameter, outer diameter and the length of photochemical reactor. From<br />
the last two equations we get:<br />
2 2<br />
d[ MT] π /4( d0−di) ⎛ d[ MT]<br />
⎞<br />
− = ⎜− ⎟<br />
(25)<br />
dl ν ⎜<br />
0 dt ⎟<br />
⎝ ⎠<br />
The obtained mo<strong>de</strong>l is:<br />
2 2<br />
[ ] π /4 ( d0di) aB [ ] / [ MT]<br />
dMT − ⎛ ⎞<br />
0 0<br />
− =<br />
⎜ ⎟ 2<br />
dl ν ⎜<br />
0 1 b( [ B] / [ MT ] ) c( [ B] / [ MT ] ) ⎟<br />
⎝<br />
+ +<br />
0 0 0 0 ⎠<br />
EXPERIMENTAL SECTION<br />
[ MT ]<br />
(26)<br />
In the reactor system [16], in the continuous mixing reactor which<br />
are previously cleaned, dried, was ad<strong>de</strong>d 500 grams of Top Floris extra<br />
pure sunflower oil, which is a special product of SC Expur SA, and it was<br />
checked for lack of mycotoxins in the laboratory of Sapientia University<br />
Miercurea Ciuc. After dosing the sunflower oil, was started the carbon dioxi<strong>de</strong><br />
gas adding, so that in both reactors to reach a sufficient amount remove of<br />
atmospheric oxygen, gas dosing was continued until the end of experiments.<br />
Through a hole in the top of the batch reactor was ad<strong>de</strong>d with a Hamilton<br />
microsyringe the amount of mycotoxin standard solution to achieve the<br />
initial concentration of mycotoxins. After setting the working parameters,<br />
after the start of pumping (50-1000 ml/minute), the UV source was ignited,<br />
which measured power output are 29,8 mW/cm 2 at a distance of 5 cm, and<br />
then at regular intervals were extracted samples in special vessels, which being<br />
filled, sealed and stored at -24 °C in the dark until analytical <strong>de</strong>terminations<br />
were carried out. Samples were processed as follows: using centrifuge
THE EFFECT OF BENTONITE ON AFB1, AFB2, AFG2 AND T-2 MYCOTOXINS DECOMPOSITION …<br />
Hettich Micro 20 (13000 rot./min, 5 minutes), bentonite was separated, we split<br />
(if necessary) the higher <strong>de</strong>nsity oil phase, which was pipetted into an extraction<br />
bottle, it was <strong>de</strong>termined the mass, after this was performed methanol extraction<br />
of mycotoxins in several steps, resulting mixtures were separated by centrifugation<br />
(Hettich Universal 32, 3400rot./min, 5 minutes), alcoholic liquid phases were<br />
pipetted and unified. Later, separated bentonite was extracted in several steps,<br />
for the extraction of adsorbed mycotoxin, and then unified. Since resulted alcoholic<br />
phases were sometimes cloudy, was nee<strong>de</strong>d a new set of centrifugations to<br />
perfect the separation. Alcoholic extracts thus obtained were subjected to<br />
evaporation, their mass was <strong>de</strong>termined, and portions of alcoholic extracts was<br />
injected into an apparatus Varian Pro Star HPLC type, using fluorescent and<br />
UV <strong>de</strong>tector, using Supelcosil LC 18 column, with flow rate of 0,9 ml/min, without<br />
<strong>de</strong>rivatization, because previous <strong>de</strong>rivatization tests did not provi<strong>de</strong> the expected<br />
results. For accurate <strong>de</strong>terminations using liquid chromatography (HPLC), it was<br />
necessary an a<strong>de</strong>quate preparing of the apparatus, every time was given enough<br />
time for conditioning and stabilizing all components of the HPLC equipment.<br />
HPLC equipment was controlled by Varian Star Chromatography Workstation<br />
Version 6.00 software. The used eluent was a mixture of water, methanol and<br />
acetonitrile, mixture in the ratio of 130:70:40. Fluorescence <strong>de</strong>tector was<br />
set for excitation at 365 nm, and the emission at 435 nm. Based on HPLC<br />
chromatograms provi<strong>de</strong>d by the HPLC, we can evaluate the concentration<br />
of MT in the samples, which is proportional to the area un<strong>de</strong>r the signal curve<br />
offered by that component.<br />
RESULTS AND DISCUSSION<br />
By using the bentonite as an additive to the reaction mass, after the<br />
experiments was carried out, extraction of MT from bentonite was necessary,<br />
with the unification of the extracts, followed by partly evaporation of methyl<br />
alcohol. The values of apparently <strong>de</strong>gradation constants of MT <strong>de</strong>pending on the<br />
mass ratio between bentonite (B) and MT (g B/μg MT) are indicated in figure 1.<br />
We adjusted the experimental data to the proposed mo<strong>de</strong>l, based on<br />
data from kap corresponding to bentonite additive use (B concentration<br />
expressed in g/l reported to the MT concentration expressed in µg/kg), the<br />
effects of the bentonite presence are differentiated: in case of AFB1 are<br />
obtained increase with 315% of the reaction speed, in case of AFB2 are<br />
obtained an increase with about 26%, in case of AFG2 are obtained an<br />
increase with about 44% and in case of T-2 are obtained an increase with<br />
about 65%. Parameters of individual mo<strong>de</strong>ls with 95% confi<strong>de</strong>nce level and<br />
using the sum of the squares error method (SSE) as a function of error were<br />
obtained by nonlinear regression using Polymath 5.0 software package.<br />
255
256<br />
GOMBOS SÁNDOR, PAUL ŞERBAN AGACHI<br />
Figure 1. Values of apparently <strong>de</strong>gradation constants of MT <strong>de</strong>pending on the<br />
mass ratio between bentonite (B) and MT (g B/μg MT)<br />
k apAFB1<br />
k apAFB2<br />
Figure 2. AFB1-B experimental data adjustment<br />
Figure 3. AFB2-B experimental data adjustment
THE EFFECT OF BENTONITE ON AFB1, AFB2, AFG2 AND T-2 MYCOTOXINS DECOMPOSITION …<br />
We adjusted the experimental data from the proposed mo<strong>de</strong>l; the<br />
results are shown in Figures 25, 26, 27 and 28, in or<strong>de</strong>r of AFB1, AFB2,<br />
AFG2 and T-2. The obtained values for the parameters a, b and c is presented<br />
in table 3.<br />
k apAFG2<br />
kapT − 2<br />
Figure 4. AFG2-B experimental data adjustment<br />
Figure 5. (T-2)-B experimental data adjustment<br />
Table 1. Obtained values for the parameters a, b and c for MT photo<strong>de</strong>gradation<br />
(AFB1, AFB2, AFG2, and T-2) in the presence of bentonite (B)<br />
Parameter AFB1 AFB2 AFG2 T-2<br />
a 0,0153 0,0013 0,0360 0,0092<br />
b 0,7131 0,3353 1,5101 0,7614<br />
c 0,2177 0,2563 0,5732 0,3502<br />
257
258<br />
GOMBOS SÁNDOR, PAUL ŞERBAN AGACHI<br />
CONCLUSIONS<br />
The proposed mo<strong>de</strong>l for prediction of AFB1 photo<strong>de</strong>gradation in the<br />
k at around 1,3 for the<br />
presence of bentonite has a maximum for apAFB1<br />
[ ] / [ 1]<br />
B AFB ratio, which is in good agreement with experimental data<br />
0 0<br />
obtained for AFB1, which resulted for apAFB1<br />
k a 1,0 value of the ratio. The<br />
proposed mo<strong>de</strong>l for prediction of AFB2 photo<strong>de</strong>gradation in the presence of<br />
bentonite has a maximum for kapAFB2<br />
at around 1,2 for the [ B] / [ AFB 2]<br />
0 0<br />
ratio, which is in good agreement with experimental data obtained for<br />
AFB2, which resulted for k a 1,0 value of the ratio. The proposed<br />
apAFB 2<br />
mo<strong>de</strong>l for prediction of AFG2 photo<strong>de</strong>gradation in the presence of bentonite<br />
has a maximum for k at around 0,8 for the apAFG 2<br />
[ B] / [ AFG 2]<br />
ratio, which<br />
0 0<br />
is in very good agreement with experimental data obtained for AFG2, which<br />
resulted for k a 0,8 value of the ratio. The proposed mo<strong>de</strong>l for<br />
apAFG 2<br />
prediction of T-2 photo<strong>de</strong>gradation in the presence of bentonite has a<br />
maximum for k at around 1,0 for the apT − 2<br />
[ B] / [ T − 2]<br />
ratio, which is in<br />
0 0<br />
good agreement with experimental data obtained for T-2, which resulted for<br />
k a 0,8 value of the ratio. The constructed mo<strong>de</strong>ls may be used to<br />
apT −2 estimate the B/MT concentrations ratio requirements for the photochemical<br />
<strong>de</strong>gradation of mycotoxins in each hand. On the other hand, it becomes<br />
obvious need to be operated the sunflower oil refining such as<br />
<strong>de</strong>contamination of mycotoxins needs amounts of present bentonite ratios<br />
to be within certain limits, <strong>de</strong>pending on the nature of mycotoxins. The<br />
value of B/MT ratio nee<strong>de</strong>d for <strong>de</strong>contamination at the same time requires<br />
restrictions on the choosing of circulation pumps.<br />
ACKNOWLEDGMENTS<br />
The authors are in<strong>de</strong>bted to the referee for some critical suggestions lea<strong>de</strong>d<br />
us to correct our main result. This work was partially supported by the Sapientia<br />
University Cluj-Napoca, Faculty of Sciences Miercurea Ciuc.<br />
REFERENCES<br />
1. N.W. Turner, S. Subrahmanyam, S.A. Piletsky, Anal. Chim. Acta, 2009, 632-2,<br />
168.<br />
2. L.J. Forney, J.A. Pierson, C.F. Goodridge, Ann. Rep. for Food-PAC, Atlanta, GA.<br />
2002.
THE EFFECT OF BENTONITE ON AFB1, AFB2, AFG2 AND T-2 MYCOTOXINS DECOMPOSITION …<br />
3. U.S. FDA, "Irradiation in the production, processing and handling of food. Co<strong>de</strong><br />
of Fe<strong>de</strong>ral Regulations". U.S. Food and Drug Administration, Washington, DC.<br />
2000, 21, 179.<br />
4. U.S. FDA, "Hazard analysis and critical control point (HACCP): Final rule". U.S.<br />
Food and Drug Administration, Fe<strong>de</strong>ral Register 66 (13). Washington, DC. 2001.<br />
5. U.S. FDA, "Co<strong>de</strong> of Fe<strong>de</strong>ral Regulations 21CFR179.41". Food and drugs, 2005,<br />
21, 179, Subpart B.<br />
6. Health Canada, "Ultraviolet light treatment of apple juice/ci<strong>de</strong>r using the<br />
Ci<strong>de</strong>rSure 3500". Novel Food Information, 2004.<br />
7. U.S. FDA, "Kinetics of microbial inactivation for alternative food processing<br />
technologies". J. Food Sci. Suppl., Institute of Food Technologists<br />
(http://vm.cfsan.fda.gov/~comm/ift-pref.html), 2000.<br />
8. U.S. FDA, "Kinetics of microbial inactivation for alternative food processing<br />
technologies", 2000.<br />
9. S. Gombos, A. Szép, 15 th International Conference of Chemistry. Tîrgu Mures,<br />
2009, 21-22.<br />
10. L. Meesuk, N. Vorasith, Journal of Environmental Science and Health, 2006,<br />
Part A, 41, 1189.<br />
11. Z. Ye, "UV disinfection between concentric cylin<strong>de</strong>rs", PhD Thesis, Georgia<br />
Institute of Technology, 2007.<br />
12. J.R. Bolton, K. G. Lin<strong>de</strong>n, J. Environ. Eng., 2003, 129, 209.<br />
13. J.R. Bolton, Water Res., 2000, 34, 3315.<br />
14. T. Koutchma, B. Parisi, S. Unluturk, Chem. Eng. Commun., 2006, 193, 1.<br />
15. G.F. Froment, K.B. Bischoff, Chemical Reactor Analysis and Design, John<br />
Wiley & Sons, New York. 1990, chapter 3.<br />
16. S. Gombos, “AFB1, AFB2, AFG2 and T-2 Mycotoxins <strong>de</strong>gradation in sunflower<br />
oil un<strong>de</strong>r the action of UV radiation”, PhD Thesis, Universitatea Babeş-Bolyai of<br />
Cluj-Napoca, Faculty of Chemistry and Chemical Engineering, 2010.<br />
259
STUDIA UBB CHEMIA, LVI, 1, 2011<br />
IMMOBILIZED POLYPHENOLOXIDASE FOR WASTEWATERS<br />
TRATEMENT<br />
CORNELIA MAJDIK a , GABRIEL KATONA a , MIRCEA CHINTOANU b ,<br />
MARIUS ROMAN b , EMIL LUCA c , SIMONA MARIANA SIMON d ,<br />
TIBERIU RUSU d , CECILIA ROMAN b∗<br />
ABSTRACT. A simple and efficient method for immobilization of cru<strong>de</strong> polyphenol<br />
oxidase from potato by entrapment in calcium alginate was <strong>de</strong>veloped. The<br />
obtained enzyme preparate was tested for bioremediation of wastewaters<br />
in batch and packed bed reactor.<br />
Keywords: immobilized polyhenoloxidase, phenol removal, bioremediation,<br />
calcium alginate, batch reactor, packed bed reactor<br />
INTRODUCTION<br />
The use of enzymes in the bioremediation processes is a protective<br />
methodology for the environment which can reduces the damages caused by<br />
industrial polluting effluents. The presence of phenolic compdunds in drinking<br />
and irrigation water represents a significant health and environmental hazard<br />
and, therefore, the <strong>de</strong>velopment of methods for their removal and transformation<br />
have received increased attention in recent years. The most results <strong>de</strong>aling with<br />
the fundamental and applied aspects of free and immobilized polyphenoloxidases<br />
(PPO) for food industry wastewater processing was presented by Chiacchierini<br />
[1]. The enzyme was isolated from a large variety of plants and fungi [2], but<br />
the costs for obtaining pure enzyme preparation are still high. Many cheep<br />
available sources were tested. Recently, PPO was extracted from tomato<br />
fresh pulp and different tra<strong>de</strong>marks of tomato puree sold in supermarkets by<br />
using sodium phosphate buffer at different pHs. The best pH values was 7.5 [3].<br />
Polyphenol oxidase from mango (Mangifera indica) peel and green<br />
tea (Camellia sinensis) leaves were immobilized on various supports, e.g.,<br />
polyacrylami<strong>de</strong> gel, DEAE-Sepha<strong>de</strong>x, DEAE-cellulose, collagen, arylamine glass,<br />
a<br />
“Babeş-Bolyai” University, Faculty of Chemistry and Chemical Engineering, Arany Janos 11,<br />
RO-400028, Cluj-Napoca, Romania<br />
b<br />
INCDO-INOE Research Institute for Analytical Chemistry-ICIA Donath-67, 400293 Cluj-Napoca,<br />
Romania * cici_roman@yahoo.com<br />
c<br />
University of Agricultural Sciences and Veterinary Medicine Cluj Napoca Calea Mănăştur 3<br />
400327Cluj-Napoca Romania<br />
d<br />
Technical University of Cluj-Napoca, Bulevardul Muncii 103-105, Ro-400641, Cluj-Napoca,<br />
Romania
C. MAJDIK, G. KATONA, M. CHINTOANU, M. ROMAN, E. LUCA, S. M. SIMON, T. RUSU, C. ROMAN<br />
and alkylamine glass and some important properties (optimum temperature,<br />
pH, Km, substrate specificity, thermal stability, storage stability and reusability)<br />
were studied and compared with those of native enzyme [4].<br />
Gusarova and co. studied [5] the immobilization pf PPO from higher<br />
basidiomycetes (Coriolus sp.) on polyvinylalcohol fibers and the use of<br />
immobilized enzyme for purification of wastewater from hydrolysis-yeast industry.<br />
The gel-entrapped tyrosinase and laccase prepared by immobilization<br />
of enzymes in gelatine [6] were capable of removing naturally occurring and<br />
xenobiotic aromatic compounds from aqueous suspensions and with different<br />
<strong>de</strong>grees of efficiency. A column packed with gel-immobilized tyrosinase was<br />
used to <strong>de</strong>monstrate that enzymes immobilized with this technique may be<br />
reused several times in the same reaction without loosing their efficiency.<br />
Moreover, this immobilization procedure enhanced the enzymes stability to<br />
thermal inactivation.<br />
In this work, with the aim to improve the phenol removal from<br />
wastewaters, the immobilization of cru<strong>de</strong> polyphenole oxidase from potato<br />
using a simple and efficient method, entrapement in calcium alginate, is<br />
presented. The immobilized enzyme was tested for phenol oxidation in batch<br />
and in packed bed reactors.<br />
RESULTS AND DISCUSSION<br />
Immobilization of cru<strong>de</strong> PPO from potato, activity and stability<br />
of enzyme<br />
Many methods are available for immobilization of enzymes and cells.<br />
Since the method greatly influence the properties of the resulting biocatalyst,<br />
the selection of the most suitable strategy <strong>de</strong>termines the process specifications<br />
for the catalyst, such as overall catalytic activity, efficiency of the enzymatic<br />
process, <strong>de</strong>activation and regeneration kinetics and cost.<br />
In or<strong>de</strong>r to immobilize PPO in alginate beads, we used the entrapement<br />
of enzyme in calcium alginate. The immobilization procedure was studied with<br />
the aim to obtain the most performant biocatalyst for phenol removal from<br />
wastewaters. The quantity of inclu<strong>de</strong>d enzyme was <strong>de</strong>termined from the<br />
protein content of enzyme solutions before and after immobilization, which<br />
was <strong>de</strong>termined by Bradford method with Comassie Blue.<br />
The enzymatic activity of each enzyme preparate was <strong>de</strong>termined<br />
as previously <strong>de</strong>scribed [7], with 4-aminoantipyrine (4-Amino-1,2-Dihydro-<br />
1,5-Dimethyl-2-Phenyl-3H-Pyrazol-3-One, AAP) in presence of potassium<br />
ferricyani<strong>de</strong>. As observed in Figure 1, the activity <strong>de</strong>pends linear on the<br />
quantity of immobilized enzyme. In conclusion, the ability of alginate to inclu<strong>de</strong><br />
the entire cru<strong>de</strong> enzyme correspon<strong>de</strong> our goal.<br />
262
IMMOBILIZED POLYPHENOLOXIDASE FOR WASTEWATERS TRATEMENT<br />
Next the stability of immobilized PPO in time was tested in comparison<br />
with those of the free enzyme. As observed in Figure 2, the most unstable<br />
is the free (soluble) enzyme. The immobilized enzyme preparates with < 0.5 g<br />
cru<strong>de</strong> PPO are stable in time and retains more than 50% from their initial<br />
activity. The most suitable seems to be the calcium alginate beads obtained<br />
from 0.4 g enzyme.<br />
Activity (IU)<br />
0,15<br />
0,1<br />
0,05<br />
0<br />
0 0,5<br />
m enzyme (g)<br />
1<br />
Figure 1. The influence of cru<strong>de</strong> enzyme quantity on the enzymatic activity<br />
Phenol removal with immobilized PPO in packed bed reactor<br />
The bioremediation process was realized with the most efficient enzyme<br />
preparate (o.4 g cru<strong>de</strong> PPO) and a solution of phenol (13 mM) in 0.2M phosfate<br />
buffer (pH 6.15). The phenolic solution was passed over the alginate beads<br />
which contain the calcium alginate beads inclu<strong>de</strong>d enzyme, until the concentration<br />
of phenol remain constant. After each step, the phenol concentartion was<br />
<strong>de</strong>termined as <strong>de</strong>scribed in section 1. As observed in Figure 3, in the first cycle<br />
the efficiency of process was approx. 25%. In the next cycles, the efficiency<br />
strongly <strong>de</strong>crease to 2-3%. In conclusion, due to the absence of stirring the<br />
diffusion of phenol through the alginate reduced the efficiency of bioremediation<br />
process.<br />
263
C. MAJDIK, G. KATONA, M. CHINTOANU, M. ROMAN, E. LUCA, S. M. SIMON, T. RUSU, C. ROMAN<br />
264<br />
Activity (IU/mg)<br />
0,15<br />
0,1<br />
0,05<br />
free PPO<br />
immob. 0,4 g PPO<br />
immob. 1 g PPO<br />
immob. 0.75 g PPO<br />
immob. 0.5 g PPO<br />
immob. 0.25 g PPO<br />
0<br />
0 1 2<br />
Time (h)<br />
3 4<br />
Figure 2. The stability of immobilized and free PPO in water<br />
Figure 3. Phenol removal with immobilized PPO in packed bed reactor
IMMOBILIZED POLYPHENOLOXIDASE FOR WASTEWATERS TRATEMENT<br />
Phenol removal with immobilized PPO in batch reactor<br />
Next the process was realized in a batch reactor, un<strong>de</strong>r continously<br />
stirring, in the same conditions (initial phenol concentration, pH of buffer,<br />
quantity of immobilized PPO). Samples were tacken every hour and phenol<br />
concentration was <strong>de</strong>termined colorimetrically. As ilustrated in Figure 4, after 5<br />
hours 25% of phenol was removed and the process stopped.<br />
C (mM)<br />
14<br />
13<br />
12<br />
11<br />
10<br />
9<br />
8<br />
0 1 2 3<br />
Time (h)<br />
4 5 6<br />
Figure 4. Phenol removal with immobilized PPO in stirred batch reactor<br />
CONCLUSION<br />
Polyphenol oxidase from potato with low purity immobilized by<br />
entrapement in calcium alginate showed a good potential for phenol removal<br />
from synthetic wastewaters. The entrapement in calcium alginate is a simple<br />
and cheep immobilization method which occurs with high yields (>90%).<br />
The enzyme preparates were tested for phenol removal from wastewaters in<br />
packed bed and batch reactors. In both cases, the phenol removal process<br />
occurs fast in the first period, with an approx. 25% yield. To increase the<br />
yield of phenol removal with this immobilized PPO, the use of packed bed<br />
reactor casca<strong>de</strong> can be an efficient solution.<br />
265
C. MAJDIK, G. KATONA, M. CHINTOANU, M. ROMAN, E. LUCA, S. M. SIMON, T. RUSU, C. ROMAN<br />
EXPERIMENTAL PART<br />
Materials and methods<br />
Potato (Solanum tuberosum) tubers were obtained from commercial<br />
fields in Romania at 3- to 4-week intervals. All inorganic and organic reagents<br />
were products of Aldrich or Merck. The UV-VIS spectra were recor<strong>de</strong>d on a<br />
Agilent 8453 spectrophotometer at room temperature. Cru<strong>de</strong> PPO was prepared<br />
as earlier <strong>de</strong>scribed by us [7]. Phenol concentration was measured using the<br />
colorimetric method with 4-aminoantipyrine (4-Amino-1,2-Dihydro-1,5-Dimethyl-<br />
2-Phenyl-3H-Pyrazol-3-One, AAP) in presence of potassium ferricyani<strong>de</strong>.<br />
Immobilization of cru<strong>de</strong> polyphenol oxidase in calcium alginate<br />
A quantity of freshly obtained cru<strong>de</strong> PPO from potato was dissolved<br />
in <strong>de</strong>mineralized water (10 ml) and mixed with sodium alginate solution (2%) in<br />
1:1 ratio. The mixture was ad<strong>de</strong>d dropwise into calcium chlori<strong>de</strong> (0.2 M) solution<br />
with continuous shaking. As soon as the drop of enzyme-alginate solution mixed<br />
with CaCl2 solution, Na + ions of Na-alginate were replaced by the Ca +2 ions<br />
of CaCl2 solution, which finally formed Ca-alginate beads. The beads thus<br />
formed were washed 3-4 times with <strong>de</strong>ionized water and finally with 0.2 M<br />
phosphate (pH 6.15). These beads were used for further studies.<br />
ACKNOWLEDGEMENTS<br />
The financial support from the Romanian Ministry of Education and Research<br />
(PNCD II Project Nr. 31-016/2007, DEFENOL) is grate<strong>full</strong>y acknowledged.<br />
266<br />
REFERENCES<br />
1. E. Chiacchierini, D. Restuccia, G. Vinci, Food Sci. Technol. Int. l, 2004, 1, 373-382.<br />
2. Y.K. Cho, H.K. AHN, J. Food Biochem., 1999, 23, 593.<br />
3. E. Clemente, Acta Scientiarum, Technology, 2010, 32(1), 91.<br />
4. T.N. Prabha, M. Ramakrishna, M.V. Patwardhan, M.R. Rao, Indian J. of Biochem.<br />
Biophysm, 1981, 18(6), 402.<br />
5. L.A. Gusarova, V.P. Gavrilova, I.I. Shamolina, V. L. Komarov, Biotekhnologiya,<br />
1989, 5(5), 627.<br />
6. C. Crecchio, P. Ruggiero, M.D.R. Pizzigallo, Biotechnol.Bioeng., 1995, 48(6), 585.<br />
7. C. Majdik, C., G Katona, M. Chintoanu, M. Roman, E. Luca, S.M. Simon, T. Rusu,<br />
C. Roman, Studia UBB Chemia, 2011, in press.
STUDIA UBB CHEMIA, LVI, 1, 2011<br />
PHENOL REMOVAL FROM WASTEWATERS USING<br />
POLYPHENOLOXIDASE FROM POTATO<br />
CORNELIA MAJDIK a , GABRIEL KATONA a , MIRCEA CHINTOANU b ,<br />
MARIUS ROMAN b , EMIL LUCA c , SIMONA MARIANA SIMON d ,<br />
TIBERIU RUSU d , CECILIA ROMAN b∗<br />
ABSTRACT. An easy available enzyme preparation for bioremediation of<br />
phenol containing wastewaters was tested. The influence of most important<br />
parameters (pH, substrate-enzyme ratio) was studied.<br />
Keywords: Polyphenol oxidase, phenol removal, bioremediation<br />
INTRODUCTION<br />
The rapid expansion and technological improvement in industrial fields<br />
increase the amount and complexity of toxic waste effluents. At the same<br />
time, regulatory authorities have been paying more attention to problems of<br />
contamination of the environment. There is a growing recognition that<br />
enzymes can be used in many industrial remediation processes to target<br />
specific pollutants for treatment [1]. The potential advantages of enzymatic<br />
treatment as compared with conventional treatments inclu<strong>de</strong>: application to<br />
recalcitrant materials, operation at high and low contaminant concentrations<br />
over a wi<strong>de</strong> pH, temperature and salinity range and the easy control of the<br />
process among others.<br />
Among xenobiotic contaminants, aromatic compounds constitute one<br />
of the major classes of pollutants and are heavily regulated in many countries.<br />
This implies that the presence of phenols in industrial residues is an area of<br />
environmental concern, since toxic phenols enter the environment in wastewater<br />
streams, released by numerous industries, including pulp and paper mills,<br />
coal and steel works, wood preservation plants, and various chemical and<br />
petrochemical industries [2]. Moreover the presence of these compounds in<br />
drinking and irrigation water, or in cultivated land, also represents a significant<br />
a<br />
“Babeş-Bolyai” University, Faculty of Chemistry and Chemical Engineering, Arany Janos 11,<br />
400028 Cluj-Napoca, Romania<br />
b<br />
INCDO-INOE Research Institute for Analytical Chemistry-ICIA Donath-67, 400293 Cluj-Napoca,<br />
Romania * cici_roman@yahoo.com<br />
c<br />
University of Agricultural Sciences and Veterinary Medicine Cluj Napoca Calea Mănăştur 3,<br />
400327 Cluj-Napoca, Romania<br />
d<br />
Technical University of Cluj-Napoca, Bulevardul Muncii 103-105, 400641 Cluj-Napoca,<br />
Romania
C. MAJDIK, G. KATONA, M. CHINTOANU, M. ROMAN, E. LUCA, S. M. SIMON, T. RUSU, C. ROMAN<br />
health hazard and not only environmental: phenol concentrations greater than<br />
50 ppb are toxic to some forms of aquatic life and ingestion of 1 g of phenol<br />
can be fatal in humans [3].<br />
Conventional processes for removal of phenols and aromatic amines<br />
from industrial wastewaters inclu<strong>de</strong> extraction, adsorption on activated carbon,<br />
steam distillation, bacterial and chemical oxidation, electrochemical techniques,<br />
irradiation, etc. All of these methods suffer from serious drawbacks as high<br />
costs, incompleteness of purification, formation of hazardous by-products, low<br />
efficiency and applicability to a limited concentration range [4]. Due to these<br />
drawbacks alternative methods may become important in a large scale in<br />
the near future. The treatment through enzymatic catalysis seems to have the<br />
potential to substitute conventional methods [5]. Bioremediation represents<br />
an important environmental remediation strategy because naturally occurring<br />
biological processes are used.<br />
Polyphenole oxidase (PPO) from potato [6], a multi-copper-containing<br />
enzyme, belong to the classe of laccases (benzenediol: oxygen oxidoreductase,<br />
EC 1.10.3.2) which catalyze the oxidation of a wi<strong>de</strong> range of phenolic and<br />
aniline compounds. In its reaction, substrates are oxidized by one electron<br />
to generate the corresponding phenoxy radicals, which are further oxidized<br />
to a quinone. This enzyme was isolated from a large variety of plants and<br />
fungi [7]. Due to the high price, its use in industrial wastewater treatment is<br />
still limited. Recently the presence laccases (LACs) and polyphenol oxidases<br />
(PPOs) in marine cyanobacteria was revealed [8]. These strains were efficient<br />
in <strong>de</strong>colourizing of synthetic aromatic dyes.<br />
In this work the cru<strong>de</strong> polyphenole oxidase from potato was investigated<br />
as an alternative catalyst for the phenol removal from aqueous solutions.<br />
RESULTS AND DISCUSSION<br />
Isolation of PPO from potato<br />
Enzyme extracts were prepared by homogenizing diced peeled potato<br />
samples with L-ascorbic acid as antioxidant in cold 0.2 M sodium phosphate<br />
buffer (pH 6) and centrifugation. The collected solution was lyophilized for further<br />
use or storage. PPO activity of cru<strong>de</strong> enzyme preparation was measured as the<br />
initial rate of oxygen uptake at 25°C in 50 mM sodium phosphate, pH 6.0. The<br />
reaction was measured using the colorimetric method with 4-aminoantipyrine<br />
(4-Amino-1,2-Dihydro-1,5-Dimethyl-2-Phenyl-3H-Pyrazol-3-One, AAP) in presence<br />
of potassium ferricyani<strong>de</strong> [9]. The analytic range covers phenol concentrations<br />
from 0.03 to 0.12 mM.<br />
Enzyme stability<br />
The activity of cru<strong>de</strong> enzyme during the storage at -80 ºC was studied<br />
(Figure 1). After approximately 4 days, it <strong>de</strong>crease with 50 % and after 15 days<br />
only 2% from the initial activity (16.9 UI/mg) was retained. In conclusion, even<br />
268
PHENOL REMOVAL FROM WASTEWATERS USING POLYPHENOLOXIDASE FROM POTATO<br />
at low temperature, the polyphenol oxidase is an unstable biocatalyst and in<br />
or<strong>de</strong>r to improve its stability the immobilization could be a convenient method.<br />
Activity (IU/mg)<br />
18<br />
16<br />
14<br />
12<br />
10<br />
8<br />
6<br />
4<br />
2<br />
Enzyme activity loss in time<br />
y = -1,0811x + 15,323<br />
R 2 = 0,9645<br />
0<br />
0<br />
-2<br />
2 4 6 8 10 12 14 16<br />
Time (days)<br />
Figure 1. The stability of cru<strong>de</strong> polyphenol oxidase at low temperature<br />
The influence of pH on the bioremediation process<br />
Several sets of samples are prepared, varying the pH of phenol<br />
solution, using acid solutions of sodium phosphate buffer 0.2 M. From the<br />
calibration curve <strong>de</strong>termine the concentration of phenol in solution, before<br />
Adding to the enzyme preparation. Then add the same amount of enzyme,<br />
with same concentration (2 mg enzyme / ml sol.) and constant temperature<br />
(30°C) to phenolic solutions with different pH's. The solution will be put in to<br />
the shaker. The absorbance of each sample will be read, after certain intervals<br />
of time. For absorbance reading is used the same method as for <strong>de</strong>termining<br />
the concentration of phenol from water.<br />
The bioremediation experiments were realized for phenolic solutions<br />
having the same phenol concentration (13 mM) and different pH (using various<br />
phosphate buffer), with the same amount of enzyme. Best results were<br />
obtained pH 6.15, when after 5 days the removal of phenol was almost<br />
quantitative (Figure 2).<br />
At the optimum pH the rate of bio<strong>de</strong>gradation was much higher: after 1<br />
day the yield was similar with those of bioremediation in alkaline conditions<br />
after 5 days.<br />
269
C. MAJDIK, G. KATONA, M. CHINTOANU, M. ROMAN, E. LUCA, S. M. SIMON, T. RUSU, C. ROMAN<br />
270<br />
Phenol concentration (mM)<br />
15<br />
14<br />
13<br />
12<br />
11<br />
10<br />
9<br />
8<br />
7<br />
6<br />
5<br />
4<br />
3<br />
2<br />
1<br />
0<br />
0 1 2 3 4 5<br />
Time (days)<br />
pH 6.15<br />
pH 7,16<br />
pH 7,8<br />
pH 8,23<br />
Figure 2. The inffluence of pH on phenol removal with soluble cru<strong>de</strong> PPO<br />
Yield (%)<br />
100<br />
90<br />
80<br />
70<br />
60<br />
50<br />
40<br />
30<br />
20<br />
10<br />
0<br />
pH 6.15 pH 7,16 pH 7,8 pH 8,23<br />
Figure 3. The efficiency of phenol removal with soluble cru<strong>de</strong> PPO at different pH<br />
The influence of enzyme-substrate ratio<br />
Varying the amount of cru<strong>de</strong> enzyme ad<strong>de</strong>d to the solution having the<br />
optimum pH (6.15) and the same initial concentration (13 mM), using higher<br />
amounts of cru<strong>de</strong> enzyme (2 mg enzyme/ml phenolic solution), the phenol<br />
was removed quantitatively in 6 days (Figure 4).<br />
initial<br />
1 day<br />
2 days<br />
5 days
PHENOL REMOVAL FROM WASTEWATERS USING POLYPHENOLOXIDASE FROM POTATO<br />
Yield (%)<br />
100<br />
50<br />
0<br />
C (mM0<br />
12<br />
10<br />
8<br />
6<br />
4<br />
2<br />
0<br />
0 1 2 3 4 5 6<br />
Time (days)<br />
0,5 mgPPO/mLsol<br />
1 mgPPO/mLsol<br />
1,5 mgPPO/mLsol<br />
2 mgPPO/mLsol<br />
Figure 4. Influence of enzyme-subtrate ratio on phenol removal<br />
0,5 mgPPO/mLsol 1 mgPPO/mLsol 1,5 mgPPO/mLsol 2 mgPPO/mLsol<br />
Figure 5. The efficiency of phenol removal with soluble cru<strong>de</strong> PPO<br />
at different enzyme-substrate ratio<br />
initial<br />
3 days<br />
6 days<br />
As expected, at lower enzyme concentrations the <strong>de</strong>gree of<br />
bioremediation was in the field of 37-43 % after 6 days. The bioremediation<br />
process is also faster at higher enzyme concentration (Figure 5).<br />
271
C. MAJDIK, G. KATONA, M. CHINTOANU, M. ROMAN, E. LUCA, S. M. SIMON, T. RUSU, C. ROMAN<br />
EXPERIMENTAL SECTION<br />
Materials and methods<br />
Potato (Solanum tuberosum) tubers were obtained from commercial<br />
fields in Romania at 3- to 4-week intervals. All inorganic and organic reagents<br />
were products of Aldrich or Merck. The UV-VIS spectra were recor<strong>de</strong>d on a<br />
Agilent 8453 spectrophotometer at room temperature.<br />
Preparation of potato extract (cru<strong>de</strong> polyphenoloxidase)<br />
Approximately 100 g of diced peeled potato sample were homogenized<br />
with L-ascorbic acid (0.3 g) and cold sodium phosphate buffer 0.2 M, pH 6<br />
(100 ml). The mixture was centrifugated for 20 minutes at 10000 rpm. The<br />
collected supernatant (liquid phase) which contain the cru<strong>de</strong> enzyme was<br />
lyophilized and stocked at –80°C.<br />
Determination of phenol in water<br />
Phenol concentration was measured using the colorimetric method<br />
with AAP in presence of potassium ferricyani<strong>de</strong> (Scheme 1). The analytic<br />
range covers phenol concentrations from 0.03 to 0.12 mM.<br />
H 3C NH 2<br />
H<br />
N<br />
3C N<br />
O<br />
+<br />
OH<br />
K 3[Fe(CN) 6]<br />
Scheme 1<br />
Determination of Specific Activity<br />
Enzyme activity in the stock enzyme solution was measured before<br />
use. 2 mL sample prepared from 1.9 mL phenol solution 0.2 M and 0.1 mL<br />
freshly preapared enzyme solution (100 mg cru<strong>de</strong> enzyme in 25 mL phosphate<br />
buffer 0.2 M, pH 6) was mixed with 2 mL of 0.25 M sodium bicarbonate and<br />
0.9 mL of 20.8 mM AAP. After vigorous mixing 0.9 mL of 83.4 mM potassium<br />
ferricyani<strong>de</strong> was ad<strong>de</strong>d and mixed again. Samples absorbance was measured<br />
at 510 nm, 9 minutes after the ferricyani<strong>de</strong> addition and converted to<br />
concentration using the calibration curve. One international unit of activity<br />
represent the amount of enzyme which modify the absorbance with 0.001/min.<br />
272<br />
H 3C<br />
H 3C N<br />
N<br />
N<br />
O<br />
O
PHENOL REMOVAL FROM WASTEWATERS USING POLYPHENOLOXIDASE FROM POTATO<br />
General experimental bioremediation procedure<br />
Experiments were carried out in 200 mL beakers at 30º. Reaction<br />
medium was prepared by adding individually certain amounts of phenol and<br />
cru<strong>de</strong> PPO into the corresponding phosphate buffer (0.2 M). The process<br />
was performed un<strong>de</strong>r continuously stirring at 200 rpm. Samples were taken<br />
at different intervals and the phenol concentration was <strong>de</strong>termined colorimetric<br />
as <strong>de</strong>scribed in section 2 of experimental part.<br />
ACKNOWLEDGEMENTS<br />
The financial support from the Romanian Ministry of Education and Research<br />
(PNCD II Project Nr. 31-016/2007, DEFENOL) is grate<strong>full</strong>y acknowledged.<br />
REFERENCES<br />
1. J. Karam, J.A. Nicell, J. Chem. Technol. Biot., 1997, 69, 141.<br />
2. E. Abadulla, T. Tzanov, S. Costa, K.H. Robra, A. Covaco-Paulo, G.M. Gubitz,<br />
Appl. Environ. l Microb., 2000, 66, 3357; N. Durán, E. Esposito, Appl. Catal. B:<br />
Environ., 2000, 21(8), 83; A. M. Mayer, R.C. Staples, Phytochemistry, 2002, 60, 551;<br />
A.A. Dias, R.M. Bezerra, P.M. Lemos, A.N. Pereira, World J. Microb. Biot., 2003,<br />
19, 969.<br />
3. C. Crecchio, P. Ruggiero, M.D.R. Pizzigallo, Biotechnol. Bioeng., 1995, 48, 585.<br />
4. A.M. Klibanov, B.N. Alberti, Morris E.D., Felshin L.M., J. Appl. Biochem., 1980, 2, 414.<br />
5. J. Karam, J.A. Nicell, J. Chem. Technol. Biot., 1997, 69, 141.<br />
6. W.P. Thygesen, l. B. Dry, S.P. Robinson, Plant Physiol., 1995, 109, 525; J.E.<br />
Lourenco, V.A. Neves, M.A. Da Silva, J. Agric. Food Chem., 1992, 40 (12), 2369.<br />
7. Y.K. Cho, H.K. Ahn, J. Food Biochem., 1999, 23, 593.<br />
8. S. Palanisami, S.K. Saha, U. Lakshmanan, World J. Microbiol. Biotechnol., 2010,<br />
26, 63.<br />
9. I.D. Buchanan, J.A. Nicell, M. Wagner, J. Environ. Eng., 1998, 124, 794.<br />
273
STUDIA UBB CHEMIA, LVI, 1, 2011<br />
ASYMMETRIC Co(III)-COMPLEXES OF ETHYL-METHYL-DIOXIME<br />
CSABA VÁRHELYI JR. a , GYÖRGY POKOL b , VLADISZLAV IZVEKOV b ,<br />
ÁGNES GÖMÖRY c , CSABA VÁRHELYI a , LÁSZLÓ KOCSIS a<br />
ABSTRACT. There is abundant literature regarding the symmetric α-dioximes,<br />
R’–C(=NOH)–C(=NOH)–R”, (R’=R”) and their <strong>de</strong>rivatives. However, this is<br />
not the case for asymmetric α-dioximes, and the goal of this research was to<br />
increase knowledge in this domain. The thermal stability of the asymmetric<br />
α-dioximes and their Co-complexes is lower than that of the similar symmetric<br />
<strong>de</strong>rivatives. This difference has also been observed in spectroscopical analysis.<br />
In this study, the synthesis of a series of Co-complexes of the type<br />
[Co(Et-Me-DioxH)2L2] + , (L=amine) was <strong>de</strong>scribed and characterized with<br />
thermoanalytical and spectroscopical methods.<br />
Keywords: α-dioxime, heterocyclic amines, Co-complexes,<br />
thermal <strong>de</strong>composition, spectroscopic measurements<br />
INTRODUCTION<br />
Coordination compounds of α-dioximes, R 1 –C(=NOH)–C(=NOH)–R 2 ,<br />
(R 1 =R 2 , R 1 ≠ R 2 ) along with mainly transition metals, were the subject of a<br />
great number of preparative, physico-chemical and analytical studies. Various<br />
physico-chemical properties (e. g., electrochemical relations, dipole-moments,<br />
polarizability, the variation of the energy level of these molecules) constitute<br />
the basis of the mo<strong>de</strong>rn quantum-chemical examination.<br />
The nature of the R 1 and R 2 groups influences the substitution<br />
reactions, spectral properties, and thermal stability of the above mentioned<br />
metal complexes. Among these <strong>de</strong>rivatives the greatest stability have the<br />
symmetric compounds with R 1 = R 2 values.<br />
There is scant research regarding the chemical properties of the<br />
asymmetric α-dioximes (R 1 ≠ R 2 , R 1 , R 2 = H, alkyl-, aryl-, alicyclic-, heterocyclic<br />
groups). It was observed that the thermal stability of the asymmetric complexes<br />
is lower than that of the analogous symmetric ones, and their hydrolysis in<br />
solutions also takes place with higher rates [1–24].<br />
a Babeş-Bolyai University, Faculty of Chemistry, 400 028 – Cluj-Napoca Arany J. str. 11, Romania,<br />
vcaba@chem.ubbcluj.ro, varhelyi46@yahoo.com, donlaszlow@yahoo.com<br />
b Department of Inorganic and Analytical Chemistry, Budapest University of Technology and<br />
Economics, H-1111 Budapest, Szt. Gellért tér 4, pokol@mail.bme.hu, izvekov@mail.bme.hu<br />
c Hungarian Aca<strong>de</strong>my of Sciences, Chemical Research Center, H-1525 Budapest, Pf. 17,<br />
Pusztaszeri út 59–67, gomory@chemres.hu
276<br />
CS. VÁRHELYI JR., GY. POKOL, V. IZVEKOV, Á. GÖMÖRY, CS. VÁRHELYI, L. KOCSIS<br />
Some Co-dioximine complexes present antibacterial activity. The skeleton<br />
of the B12-vitamine molecule, which is used in the treatment of pernicious<br />
anemia, is also a Co(III)-dioximine group. It is noteworthy that such substances<br />
can be useful in the field of medicine.<br />
In this study a new synthesis of the ethyl-methyl-dioxime and some new<br />
Co(III)-complexes of this chelating agent were <strong>de</strong>scribed and characterized<br />
by chemical and biochemical methods.<br />
RESULTS AND DISCUSSION<br />
Four Co(III)-complexes, type [Co(DioxH)2(amine)2]X were obtained by<br />
oxidizing Co(II)-salts in water–alcohol solution, in the presence of dioximes,<br />
aromatic or heterocyclic amines with an oxidation reagent (O2, H2O2).<br />
2 CoX2 + 4 DioxH2 + 6 Amine + ½ O2 = 2 [Co(DioxH)2(Amine)2] + X – + H2O +<br />
+ 2 AmineH + X – , X – = CH3–CH2–COO – , NO3 – , ClO4 –<br />
The used dioxime was ethyl-methyl-dioxime, also prepared. In the first<br />
step was prepared the Me-Et-dione-monoxime from methyl-n-propyl-ketone<br />
acidified with HCl, with isonitroso method, bubbling gaseous ethyl-nitrite, in<br />
a cooling mixture.<br />
CH3–CO–CH2–CH2–CH3 + Et–ONO → CH3–CO–C(=NOH)–CH2–CH3 + EtOH<br />
The intermediary product, methyl-ethyl-2,3-dion-monoxime, was<br />
transformed with hydroxyl-amine in the corresponding α-dioxime.<br />
+ KOH<br />
H3C C C CH2 CH3 + H2N OH • HCl<br />
− H2O,<br />
O NOH<br />
− KCl<br />
η = 70−80%<br />
H3C C C CH2 CH3 + H2O<br />
HON<br />
NOH<br />
The behaviour of the asymmetric α-dioximes, including Et-Me-dioxime,<br />
with transition metal ions is similar to behaviour of the symmetric α-dioximes. In<br />
some cases were obtained colored, water-insoluble products: [Me-Et-(DioxH)2M(II)]<br />
(M = Ni, Pd, Pt), and in other cases specific colored solutions. For example,<br />
orange-brown with Ni(II), Pd(II), Co(III), red with Fe(II), Re(IV), etc. [25].<br />
Electronic spectra (UV–VIS)<br />
The electronic-spectra were recor<strong>de</strong>d for a few [Co(Me-Et-DioxH)2<br />
(amine)2]X type complexes. Here we found the internal absorption bands<br />
for the oxime- and pyridine-<strong>de</strong>rivative ligands. In the case of aromatic and<br />
heterocyclic amines, the observed band is shifted to higher wavelengths.<br />
The d–d very weak bands were also observed. We are planning to make more<br />
studies for the UV–VIS bands in the future.
ASYMMETRIC Co(III)-COMPLEXES OF ETHYL-METHYL-DIOXIME<br />
IR-spectral measurements<br />
We recor<strong>de</strong>d the middle- and far-IR spectra for our compounds, and<br />
the most important results are summarized in the experimental part.<br />
If we compare our IR-spectra with the spectrum of symmetric<br />
[Co(DMG)2(β-picoline)2]I compound, we can observe the following: The δO–H···O<br />
weak, large band (1733–1750 cm –1 ), which stabilizes the compound, appears<br />
in the same wave number region, in both cases, which indicates a very similar<br />
structure.<br />
The bands νC=N appear close to each other in our studied compounds<br />
(1547–1551 cm –1 ). Also we can observe a small difference between the νNOH<br />
and νN–O bands (1228–1230 cm –1 and 1104–1109 cm –1 ). In the far IR the νCo–N<br />
band is just similar in the studied compounds (512–514 cm –1 ).<br />
In the range of 400–100 cm –1 several <strong>de</strong>formation vibrations<br />
appeared, mostly for the heterocyclic amines and for the N–Co–N groups<br />
(δN–Co–N: 379–383 cm –1 ) [26].<br />
Thermoanalytical study<br />
The TG, DTG, DTA curves were recor<strong>de</strong>d for the studied complexes.<br />
The thermal <strong>de</strong>composition curves of [Co(Me-Et-DioxH)2(3,4-lutidine)2]Br are<br />
presented in Fig. 1, and the results for all studied complexes are inclu<strong>de</strong>d in<br />
Table 1.<br />
Figure 1. Thermal <strong>de</strong>composition curves of [Co(Me-Et-DioxH)2(3,4-lutidine)2]Br.<br />
277
278<br />
CS. VÁRHELYI JR., GY. POKOL, V. IZVEKOV, Á. GÖMÖRY, CS. VÁRHELYI, L. KOCSIS<br />
Table 1. Thermoanalytical data of [Co(Me-Et-DioxH)2(amine)2]X-complexes<br />
[A(3,4-lut)2]Br [A(3,4-lut)2]I [A(3-Me-Py)2]Br [A(3-Me-Py)2]I<br />
t(°C) m; –Δm t(°C) m; –Δm t(°C) m; –Δm t(°C) m; –Δm<br />
166.35 99.64; 0.36 149.40 98.87; 1.13 102.59 98.71; 1.29 110.66 99.4; 0.6<br />
197.83<br />
85.83;<br />
14.17<br />
171.19 91.85; 8.15 113.08 91.06; 8.94 137.29 89.12; 10.8<br />
214.77<br />
76.21;<br />
23.79<br />
187.33<br />
86.87;<br />
13.13<br />
138.91<br />
84.53;<br />
15.47<br />
163.12<br />
85.91;<br />
14.09<br />
225.27<br />
68.77;<br />
31.23<br />
227.69<br />
79.12;<br />
20.88<br />
192.18<br />
82.11;<br />
17.89<br />
180.88<br />
82.78;<br />
17.22<br />
270.46<br />
58.26;<br />
41.74<br />
278.53<br />
66.10;<br />
33.90<br />
209.13<br />
76.03;<br />
23.97<br />
222.85 77.7; 22.3<br />
297.10<br />
55.56;<br />
44.44<br />
362.47<br />
61.69;<br />
38.31<br />
234.14<br />
64.22;<br />
35.78<br />
273.69<br />
62.15;<br />
37.85<br />
427.84<br />
49.48;<br />
50.52<br />
416.55<br />
41.89;<br />
58.11<br />
264.81<br />
59.17;<br />
40.83<br />
364.89<br />
58.20;<br />
41.80<br />
650.60<br />
16.14;<br />
83.84<br />
471.43<br />
20.84;<br />
79.16<br />
410.90<br />
51.05;<br />
48.95<br />
406.05<br />
39.29;<br />
60.71<br />
447.21<br />
42.09;<br />
57.91<br />
463.36<br />
12.25;<br />
87.75<br />
690.95<br />
15.55;<br />
84.45<br />
[A(3,4-lut)2]Br [A(3,4-lut)2]I [A(3-Me-Py)2]Br [A(3-Me-Py)2]I<br />
DTG DTA DTG DTA DTG DTA DTG DTA<br />
214, 197.83 171, 171.19 113, 113 163, 134.87<br />
225, (endo), 187, (endo), 192, (endo), 137, (endo),<br />
270, 224.46 228, 241.41 209, 192.98 238, 238 (exo),<br />
456, (exo), 240, (exo), 265, (endo), 406 311<br />
582 255.13 270, 256.74 410, 222 (exo),<br />
(endo),<br />
(endo), 418 (endo), 690 251.9<br />
405.25<br />
271.27<br />
310.82<br />
(endo),<br />
(exo)<br />
(exo),<br />
(endo),<br />
268.85<br />
347.14<br />
418.16<br />
(exo),<br />
(endo),<br />
(exo),<br />
339.87<br />
456.09<br />
484.3<br />
(endo),<br />
(exo),<br />
(exo)<br />
423.3<br />
519.85<br />
(exo), 657<br />
(endo),<br />
582 (exo),<br />
658.67<br />
(endo)<br />
(exo)<br />
A = Co(Me-Et-DioxH)2<br />
The mechanism of the thermal <strong>de</strong>composition of the [Co(Me-Et-DioxH)2<br />
(amine)2]X type complexes was established from the TG steps. In the first<br />
step a redox process takes place:<br />
Co 3+ + e – → Co 2+
ASYMMETRIC Co(III)-COMPLEXES OF ETHYL-METHYL-DIOXIME<br />
and the X – anion is oxidized:<br />
2 Br – – 2 e – → Br2<br />
2 I – – 2 e – → I2<br />
(For example, in the presented figure the Br – elimination takes place until 198°C)<br />
This is then followed by the amine and dioxime elimination:<br />
[Co(Me-Et-DioxH)2(amin)2] 0 → [Co(Me-Et-DioxH)2(amin)] 0 →<br />
→ [Co(Me-Et-DioxH)2] 0 → [Co(Me-Et-DioxH)] + → 1/3 Co3O4<br />
(In figure 1, the two amine elimination can be observed until 225°C, respectively<br />
297°C. The two dioxime elimination takes place between 297 – 651°C)<br />
Mass spectrometric measurements<br />
In the mass spectra abundant positive ions corresponding to<br />
[Co(Me-Et-DioxH)2(amine)2] species were observed (m/z 531 and 503 for<br />
lutidine and β-picoline containing compounds, respectively). Further fragment<br />
ions in the spectra correspond to loss of amine groups (table 2) [27].<br />
Table 2. Electrospray mass spectrometric data for [Co(Me-Et-DioxH)2(amine)2]X<br />
Nr. Compound Fragments (m/z)<br />
1.<br />
2.<br />
3.<br />
4.<br />
[Co(Me-Et-DioxH)2<br />
(3,4-lutidine)2]Br<br />
[Co(Me-Et-DioxH)2<br />
(3,4-lutidine)2]I<br />
[Co(Me-Et-DioxH)2<br />
(β-picoline)2]Br<br />
[Co(Me-Et-DioxH)2<br />
(β-picoline)2]I<br />
Biological probes<br />
227 (2%) [Co(Me-Et-furazane)2] + , 317 (30%) [Co(Me-Et-DioxH)2] + ,<br />
424.2 (35%) [Co(Me-Et-DioxH)2(3,4-lutidine)] + ,<br />
531.2 (100%) [Co(Me-Et-DioxH)2(3,4-lutidine)2] +<br />
317 (25%) [Co(Me-Et-DioxH)2] + ,<br />
424.4 (40%) [Co(Me-Et-DioxH)2(3,4-lutidine)] + ,<br />
531.2 (100%) [Co(Me-Et-DioxH)2(3,4-lutidine)2] +<br />
317.2 (28%) [Co(Me-Et-DioxH)2] + ,<br />
410.2 (29%) [Co(Me-Et-DioxH)2(β-picoline)] + ,<br />
503.2 (100%) [Co(Me-Et-DioxH)2(β-picoline)2] +<br />
317.0 (17%) [Co(Me-Et-DioxH)2] + ,<br />
410.2 (19%) [Co(Me-Et-DioxH)2(β-picoline)] + ,<br />
503.4 (100%) [Co(Me-Et-DioxH)2(β-picoline)2] +<br />
The antimicrobial effects of our complexes were studied for Gramnegative<br />
and Gram-positive germs. The Gram staining [28, 29] is an empirical<br />
solution for dividing the germs in two parts (Gram-negative and Gram-positive),<br />
in accordance with their physical and chemical properties of the cell-wall.<br />
Our results are inclu<strong>de</strong>d in table 3. When the studied compound<br />
blocked the growing of germs, is marked with “+” [30–38].<br />
279
280<br />
CS. VÁRHELYI JR., GY. POKOL, V. IZVEKOV, Á. GÖMÖRY, CS. VÁRHELYI, L. KOCSIS<br />
Table 3. Antimicrobial studies<br />
Nr. Compound<br />
Escherichia coli<br />
(Gram-negative)<br />
B. Subtilis<br />
(Gram-positive)<br />
1. [Co(Me-Et-DioxH)2(3,4-lutidine)2]Br – +<br />
2. [Co(Me-Et-DioxH)2(3,4-lutidine)2]I – +<br />
3. [Co(Me-Et-DioxH)2(β-picoline)2]Br – +<br />
4. [Co(Me-Et-DioxH)2(β-picoline)2]I – –<br />
CONCLUSIONS<br />
The literature data and our XRD single crystal measurements for<br />
similar compounds [39] shows that the [Co III (DioxH)2L2]X type <strong>de</strong>rivatives<br />
have octahedral structure. The equatorial plain of the octahedron is occupied<br />
by two dioxime ligands, and two O–H···O hydrogen-bridge stabilize the molecule.<br />
The two peak-points are occupied by two neutral or negative charged atomic<br />
groups, as shown in the figure 2.<br />
L<br />
H3C<br />
H3C C C CH2CH3 H<br />
O N<br />
Co<br />
N O<br />
H<br />
O N N O<br />
CH2 C C CH3<br />
L<br />
Figure 2. General structure of [Co(Et-Me-DioxH)2L2] type complexes.<br />
In our biological studies were used Gram positive and Gram negative<br />
germs. The results prove that the prepared complexes inhibit the growth of<br />
B. Subtilis germ.<br />
EXPERIMENTAL SECTION<br />
The electronic-spectra were recor<strong>de</strong>d in ethyl-alcohol solution of 10 –5 mol/l<br />
concentration with Jasco V-670 Spectrophotometer.<br />
The IR spectra of the complexes were obtained in KBr and polyethylene<br />
pellets in the mid-IR (4000–450 cm –1 ) and far-IR (650–150 cm –1 ) range,<br />
respectively, on a Perkin–Elmer System 2000 FTIR spectrometer, operating<br />
with a resolution of 4 cm –1 .
ASYMMETRIC Co(III)-COMPLEXES OF ETHYL-METHYL-DIOXIME<br />
Thermal measurements were performed with a 951 TG and 910 DSC<br />
calorimeter (DuPont Instruments), in air atmosphere, at a heating rate of 10<br />
K·min –1 (sample mass 4–10 mg).<br />
Mass spectrometric (MS) measurements were carried out by a PE Sciex<br />
API 2000 triple quadruple mass spectrometer, using electrospray ionization<br />
(ESI) in the 200–1200 m/z region. By ESI-MS, ionization takes place at<br />
mil<strong>de</strong>r conditions as compared with classical mass spectrometry, therefore<br />
it is more sensible for the <strong>de</strong>tection of single and associated dimmer molecule<br />
ions and their fragment ions.<br />
Synthesis of ethyl-methyl-dioxime<br />
Me-Et-dione-monoxime was prepared with isonitroso method: in 0.5 mol<br />
methyl-n-propyl-ketone acidified with 2.5 ml HCl was bubbled gaseous ethylnitrite,<br />
in a cooling mixture (ice + NaCl + H2O), (–5 ÷ 5°C) for 80–90 minutes.<br />
The intermediary product, methyl-ethyl-2,3-dion-monoxime, was transformed<br />
with hydroxyl-amine (0.6 mol NH2OH•HCl by neutralization with 0.6 mol NaOH<br />
at 60–70°C, solved in EtOH) in the corresponding α-dioxime.<br />
The white Me-Et-dioxime crystallized after standing.<br />
The cru<strong>de</strong> product was re-crystallized from ethyl alcohol. Yield: 70–80%.<br />
The preparation of Co(III)-complexes<br />
If are oxidize Co(II)-salts (CoX2, where X = acetate, NO3, ClO4) in<br />
water–alcohol solution, in the presence of ethyl-methyl-dioxime, aromatic or<br />
heterocyclic amines (mol-rate: 1:2:3) with an oxidation reagent (O2, H2O2), it<br />
results in binary complex salts.<br />
Table 4. Preparation data for [Co(DioxH)2(amine)2]X type <strong>de</strong>rivatives<br />
Starting materials (g; mol)<br />
Nr.<br />
Co(Ac)2<br />
Me-Et-<br />
DioxH2<br />
Amine KX<br />
1. 10.65; 0.05 13.2; 0.1<br />
3,4-lutidine<br />
16; 0.15<br />
KBr<br />
10; 0.08<br />
2. 10.65; 0.05 13.2; 0.1<br />
3,4-lutidine<br />
16; 0.15<br />
KI<br />
10; 0.06<br />
3. 10.65; 0.05 13.2; 0.1<br />
β-picoline<br />
14; 0.15<br />
KBr<br />
10; 0.08<br />
4.<br />
β-picoline 14;<br />
10.65; 0.05 13.2; 0.1<br />
0.15<br />
KI<br />
10; 0.06<br />
Product<br />
[Co(Me-Et-DioxH)2<br />
(3,4-lutidine)2]Br<br />
[Co(Me-Et-DioxH)2<br />
(3,4-lutidine)2]I<br />
[Co(Me-Et-DioxH)2<br />
(β-picoline)2]Br<br />
[Co(Me-Et-DioxH)2<br />
(β-picoline)2]I<br />
Yield<br />
(g; %)<br />
19; 62<br />
20.7;63<br />
18.3; 68<br />
22.3;<br />
70.8<br />
It was bubbled 2–3 hours air through the solution of 0.05 mol<br />
Co(acetate)2·2 H2O, 0.10 mol Me-Et-DioxH2 in 200 ml 50 % EtOH, then<br />
ad<strong>de</strong>d 0.15 mol β-picoline or 3,4-lutidine dissolved in 15–20 ml EtOH. The<br />
oxidation was continued for 1 more hour. The resulted dark brown solution<br />
was filtered, and ad<strong>de</strong>d to 100–100 ml filtered solution of 10–10 g KBr or KI,<br />
281
282<br />
CS. VÁRHELYI JR., GY. POKOL, V. IZVEKOV, Á. GÖMÖRY, CS. VÁRHELYI, L. KOCSIS<br />
dissolved in a small quantity of water. The dried crystallized brown product<br />
was filtered, washed with diluted alcoholic solution, and dried it on air. Details<br />
of the preparations, yields are given in Table 4.<br />
Analysis<br />
The studied complexes were characterized by N, X, H-microanalysis<br />
and their Co content was <strong>de</strong>termined volumetrically with 0.01 m EDTA,<br />
using murexi<strong>de</strong> indicator, after <strong>de</strong>struction of the samples (H2SO4 + KNO3).<br />
The microscopic aspect, chemical analysis and IR-spectral measurement<br />
results for the studied compounds are given in tables 5, 6.<br />
Nr. Compound<br />
1.<br />
2.<br />
3.<br />
4.<br />
[Co(Me-Et-DioxH)2<br />
(3,4-lutidine)2]Br<br />
[Co(Me-Et-DioxH)2<br />
(3,4-lutidine)2]I<br />
[Co(Me-Et-DioxH)2<br />
(β-picoline)2]Br<br />
[Co(Me-Et-DioxH)2<br />
(β-picoline)2]I<br />
Table 5. Chemical analysis and microscopic aspect for<br />
[Co(DioxH)2(amine)2]X type <strong>de</strong>rivatives<br />
Molweigh<br />
Chem. analysis<br />
Calc. Found<br />
Color<br />
Co: 9.6 9.4<br />
611.08<br />
N: 13.7<br />
Br: 49.3<br />
13.5<br />
48.7<br />
light<br />
brown<br />
H: 5.9 6.1<br />
Co: 8.9 9.1<br />
657.95<br />
N: 12.8<br />
I: 43.9<br />
13.1<br />
44.2<br />
light<br />
brown<br />
H: 5.4 5.0<br />
Co: 10.1 9.8<br />
538.38<br />
N: 14.4<br />
Br: 45.4<br />
14.7<br />
44.9<br />
reddish<br />
brown<br />
H: 5.4 5.7<br />
Co: 9.3 9.7<br />
630.38<br />
N: 13.3<br />
I: 42.0<br />
12.9<br />
43.2<br />
light<br />
brown<br />
H: 5.0 4.7<br />
(β-picoline = 3-methyl-pyridine; 3,4-lutidine = 3,4-dimethyl-pyridine)<br />
Vibration<br />
(cm –1 )<br />
[Co(Me-Et-DioxH)2<br />
(3,4-lutidine)2]Br<br />
Table 6. FTIR-spectroscopic dates<br />
[Co(Me-Et-DioxH)2<br />
(3,4-lutidine)2]I<br />
[Co(Me-Et-DioxH)2<br />
(β-picoline)2]Br<br />
Microscopic<br />
aspect<br />
Rectangular,<br />
long, plates<br />
Irregular crops<br />
Long,<br />
triangular<br />
based prisms<br />
Irregular,<br />
small plates<br />
[Co(Me-Et-DioxH)2<br />
(β-picoline)2]I<br />
νO–H 3436 s 3437 s 3409 vs 3435 m<br />
νC–H<br />
3014 w<br />
2983 s<br />
2932 s<br />
2871 m<br />
3015 w<br />
2982 m<br />
2936 m<br />
3115 m<br />
2975 m<br />
2932 m<br />
2872 m<br />
3116 m<br />
3018 m<br />
2973; 2935 2832 m<br />
δO–H···O 1750 w 1740 w 1740 w 1733 w<br />
νC–C 1616 s 1616 s 1611 m 1607 m<br />
νC=N 1547 vs 1547 vs 1551 vs 1547 vs<br />
δCH3 1454 vs 1453 vs 1453 vs 1457 vs<br />
δCH2 1384 m 1384 m 1384 m 1383 m
Vibration<br />
(cm –1 )<br />
ASYMMETRIC Co(III)-COMPLEXES OF ETHYL-METHYL-DIOXIME<br />
[Co(Me-Et-DioxH)2<br />
(3,4-lutidine)2]Br<br />
[Co(Me-Et-DioxH)2<br />
(3,4-lutidine)2]I<br />
[Co(Me-Et-DioxH)2<br />
(β-picoline)2]Br<br />
[Co(Me-Et-DioxH)2<br />
(β-picoline)2]I<br />
νNOH 1280 vs 1229 vs 1229 vs 1228 vs<br />
νN–O 1104 vs 1109 s 1108 vs 1109 vs<br />
γCH2 722 s 721 s 701 vs 701 vs<br />
νCo–N 512 vs 513 vs 514 vs 514 vs<br />
δN–Co–N 379 m 380 m 383 m 383 m<br />
s = strong; vs = very strong; m = medium; w = weak<br />
Electronic spectra (UV–VIS)<br />
The electronic-spectra were recor<strong>de</strong>d for a few [Co(Me-Et-DioxH)2<br />
(amine)2]X type complexes, and the observed absorption bands are summarized<br />
in table 7.<br />
Table 7. Electronic spectra date<br />
Compound Absorption band (nm) Observation<br />
[Co(Me-Et-DioxH)2(3,4-lutidine)2]Br<br />
[Co(Me-Et-DioxH)2(β-picoline)2]Br<br />
201.5 vs<br />
246.5 m<br />
204.0 vs<br />
246.5 m<br />
Internal absorption bands<br />
for the oxime- and pyridine<strong>de</strong>rivative<br />
ligands<br />
vs = very strong; m = medium<br />
Biological probes<br />
The antimicrobial effects of our complexes were studied for Gramnegative<br />
and Gram-positive germs. The observation was ma<strong>de</strong> with the disk<br />
method. Filtering paper disks were impregnate with a concentrate probe<br />
solution, sterilized (with UV-radiation or in autoclave), then putted it on the<br />
germ substrate. After 24 hour incubation were observed whether the studied<br />
compound blocked the growth of the germ substrate. The case, when there was<br />
no growth of germ substrate around the disks, was called inhibition zone.<br />
ACKNOWLEDGEMENT<br />
The authors wish to express their thankfulness to the “Domus Hungarica<br />
Foundation” of Hungary for the several fellowships provi<strong>de</strong>d to Csaba Várhelyi jr.<br />
REFERENCES<br />
1. F.J. Welcher, “Organic Analytical Reagents”, Ed. D. van Nostrand Comp., New York,<br />
London, Toronto, 1955, vol. III, p. 157.<br />
2. V. M. Peskova, V. M. Savostina, E. K. Ivanova, “Oximi”, Izd. Nauka, Moskva, 1977.<br />
3. Houben-Weil, “Metho<strong>de</strong>n <strong>de</strong>r organischen Chemie”, G. Thieme Verl. Stuttgard,<br />
1968, Bd. VII/1, p. 455, 475, Bd. X/4, p. 7–320.<br />
4. V.M. Bočkova, V.M. Peškova, Zhur. neorg. Khim., 1958, 3, 1131.<br />
283
284<br />
CS. VÁRHELYI JR., GY. POKOL, V. IZVEKOV, Á. GÖMÖRY, CS. VÁRHELYI, L. KOCSIS<br />
5. S. Kinishita, J. Masuda, Polyhedreon, 1985, 4, 1245.<br />
6. R. Hirota, Y. Yoshida, Y. Iida, H. Suezawa, T. Kogane, Polyhedron, 1993, 12, 1817.<br />
7. L.M. Hansen, P.N. Kumar, D.S. Marynick, Inorg. Chem., 1994, 33, 728.<br />
8. C. Lopez, S. Alvarez, X. Solam, M. Font-Altabat, Inorg. Chem., 1986, 25, 2962.<br />
9. D. Mandal, B.D. Gupta, Eur. J. Inorg. Chem., 2006, 4086.<br />
10. S. Reemers, U. Englert, Inorg. Chem. Commun., 2002, 5, 829.<br />
11. D. Xu, J. Gu, L. Xu, K. Liang, Y. Xu, Polyhedron, 1998, 17(2-3), 231.<br />
12. M. J. Heeg, R. C. El<strong>de</strong>r, Inorg. Chem. 1980, 19, 932.<br />
13. J. Gradinaru, S. Malinovskii, M. Gdaniec, S. Zecchin, Polyhedron, 2006, 25, 3417.<br />
14. M. Özer, M. Kandaz, A.R. Özkaya, M. Bulut, O. Güney, Dyes and Pigments, 2008,<br />
76, 125.<br />
15. F. Karipcin, S. Ilican, Y. Caglar, M. Caglar, B. De<strong>de</strong>, Y. Şahin, J. Organomet.<br />
Chem., 2007, 692, 2473.<br />
16. Z. Xin, H. Deyan, L. Yizhi, C. Huilan, Inorg. Chim. Acta, 2006, 359, 1121.<br />
17. X. Zhang, Y. Li, Y. Mei, H. Chen, J. Organomet. Chem., 2006, 691, 659.<br />
18. B.D. Gupta, U. Tiwari, T. Barclay, W. Cor<strong>de</strong>s, J. Organomet. Chem., 2001, 629, 83.<br />
19. B.D. Gupta, R. Yamuna, V. Singh, U. Tiwari, T. Barclay, W. Cor<strong>de</strong>s, J. Organomet.<br />
Chem., 2001, 627, 80.<br />
20. B.D. Gupta, K. Qanungo, R. Yamuna, A. Pan<strong>de</strong>y, U. Tewari, V. Vijaikanth, V. Singh,<br />
T. Barclay, W. Cor<strong>de</strong>s, J. Organomet. Chem., 2000, 608, 106.<br />
21. B.D. Gupta, V. Singh, K. Qanungo, V. Vijaikanth, R. Yamuna, T. Barclay, W. Cor<strong>de</strong>s,<br />
J. Organomet. Chem., 2000, 602, 1.<br />
22. T.M. Brown, A.T. Dronsfield, J.H. Fowler, S.W. Hill, Inorg. Chim. Acta, 2000, 299, 277.<br />
23. V.Y. Kukushkin, A.J.L. Pombeiro, Coord. Chem. Rev., 1999, 181, 147.<br />
24. Y. Gök, H. Kantekin, Polyhedron, 1997, 16(14), 2413.<br />
A. Treibs, A. Kuhn, Chem. Ber., 1957, 90, 1691.<br />
25. K. Nakamoto, “Infrared and Raman spectra of inorganic and coordination<br />
compounds”, Part B, 5 th Ed. J. Wiley, New York, 1997.<br />
26. J.T. Watson, “Introduction to Mass Spectrometry”, Ed. Racon, New York, 1985.<br />
27. T.J. Beveridge, “Use of the gram stain in microbiology”, Biotech Histochem, 2001,<br />
76(3): 111. doi:10.1080/714028139. PMID 11475313.<br />
28. E.J. Stewart, R. Mad<strong>de</strong>n, G. Paul, F. Tad<strong>de</strong>i, 2005, PLoS Biol 3(2): e45.<br />
DOI:10.1371/journal.pbio.0030045. PMID 15685293.<br />
29. R. Bentley, R. Meganathan, Bacteriol. Rev., 1982, 46(3), 241.<br />
30. G. Reid, J. Howard, B.S. Gan, Trends in Microbiology, 2001, 9(9), 424.<br />
31. N.A. Negm, M.F. Zaki, Colloids and Surfaces B: Biointerfaces, 2008, 64, 179.<br />
32. A. Salyers, A. Gupta, Y. Wang, Trends Microbiol., 2004, 12(9), 412.<br />
33. L. Joshua, E.L. Tatum, Nature, 1946, 158, 558.<br />
34. K.R. Matthews, J. Roberson, B.E. Gillespie, D.A. Luther, S.P. Oliver, J. of Food<br />
Protection, 1997, 60(6), 686.<br />
35. J.R. Norris, J. Wolf, J, J. Appl. Bacteriol., 1961, 24, 42.<br />
36. S. Vilain, et. al., Appl. Environ. Microbiol, 2006, 72, 4970.<br />
37. S.S. Branda, et. al., Proc. Natl. Acad. Sci. U.S.A., 2001, 98, 11621.<br />
38. M. Szilágyi, A. Deák, Cs. Várhelyi Jr., J. Madarász, Gy. Pokol, Á. Gömöry, Cs.<br />
Várhelyi, Polyhedron, 2010, 29, 2185.
STUDIA UBB CHEMIA, LVI, 1, 2011<br />
THE EFFECT OF SALICYLIC ACID<br />
ON THE BRIGGS-RAUSCHER OSCILLATING REACTION<br />
LÉNÁRD-ISTVÁN CSEPEI a,b , CSABA BOLLA a<br />
ABSTRACT. Results concerning the effect of salicylic acid on the Briggs-<br />
Rauscher oscillating reaction in batch mo<strong>de</strong> are presented. In contrast to the<br />
other phenolic and polyphenolic compounds studied before, this compound<br />
does not stop immediately the oscillations; however it reduces the amplitu<strong>de</strong>s<br />
gradually. The time elapsed between the addition of the salicylic acid and the<br />
complete cessation of the oscillations is <strong>de</strong>nominated as attenuation time.<br />
After the inhibition time the oscillations are restarted with low amplitu<strong>de</strong>. The<br />
<strong>de</strong>pen<strong>de</strong>nce of the amplitu<strong>de</strong>s, attenuation time, inhibition time and period<br />
times on the salicylic acid is presented. Furthermore a new method for kinetic<br />
study of the unusual inhibitory effect is implemented. The reaction was followed<br />
potentiometrically, by means of an iodi<strong>de</strong> ion selective electro<strong>de</strong> coupled to a<br />
double junction saturated calomel electro<strong>de</strong>. We <strong>de</strong>rived the integrated rate<br />
equation that corresponds to the pseudo-first or<strong>de</strong>r reaction followed by a<br />
sensor with a nernstian transfer function. The hypothesis concerning the pseudofirst<br />
or<strong>de</strong>r kinetics of iodi<strong>de</strong> ion production and consumption over a relatively long<br />
time within one period of oscillation is proven. The rate constants of iodi<strong>de</strong> ion<br />
production and consumption are diminished gradually for the oscillations after<br />
the addition of salicylic acid. The fact that salicylic acid <strong>de</strong>creases the amplitu<strong>de</strong>s<br />
and the rate constants of iodi<strong>de</strong> ion formation and consumption during the<br />
attenuation period lead to the conclusion that this compound manifests a weak<br />
inhibitory effect in the attenuation period as well. However this inhibitory effect<br />
increases in time, until complete cessation of the oscillations.<br />
Keywords: Briggs-Rauscher oscillating reaction, salicylic acid, iodi<strong>de</strong> ion<br />
selective electro<strong>de</strong>, Nernst equation, kinetics<br />
INTRODUCTION<br />
The Briggs-Rauscher (BR) reaction is one of the most intensively<br />
investigated homogeneous phase oscillating reactions. It consists of oxidation<br />
and iodination of an organic substrate by hydrogen peroxi<strong>de</strong> and iodate ion,<br />
catalyzed by Mn 2+ and H + ions [1]. The organic substrate is usually malonic acid,<br />
but other enolic hydrogen atom containing organic compounds (i.e. acetone,<br />
methylmalonic acid, iodomalonic acid, phenylmalonic acid) can be used [2].<br />
a Universitatea Babeş-Bolyai, <strong>Facultatea</strong> <strong>de</strong> <strong>Chimie</strong> <strong>şi</strong> <strong>Inginerie</strong> <strong>Chimică</strong>, Str. Kogălniceanu,<br />
Nr. 1, RO-400084 Cluj-Napoca,Romania, csbolla@chem.ubbcluj.ro<br />
b current address: Fritz Haber Institute <strong>de</strong>r Max Planck Gesellschaft, Faradayweg 4-6, 14195<br />
Berlin, Deutschland, cslenard@gmail.com
286<br />
LÉNÁRD-ISTVÁN CSEPEI, CSABA BOLLA<br />
The early mechanistic studies revealed the existence of 30 pseudo-elementary<br />
steps involving various oxygen and iodine containing species (i.e.: HOO•,<br />
HO•, Mn(OH) 2+ HIO, HIO2, I•, IO•, IO2•, I − , and I2) as intermediates [3, 4]. A<br />
set of 11 steps, known as skeleton mechanism, was proposed, which <strong>de</strong>scribed<br />
qualitatively the nonlinear behavior of the system [5, 6]. The further studies<br />
led to a better mechanistic un<strong>de</strong>rstanding of the reaction [2, 7].<br />
Cervellati et al. studied the effect of different polyphenolic free radical<br />
scavengers (antioxidants) on the BR reaction [8-10]. All the studied polyphenolic<br />
compounds stopped immediately the oscillations for a certain time, <strong>de</strong>nominated<br />
as inhibition time. A linear correlation was found between the inhibition time and<br />
the concentration of the antioxidant ad<strong>de</strong>d to the mixture. Relative antioxidant<br />
activities have been <strong>de</strong>termined. The qualitative mechanistic interpretation of<br />
the inhibitory effect was given: the antioxidant consumes the HOO• from the<br />
mixture in a fast step. When the antioxidant is completely consumed, the<br />
HOO• concentration increases above a critical value and the oscillations<br />
reappear. Reactions of antioxidant with other species than HOO• were also<br />
accounted for (i.e. oxidation and iodination by various oxy-iodine species) [10].<br />
This method was claimed to be a validated analytical method for antioxidant<br />
activity <strong>de</strong>terminations [9, 10]. More recent studies revealed the complexities<br />
of the reactions steps involving polyphenolic compounds in the BR-mixture<br />
[11, 12]. The effect of polyphenol was tested also in case of the BR reaction<br />
performed un<strong>de</strong>r flow conditions [13]. The analyte pulse perturbation technique<br />
applied in a CSTR showed that in contrast to the batch experiments, the<br />
resorcinol does not stop the oscillations, but <strong>de</strong>creases the period time and<br />
amplitu<strong>de</strong>. Parabolic and reciprocal relationships were found between the<br />
concentration of resorcinol and the amplitu<strong>de</strong> and the period time, respectively.<br />
In our previous studies we reported that salicylic acid does not stop<br />
immediately the oscillations of the BR reaction operated in batch mo<strong>de</strong>, like<br />
all the other phenolic compounds did [14-16]. In this work we present a more<br />
<strong>de</strong>tailed phenomenological and kinetic study on the effect of salicylic acid<br />
on the BR reaction.<br />
RESULTS AND DISCUSSION<br />
The uninhibited Briggs-Rauscher reaction<br />
Here we present the features of the uninhibited BR-reaction un<strong>de</strong>r the<br />
conditions <strong>de</strong>scribed in the Experimental section. The reaction was followed<br />
using the iodi<strong>de</strong> ion selective electro<strong>de</strong> and the bright platinum electro<strong>de</strong><br />
simultaneously. The potential variation in time of these electro<strong>de</strong>s versus<br />
the reference electro<strong>de</strong> is presented in the Figure 1. It can be seen that the<br />
initial amplitu<strong>de</strong>s monitored by the iodi<strong>de</strong> ion selective electro<strong>de</strong> are large,<br />
approximately 250 mV. However the amplitu<strong>de</strong>s monitored by the bright<br />
platinum electro<strong>de</strong> are lower by a factor of 8, approximately 30 mV. In our<br />
previous studies we used exclusively a bright platinum electro<strong>de</strong> coupled to
THE EFFECT OF SALICYLIC ACID ON THE BRIGGS-RAUSCHER OSCILLATING REACTION<br />
a reference electro<strong>de</strong> and we monitored only the redox potential change in<br />
time [14-15]. For the same composition of the BR-mixture we observed that<br />
the initial amplitu<strong>de</strong>s were between 30 and 50 mV. The higher amplitu<strong>de</strong> of the<br />
oscillations is a clear advantage of the application of the iodi<strong>de</strong>-ion selective<br />
electro<strong>de</strong>. The second advantage and importance of the application of this<br />
electro<strong>de</strong> is related to the fact that it makes possible the kinetic study of iodi<strong>de</strong><br />
ion consumption and production [16]. This will be <strong>de</strong>scribed in more <strong>de</strong>tail in<br />
subsection entitled The potentiometric method for monitoring the BR-reaction.<br />
E /I - / (V)<br />
0.55<br />
0.50<br />
0.45<br />
0.40<br />
0.35<br />
0.30<br />
0.25<br />
0.20<br />
0.15<br />
0.80<br />
0 50 100 150 200 250<br />
t(s)<br />
Figure 1. Simultaneous recording of the potentials of the iodi<strong>de</strong> ion selective and the<br />
bright platinum electro<strong>de</strong>s versus the reference electro<strong>de</strong> immersed in the BR-mixture.<br />
The shape of the first oscillations consists of four segments. The color<br />
changes observed during a single oscillation and the initial periods lengths<br />
are the same as reported previously [14, 15, 17]. Upon magnification it is notable<br />
that the peak maximum corresponding to the Pt-electro<strong>de</strong> is <strong>de</strong>layed in time by<br />
0,6-1,0 s compared to the peak maximum on the iodi<strong>de</strong> ion selective electro<strong>de</strong>.<br />
Szabó also reported a time-<strong>de</strong>lay of 0,5-0,9 s between the peak maxima on the<br />
Pt-electro<strong>de</strong> and the iodi<strong>de</strong> ion selective electro<strong>de</strong> for the first oscillations in<br />
the BR mixture [17].<br />
The inhibition of the BR reaction with salicylic acid<br />
When salicylic acid was ad<strong>de</strong>d after the third oscillation in a relatively<br />
low concentration interval to the reacting BR mixture, the oscillations were<br />
not stopped at all (Figure 2).<br />
0.95<br />
0.90<br />
0.85<br />
E /Pt/ (V)<br />
287
288<br />
E /I -<br />
/ (V)<br />
-<br />
E /I / (V)<br />
-<br />
E /I / (V)<br />
0.50<br />
0.45<br />
0.40<br />
0.35<br />
0.30<br />
0.45<br />
0.40<br />
0.35<br />
0.30<br />
0.25<br />
LÉNÁRD-ISTVÁN CSEPEI, CSABA BOLLA<br />
a d d itio n o f s a lic y lic a c id<br />
0 50 100 150 200<br />
(a )<br />
t (s )<br />
0.50<br />
0 .5 0<br />
0 .4 5<br />
0 .4 0<br />
0 .3 5<br />
0 .3 0<br />
a d d it io n o f s a lic y lic a c id<br />
0 50 100 150 200<br />
(b )<br />
t (s )<br />
0 .2 5<br />
0 1 0 0<br />
(c )<br />
2 0 0<br />
t (s )<br />
3 0 0<br />
Figure 2. The effect of salicylic acid on the BR reaction in low concentrations,<br />
(a) - 0,28 mM, (b) - 0,31 mM, (c) - 0,34 mM.<br />
The amplitu<strong>de</strong> of the oscillation which appears right after the addition<br />
of the salicylic acid solution is not affected significantly. However the amplitu<strong>de</strong><br />
of the subsequent 5 and 6 oscillations are reduced consi<strong>de</strong>rably (Figure 2a<br />
and b, Figure 4), but then the amplitu<strong>de</strong>s are increasing up to about half of the<br />
initial amplitu<strong>de</strong>s.<br />
When the salicylic acid concentration is higher than 0,34 mM, the<br />
amplitu<strong>de</strong>s are reduced monotonically over the time (Figure 2.c, Figure 3. a-c<br />
and Figure 4). In accordance with the previous findings, the period times are<br />
not affected by the presence of salicylic acid [15]. It is also notable that after<br />
the addition of salicylic acid, the potential corresponding to the peak maxima<br />
are not changed significantly, however the minima are shifted consi<strong>de</strong>rably to<br />
more positive values. The shape of the oscillations after the addition of salicylic<br />
acid are also changed compared to the non-inhibited periods. In presence of<br />
salicylic acid, the shape of the oscillations resemble to sawtooth (when csalicylic<br />
acid≤0,31 mM) and to damped sine wave (when csalicylic acid≥0,34 mM).
THE EFFECT OF SALICYLIC ACID ON THE BRIGGS-RAUSCHER OSCILLATING REACTION<br />
E /I -<br />
/ (V)<br />
E /I -<br />
/ (V)<br />
-<br />
/ (V)<br />
E /I<br />
0.45<br />
0.40<br />
0.35<br />
0.30<br />
0.25<br />
0.20<br />
0 100 200 300 400<br />
(a )<br />
t (s )<br />
0.30<br />
0.25<br />
0.20<br />
0.15<br />
0.10<br />
0.05<br />
0 100 200<br />
(b )<br />
300<br />
t(s )<br />
400<br />
0 . 2 5<br />
0 . 2 0<br />
0 . 1 5<br />
0 . 1 0<br />
0 . 0 5<br />
0 . 0 0<br />
-0 .0 5<br />
Figure 3. The effect of salicylic acid on the BR reaction in higher concentrations<br />
0,69 mM, (b) - 0,85 mM, (c) - 1,16 mM.<br />
Amplitu<strong>de</strong> (mV)<br />
0 1 0 0 2 0 0 3 0 0 4 0 0<br />
(c )<br />
t (s )<br />
280<br />
240<br />
200<br />
160<br />
120<br />
80<br />
40<br />
0<br />
attenuation<br />
time<br />
inhibition tim e<br />
2 4 6 8 10 12 14<br />
Number of oscillations<br />
0,28 mM<br />
0,31 mM<br />
0,34 mM<br />
0,74 mM<br />
0,85 mM<br />
1,00 mM<br />
1,16 mM<br />
Figure 4. The effect of salicylic acid concentration on the amplitu<strong>de</strong>s.<br />
The salicylic acid solution was injected after the third oscillation.<br />
289
LÉNÁRD-ISTVÁN CSEPEI, CSABA BOLLA<br />
The mixture after the addition of salicylic acid was always transparent;<br />
therefore there was no indication that iodine was formed. The oscillatory time<br />
is longer than 700 seconds after addition of salicylic acid in low concentration.<br />
However the oscillatory time of the uninhibited BR-reaction is about 160 s,<br />
which is approximately 4,5 times shorter compared to the reaction inhibited by<br />
0,28 mM salicylic acid.<br />
We <strong>de</strong>nominated the time elapsed between the addition of salicylic<br />
acid and the complete cessation of the oscillations as attenuation time [16].<br />
The attenuation time <strong>de</strong>creases linearly with the concentration of salicylic<br />
acid (Figure 5). The equation of the straight line is the following:<br />
t<br />
attenuatio n<br />
= (266 ± 11) - (189 ± 12)·c<br />
salicylic acid<br />
= 0,9740, N = 8<br />
(eq. 1)<br />
At higher salicylic acid concentrations than 0,69 mM the oscillations<br />
are stopped after the attenuation time. The inhibitory time increased linearly<br />
with the salicylic acid concentration (Figure 5 and eq. 2). However at a<br />
concentration of 1,16 mM, the oscillations are not regenerated after a long<br />
inhibition time (more than 900 seconds).<br />
2<br />
t = (-70 ± 5) + (323±<br />
5)·c , R = 0,9986, N = 7 (eq. 2)<br />
inh<br />
attenuation time (s)<br />
140<br />
120<br />
100<br />
80<br />
60<br />
salicylicacid<br />
40<br />
120<br />
0.7 0.8 0.9 1.0 1.1 1.2<br />
c salicylic acid (mM)<br />
Figure 5. Plot of the attenuation time and inhibition time in function<br />
of the salicylic acid concentration.<br />
Kinetic study on the BR-reaction inhibited by salicylic acid<br />
Hypothesis<br />
We assumed that one of the intermediates, the iodi<strong>de</strong> ion presents<br />
pseudo-first or<strong>de</strong>r kinetics for a certain time interval, whithin one period of<br />
oscillation. To prove this assumption, it was necessary to monitor the iodi<strong>de</strong><br />
290<br />
,<br />
R<br />
2<br />
320<br />
280<br />
240<br />
200<br />
160<br />
inhibition time (s)
THE EFFECT OF SALICYLIC ACID ON THE BRIGGS-RAUSCHER OSCILLATING REACTION<br />
ion concentration changes during the BR-reaction by means of a iodi<strong>de</strong> ion<br />
selective electro<strong>de</strong> [16]. We present a method to obtain the rate constant of<br />
the iodi<strong>de</strong> ion formation and consumption, respectively, directly from the<br />
variation in time of the potential difference between the iodi<strong>de</strong> ion selective<br />
electro<strong>de</strong> and the reference electro<strong>de</strong>.<br />
Instrumental methods (including spectroscopy and conductometry)<br />
for obtaining kinetic data are <strong>de</strong>scribed in the literature. The transfer function of<br />
these instruments is linear. Upon changing the concentration variable with<br />
the instrument response variable (noted with P), the kinetic equation of a<br />
first or<strong>de</strong>r reaction becomes the following [18, 19]:<br />
P∞<br />
− Pt<br />
ln = −kobs<br />
⋅t<br />
P − P<br />
∞<br />
0<br />
( eq.<br />
3)<br />
The above method has extensively been used for kinetic study of<br />
simple reactions. However only a few quantitative reports appeared about the<br />
employment of instrumental methods for kinetic study of complex reaction<br />
networks such as oscillating reactions. Some of these studies are briefly<br />
reviewed below.<br />
The BR reaction has been followed by means of EPR [20], resonance<br />
Raman [21] and UV-Vis spectroscopy [2, 22]. Most of these studies lead to<br />
qualitative information concerning the intermediates [20-22]. An extensive<br />
quantitative kinetic study was presented by Furrow, who monitored the reaction<br />
spectrophotometrically and <strong>de</strong>termined the rate of iodine production and<br />
consumption. He found that the iodine is consumed mainly in the iodination<br />
of the enol form of the organic substrate [2].<br />
A less conventional coupling of instrumental analytical methods was<br />
employed by Fujieda and Ogata [23]. They monitored the reaction<br />
potentiometrically, calorimetrically and gasometrically in the same time. Semiquantitative<br />
correlations were reported between the iodi<strong>de</strong> ion concentration<br />
change, the total heat production, the heat production rate and the volume<br />
of the oxygen gas formation rate during the reaction.<br />
Noszticzius et al. employed an experimental setup for the quantitation<br />
of the evolved CO and CO2 end-products. N2 carrier gas was bubbled through<br />
the reacting mixture, removing the CO and CO2. Hydrogen was ad<strong>de</strong>d to the gas<br />
mixture and the CO+CO2 content was converted to methane over nickel catalyst.<br />
The formed methane was analyzed by a flame ionization <strong>de</strong>tector. It was found<br />
that both the CO and CO2 are products with oscillatory behavior [24, 25].<br />
The potentiometric method for monitoring the BR-reaction<br />
Potentiometry is an easier and more convenient method for the<br />
monitoring of the Briggs-Rauscher reaction compared to the spectrophotometric<br />
method. The difficulties concerning the spectrophotometric method of monitoring<br />
are the following:<br />
291
292<br />
LÉNÁRD-ISTVÁN CSEPEI, CSABA BOLLA<br />
- the BR reaction is strongly exothermic [9, 23] and in or<strong>de</strong>r to maintain<br />
the mixture un<strong>de</strong>r isothermal conditions, it needs to be well thermostated,<br />
- during the reaction oxygen gas is evolved. The appearence of<br />
oxygen bubbles influences the absorbance of the mixture. Moreover, the<br />
oxygen is a triplet diradical and there are evi<strong>de</strong>nces that it inhibits the BR<br />
reaction [2]. Therefore the mixture needs to be stirred in or<strong>de</strong>r to facilitate<br />
the removal of the oxygen gas,<br />
- the intermediates of the BR-reactions are photosensitive [2, 21].<br />
The light beam of the spectrophotometer alters the oscillations. Strong<br />
light irradiation may stop the oscillations.<br />
The potentiometric method can be applied easily un<strong>de</strong>r thermostated<br />
and stirred conditions. The method consists of recording of the potential difference<br />
between an indicator electro<strong>de</strong> and a suitable reference electro<strong>de</strong>. Frequently<br />
bright platinum electro<strong>de</strong> is employed as indicator electro<strong>de</strong>. However the<br />
platinum is a redox electro<strong>de</strong>. The measured potential is a mixed potential<br />
which <strong>de</strong>pends on all the redox couples (i.e. Mn 2+ /Mn(OH) 2+ , I2/I - , HIO2/HOI, etc.)<br />
existing in the solution. Therefore it is not possible to follow the concentration<br />
of a single species in time with a platinum electro<strong>de</strong>.<br />
On the other hand the potential of a iodi<strong>de</strong> ion selective electro<strong>de</strong><br />
<strong>de</strong>pends on the iodi<strong>de</strong> ion concentration or activity, respectively. This <strong>de</strong>pe<strong>de</strong>nce<br />
is given by the Nernst-equation (eq. 4). The main difference between the<br />
spectroscopic, conductometric methods and the potentiometric method is that<br />
the transfer function of the electrochemical sensor is not linear, but logarithmic.<br />
Hence, by employing an iodi<strong>de</strong> ion selective electro<strong>de</strong> for monitoring<br />
the BR reaction, it is possible to follow the concentration changes of the<br />
iodi<strong>de</strong> ion. The knowledge of iodi<strong>de</strong> ion concentration is of great interest,<br />
because the BR reaction is a iodi<strong>de</strong> ion controlled oscillator.<br />
0 RT<br />
01 RT<br />
ε − = ε + ln a − = ε + ln c − (eq.4)<br />
I<br />
I<br />
I<br />
zF<br />
zF<br />
ε −<br />
where: - I is the potential of the ionselective electro<strong>de</strong>,<br />
a −<br />
c −<br />
- I is the activity and I is the concentration of iodi<strong>de</strong> ion, respectively,<br />
0<br />
- ε standard potential,<br />
01<br />
-ε<br />
standard formal potential.<br />
The logarithm of the iodi<strong>de</strong> ion concentration was explicited Nernst<br />
equation for the initial conditions t=0 and t=t (equations 7-8). Then by substituting<br />
these equations in the integrated rate law of a first or<strong>de</strong>r reaction and after<br />
performing the algebraic operations, we got the equation 9 [16].
THE EFFECT OF SALICYLIC ACID ON THE BRIGGS-RAUSCHER OSCILLATING REACTION<br />
E = ε − ε<br />
−<br />
I<br />
ref<br />
(eq.5)<br />
01 RT<br />
E = ε + ln c − − ε ref ( eq.<br />
6)<br />
I zF<br />
zF<br />
01<br />
lnc<br />
− = ( E0<br />
− ε + ε ) ( eq.<br />
7)<br />
I , 0<br />
ref<br />
RT<br />
zF<br />
01<br />
lnc<br />
− = ( E ) ( eq.<br />
8)<br />
,<br />
t − ε + ε<br />
I t<br />
ref<br />
RT<br />
RT<br />
Et<br />
= E 0 ± ⋅ kobs<br />
⋅ t<br />
( eq.<br />
9)<br />
zF<br />
This latter linear equation 9 <strong>de</strong>scribes the variation in time of the<br />
electromotive force of an ion selective electro<strong>de</strong>-reference electro<strong>de</strong> couple,<br />
when the ion concentation follows a (pseudo)-first or<strong>de</strong>r kinetics. The ± sign<br />
means that the equation 9 is applicable either for the consumption or for the<br />
formation of the given ionic species. The (pseudo)-first or<strong>de</strong>r rate constant<br />
can be <strong>de</strong>termined from the slope (noted here with b) of the E−t plots:<br />
zF<br />
kobs = ⋅b<br />
(eq.10)<br />
RT<br />
It can be conclu<strong>de</strong>d that the electro<strong>de</strong> response linearizes the integrated<br />
exponential rate law corresponding to the pseudo-first or<strong>de</strong>r reactions. For<br />
the <strong>de</strong>termination of the rate constant, only a simple linear regression and a<br />
multiplication are nee<strong>de</strong>d. Because of the fact that this method for <strong>de</strong>termination<br />
of rate constant requires less mathematical operations (only a linear regression<br />
and a multiplication, respectively) than those presented in the previous section,<br />
the error propagation is also lower [18].<br />
The rate constants are accessible also when the logarithm of the iodi<strong>de</strong><br />
ion concentration calculated from the potential and is plotted against the time.<br />
According to the conventional kinetics, the linear segment on this plot also<br />
indicates that the iodi<strong>de</strong> ion is involved in pseudo-first or<strong>de</strong>r steps within one<br />
period os oscillations. However for the calculation of the iodi<strong>de</strong> ion concentration<br />
the knowledge of the standard formal potential (ε<br />
293<br />
01 ) is nee<strong>de</strong>d (eq. 9).<br />
Nevertheless this potential may change in long term measurements [26] or<br />
due to the corroding effect of the highly reactive iodi<strong>de</strong> containing intermediates<br />
[27]. In such cases frequent calibration is recommen<strong>de</strong>d [26]. Otherwise<br />
due to the potential drifting phenomenon, the calculated concentrations will be<br />
also shifted severly (by one or<strong>de</strong>r of magnitu<strong>de</strong> per 59 mV of potential drift).<br />
The drifting phenomenon can also be observed in the present study:<br />
during the measurement series the potential interval of the first three noninhibited<br />
oscillations were shifted gradually from 0,27 − 0,55 V to -0,025 −<br />
0,25V (Figure 2 and 3). Nevertheless, the amplitu<strong>de</strong>s of the first three noninhibited<br />
oscillations are satisfactorily reproducible within the measurement
294<br />
LÉNÁRD-ISTVÁN CSEPEI, CSABA BOLLA<br />
series (Figure 4). This suggests that the sensitivity of the electro<strong>de</strong> did not<br />
change; only the standard formal potential of the iodi<strong>de</strong> ion selective electro<strong>de</strong><br />
and/or the potential of the reference electro<strong>de</strong> (εref) were drifting.<br />
However if the rate constant is <strong>de</strong>termined directly from the E-t plots<br />
according to the equation 9, neither the knowledge of the standard formal<br />
potential of the iodi<strong>de</strong> ion selective electro<strong>de</strong>, nor the potential of the reference<br />
electro<strong>de</strong> is required. Since the sensitivity of the iodi<strong>de</strong> ion selective electro<strong>de</strong><br />
was found to be satisfactorily constant, we took the advantage of <strong>de</strong>termining<br />
the rate constants according to the equation 9.<br />
E (V)<br />
0.50<br />
0.45<br />
0.40<br />
0.35<br />
0.30<br />
0.25<br />
0.20<br />
A<br />
B<br />
0.15<br />
0 2 4 6 8 10<br />
t (s)<br />
Figure 6. The variation of the electromotive force (E) during a<br />
single uninhibited oscillation.<br />
Upon analyzing the shape of a single uninhibited oscillation, two<br />
relatively long linear segments can be observed (Figure 6). The AB segment<br />
with positive slope represents the iodi<strong>de</strong> ion formation step. At the beginning of<br />
this segment the color of the mixture was brown due to the iodine. During the AB<br />
segment the brown color fa<strong>de</strong>d out gradually, the iodine was reacting with the<br />
enolic form of the organic substrate. The length of this segment was about 4,0<br />
second, which represents 32-35% of the period time of the first oscillations. In<br />
or<strong>de</strong>r to <strong>de</strong>termine the rate constant of iodine ion formation, a straight line was<br />
fitted to the most linear portion of the AB segment. The slope of the straight line<br />
was found to be 0,0132 ± 0,0006 V/s. The calculation of apparent rate constant<br />
and its standard <strong>de</strong>viation was done according to equation 11 and 12.<br />
The potential increased rapidly between the B and C points, due to<br />
rapid reaction steps that are also producing iodi<strong>de</strong> ions.<br />
The <strong>de</strong>creasing CD segment represents the steps involving the<br />
consumption of the iodi<strong>de</strong> ion.<br />
C<br />
D
THE EFFECT OF SALICYLIC ACID ON THE BRIGGS-RAUSCHER OSCILLATING REACTION<br />
k<br />
σ<br />
obs<br />
kobs<br />
zF 0,01315<br />
-1<br />
= 0,01315⋅<br />
= = 0,51s<br />
RT 0,0257<br />
zF 0,<br />
0006<br />
−1<br />
= σ b ⋅ = = 0,<br />
02s<br />
RT 0,<br />
0257<br />
(eq. 11)<br />
( eq.<br />
12)<br />
During the whole CD segment the mixture remained colorless. The<br />
length of this segment was about 2,0 seconds, which corresponds to<br />
approximately 16-18% of the period time. Linear fitting gave a slope of<br />
-0,01638±0,0006 V/s, therefore the apparent rate constant of iodi<strong>de</strong> ion<br />
consumption was found to be kobs = 0,64±0,02 s -1 .<br />
After the CD segment the potential sud<strong>de</strong>nly <strong>de</strong>creased due to fast<br />
reaction steps. The color of the mixture changed into brown and the cycle<br />
started again.<br />
E (V)<br />
0.50<br />
0.45<br />
0.40<br />
0.35<br />
0.30<br />
0.25<br />
0.20<br />
E<br />
0.15<br />
28 32 36 40 44 48<br />
t (s)<br />
Figure 7. The segment where iodi<strong>de</strong> ion is produced and consumed,<br />
respectively, in presence of 0,85 mM salicylic acid.<br />
In the case of the inhibited reaction, the length of the straight line EF<br />
(see Figure 7) corresponding to the iodi<strong>de</strong> ion consumption is increased<br />
significantly compared to the non-inhibited reaction. However the slope is<br />
smaller, consequently the observed rate constant of iodi<strong>de</strong> ion consumption is<br />
also lower. Due to the fact that the shape of the oscillations in the attenuation<br />
period are different compared to the non-inhibited oscillations, the GH segment<br />
seems not to correspond to the AB segment of the first three non-inhibited<br />
oscillations.<br />
The apparent rate constants corresponding to the iodi<strong>de</strong> ion consumption<br />
and formation in the EF and GH portions are kobs = 0,39±0,02 s -1 and kobs =<br />
0,41±0,02 s -1 , respectively.<br />
F<br />
G<br />
H<br />
295
296<br />
LÉNÁRD-ISTVÁN CSEPEI, CSABA BOLLA<br />
The apparent rate constants of iodi<strong>de</strong> ion formation and consumption<br />
corresponding to the successive periods of oscillations were represented in the<br />
Figure 8. It can be observed that after addition of the salicylic acid, the rate<br />
constant of iodi<strong>de</strong> ion consumption is significantly reduced. Moreover, the rate<br />
constants <strong>de</strong>cay in the successive periods until the oscillations are ceased.<br />
During the inhibitory time the potential is constant, therefore the concentration<br />
of iodi<strong>de</strong> ions is also constant.<br />
The salicylic acid also <strong>de</strong>creases progressively the rate constant of<br />
iodi<strong>de</strong> ion formation in the attenuation period (Figure 8). The progressive<br />
<strong>de</strong>cay of the iodi<strong>de</strong> ion formation and consumption after salicylic acid addition<br />
suggests that this substance presents an inhibitory effect also during the<br />
attenuation period.<br />
k obs (s -1 )<br />
1.0<br />
0.8<br />
0.6<br />
0.4<br />
0.2<br />
0.0<br />
0 1 2 3 4 5 6 7 8 9 10 11 12<br />
Number of oscillations<br />
0,74 mM<br />
0,80 mM<br />
0,85 mM<br />
0,89 mM<br />
0.92 mM<br />
1,00 mM<br />
1,16 mM<br />
k obs (s -1 )<br />
0.6<br />
0.4<br />
0.2<br />
0.0<br />
0 1 2 3 4 5 6 7 8 9 10 11 12<br />
Number of oscillations<br />
0,74 mM<br />
0,80 mM<br />
0,85 mM<br />
0,89 mM<br />
0.92 mM<br />
1,00 mM<br />
1,16 mM<br />
Figure 8. The effect of salicylic acid concentration on the apparent rate constants<br />
of iodi<strong>de</strong> ion formation (top) and consumption (bottom) in the successive periods.<br />
The arrow indicated the addition of salicylic acid solution.<br />
Up to our knowledge, the salicylic acid was the first organic compond<br />
reported which presents unusual inhibitory effect on the BR reaction operated<br />
in batch mo<strong>de</strong>. The fact that this compound does not stop immediately the<br />
oscillations suggests that it is not a strong hydroperoxyl radical quencher.<br />
The antioxidant activity of salicylic acid <strong>de</strong>termined by the TEAC method<br />
was found to be 0,04±0,01. This low value was explained by the steric<br />
hindrance and the electron withdrawing effect of the carboxylic group in the<br />
orto-position with respect to the hydroxyl-group [28].<br />
However in presence of salicylic acid the oscillations are stopped<br />
after some time. A possible explanation is that some compound is formed in<br />
the reaction mixture, which is a more effective inhibitor of the BR reaction.<br />
The salicylic acid has been reported to be an effective hydroxyl radical quencher<br />
(spin trap). The hydroxyl radical is also an intermediate of the BR-reaction [2-4].
THE EFFECT OF SALICYLIC ACID ON THE BRIGGS-RAUSCHER OSCILLATING REACTION<br />
Upon hydroxylation of salicylic acid 2,3- and 2,5-dihydroxybenzoic acid isomers,<br />
catechol and hydroquinone are formed [29-31]. On the other hand, the<br />
dihydroxybenzoic acid isomers and catechol present a high antioxidant activity,<br />
i.e. they inhibit strongly the BR reaction even in micromolar concentration [9]<br />
(Table1).<br />
Table 1. Comparison of the antioxidant activity of some polyphenols. Data collected<br />
from (a) Rice-Evans et al. [28], (b) Cervellati et al., relative antioxidant activity with<br />
respect to the slopes of the calibration graph, using resorcinol as stadard [9],<br />
and (c) this work. n.a.-data not available.<br />
Compound<br />
TEAC antioxidant<br />
Activity (a)<br />
BR antioxidant<br />
Activity (b)<br />
2-hydroxy-benzoic-acid 0,04±0,01 Unusual, low (c)<br />
2,3-dihydroxy-benzoic-acid 1,46±0,01 n.a.<br />
2,5-dihydroxy-benzoic-acid 1,04±0,03 0,092±0,003<br />
o-catechol n.a. 5,30±0,40<br />
We did not find kinetic data concerning the hydroxylation of salicylic<br />
acid, but the cited literature data suggests that it is a relatively slow radical<br />
substitution reaction. The reaction time for the formation of well <strong>de</strong>tectable<br />
amount of hydroxylated products spans from 30 seconds to 15 minutes,<br />
<strong>de</strong>pending of the method of hydroxyl radical generation and the temperature.<br />
This would explain the observed attenuation period and the gradual <strong>de</strong>crease<br />
in the iodi<strong>de</strong> formation and consumption rate constants as well.<br />
It is also notable, that we also checked the effect of 4-sulfosalicylic<br />
acid on the BR-reaction. This <strong>de</strong>rivative of the salicylic acid did not stop the<br />
oscillations, nor changed the amplitu<strong>de</strong>s of the oscillations below 10 mM<br />
concentration. At a concentration of 20 mM the amplitu<strong>de</strong>s were still unaffected,<br />
only the period time was slightly increased from 11-13 to about 14-15 seconds.<br />
CONCLUSIONS<br />
We studied the effect of salicylic acid on the Briggs-Rauscher oscillating<br />
reaction. This compound does not stop immediately the oscillations, in contrast<br />
to the other mono-and polyphenolic compounds which are effective inhibitors<br />
already in the micromolar concentration interval.<br />
If the concentration of salicylic acid in the BR-mixture is lower than 0,69<br />
mM, the oscillations are not stopped at all, only the amplitu<strong>de</strong>s are reduced.<br />
However after a few periods of oscillations the amplitu<strong>de</strong>s are increasing.<br />
Ad<strong>de</strong>d in higher concentration than 0.69 mM in the BR mixture,<br />
salicylic acid <strong>de</strong>creases the amplitu<strong>de</strong>s gradually untill the oscillations are<br />
stopped. We <strong>de</strong>nominated the time elapsed between the addition of salicylic<br />
acid and the cessation of the oscillations as attenuation time. The attenuation<br />
297
298<br />
LÉNÁRD-ISTVÁN CSEPEI, CSABA BOLLA<br />
time <strong>de</strong>creases linearly, the inhibition time increases linearly over a relatively<br />
narrow concentration of salicylic acid. However the period time is not affected<br />
by the presence of salicylic acid.<br />
For the kinetic study the reaction was monitored by iodi<strong>de</strong> ion selective<br />
electro<strong>de</strong> coupled to a reference electro<strong>de</strong>. We assumed that the iodi<strong>de</strong> ion<br />
concentration follows pseudo-first or<strong>de</strong>r kinetics over a given time within one<br />
period of oscillations. We <strong>de</strong>rived the equation that corresponds to the case<br />
when a first or<strong>de</strong>r reaction is followed by a sensor with nernstian transfer<br />
function. Based on this equation we validated the assumption concerning the<br />
reaction or<strong>de</strong>r of iodi<strong>de</strong> ion formation and consumption. The rate constants<br />
were found to be <strong>de</strong>creased gradually from period to period in presence of<br />
salicylic acid, similarly to the <strong>de</strong>cay of the amplitu<strong>de</strong>s of the oscillations. This<br />
fact suggested that the studied compound manifests a weak inhibitory effect in<br />
the attenuation period as well. However the inhibitory effect enhances with the<br />
concentration and the reaction time as well, until the oscillations are stopped<br />
temporarily. These observations lead to a hypothesis that after adding the<br />
salicylic acid in the BR mixture, some compound is formed which is a better<br />
inhibitor of the oscillations. Since the hydroxyl radical is also an intermediate of<br />
the BR-reaction, it was plausible to suppose that the salicylic acid is hydroxylated<br />
to dihydroxybenzoic acid isomers. These latter compounds were reported<br />
to be efficient inhibitors of the BR-reaction. However the hypothesis is yet<br />
to be proven.<br />
EXPERIMENTAL SECTION<br />
The following stock solutions have been prepared according to the<br />
procedure <strong>de</strong>scribed earlier [14-16]. The stock solutions and the doublewalled<br />
glass reactor were thermostated to 25,0±0,1 ºC. Mixing of the stock<br />
solutions gave an oscillatory mixture with the following initial concentrations:<br />
[H2O2]0=9,20·10 -1 M, [malonic acid]0=5,00·10 -2 M, [H2SO4]0=2,50·10 -2 M,<br />
[MnSO4]0=6,50·10 -3 M, [KIO3]0= 6,75·10 -2 M. After the minimum of the third<br />
oscillation a given volume of the sodium salicilate was ad<strong>de</strong>d to the reaction<br />
mixture using a Labsystems Finnpipette micropipette. Since the pH of the<br />
BR-mixture is sufficiently low (around 1,7), the salicilate ion was protonated<br />
quantitatively to salicylic acid.<br />
The BR-reaction was monitored potentiometrically using an iodi<strong>de</strong><br />
ion selective electro<strong>de</strong> (Ra<strong>de</strong>lkis, Budapest) and a double junction saturated<br />
calomel reference electro<strong>de</strong> (Chemical Institute, Cluj-Napoca). For comparison<br />
a few experiments were performed using the iodi<strong>de</strong> ion selective electro<strong>de</strong> and<br />
a bright platinum electro<strong>de</strong> simultaneously. A double junction calomel electro<strong>de</strong><br />
was chosen as a reference electro<strong>de</strong>, because the conventional single junction<br />
electro<strong>de</strong>s contain saturated potassium-chlori<strong>de</strong> electrolyte. When a single<br />
junction reference electro<strong>de</strong> is immersed into a solution, chlori<strong>de</strong> ions diffuse
THE EFFECT OF SALICYLIC ACID ON THE BRIGGS-RAUSCHER OSCILLATING REACTION<br />
out through the fritt of the electro<strong>de</strong> in the solution. The contamination rate is<br />
approximately 0,2·10 -3 M/min [26]. Because of the fact that already traces of<br />
chlori<strong>de</strong> ions inhibit the BR-reaction; any contamination with chlori<strong>de</strong> ions must<br />
be avoi<strong>de</strong>d. For this purpose we used a double junction saturated calomel<br />
electro<strong>de</strong>, which contained 1,0 M KNO3 electrolyte in the outer compartment.<br />
The variation in time of the potential of the iodi<strong>de</strong> ion selective electro<strong>de</strong><br />
versus the reference electro<strong>de</strong> was recor<strong>de</strong>d using a computer equipped with<br />
a National Instruments® data acquisition card. The acquisition frequency has<br />
been set to 5 s -1 .<br />
ACKNOWLEDGMENTS<br />
The author acknowledges the scholarship awar<strong>de</strong>d by the PROFIL Group<br />
for the Cluj-Szeged Stu<strong>de</strong>nt Exchange Program to the University of Szeged, Hungary,<br />
Faculty of Natural Sciences. The author thanks Prof. Dr. I. C. Popescu (Dept. of Physical<br />
Chemistry, Faculty of Chemistry and Chemical Engineering, Babes-Bolyai University)<br />
for the iodi<strong>de</strong> selective electro<strong>de</strong>.<br />
REFERENCES<br />
1. T.S. Briggs, W.C. Rauscher, J. Chem. Educ. 1973, 50, 496<br />
2. S.D. Furrow, J. Phys. Chem, 1995, 99, 11131.<br />
3. S.D. Furrow, R.M. Noyes, J. Am. Chem. Soc., 1982, 104, 38.<br />
4. S.D. Furrow, R.M. Noyes, J. Am. Chem. Soc., 1982, 104, 42.<br />
5. S.D. Furrow, R.M. Noyes, J. Am. Chem. Soc., 1982, 104, 45.<br />
6. P. De Kepper, I.R. Epstein, J. Am. Chem. Soc., 1982, 104, 49.<br />
7. S.D. Furrow, R. Cervellati, G. Amadori, J. Phys. Chem. A, 2002, 106, 5841<br />
8. R. Cervellati, N. Crespi-Perrelino, S.D. Furrow, A. Minghetti, Helv. Chim. Acta,<br />
2000, 83, 3179.<br />
9. R. Cervellati, K. Höner, S.D. Furrow, C. Ned<strong>de</strong>ns, S. Costa, Helv. Chim. Acta, 2001,<br />
84, 3533.<br />
10. R. Cervellati, K. Höner, S.D. Furrow, F. Mazzanti, S. Costa, Helv. Chim. Acta, 2004,<br />
87, 1, 133.<br />
11. L. Onel, G. Bourceanu, M. Wittmann, Z. Noszticzius, G. Szabó, J. Phys. Chem. A,<br />
2008, 112, 11649.<br />
12. T. Lawson, J. Fülöp, M. Wittmann, Z. Noszticzius, N. Muntean, G. Szabó, L. Onel,<br />
J. Phys. Chem. A, 2009, 113, 14095.<br />
13. N. Muntean, I Bal<strong>de</strong>a, G. Szabó, Z. Noszticzius, Studia UBB Chemia, 2010, 55(1),<br />
121.<br />
14. L.I. Csepei, „A Briggs-Rauscher reakció oszcillációinak leállítása” („The Cessation of<br />
the Oscillations of Briggs-Rauscher Reaction”), Bachelor Diploma Thesis, supervisor:<br />
Cs. Bolla, Babes-Bolyai University, Faculty of Chemistry and Chemical Engineering,<br />
2005.<br />
299
300<br />
LÉNÁRD-ISTVÁN CSEPEI, CSABA BOLLA<br />
15. L.I. Csepei, Cs. Bolla, Studia UBB Chemia, 2009, 54(II), 249.<br />
16. L.I. Csepei, “Inhibiţia reacţiei oscilante Briggs-Rauscher cu acid salicilic” (“Inhibition<br />
of Briggs-Rauscher Oscillating Reaction with Salycilic Acid”), Master Diploma<br />
Thesis, supervisor: Cs. Bolla, Babes-Bolyai University, Faculty of Chemistry and<br />
Chemical Engineering, 2006.<br />
17. E. Szabó, “A Briggs-Rauscher reakció tanulmányozása” (“Study on the Briggs-<br />
Rauscher reaction”), Bachelor Diploma Thesis, Supervisor Cs. Bolla, Babes-<br />
Bolyai University, Faculty of Chemistry and Chemical Engineering, 2000, 53-66.<br />
18. K.A. Connors, „Chemical Kinetics, The Study of Reaction Rates in Solution”,<br />
VH Publishers, 1990, 31-36.<br />
19. I. Bâl<strong>de</strong>a, „Cinetică chimică <strong>şi</strong> mecanisme <strong>de</strong> reacţie, Baze teoretice <strong>şi</strong> aplicaţii”,<br />
Presa Universitară Clujeană, Cluj-Napoca, 2002, 26-40.<br />
20. P.V. Lalitha, P. Sambasiva Rao, R. Ramaswamy, Current Science, 1991, 61, 5, 352.<br />
21. B.Z. Chowdhry, A.P. Mendham, J. Tetteh, R. Withnall, ChemPhysChem, 2002, 5,<br />
443.<br />
22. M.J. Mahon, A.L. Smith, J. Phys. Chem. 1985, 89, 1215.<br />
23. S. Fujieda, H. Ogata, Talanta, 1996, 43, 1989.<br />
24. Sz. Nagygyörgy, M. Wittmann, Sz. Pintér, A. Visegrádi, A. Dancsó, B.T. Nguyen,<br />
Z. Noszticzius, L. Hegedűs, H.D. Försterling, J. Phys. Chem. A, 1999, 103, 4885.<br />
25. G. Szabó, A. Csavdári, L. Onel, G. Bourceanu, Z. Noszticzius, M. Wittmann,<br />
J. Phys. Chem. A, 2007, 111, 610.<br />
26. Orion Ionalyzer, Instruction Manual for Hali<strong>de</strong> Electro<strong>de</strong>s, 5 th Edition, Orion<br />
Research Inc., USA, 1973.<br />
27. Z. Noszticzius, E. Noszticzius, and Z.A. Schelly, J. Am. Chem. Soc., 1982, 104, 6194.<br />
28. C.A. Rice-Evans, N.J. Miller, G. Paganga, Free Rad. Biol. Med., 1996, 20, 7, 933.<br />
29. R.A. Floyd, J.J. Watson, P.K. Wong, J. Biochem. Biophys. Meth., 1984, 10, 221.<br />
30. B. Halliwell, H. Kaur, M. Ingelman-Sundberg, Free Rad. Biol. Med., 1991, 10, 439.<br />
31. B.K. Glod, P. Grieb, Acta Chromatographica, 2006, 15, 258.