
Create successful ePaper yourself
Turn your PDF publications into a flip-book with our unique Google optimized e-Paper software.
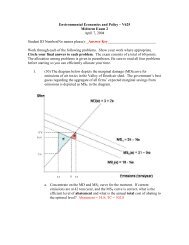
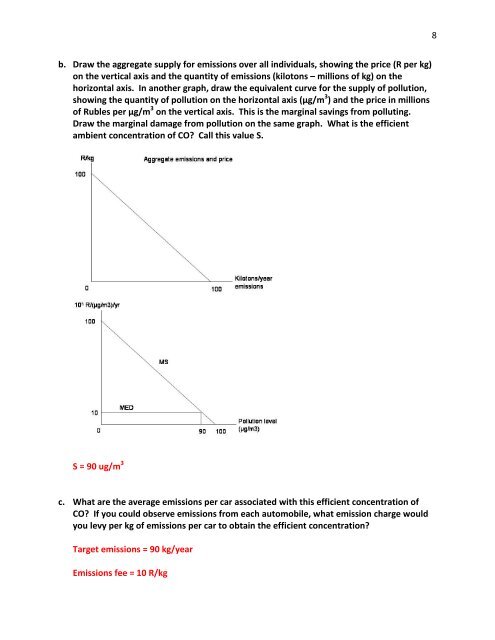
. Draw the aggregate supply for emissions over all individuals, showing the price (R per kg)<br />
on the vertical axis and the quantity of emissions (kilotons – millions of kg) on the<br />
horizontal axis. In another graph, draw the equivalent curve for the supply of pollution,<br />
showing the quantity of pollution on the horizontal axis (µg/m 3 ) and the price in millions<br />
of Rubles per µg/m 3 on the vertical axis. This is the marginal savings from polluting.<br />
Draw the marginal damage from pollution on the same graph. What is the efficient<br />
ambient concentration of CO? Call this value S.<br />
S = 90 ug/m 3<br />
c. What are the average emissions per car associated with this efficient concentration of<br />
CO? If you could observe emissions from each automobile, what emission charge would<br />
you levy per kg of emissions per car to obtain the efficient concentration?<br />
Target emissions = 90 kg/year<br />
Emissions fee = 10 R/kg<br />
8