Studying Elephants - The African Elephant Specialist Group
Studying Elephants - The African Elephant Specialist Group
Studying Elephants - The African Elephant Specialist Group

Create successful ePaper yourself
Turn your PDF publications into a flip-book with our unique Google optimized e-Paper software.
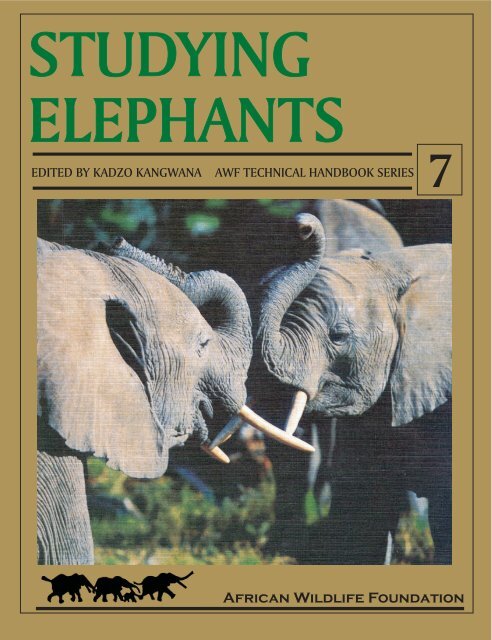
STUDYING<br />
ELEPHANTS<br />
EDITED BY KADZO KANGWANA AWF TECHNICAL HANDBOOK SERIES<br />
7<br />
<strong>African</strong> Wildlife Foundation
<strong>The</strong> origination and production of “<strong>Studying</strong> <strong><strong>Elephant</strong>s</strong>” was made possible through funding<br />
from the European Union, through the <strong>African</strong> <strong>Elephant</strong> Conservation Coordinating <strong>Group</strong>.<br />
Additional funds were provided by the <strong>African</strong> Wildlife Foundation.<br />
<strong>The</strong> opinions expressed in this publication are those of the authors alone and do not imply any opinions whatsoever<br />
on the part of the European Union. <strong>The</strong> <strong>African</strong> Wildlife Foundation is fully responsible for the contents of this<br />
book and any omissions or errors are not the responsibility of the European Union.<br />
Edited by Kadzo Kangwana<br />
<strong>African</strong> Wildlife Foundation Nairobi, Kenya<br />
© Copyright AFRICAN WILDLIFE FOUNDATION<br />
First Published 1996<br />
ISBN: 9966-9915-0-6<br />
Cover Photo by Cynthia Moss: Amboseli elephants, Loxodonta africana,<br />
Amboseli National Park, Kenya.<br />
Graphic design by Jacaranda Designs Limited P.O. Box 76691, Nairobi, Kenya.<br />
Reproduction of this publication for educational or other non-commercial purposes is authorised without prior written<br />
permission from the copyright holder provided the source is fully acknowledged. Reproduction of this publication for<br />
resale or other commercial purposes is prohibited without prior written permission of the copyright holder.<br />
Typeset in Palatino, Times and Lithos Bold. Printed in Kenya.<br />
Published by the AFRICAN WILDLIFE FOUNDATION, Nairobi, Kenya.
STUDYING ELEPHANTS<br />
Edited by<br />
KADZO KANGWANA<br />
<strong>African</strong> Wildlife Foundation<br />
Nairobi, Kenya
THE AFRICAN WILDLIFE FOUNDATION<br />
<strong>The</strong> <strong>African</strong> Wildlife Foundation (AWF), established in 1961, works towards building the capacity of <strong>African</strong><br />
individuals and institutions to manage their natural resources effectively. AWF follows this mission in order to<br />
increase the sustainable contribution of natural resources to local and national economies, and to promote the<br />
sound protection and management of these resources by Africa’s own peoples.<br />
AWF helps build capacity in natural resource management through programme activities in protected area<br />
management, environmental awareness, policy development and implementation, conservation science, support<br />
for species and habitats of prime ecological significance, and community-based approaches to conservation.<br />
AWF’s current portfolio includes four distinct and complementary programme areas, ranging from the traditional<br />
to the innovative. <strong>The</strong>se programmes are:<br />
* Species and Ecosystem Conservation<br />
* Community Conservation<br />
* Training, Institutional Development and Education<br />
* Commerce and Conservation<br />
For further information about the <strong>African</strong> Wildlife Foundation and its current projects please write to AWF at:<br />
P.O. Box 48177, Nairobi, Kenya or<br />
1717 Massachusetts Ave. NW, Washington DC 20036, USA<br />
THE AWF SERIES OF HANDBOOKS<br />
ON TECHNIQUES IN AFRICAN WILDLIFE ECOLOGY<br />
1. Counting Animals. M. Norton-Griffiths. 1978.<br />
2. Measuring the Distribution of Animals in Relation to the Environment. D.<br />
Western and J. J. R. Grimsdell. 1979.<br />
3. <strong>Studying</strong> Predators. B. C. R. Bertram. 1979.<br />
4. Ecological Monitoring. J. J. R. Grimsdell. 1978.<br />
5. Population Dynamics of Large Mammals. A. R. E. Sinclair and J. J. R.<br />
Grimsdell. 1982.<br />
6. Counting Birds. D. Pomeroy. 1992.<br />
7. <strong>Studying</strong> <strong><strong>Elephant</strong>s</strong>. Editor K. Kangwana. 1996.<br />
If you would like to order a copy of any of the handbooks, please write to:<br />
<strong>African</strong> Wildlife Foundation,<br />
P.O. Box 48177 Nairobi, Kenya<br />
Tel: (254-2)710367 Fax: 710372
CONTENTS<br />
Acknowledgement ............................................................................................................... i<br />
List of Contributor ............................................................................................................... ii<br />
Introduction ......................................................................................................................... iii<br />
Chapter 1. <strong>The</strong> <strong>African</strong> <strong>Elephant</strong><br />
Joyce Poole .......................................................................................................................... 1<br />
SECTION 1: ELEPHANT MANAGEMENT<br />
Chapter 2. Making Management Decisions from Data<br />
Holly Dublin & Russell Taylor ........................................................................................... 10<br />
SECTION 2: COUNTING ELEPHANTS<br />
Chapter 3. Counting <strong><strong>Elephant</strong>s</strong> from the Air - Sample Counts<br />
Susan Mbugua ..................................................................................................................... 21<br />
Chapter 4. Counting <strong><strong>Elephant</strong>s</strong> from the Air - Total Counts<br />
lain Douglas-Hamilton ........................................................................................................ 28<br />
Chapter 5. Estimating Forest <strong>Elephant</strong> Abundance by Dung Counts<br />
Richard Barnes .................................................................................................................... 38<br />
Chapter 6. Direct Counts of <strong><strong>Elephant</strong>s</strong> from the Ground<br />
Hugo Jachmann ................................................................................................................... 49<br />
SECTION 3: STUDYING POPULATIONS<br />
Chapter 7. Getting to know a Population<br />
Cynthia Moss....................................................................................................................... 58<br />
Chapter 8. <strong>Studying</strong> <strong>Elephant</strong> Movements<br />
hn Whyte ............................................................................................................................. 75<br />
Chapter 9. <strong>Studying</strong> <strong>Elephant</strong> – Habitat Interactions<br />
Keith Lindsay ...................................................................................................................... 90<br />
Chapter 10. <strong>Studying</strong> the Behaviour of <strong><strong>Elephant</strong>s</strong><br />
Phyllis Lee ........................................................................................................................... 98<br />
SECTION 4: DEVELOPING RESEARCH TECHNIQUES<br />
Chapter 11. <strong>Studying</strong> Vocal Communication in <strong><strong>Elephant</strong>s</strong><br />
Karen McComb ................................................................................................................... 112<br />
Chapter 12. Satellite Tracking of <strong><strong>Elephant</strong>s</strong><br />
Chris Thouless ..................................................................................................................... 120<br />
Chapter 13. <strong>Studying</strong> the Reproductive Physiology of <strong><strong>Elephant</strong>s</strong><br />
Hamisi Mutinda ................................................................................................................... 126<br />
Chapter 14. What We Can Learn from Tusks<br />
Nioroge Ngure ..................................................................................................................... 130<br />
SECTION 5: ELEPHANTS IN THEIR HUMAN CONTEXT<br />
Chapter 15. Assessing the Impact of Human-<strong>Elephant</strong> Interactions<br />
Kadzo Kangwana ................................................................................................................ 138<br />
Chapter 16. Monitoring Law Enforcement and Illegal Activities<br />
Nigel Leader-Williams ........................................................................................................ 148<br />
SECTION 6: HANDLING ELEPHANTS<br />
Chapter 17. How to Immobilise <strong><strong>Elephant</strong>s</strong><br />
Chris Thouless ..................................................................................................................... 164<br />
Chapter 18. Collecting Data from Dead <strong><strong>Elephant</strong>s</strong><br />
Ian Whyte ............................................................................................................................ 171
ACKNOWLEDGEMENTS<br />
<strong>The</strong> production of this book has been made possible by a grant from the European Union, administered by the<br />
<strong>African</strong> <strong>Elephant</strong> Conservation Coordinating <strong>Group</strong> through the Environment and Development <strong>Group</strong> (EDG),<br />
and supplementary funds from the <strong>African</strong> Wildlife Foundation (AWF) and the AWF/PARCS project.<br />
Early concepts for the book benefitted from the input of Ruth Chunge, Steve Cobb, lain Douglas-Hamilton,<br />
Holly Dublin, Deborah Snelson and Mark Stanley Price.<br />
Very special thanks are due to all authors for agreeing to contribute to the book and donating their time by<br />
accepting minimal fees for writing chapters. Several authors contributed further by reviewing chapters, and for<br />
this AWF is grateful. AWF is also grateful to Deborah Ross for donating the illustrations for Chapter 7.<br />
Special thanks are due to Deborah Snelson for proof-reading all the chapters, and to Chryssee Perry Martin and<br />
Cynthia Moss for copy editing the book.<br />
AWF is grateful to the Endangered Wildlife Trust for organising the translation of “<strong>Studying</strong> <strong><strong>Elephant</strong>s</strong>” into<br />
Portuguese, and to Ursula Taube for translating the book into French.<br />
For support throughout this project, thanks are due to AWF staff both in Washington and Nairobi, and to staff of<br />
the Environment and Development <strong>Group</strong> whose contributions have been many. Without them “<strong>Studying</strong><br />
<strong><strong>Elephant</strong>s</strong>” would not have become a reality.<br />
i
CONTRIBUTORS<br />
Richard Barnes Department of Biology 0116, University of California,<br />
San Diego, La Jolla CA 92093-0116, U.S.A.<br />
lain Douglas-Hamilton P.O. Box 54667, Nairobi, Kenya.<br />
Holly T. Dublin WWF Regional Office Eastern Africa,<br />
P.O Box 62440, Nairobi, Kenya.<br />
Nicholas Georgiadis Mpala Ranch<br />
P.O. Box 92, Nanyuki, Kenya.<br />
Hugo Jachmann Luangwa Intergrated Resource Development Project,<br />
P.O. Box 510249, Chipata, Zambia.<br />
Kadzo Kangwana <strong>African</strong> Wildlife Foundation,<br />
P.O. Box 48177, Nairobi, Kenya.<br />
Nigel Leader-Williams Planning and Assessment for Wildlife Management,<br />
Department of Wildlife, P.O. Box 63150,<br />
Dar es Salaam, Tanzania.<br />
Phyllis C. Lee University of Cambridge, Department of Biological<br />
Anthropology, Downing Street, Cambridge, U.K<br />
Keith Lindsay Environment and Development <strong>Group</strong>, 13 St. Giles, Oxford<br />
OXI 3J5, U.K.<br />
Susan Mbugua Department of Resource Surveys and Remote Sensing,<br />
P.O. Box 47146, Nairobi, Kenya.<br />
Karen McComb School of Biological Sciences, Biological Building,<br />
University of Sussex, Falmer, Brighton BNI 9QG, U.K.<br />
Cynthia Moss Amboseli <strong>Elephant</strong> Research Project, <strong>African</strong> Wildlife<br />
Foundation, P.O. 48177, Nairobi, Kenya.<br />
Hamisi Mutinda Kenya Wildlife Service, P.0.40241, Nairobi, Kenya.<br />
Nioroge Ngure <strong>African</strong> Wildlife Foundation,<br />
P.O. Box 48177, Nairobi, Kenya.<br />
Joyce H. Poole P.O. Box 24467, Nairobi, Kenya.<br />
Russell D. Taylor WWF Multispecies Project, P.O. Box 8437, Causeway,<br />
Harare, Zimbabwe.<br />
Chris Thouless II King Edward Street,<br />
Oxford OX1 4HT, U.K.<br />
Ian Whyte National Parks Board, Kruger National Park, Private Bag<br />
X402, Skukuza 1350, South Africa.<br />
ii
INTRODUCTION<br />
Concern for the survival of the <strong>African</strong> elephant(Loxodonta africana), following the decimation of elephants<br />
through the 1970s and 1980s as a result of poaching for ivory, has led to an increased focus on the conservation<br />
of the species. However, conservation and management of the <strong>African</strong> elephant can only be done in light of a<br />
good understanding of the elephants themselves - their distribution and density, their movements, behaviour,<br />
impact on their ecosystems, and how they respond to contact with humans at the human-wildlife interface.<br />
This book is a response to the need for better information on the <strong>African</strong> elephant. It aimed to collect the experience<br />
of biologists working in the field on the <strong>African</strong> elephant, and to inform protected area staff, research officers and<br />
research students of the principal techniques used in the study of <strong>African</strong> elephants. <strong>The</strong> book intends to encourage<br />
protected area and research staff to embark on studies of their own that would contribute to the information<br />
available. It is also recognised that local people are being brought into wildlife management, and encouraged to<br />
manage their own resource. It is hoped that this book will be of use to them in planning and carrying out their<br />
own wildlife inventories.<br />
Ideally, research should be linked to the management objectives of an area, and the techniques used should flow<br />
from stated management objectives. This is not to say that research cannot be done for its own sake, but given the<br />
scarcity of resources suffered by many <strong>African</strong> protected area authorities, it is important to make the links between<br />
management and research. This book is structured to help the reader make these linkages. Chapter 1 provides an<br />
introduction to the <strong>African</strong> elephant, describing the elephant, its lifestyle and general ecology. Chapter 2 in<br />
Section 1 focuses on making management decisions from data, and provides a management context within<br />
which to view the rest of the chapters in the book on research techniques. This chapter is followed by Section 2<br />
on counting elephants. Chapter 3 describes how to carry out aerial sample counts. Chapter 4 covers aerial total<br />
counts. Chapter 5 describes how to estimate the abundance of forest elephants, using dung counts and Chapter 6<br />
describes how to count elephants directly from the ground. As you will see in this section, how one counts<br />
elephants depends on a number of factors including the ecology of a region, the kind of estimate required in<br />
terms of accuracy and precision and the resources available to carry out the count.<br />
Section 3 provides a series of chapters on techniques applicable to the study of specific elephant populations.<br />
<strong>The</strong>se include getting to know an elephant population (Chapter 7), studying elephant movements (Chapter 8),<br />
studying elephant-habitat interactions (Chapter 9) and studying the behaviour of elephants (Chapter 10).<br />
Section 4 on developing research techniques describes how studies using modern and technologically advanced<br />
techniques are done. It is unlikely that all protected area staff will have the resources to carry out studies of this<br />
kind, but these chapters are included to give research officers and protected area staff a flavour of modern<br />
elephant research and to make them aware of innovations in elephant research.<br />
Section 5 on elephants in their human context provides information on how to assess the impact of humanelephant<br />
contact both on the elephants and on the humans (Chapter 15), and how to assess the efficacy of our<br />
conservation efforts to protect the species and monitor illegal activities (Chapter 16).<br />
iii
Section 6 on handling elephants provides practical instructions on how to immobilise elephants (Chapter 17) and<br />
how to collect information from dead elephants (Chapter 18).<br />
Written as this book is, by a variety of experts in elephant biology, the chapters vary in style and the depth to<br />
which they cover a topic. All have the advantage of being written by people who practice these techniques<br />
themselves, and should prove useful in guiding someone embarking on his or her own research. Where the<br />
length of the book and consequently that of chapters has not permitted authors to go into great depth on an aspect<br />
of the research, they have pointed the reader in the direction of literature sources on the topic. To meet the needs<br />
of a broad spectrum of protected area authorities with different levels of funding, and research capacities, you<br />
may find that the some of the techniques discussed are beyond your means. Some of the techniques are statistically<br />
complex, while others require a large amount of technologically advanced and expensive equipment. Do not let<br />
this discourage you from pursuing your own elephant research. Several chapters show you that research can<br />
begin with a minimum of a note book and an observant eye, and produce meaningful results.<br />
To maximise the quality, and hence usefulness, of your research start by consulting experts in the field on<br />
technical issues if you have any questions, and find statisticians who can help you with some of the statistically<br />
complex aspects of analysing data. Should you wish to get in touch with anyone working in a particular area of<br />
elephant biology, you can contact the IUCN/SSC <strong>African</strong> <strong>Elephant</strong> <strong>Specialist</strong> <strong>Group</strong>, d/o WWF Regional Office,<br />
Eastern Africa, P.O. Box 62440 Nairobi, Kenya, which will put you in touch with relevant experts.<br />
Every effort has been made to include the widest variety of research areas, both to instruct, and to inform.<br />
However, it is recognised that the topics covered have not fully exhausted the field. Perhaps the next volume will<br />
include any topic that has been left out, and the experience that you the reader gather as you embark on your<br />
elephant research.<br />
iv
1.1 INTRODUCTION<br />
Over the last thirty years literally hundreds of studies<br />
on <strong>African</strong> elephants (Loxodonta africana) have been<br />
carried out across the continent. We have learned<br />
more about elephants than, perhaps, any other large<br />
undomesticated <strong>African</strong> mammal, and yet we are just<br />
beginning to understand their complex lives.<br />
<strong><strong>Elephant</strong>s</strong> have captured man’s imagination and<br />
respect for thousands of years. In some ways we can<br />
draw close parallels between humans and elephants.<br />
Like humans, elephants have the capacity to modify<br />
their habitats dramatically (Laws et al. 1970;<br />
Cumming 1982; Kortlandt 1984; Western 1989), and<br />
their need for space often brings them into direct<br />
conflict with expanding human populations<br />
(Kangwana 1993; Ngure 1993; Kiiru 1994; Thouless<br />
in press). <strong><strong>Elephant</strong>s</strong>, like our own species, are noted<br />
for their intelligence, close family ties and social<br />
complexity (Moss 1988). In other ways, they remain<br />
mysteriously different. <strong>The</strong>ir uncanny ability to<br />
communicate with one another over long distances<br />
(Martin 1978), once referred to as ‘extra sensory<br />
perception’ (Rees 1963), is now known to be through<br />
the use of loud sounds below the level of human<br />
hearing (Poole et al. 1988). <strong>The</strong> <strong>African</strong> elephant is<br />
the largest living land mammal with males of the<br />
species weighing up to 6,000kg and standing 3.3m<br />
at the shoulder (Laws 1966; Laws & Parker 1968;<br />
Laws 1969; Hanks 1969). With a trunk weighing<br />
140kg, an elephant can pick up the tiniest crumb,<br />
push over a mature tree, reassure a baby, pour 12<br />
litres of water into its mouth or detect a smell from<br />
several kilometres away. <strong>The</strong>ir two elongated<br />
incisors composed of ivory have been coveted by<br />
humans for hundreds of thousands of years, and ivory<br />
has played a significant role in the art and culture of<br />
many peoples (Ross 1993).<br />
<strong><strong>Elephant</strong>s</strong> once populated the entire continent<br />
(Mauny 1956; Douglas-Hamilton 1979) and,<br />
CHAPTER 1<br />
THE AFRICAN ELEPHANT<br />
Joyce Poole<br />
P.O. Box 24467<br />
Nairobi, Kenya<br />
formerly, within the last three centuries, Loxodonta<br />
africana inhabited all of sub-Saharan Africa in habitats<br />
ranging from tropical and montane forests to open<br />
grasslands, semi-arid bush and desert. In recent years,<br />
however, the poaching of elephants for ivory and human<br />
population growth and expansion have reduced the<br />
species’ range and numbers drastically, and the majority<br />
of remaining elephants exist in small pockets of<br />
protected land isolated by human habitation and<br />
development, or in dense forest (United Republic of<br />
Tanzania 1989).<br />
<strong>The</strong> <strong>African</strong> elephant and its close cousin, the Asian<br />
elephant (Elephas maximus), are the only species<br />
surviving in the order Probocidea. Both genera<br />
originated in sub-Saharan Africa in the early Pleistocene<br />
(Maglio 1973); Loxondonta remained in Africa, but<br />
Elephas moved into Asia during the late Pleistocene.<br />
Two subspecies of <strong>African</strong> elephant are recognised: the<br />
savanna elephant, Loxodonta africana africana, and the<br />
forest elephant, Loxodonta africana cyclotis. <strong>The</strong><br />
savanna elephant is larger than the forest elephant, has<br />
sparser body hair, more triangular ears that are larger,<br />
and thick, curved tusks as opposed to the straighter,<br />
narrower downward pointing tusks of the forest elephant<br />
(Lausen & Beckoff 1978). <strong><strong>Elephant</strong>s</strong> intermediate<br />
between the two subspecies are found in hybridisation<br />
zones over large areas of Africa where forests and<br />
savannas merge (Western 1986).<br />
This chapter serves to give a general introduction to the<br />
<strong>African</strong> elephant. In describing the lifestyle of a species,<br />
it is often convenient to lump all members of the species<br />
together and say, for example, “elephants live in<br />
families”, “elephants prefer to aggregate”, “elephants<br />
are seasonal breeders”, or”“elephants are browsers”. But<br />
the study of <strong>African</strong> elephants reveals their social<br />
complexity and flexibility, and their ecological<br />
adaptability. Simple labels can be very misleading,<br />
1
THE AFRICAN ELEPHANT<br />
as you will see inthe rest of this chapter and in your<br />
own studies, when you undertake them.<br />
1.2 SOCIAL STRUCTURE AND<br />
BEHAVIOUR<br />
1.2.1 General<br />
<strong>African</strong> elephants live in a fluid and dynamic social<br />
system in which males and females live in separate,<br />
but overlapping spheres (Douglas≠ Hamilton 1972;<br />
Martin 1978; Moss 1977, 1981; Moss & Poole 1983;<br />
Hall-Martin 1987; Poole 1994). Related females and<br />
their immature offspring live in tightly knit<br />
matriarchal family units (Buss et al. 1976), while<br />
males live a more solitary independent existence with<br />
few social bonds (Martin 1978; Moss & Poole 1983).<br />
Neither sex is territorial, although both utilise specific<br />
home areas during particular times of the year (Moss<br />
& Poole 1983; Hall-Martin 1987).<br />
1.2.2 Female society<br />
Female elephant society consists of complex multitiered<br />
relationships extending from the motheroffspring<br />
bond to family units, bond groups and clans<br />
(Douglas-Hamilton 1972; Moss 1977,1981; Moss &<br />
Poole 1983; Martin 1978). <strong>The</strong> basic social unit is<br />
the family which is composed of one to several related<br />
females and their immature offspring, and may range<br />
in size from two to 30 individuals. <strong><strong>Elephant</strong>s</strong> appear<br />
to benefit from being part of a large family. Related<br />
females will form defensive units against perceived<br />
danger and will form coalitions against other nonrelated<br />
females or males (Moss 1988; pers. obs.).<br />
Larger families with older matriarchs are able to<br />
dominate smaller families with younger matriarchs<br />
(Moss 1988; pers. obs.), thus competing more<br />
successfully for access to scarce resources. Kin-based<br />
alliances also have a significant impact on calf<br />
survival. Large families with more female caretakers<br />
have higher calf survival than smaller families (Lee<br />
1987; Lee 1989).<br />
Bond groups (Moss 1981; Moss & Poole 1983) or<br />
“kin groups” (Douglas-Hamilton 1972) are made up<br />
of several closely allied families and may be<br />
composed of as many as five families (Moss 1988).<br />
Most bond groups appear to be formed when family<br />
units become too large and split along family lines<br />
(Moss 1988). Members of families or bond groups<br />
2<br />
display a special greeting ceremony (Moss 1977,<br />
1981, 1988; Poole et al. 1988), show a high<br />
frequency of association over time, act in a<br />
coordinated manner, exhibit affiliative behaviour<br />
toward one another and are usually related (Moss<br />
1981; Moss & Poole 1983).<br />
Above the level of the bond group is the clan (Moss<br />
1981), defined as families and bond groups which<br />
use the same dry season home-range (Moss 1981;<br />
Moss & Poole 1983). While the term ‘clan’ is a<br />
useful category for a biologist to use when<br />
describing levels of association and habitat use, it<br />
is still unclear whether it is a functioning social<br />
unit from an elephant’s perspective.<br />
A female elephant may be found in a number of<br />
different types of groups ranging from a fragment<br />
of a family unit to an aggregation of elephants<br />
numbering in the thousands and composed of many<br />
clans. Except in unusual circumstances female<br />
elephants are never found alone. <strong>The</strong> size and<br />
structure of groups that a female elephant finds<br />
herself in may change hourly and depends upon a<br />
number of different social and environmental<br />
factors including: the basic size of her family unit,<br />
the number of individuals that make up her bond<br />
group, the strength of bonds between her and other<br />
families, her sexual state, the habitat, the season<br />
and in many cases the level of human threat (Moss<br />
1981, 1988; Poole & Moss 1989; Kangwana 1993;<br />
Njumbi 1993; E. Abe pers. comm.).<br />
<strong><strong>Elephant</strong>s</strong> are highly social animals and data<br />
suggest that where resources are both plentiful and<br />
evenly distributed they will tend to aggregate<br />
(Moss 1988; Poole & Moss 1988; Western &<br />
Lindsay 1984). Particularly noticeable in many<br />
places is the aggregation of elephants during and<br />
following the rains when resources are plentiful<br />
(Douglas-Hamilton 1972; Leuthold 1976; Western<br />
& Lindsay 1984; Moss 1988; Poole & Moss 1989).<br />
A number of explanations have been proposed for<br />
these large aggregations including access to mates<br />
(Moss 1988; Poole & Moss 1989) and the renewing<br />
of social bonds (Moss 1988).<br />
Families that benefit from association when forage<br />
is abundant must divide to maintain foraging<br />
efficiency when resources are scarce (Barnes 1983;<br />
Western & Lindsay 1984) and, as the dry season<br />
progresses, the large aggregations and bond groups<br />
begin to split up. During drought years even family<br />
units may break up for prolonged periods of time<br />
(Moss 1977, 1981, 1988).
<strong><strong>Elephant</strong>s</strong> also tend to aggregate in response to<br />
poaching (Laws et al. 1975; Eltringham 1977;<br />
Eltringham & Malpas 1980; Poole 1989c; Njumbi<br />
1993; Abe 1982) or to the threat of human hostility<br />
(Kangwana 1993) particularly in open savanna<br />
habitats. <strong>The</strong>se aggregations can be distinguished<br />
from social aggregations by the tight bunching pattern<br />
of the elephants (pers. obs.; Moss 1988; I. Douglas-<br />
Hamilton pers. comm.).<br />
<strong>The</strong>re is a tendency for groups to be smaller in tropical<br />
forests (White et al. 1993; Merz 1986) and thick<br />
bushland (Leuthold 1976), than in more open savanna<br />
grassland. White et al. (1993) have reported that in<br />
the forests of Gabon, family unit size averaged only<br />
3.5 individuals and that groups of more than eight<br />
elephants were exceptional. <strong>The</strong>y suggest that small<br />
families are perhaps better able to exploit the patchily<br />
available resources (such as fruit) in forests than are<br />
larger groups.<br />
1.2.3 Male society<br />
Male elephants leave their natal families at about 14<br />
years of age (Amboseli <strong>Elephant</strong> Research Project<br />
(AERP) long-term records). Newly independent<br />
young males may follow several different courses to<br />
social maturity. Some young males leave their<br />
families only to join up with another family for a<br />
couple of years. Others go off to bull areas and join<br />
up with bull groups, while still others stay in female<br />
areas moving from family to family (AERP long-term<br />
records; P. Lee & C. Moss unpublished data).<br />
Once males have reached their early twenties they<br />
enter a highly dynamic world of changing sexual<br />
state, rank, behaviour and associations (Poole<br />
1989a&b). <strong>The</strong> structure and size of groups with<br />
which an adult male associates, and the type of<br />
interactions he has with members of these groups are<br />
determined by his age, and hence body size, and<br />
sexual state (Poole 1989a; Hall-Martin 1987).<br />
Adult male elephants exhibit a period of<br />
heightened sexual and aggressive activity known<br />
musth (Poole & Moss 1981; Poole 1987; Hall-<br />
Martin 1987). <strong>The</strong> word ‘musth’ comes from the<br />
word’‘mast’’meaning intoxicated. During sexually<br />
inactive and non-musth periods males spend time<br />
alone or in small groups of other males in particular<br />
bull areas, where their interactions are relaxed and<br />
amicable (Poole 1987). During )r active musth<br />
periods males leave their bull areas move in search<br />
of oestrus females, which time they are likely to<br />
THE AFRICAN ELEPHANT<br />
be found alone or in association with groups of<br />
females (Poole 1987).<br />
Among non-musth males dominance is determined<br />
by age and body size with larger, older males ranking<br />
above smaller, younger males (Poole 1989a). Once<br />
in the aggressive state of musth, a male ranks above<br />
all non-musth males (Poole 1989a). Among musth<br />
males, dominance is determined by a combination of<br />
body size and condition. Two closely matched males<br />
will often fight, sometimes to the death of one of them<br />
(Hall-Martin 1987; Poole 1989a).<br />
1.3 SEXUAL DIMORPHISM, LIFE<br />
HISTORY AND REPRODUCTIVE<br />
PATTERNS<br />
1.3.1 Sexual dimorphism<br />
Male elephants can be distinguished from females<br />
by their larger, heavier build, their characteristic<br />
curved foreheads in profile (see Chapter 7), and their<br />
thicker tusks (see Chapter 14). Females are slighter,<br />
have an angular forehead in profile, slender, pointed<br />
tusks, and breasts located between their forelegs.<br />
<strong><strong>Elephant</strong>s</strong> are long lived mammals. Age determines<br />
dominance, leadership and calf-survival among<br />
females (Moss 1988; Moss in prep.), and reproductive<br />
success through female choice and dominance among<br />
males (Poole 1989a&b). Early rapid growth of males,<br />
combined with a higher rate of growth throughout<br />
life, leads to the high degree of sexual dimorphism<br />
observed in adults (Lee & Moss 1986; Lee in press).<br />
By the time males are about 17 years old, they are<br />
taller than the largest females. Males continue to grow<br />
in height and weight throughout most of their lives,<br />
eventually reaching almost twice the weight of adult<br />
females (Laws 1966; Hanks 1969). <strong>The</strong> ability of<br />
elephants to continue growing beyond the age of<br />
sexual maturity, when most mammals cease to grow<br />
in height, is related to the unusual delayed fusion of<br />
the long bones, which is more pronounced in males<br />
than in females (Haynes 1991; L. Leakey pers.<br />
comm.). Among female elephants, fusion of the long<br />
bones occurs between 15 and 25 years of age, whereas<br />
in males fusion takes place between 30 and 45 years<br />
of age (Haynes 1991; L. Leakey pers. comm.).<br />
Undoubtedly, there has been strong selective pressure<br />
for large body size in male elephants.<br />
3
THE AFRICAN ELEPHANT<br />
1.3.2 Sexual maturity<br />
<strong>The</strong> age of first ovulation ranges from population to<br />
population, from as young as seven to as old as 22<br />
years (Laws & Parker 1968; Laws et al. 1975; Moss in<br />
prep.), depending upon population densities and<br />
resource availability. In a study of the Amboseli<br />
population, where there were 135 known age females<br />
between eight and 20 years old, the mean age at first<br />
conception leading to full term pregnancy was 11.3<br />
years and the mean age at first parturition was 13.2<br />
years (Moss in prep.). <strong>The</strong> youngest female to give<br />
birth was exactly eight years old at the time of<br />
conception (Moss in press).<br />
Male elephants mature later than female elephants and<br />
although they begin producing sperm at around 14<br />
years old (Laws & Parker 1968), they are not socially<br />
mature, and do not begin competing with older males<br />
for oestrus females until they are in their late teens or<br />
early twenties (Poole 1989a). Between 20 and 25 years<br />
of age, males begin to show distinct sexually active<br />
and inactive periods; and, by 30 years old, males have<br />
usually exhibited their first musth period (Poole 1987).<br />
<strong>The</strong> youngest elephant observed in musth in Amboseli<br />
was 22 years old (AERP long-term records).<br />
1.3.3 Qestrus and musth<br />
<strong>The</strong> oestrous period lasts for four to six days (Moss<br />
1983; Poole 1989b; Mutinda 1994). It has been<br />
postulated that ovulation and conception occur during<br />
mid-oestrus when females are guarded and mated by a<br />
high-ranking musth male (Poole 1989a); Mutinda<br />
1994). Oestrous females attract males by exhibiting<br />
conspicuous behaviour (Moss 1983; Mutinda 1994),<br />
calling loudly and frequently (Poole et al. 1988; Poole<br />
1989b), and producing urine with particular olfactory<br />
components (Rasmussen et al. 1982; Mutinda 1994).<br />
If a female does not conceive she will come into oestrus<br />
again three months later if she is still in good condition<br />
(AERP long-term records).<br />
During musth, males secrete a viscous liquid from<br />
swollen temporal glands just behind the eyes; they<br />
leave a trail of strong smelling urine (Poole & Moss<br />
1981; Poole 1987; Hall-Martin 1987), and call<br />
repeatedly in very low frequencies (Poole 1987). A<br />
male’s testosterone levels rise to over five times his<br />
non-musth levels (Poole et al. 1984), and musth males<br />
behave extremely aggressively toward other males,<br />
particularly those also in musth (Poole 1989a; Hall-<br />
Martin 1987).<br />
4<br />
<strong>The</strong> Musth periods of larger, older males last several<br />
months and occur at a predictable time each year. By<br />
contrast, the musth periods of younger males are short<br />
and sporadic, lasting a few days to a few weeks (Poole<br />
1987; Poole 1989a).<br />
Individual males attempt to locate, guard and mate<br />
with as many oestrous females as possible during their<br />
musth periods. Musth males are more successful at<br />
obtaining matings than non-musth males for two<br />
reasons. First, their large body size and aggressive<br />
behaviour makes them better able to compete for<br />
access to oestrous females and, second, females prefer<br />
to mate with musth males - they will not stand for<br />
younger non-musth males and if approached will<br />
solicit guarding behaviour from a musth male (Moss<br />
1983; Poole 1989b). Older, larger musth males are<br />
more successful than younger musth males (Moss<br />
1983; Poole 1989a&b). Under natural circumstances<br />
males probably do not father their first offspring until<br />
they are between 30 and 35 years old and they do not<br />
reach their prime until about 45 years old (Poole<br />
1989a&b)<br />
1.3.4 Seasonality of breeding<br />
Although most elephant populations do not exhibit a<br />
pronounced breeding season (Poole 1987; Hall-<br />
Martin 1987; but see Hanks 1972 & Kerr 1969), the<br />
occurrence of oestrus and conception is sensitive to<br />
rainfall and resource availability (Laws & Parker<br />
1968; Laws 1969; Poole 1987; Hall-Martin 1987;<br />
Moss 1988; Moss & Dobson in prep.). <strong>The</strong> degree of<br />
seasonality of oestrus varies from population to<br />
population, depending upon habitat and rainfall<br />
conditions (Laws & Parker 1968; Hanks 1969; Laws<br />
1969; Poole 1987; Hall≠Martin 1987). In the<br />
Amboseli population, oestrous females may be<br />
observed in any month of the year, but the frequency<br />
of oestrus is significantly higher during and following<br />
the wet seasons (Poole 1987; Moss 1988) when<br />
females are in good condition.<br />
<strong>The</strong> seasonality of male musth periods reflects the<br />
pattern exhibited by females (Poole 1987;<br />
Hall≠Martin 1987). Oldest, highest-ranking males<br />
come into musth during and following the rains when<br />
food is plentiful and most females come into oestrus<br />
(Poole 1987). At this time of year females aggregate<br />
into large groups, increasing the probability that a<br />
male will find an oestrous female (Poole & Moss<br />
1989).
1.3.5 Birth and calf development<br />
<strong><strong>Elephant</strong>s</strong> are born after a gestation period of 21.5<br />
months with the average birth weight of males being<br />
120kg, 20-30kg more than that for females. <strong>The</strong> sex<br />
ratio at birth is 50:50, although there is evidence that<br />
slightly more males are conceived during years of<br />
higher than average rainfall (Moss & Dobson in<br />
prep.). Calves born to older, larger females are bigger<br />
than those born to younger, smaller females (Lee<br />
1986). Laws & Parker (1968) estimated that twinning<br />
occurred in less than 1% of conceptions. In Amboseli<br />
only one set of twins was recorded out of 147 births<br />
between 1976 to 1980 (Moss 1988).<br />
<strong>The</strong> energetic requirements of calves are met<br />
exclusively by milk consumption for the first three<br />
months of life (Lee & Moss 1986). After this age<br />
calves begin to feed independently with the time spent<br />
feeding increasing rapidly between four and 24<br />
months when it levels off to about 55% of daily time.<br />
<strong>The</strong> majority of calves suckle until the birth of the<br />
next calf, but some calves are weaned before the birth<br />
of the next calf, while others continue to suckle after<br />
their sibling’s birth (Lee & Moss 1986). It is not<br />
uncommon to observe juveniles of up to eight years<br />
old suckling. <strong>The</strong> youngest calf in Amboseli to<br />
survive without milk was 26 months old at the time<br />
of its mother’s death (Lee & Moss 1986).<br />
1.3.6 Interbirth interval<br />
Mean calving interval varies from population to<br />
population, from 2.9 to 9.1 years, with high density<br />
populations or otherwise nutritionally stressed<br />
populations exhibiting longer intervals (Laws &<br />
Parker 1968; Laws et al. 1975; Eltringham 1977).<br />
Most estimates of interbirth interval have been<br />
calculated from the placental scars of culled<br />
elephants and therefore do not take into<br />
consideration the survival of the previous calf. In<br />
the Amboseli study, the mean interbirth interval<br />
between two surviving calves was 4.4 years with<br />
a range of 2 years 7 months to 9 years 1 month<br />
(Moss in press). Females between the ages of 14<br />
to 45 experience the highest fecundity with mean<br />
interbirth intervals increasing to five years by age<br />
52 and six years by age 60 (Moss in press).<br />
Interbirth intervals of up to 13 years may occur<br />
depending upon habitat conditions and population<br />
densities (Laws 1969). With a typical calving<br />
interval of four years, females move into a<br />
synchronous wave pattern with birth peaks every<br />
four years (Moss in press).<br />
1.3.7 Mortality<br />
THE AFRICAN ELEPHANT<br />
Calf mortality is highest in the first 12 months of life,<br />
and is generally low after this age (Lee & Moss 1986).<br />
<strong>The</strong> calves of younger and older females experience<br />
higher mortality rates than middle-aged females.<br />
Experience of the mother, her rank within the family<br />
and her general physical condition all affect calf<br />
survival (Moss in prep.).<br />
Natural mortality of adults has been estimated at 2-<br />
3% on the basis of found jaws (Laws 1969; Corfield<br />
1973) and observations of known-age elephants<br />
(Douglas-Hamilton 1972; Moss in prep.). Data from<br />
a 20-year-study of known individuals in Amboseli<br />
suggest that basing mortality rates on jaws may lead<br />
to an underestimate as not all jaws are found.<br />
1.4 ELEPHANT COMMUNICATION<br />
<strong><strong>Elephant</strong>s</strong> communicate with one another using numerous<br />
sounds (Berg 1983; Poole et al.1988; Poole 1994) and<br />
scents (Buss et al. 1976; Adams et al.1978; Rasmussen<br />
et al. 1982; Poole & Moss 1989) as well as numerous<br />
ear, trunk and body postures.<br />
<strong><strong>Elephant</strong>s</strong> communicate vocally using a wide variety of<br />
sounds, from the higher frequency screams, trumpets,<br />
snorts and bellows to the lower frequency rumbles which<br />
contain components below the level of human hearing<br />
(Berg 1983; Poole et al. 1988), some as low as 14Hz<br />
(Poole et al.1988). <strong>The</strong> ability of elephants to produce<br />
these very low frequency sounds, at sound pressure levels<br />
of up to 102dB at 5m, means that they are, theoretically,<br />
able to communicate with one another over distances of<br />
5-10km, even in thick forest (Poole et al.1988).<br />
<strong>The</strong> fundamental differences in male and female elephant<br />
society are no better revealed than by the striking sex<br />
difference in the number and variety of vocalisations each<br />
uses (Poole 1994). Females use some 22 different<br />
vocalisations while males use only seven; only three of<br />
these calls are made by both sexes. It appears that most<br />
of the female vocalisations are related to family/group<br />
dynamics, cohesion and protection, while the few male<br />
vocalisations are primarily related to male≠-male<br />
5
THE AFRICAN ELEPHANT<br />
dominance or reproduction (Poole 1994), but<br />
vocal communication in elephants is a relatively<br />
new field, and will, I am sure, provide many<br />
more surprises.<br />
1.5 ELEPHANT ECOLOGY<br />
<strong><strong>Elephant</strong>s</strong> are extremely adaptable, occupying<br />
a variety of habitats from desert to savanna to<br />
gallery forest (Lausen & Bekoff 1978).<br />
Environmental factors affect elephant<br />
population dynamics, home range, migration<br />
patterns, diet, group size and composition, all<br />
of which can vary tremendously, in turn<br />
influencing the dynamics of elephants and their<br />
habitats.<br />
An elephant’s diet may include grass, herbs,<br />
bark, fruit and tree foliage. In savanna habitats<br />
grass may make up 70% of the elephants’ diet<br />
in the wet season, with larger proportions of<br />
browse contributing to their diet as the dry<br />
season progresses. In tropical forest, an<br />
elephant’s diet may include as many as 230<br />
species with leaves, twigs, bark and fruit<br />
constituting over 90% of all items eaten<br />
(White’et al.1993). Trees represent up to threequarters<br />
of the species fed upon (White et al.<br />
1993) and, in contrast to savanna elephants,<br />
fruit is an important component of a forest<br />
elephant’s diet (White et al.1993; Alexandre<br />
1977).<br />
Estimates for mean daily intake range from 4%<br />
(Laws et al.1970) to 7% (Ruggiero 1992) of<br />
body weight, with lactating females consuming<br />
proportionately higher quantities (Laws et<br />
al.1970). <strong><strong>Elephant</strong>s</strong> digest only 40% of what<br />
they consume.<br />
<strong><strong>Elephant</strong>s</strong> are capable of greatly affecting the<br />
structure of vegetation and perhaps animal<br />
communities (Laws 1970; Cumming 1982;<br />
Western 1989). At high densities elephants<br />
reduce woodlands, converting them to more<br />
open grassland (Laws et al.1970; Laws<br />
et al.1975; Cumming 1982; Western 1989).<br />
In many areas human expansion and poaching<br />
have forced elephants to alter traditional<br />
migration patterns and concentrate in protected<br />
areas (Western 1989; Tchamba & Mahamat<br />
6<br />
1992; Poole et al.1992). At high densities,<br />
particularly where they have been compressed into<br />
protected areas, elephants can reduce biological<br />
diversity (Western 1989) and cause economic loss<br />
of timber in forests (Laws 1970; Afolayan 1975).<br />
In some cases the reduction of woody vegetation<br />
has been beneficial in opening up tsetse fly infested<br />
woodland and transforming bushland to grassland<br />
for livestock (Western 1989). Often fire or logging<br />
may initiate change with elephants playing a<br />
maintaining role (Dublin et al.1990; Dublin 1991).<br />
Studies have also shown the ecological importance<br />
of elephants as agents of seed dispersal (Alexandre<br />
1977) increasing habitat mosaic in forests<br />
(Kortlandt 1984) and diversifying mammalian<br />
communities (Western 1989). As a keystone<br />
species, elephants play a crucial role in<br />
maintaining linkages in the food web, and their<br />
extermination from some habitats may cause a<br />
cascade of change or extinctions in ecosystems<br />
(Western 1989). Evidence suggests that elephants<br />
diversify savanna and forest ecosystems when free<br />
to move (Western 1989).<br />
1.6 HOME RANGE AND MIGRATION<br />
As with other parameters elephant home ranges<br />
vary from population to population and habitat to<br />
habitat. Individual home ranges vary from 15 to<br />
3,700km 2 (Douglas-Hamilton 1972; Leuthold<br />
1977; Thouless in press). In most areas where they<br />
have been studied, females live in predictable dry<br />
season home ranges, but migrate over large areas<br />
during the wet season (Leuthold & Sale 1973;<br />
Leuthold 1977; Western & Lindsay 1984). Moving<br />
singly or in groups of up to several thousand,<br />
elephants may travel as far as 75km in a few days<br />
(Leuthold 1977). <strong>The</strong>y may live at densities as low<br />
as 0.024 per km 2 (Poche 1974) or as high as 5 per<br />
km 2 (Douglas-Hamilton 1972).<br />
Previously, elephants migrated over long distances<br />
throughout their range. <strong>The</strong> increasing<br />
compression of elephants into smaller and smaller<br />
protected areas with no allowance for seasonal<br />
migration is likely to lead to accelerated habitat<br />
destruction and loss of biodiversity in our national<br />
parks and reserves. Finding solutions to this<br />
problem is one of the most pressing<br />
management needs in elephant conservation<br />
today.
1.7 CONCLUSION<br />
<strong>The</strong> more we, as biologists, learn about elephants,<br />
the more questions we find ourselves asking about<br />
their complex lives. <strong>Elephant</strong> research is a rewarding<br />
experience, and there is much scope to add to the<br />
existing body of knowledge on the <strong>African</strong> elephant.<br />
Undoubtedly, elephants will continue to present<br />
challenges to biologists and wildlife managers alike<br />
for as long as there are elephants.<br />
References<br />
ABE, E. (1982) <strong>The</strong> status of elephants in Uganda: Queen Elizabeth National<br />
Park. Pachyderm 15,49-52.<br />
ADAMS, J., GARCIA, A. & FOOTE C.S. (1978) some chemical constituents<br />
of the secretions from the temporal gland of the <strong>African</strong> elephant (Loxodonta<br />
africana Journal of Chemical Ecology 4, 17-25.<br />
AFOLAYAN, TA. (1975) Effects of elephant activities on forest plantations In<br />
the Kilimanjaro forest-game reserve in northern Tanzania. Oikos 26,405-410.<br />
ALEXANDRE, D.Y. (1977) Role dissÈminateur des ÈlÈphants en fÙret Tai<br />
(CÙte d’Ivoire Terre et Vie 32.47-72.<br />
BARNES, R.F.W. (1983) Effects of elephant browsing on woodlands In a<br />
Tanzanian National Park: measurements, models and management. Journal of<br />
Applied Ecology 20, 521-540.<br />
BERG, J. (1983) Vocalisations and associated behaviours of the <strong>African</strong> elephant<br />
(Loxodonta africana) In captivity. Zietschrift fur Tierpsychologie 63, 63-79.<br />
BUSS, 1.0., RASMUSSEN, L.E. & SMUTS, G.L. (1976) <strong>The</strong> role of stress<br />
and Individual recognition in the function of the <strong>African</strong> elephant’s temporal<br />
gland. Mammalia 40,437-451.<br />
CORFIELD, T.F. (1973) <strong>Elephant</strong> mortality In Tsavo National Park, Kenya.<br />
East <strong>African</strong> Wildlife Journal 11,339-368.<br />
CUMMING, D.H.M. (1982) <strong>The</strong> influence of large herbivores on savanna<br />
structure in Africa. In: Ecological Studies 42: Ecology of Tropical Savannas<br />
(Ed.. B.J. Huntly & B.H. Walker).<br />
DOUGLAS-HAMILTON, I. (1972) On the ecology and behaviour of the <strong>African</strong><br />
<strong>Elephant</strong>. D. Phil. <strong>The</strong>sis. University of Oxford, U.K.<br />
DOUGLAS-HAMILTON, I. (1979) <strong>African</strong> <strong>Elephant</strong> Ivory Trade - Final report<br />
to the US Fish and Wildlife Service. Typescript Report.<br />
DUBLIN, H.T. (1991) Dynamics of the Serengeti-Mara woodlands. An<br />
historical perspective. Forest and Conservation History 35, 169-178.<br />
DUBLIN, H.T., SINCLAIR, A.R.E. & McGALDE, J. (1990) <strong><strong>Elephant</strong>s</strong> and<br />
fire as causes of multiple stable states In the Serengeti-Mara woodlands, Journal<br />
of Animal Ecology 59, 1147-1164.<br />
ELTRINGHAM, S.K. (1977) <strong>The</strong> numbers and distribution of elephants<br />
Loxodonta africana in the Rwenzori National Park and Chambura Game<br />
Reserve Uganda. East <strong>African</strong> Wildlife Journal 15, 19-39.<br />
ELTRINGHAM S.K. & MALPAS, R.C. (1980) <strong>The</strong> decline In elephant numbers<br />
in Rwenzori and Kabalega Falls National Parks, Uganda. <strong>African</strong> Journal<br />
Ecology 18, 73-86<br />
HALL-MARTTN, A.J. (1987) Role of musth in the reproductive strategy of<br />
the <strong>African</strong> elephant (Loxodonta africana). South <strong>African</strong> Journal of Science<br />
83, 616-620.<br />
HANKS, J. (1969) Seasonal breeding of the <strong>African</strong> elephant In Zambia. East<br />
<strong>African</strong> Wildlife Journal 7, 167.<br />
THE AFRICAN ELEPHANT<br />
HAYNES, G. (1991) Mammoths, Mastodons and <strong><strong>Elephant</strong>s</strong>. Cambridge<br />
University Press, Cambridge.<br />
ITRG (1989). Ivory trade and the future of the <strong>African</strong> elephant. A report by the<br />
Ivory Trade Review <strong>Group</strong> to CITES.<br />
KANGWANA, F.K. (1993) <strong><strong>Elephant</strong>s</strong> and Maasai: conflict and conservation in<br />
Amboseli, Kenya. Ph.D. <strong>The</strong>sis. University of Cambridge, U.K.<br />
KERR. MA. (1978) Reproduction of elephant in the Mana Pools National Park,<br />
Rhodesia. Arnoldia Rhodesia 8,1-11.<br />
KIIRU, W. (1994) <strong>The</strong> status of human-elephant conflict In Kenya. Kenya<br />
Wildlife Service report. Typescript<br />
KORTLANDT, A. (1984) Vegetation research and the “bulldozer” herbivores<br />
of tropical Africa. In: Tropical Rain-Forest: <strong>The</strong> Leeds Symposium (Ed.. A.C.<br />
Chadwick & S.L Sutton). Special Publication of the Leeds Philos Lit So 205-<br />
226.<br />
KUHME, W. (1962) Ethology of the <strong>African</strong> elephant (Loxodonta africana<br />
Blumenbach 1779) In captivity. International Zoo Year Book 4, 113-21.<br />
LAUSEN, L. & BEKOFF, M. (1978) Loxodonta africana Mammalian Species<br />
92. 1-8. Published by American Society of Mammalogists.<br />
LAWS, R.M. (1966) Age criteria for the <strong>African</strong> elephant Loxodonta a. africana,<br />
East <strong>African</strong> Wildlife Journal 4,1-37.<br />
LAWS, R.M. (1969) Aspects of reproduction in the <strong>African</strong> elephant Loxodonta<br />
africana Journal of Reproductive Fertility, Supplement 6, 193-217.<br />
LAWS, R.M. & PARKER. I.S.C. (1968) Recent studies on elephant populations<br />
in East Africa. Symposium of the Zoological Society of London 21, 319-359.<br />
LAWS, R.M., PARKER. I.S.C. &JOHNSTONE, R.C.B. (1970) <strong><strong>Elephant</strong>s</strong> and<br />
habitats In North Bunyoro, Uganda. East <strong>African</strong> Wildlife Journal 8, 163-180.<br />
LAWS R.M., PARKER. I.S.C. & JOHNSTONE, R.C.B. (1975) <strong><strong>Elephant</strong>s</strong> and<br />
their Habitats: <strong>The</strong> Ecology of <strong><strong>Elephant</strong>s</strong> in North Bunyoro, Uganda. Clarendon<br />
Press, Oxford.<br />
LEE, P.C. (1986) Early social development among <strong>African</strong> elephant calves.<br />
National Geographic Research 2, 388-401.<br />
LEE, P.C. (1987) Allomothering among <strong>African</strong> elephant. Animal Behaviour<br />
35, 278-91.<br />
LEE, P.C. (1989) Family structure, communal care & female reproductive effort,<br />
in: Comparative Sociobiology: <strong>The</strong> Behavioural Ecology of Humans and other<br />
Mammals. (Eds. V. Standen & R.A. Foley). Blackwell Scientific Publications,<br />
Oxford.<br />
LEE, P.C. & MOSS, CJ. (1986) Early maternal Investment In male and female<br />
<strong>African</strong> elephant calves. Behavioural Ecology and Sociobiology 18, 353-361<br />
LEUTHOLD,W. (1976) <strong>Group</strong> size In elephants of Tsavo National Park and<br />
possible factors influencing it. Journal of Animal Ecology 45, 425-439.<br />
LEUTHOLD, W. (1977) Spatial organization and strategy of habitat utilization<br />
of elephants In Tsavo National Park, Kenya. Sondedruck aus 2.f. Saugertierkunde<br />
42, 358-397<br />
LEUTHOLD, W. & J.B. SALE (1973) Movements and patterns of habitat<br />
utilisation of elephant in Tsavo National Park, Kenya. East <strong>African</strong> can Wildlife<br />
Journal 11, 369-386.<br />
MAGLIO, V.J. (1973) Origin and evolution of the <strong>Elephant</strong>idae. Transactions<br />
of the American Philosophical Society 63, 1-149.<br />
MARTIN, RB. (1978) Aspects of elephant social organisation. Rhodesia Science<br />
News 12. 184-188.<br />
MAUNY, R.A. (1956) RÈpartition do Ia grande faune …thiopienne du nordouest<br />
africaine do palÈolithique · nos jours Proceedings of the 3rd Pan-<strong>African</strong><br />
Congress Prehistory, pp. 102-105.<br />
MERZ, G. (1986) Movement patterns and group size of the <strong>African</strong> forest<br />
elephant Loxodonta africana cyclotis in the Tai National Park, Ivory Coast<br />
<strong>African</strong> Journal of Ecology 24, 133-136.<br />
7
THE AFRICAN ELEPHANT<br />
MOSS, CJ. (1977) <strong>The</strong> Amboseli <strong><strong>Elephant</strong>s</strong>. Wildlife News 12(2), 9-12.<br />
MOSS, CJ. (1981) Social Circles, Wildlife News 16(1), 2-7.<br />
MOSS, CJ. (1983) Oestrous behaviour and female choice In the <strong>African</strong> elephant.<br />
Behaviour 86, 167-196.<br />
MOSS, CJ. (1988) <strong>Elephant</strong> Memories. New York William Morrow.<br />
MOSS, CJ. & POOLE, J.H. (1983) Relationships and social structure In <strong>African</strong><br />
elephants. In: Primate Social Relationship.: An Integrated Approach. (Ed. R.A.<br />
Hinde). Blackwell Scientific Publications, Oxford.<br />
MUTINDA, H.S. (1994) Assessment of reproductive status of free ranging<br />
female <strong>African</strong> elephants, Loxodonta africana using non-invasive techniques<br />
M.Sc. <strong>The</strong>sis. University of Nairobi.<br />
NGURE, N. (1993) History and present status of human-elephant conflicts In<br />
the Mwatate-Bura area, Kenya. M.Sc. <strong>The</strong>sis. University of Nairobi.<br />
NJUMBI, S. (1993) Effects of poaching on the population structure of elephants<br />
In Meru National Park. M. Phil. <strong>The</strong>sis. Moi University<br />
PARKER. I.S.C. (1979) <strong>The</strong> ivory trade, Typescript report to Douglas-Hamilton,<br />
l. on behalf of the US Fish and Wildlife Service, Washington, D.<br />
POCHE, RM. (1974) Ecology of the <strong>African</strong> elephant Loxodonta africana<br />
africana In Niger, West Africa. Mammalia 38, 567-80.<br />
POOLE. J.H. (1987) Rutting behaviour In <strong>African</strong> elephants: the phenomenon<br />
of musth. Behaviour 102. 283-316.<br />
POOLE. J.H. (1989a) Announcing Intent: the aggressive state of musth In <strong>African</strong><br />
elephants. Animal Behaviour 37. 140-152.<br />
POOLE, J.H. (1989b) Mate guarding reproductive success and female choice<br />
In <strong>African</strong> elephants. Animal Behaviour 37, 842-849.<br />
POOLE, J.H. (1989c) <strong>The</strong> effects of poaching on the age structure and social<br />
and reproductive patterns of selected East <strong>African</strong> elephant populations. In:<br />
Ivory Trade and the future of the <strong>African</strong> elephant. Vol 2. A report by the Ivory<br />
Trade Review <strong>Group</strong> to CITES.<br />
POOLE. J.H. (1994) Sex differences in the behaviour of <strong>African</strong> elephants. In:<br />
<strong>The</strong> Differences Between the Sexes (Eds. R. Short &P. Lynch) Cambridge<br />
University Press Cambridge.<br />
POOLE. J.H. & MOSS, CJ. (1981) Musth in the <strong>African</strong> elephant Loxodonta<br />
africana. Nature<br />
252, 830-831.<br />
POOLE. J.H. & MOSS, CJ. (1969) <strong>Elephant</strong> mate searching: group dynamics<br />
and vocal and olfactory communication. Symposium of the Zoological Society<br />
of London 61, 111-125.<br />
8<br />
POOLE, J.H., PAYNE, KB., LANGBAURER W., MOSS, C.J. (1984) Musth<br />
and urinary testosterone concentrations in the <strong>African</strong> elephant Loxodonta<br />
africana. Journal of Reproduction and Fertility 70 255-260.<br />
POOLE, J.H., PAYNE, KB., LANGBAUER W., MOSS, C.J. (1986) <strong>The</strong> social<br />
contexts of some very low frequency calls of <strong>African</strong> elephants. Behavioural<br />
Ecology and Sociobiology 22 385-392.<br />
POOLE, J.H., AGGARWAL, N., SINANGE R. NGANGA. S.. BORTON, M.<br />
& DOUGLAS-HAMILTON, l. (1992) <strong>The</strong> status of Kenya’s elephants, 1992,<br />
Unpublished report, Kenya Wildlife service and Department of Resource Surveys<br />
and Remote Sensing<br />
RASMUSSEN LE., SCHMIDT, M.J., HENNEOUS, R. GRAVES, D. &<br />
DAVES, GD. (1982) Asian bull elephant Flehmen like responses to extractable<br />
components In female elephant oestrus urine. Science 217, 159-162.<br />
REES, AR (1983) Some notes on elephants and their feeding habits. Tanganyika<br />
Notes and Record 61, 205-208.<br />
ROSS, D.H. (1993) <strong>Elephant</strong> <strong>The</strong> Animal and its Ivory In <strong>African</strong> Culture. Fowler<br />
Museum of Cultural History University of California Los Angeles.<br />
RUGGIERO, RG. (1992) Seasonal forage utilisation by elephants in central<br />
Africa. <strong>African</strong> Journal of Ecology 30, 137-148.<br />
TCHAMBA M. & MAHAMAT, H (1992) Effects of elephant browsing on the<br />
vegetation in Kalamaloue National Park, Cameroon.<br />
Mammalia 56(4), 533-540.<br />
UNITED REPUBLIC OF TANZANIA. (1989) Typescript. Transfer of the<br />
<strong>African</strong> elephant (Loxodonta africana from Appendix II to Appendix I of the<br />
Convention on International Trade In Endangered Species of Wild Fauna and<br />
Flora (CITES)<br />
WESTERN, D. (1986) An odyssey to save the <strong>African</strong> elephant. Discover<br />
Magazine, October 1986.<br />
WESTERN, D. & LINDSAY, W.K. (1984) Seasonal herd dynamics of a savanna<br />
elephant population. <strong>African</strong> Journal of Ecology 22 229-244.<br />
WESTERN, D. (1989) <strong>The</strong> ecological value of elephants: a keystone role In<br />
Africa’s ecosystems. In: Ivory Trade and the future of the <strong>African</strong> elephant.<br />
Vol.2. A report by the Ivory Trade Review <strong>Group</strong> to CITES.<br />
WHITE, L.J.T., TUTIN, C.E.G. & FERNANDEZ, M. (1993) <strong>Group</strong> composition<br />
and diet of forest elephants, Loxodonta africana cyclotis Matschie 1900, in the<br />
Lope Reserve. Gabon. <strong>African</strong> Journal of Ecology 31, 181-199.
SECTION 1<br />
ELEPHANT MANAGAMENT<br />
THE AFRICAN ELEPHANT<br />
9
2.1 INTRODUCTION<br />
In Africa, some of the most important decisions that have<br />
had to be made, and will continue to be made in wildlife<br />
management, revolve around elephants. Management<br />
decisions must be made about what to do with elephants<br />
both inside and outside protected areas, and the appropriate<br />
action which must follow. <strong>The</strong>se decisions may occur at<br />
the park warden level or they may be taken at higher political<br />
levels. Either way, these decisions can have far-reaching<br />
consequences, and they need to be based as firmly as<br />
possible on sound information. This demonstrates the need<br />
to have as much accurate and up-to-date data as possible.<br />
So, what exactly does a wildlife manager need to know<br />
about elephants in order to manage them and ensure their<br />
protection and conservation, now and in the future? In this<br />
chapter we note the types of problems confronting<br />
management authorities and the range of elephant<br />
management options available to them, and we discuss the<br />
kinds of data that can assist decision making.<br />
2.2 DECIDING ON A MANAGEMENT<br />
OPTION<br />
<strong>The</strong> protection of wildlife conservation areas is complex<br />
and involves political, social, economic, technical and<br />
ecological considerations as well as those of a financial,<br />
legal and administrative nature. All these considerations<br />
play a role in determining the ultimate choice of<br />
management options. A very useful workshop in Kruger<br />
National Park produced a set of guidelines (Ferrar 1983)<br />
for the management of large mammals in <strong>African</strong><br />
conservation areas, including a chapter on how managers<br />
make decisions. <strong>The</strong> following ideas derive, in part, from<br />
these proceedings. Essentially, in managing a wildlife<br />
10<br />
CHAPTER 2<br />
MAKING MANAGEMENT DECISIONS FROM DATA<br />
H.T. Dublin and R.D.<br />
Taylor*<br />
WWF Regional Office Eastern Africa<br />
P.O. Box 62440, Nairobi, Kenya<br />
*WWF Programme Office<br />
P.O. Box CY 1409, Causeway<br />
Harare, Zimbabwe<br />
system there is a technical component and a subjective<br />
component to decision making.<br />
<strong>The</strong> technical component of decision making relates to facts,<br />
and addresses questions such as “What is the current state<br />
of the system?” Because of the complexity of ecological<br />
systems, and because the necessary information is not<br />
always available, there is still a large amount of uncertainty<br />
about the technical aspect of decision making. This<br />
uncertainty emphasizes the need to monitor changes in<br />
ecological variables in relation to the objective of a<br />
management action. As new information becomes available,<br />
it can be used to improve or alter the management action.<br />
Thus, research, monitoring and feedback become integral<br />
components of management.<br />
<strong>The</strong> subjective component of decision making relates to<br />
preferences and opinions, and addresses questions such as<br />
“What state of the system do we prefer?” and”“How would<br />
we like the system to change?” A value judgement is used<br />
to choose between options of equal merit.<br />
Many wildlife management questions involve both<br />
technical and subjective aspects. For example, the question<br />
“Are there too many animals in this area?” is really two<br />
questions and requires two quite different answers:<br />
i) “Will the number of animals cause the system<br />
to change in any way?” <strong>The</strong> answer here is<br />
purely a technical one.<br />
ii) “What amount of change in the system is<br />
permissible in this area?” <strong>The</strong> answer depends<br />
on the objective for the area and ultimately rests<br />
on preference, i.e. it is subjective.
An important function of research is to provide<br />
information and data to answer the first part of the<br />
question, which is of a technical nature, thus enabling<br />
a decision to be made on the second part of the<br />
question which is a matter of preference. However, it<br />
is important to note that the distinction between these<br />
two parts of a question is rarely made, and subjective<br />
decisions often override most other considerations.<br />
2.3 WHAT ELEPHANT MANAGEMENT<br />
OPTIONS ARE THERE?<br />
<strong>The</strong>re are three basic approaches to the management<br />
of elephants:<br />
• minimal or laissez-faire management;<br />
• management for ecological objectives;<br />
and<br />
• management for economic objectives.<br />
a) Minimal or laissez-faire management<br />
Minimal or laissez-faire management implies the<br />
decision to do nothing or not to intervene with<br />
ecological processes. This is a management option<br />
practiced widely in many elephant range states. In<br />
some cases the decision to do nothing or not to<br />
intervene has arisen by default or inaction, and is not<br />
an intentionally selected option, clearly decided upon<br />
and explicitly stated.<br />
<strong>The</strong> assumptions underlying minimal or laissez-faire<br />
management are that the natural systems under<br />
consideration, including those that support elephants,<br />
are able to regulate themselves without human<br />
interference, and that non-interference is a necessary<br />
pre-condition for the self-regulation of systems. While<br />
it is very difficult, and it may take years, to test this, not<br />
doing so could lead to delays in recognising the<br />
existence of serious problems. It, therefore, remains<br />
extremely important and valuable to test the assumptions<br />
on which laissez-faire management decisions are based.<br />
b) Management for ecological objectives<br />
<strong>The</strong> underlying assumption in management for ecological<br />
objectives is that natural systems are so disrupted under<br />
the conditions imposed on them by modern man that they<br />
can no longer regulate themselves. In order to meet<br />
stated ecological objectives, management intervention<br />
is therefore necessary. Whatever management<br />
MANAGEMENT DECISIONS<br />
intervention is chosen, it will require testing through<br />
appropriate monitoring and evaluation, and<br />
experimentation, if this is possible. In the context of<br />
elephant populations, management for ecological<br />
objectives can take a variety of forms, for example:<br />
• habitat modification, such as management<br />
by fire or removal of vegetation;<br />
• provision and/or manipulation of water<br />
supplies;<br />
• population reduction either through<br />
culling or translocation; and<br />
• control of population movement through<br />
the construction of physical barriers such<br />
as fences.<br />
c) Management for economic objectives<br />
Here systems, and more specifically, the animals<br />
within them, are exploited for economic gain.<br />
With regard to elephants, economically-based<br />
consumptive exploitation may include safari hunting<br />
for trophies or cropping for meat or leather<br />
production. Economic objectives may also include<br />
increasing tourist viewing. For example, special water<br />
points may be constructed or fire management may<br />
be used to manipulate habitats to encourage the<br />
concentration of large numbers of elephants in open<br />
areas.<br />
None of the above management approaches are<br />
necessarily mutually exclusive; one or more may be<br />
implemented. <strong>The</strong> manager should have stated goals,<br />
usually arising from higher level policy decisions, and<br />
needs to know not only the economic or financial<br />
implications of his intervention but also the ecological<br />
consequences. In the case of consumptive use, he may<br />
also need to know the consequences of such off takes<br />
for the population being exploited; the wildlife<br />
manager may need to consult with biologists tasked<br />
with monitoring the elephants and analysing the<br />
information gathered.<br />
Ancillary activities that enhance the above three<br />
primary approaches include law enforcement and the<br />
implementation of community-based wildlife<br />
management and conservation programmes. Where<br />
implemented, these activities should also be part of<br />
an overall management strategy and plan, each with<br />
its own research, monitoring and evaluation<br />
components.<br />
11
MANAGEMENT DECISIONS<br />
2.4 WHAT DO MANAGERS NEED TO<br />
KNOW ABOUT ELEPHANTS?<br />
In seeking to define research priorities. Bell and<br />
McShane-Caluzi (1985) ask the question: ‘What does<br />
management need to know in order to reach its<br />
objectives more effectively?” In asking this, one is<br />
confronted with the research priority paradox: if we<br />
do not understand a system or species how do we<br />
know what to study first?<br />
Before we can begin to manage elephants and the<br />
habitats in which they occur, we need to know<br />
something about both. <strong>The</strong>re are a number of key<br />
ecological attributes or characteristics of an elephant<br />
population that are important to management.<br />
Information about the life history of elephants and<br />
their biological make-up is an essential requirement.<br />
It should be noted, though, that it may not always be<br />
possible, or necessary to defer management action<br />
because not all the information on which to base<br />
management decisions has been collected. Whatever<br />
management action is taken, if it is properly executed<br />
and rigorously applied and monitored, it can be treated<br />
as an experiment to provide answers to some of the<br />
research questions being asked. So in managing<br />
elephants, what factors must a manager have some<br />
basic information on?<br />
a) Abundance and trend<br />
Data on elephant numbers and density are basic<br />
requirements for a manager, particularly if there are<br />
plans to exploit the population in any way. It is,<br />
therefore, important to know how many elephants<br />
there are in the population or area under consideration,<br />
and whether the population in question is increasing,<br />
decreasing or stable. Obviously trends in population<br />
size can only be answered over time, and this requires<br />
a suitable monitoring programme to be put in place.<br />
Obtaining reliable counts of wild animals is not easy<br />
and there are a variety of ways in which elephant<br />
population numbers can be estimated. <strong>The</strong>se include<br />
aerial counts, which may be sample or total counts<br />
(described in Chapters 3 & 4 respectively) and ground<br />
counts (described in Chapter 6). Such counts are widely<br />
applied in savanna areas, but in the dense forests of<br />
central Africa ground counts of elephant dung are used<br />
to provide estimates of elephant numbers (Chapter 5).<br />
In many circumstances, only an index of elephant<br />
abundance can be established and monitored over time.<br />
Whichever counting method is used, it is<br />
important that the counts are consistent, reliable<br />
12<br />
and repeatable over time. In addition, the manager needs<br />
to know something about the quality of the data. For<br />
aerial counts, confidence limits, sampling intensity and<br />
search rates are important factors which will provide<br />
information on the data quality, and its reliability through<br />
either its accuracy (for total counts) or its precision (for<br />
sample counts). Data quality categories have been<br />
developed by the <strong>African</strong> <strong>Elephant</strong> <strong>Specialist</strong> <strong>Group</strong><br />
(AfESG) of IUCN’s Species Survival Commission<br />
(Said et al. in press). <strong>The</strong>se will be of value to managers<br />
in assessing the quality of elephant count data on which<br />
they must base their management decisions. Even if<br />
the numbers counted or estimated are not absolute and<br />
only reflect an index of abundance, provided the method<br />
used remains the same the manager can compare<br />
estimates over time.<br />
b) Distribution and movement<br />
A wildlife manager also needs to know where<br />
elephants are distributed across the area in question<br />
and the nature of that distribution. Are there, for<br />
example, seasonal shifts in distribution or regular<br />
movement patterns? Have traditional or established<br />
movement patterns become disrupted by recent<br />
changes in land use and settlement patterns, and what<br />
are the implications for the affected elephant and<br />
human populations? How these questions can be<br />
answered is described in Chapter 8 on studying<br />
elephant movements and in Chapter 12 on the satellite<br />
tracking of elephants. <strong>The</strong> answers will allow<br />
informed management decisions to be made. Chapter<br />
17 outlines the practical details of immobilising<br />
elephants so that they can be fitted with radio or<br />
satellite transmitter collars; a costly but integral part<br />
of many studies on elephant movements.<br />
Where possible, it is good to distinguish and describe<br />
elephant range as accurately as possible. Members<br />
of the AfESG (1993) recently suggested categories<br />
of elephant range. <strong>The</strong>se are:<br />
i) core range - where elephants are present<br />
throughout the year;<br />
ii) seasonal range - where elephants are<br />
present seasonally;<br />
iii) erratic range - where elephants may occur<br />
periodically but not necessarily every<br />
year; and<br />
iv) unknown range - where elephants are<br />
known to occur, but where there is no<br />
further information available.
<strong>Elephant</strong> range and distribution data become<br />
particularly important where cross-border movements<br />
occur and two or more countries share the same<br />
elephant population. This of course has important<br />
management implications for the countries involved,<br />
and can become especially complicated if<br />
management policies between the countries differ<br />
markedly.<br />
Data on the seasonal movement of elephants were<br />
used to make management decisions in Matusadona<br />
National Park in Zimbabwe (Taylor 1983). <strong>The</strong><br />
management authority needed to know whether<br />
elephants moved in and o ut of the Park seasonally<br />
and if so, to what extent, in order to make decisions<br />
about reducing elephant numbers to protect<br />
escarpment woodlands. A three-year tracking study<br />
of radio-collared elephants indicated that animals in<br />
the south of the Park did indeed move into the adjacent<br />
communal lands where they were economically<br />
important, and these elephants were, therefore, not<br />
culled. In the north, however, elephants had much<br />
smaller home ranges and were resident year-round,<br />
and here culling the elephants to protect the habitat<br />
was prescribed.<br />
c) <strong><strong>Elephant</strong>s</strong> and their habitats<br />
Following on from a knowledge of how many<br />
elephants there are and where they are distributed, it<br />
is most likely a manager will want to understand how<br />
the elephants are utilising the habitats in which they<br />
live. Within these habitats it may be useful to know<br />
what the elephants are eating. Chapter 9 looks at how<br />
the interactions between elephants and their habitats<br />
may be studied.<br />
A manager may want to know the rate of woodland<br />
loss or the rate of growth of a particular plant species<br />
under given or differing elephant densities in order<br />
to answer a management question relating to the<br />
objectives of a park. <strong>The</strong> influence of factors such as<br />
fire and water availability also needs to be taken into<br />
account when examining the relationships between<br />
elephants and their habitats. Fire and water may be<br />
natural or artificial components of the environment<br />
but their roles need to be assessed and monitored on<br />
a regular basis.<br />
Causal effects are often difficult to establish in<br />
elephant-habitat dynamics. Sometimes<br />
ecosystem models, which may begin as simple<br />
flow diagrams and expand into complex<br />
computer models, can help a manager understand<br />
the system he is endeavouring to manage.<br />
Likewise, the models may impede, obscure or<br />
distort understanding. Models should be used with<br />
caution and only where they are based on good<br />
empirical evidence with a sound understanding of<br />
their limitations and the assumptions used in their<br />
formulation. A model, of whatever sort, will be of<br />
most use to a manager when he is familiar with the<br />
ecosystem he is managing and he can contribute to<br />
the development of the model and interact with it on<br />
the strength of his own knowledge and updated<br />
information which comes from regular and repeated<br />
monitoring. Simple models with predictive capacity<br />
can allow the manager to simulate and implement<br />
decisions on the computer and evaluate the<br />
consequences of such decisions before he actually<br />
carries them out. In this way the manager can assess<br />
the level of risk involved in taking a management<br />
decision before actually implementing it. Such simple<br />
modelling approaches have been effectively<br />
developed for the Tsavo ecosystem (Wijngaarden<br />
1985) and the Serengeti-Mara ecosystem of East<br />
Africa (Dublin et al.<br />
1990). However, the broader application of modelling<br />
to wildlife management is well covered by Starfield<br />
and Bleloch (1986).<br />
d) Population biology<br />
MANAGEMENT DECISIONS<br />
At the population level, there are three key points<br />
that have implications for elephant management.<br />
i) Population dynamics<br />
Individual growth rates, age and sex structure and<br />
rates of increase of the population as a whole, calving<br />
intervals, age at sexual maturity, age at birth of first<br />
calf and breeding senescence are all parameters which<br />
collectively help to define and characterise the<br />
dynamics of a population. Whereas much of this<br />
information was previously collected from culled<br />
animals (Laws et al. 1975; Hanks 1979), in recent<br />
years, similar data have been gathered from detailed<br />
observations of known individuals over time (Moss<br />
1988). Data collected from both sources should be<br />
seen as complementary and corroborative to confirm<br />
our present understanding of elephant population<br />
biology and dynamics. Methods of gathering this<br />
information from a live population are described in<br />
Chapter 7 and details on how to collect material and<br />
data from dead elephants are given in Chapter 18.<br />
Chapter 13 describes how to study the reproductive<br />
physiology of elephants which will also contribute<br />
to the understanding of elephant population dynamics.<br />
Population growth rates below the theoretical<br />
maximum imply that the ecological carrying capacity<br />
or equilibrium density (“K” in the logistic growth<br />
curve) is being approached or that mortality (natural<br />
13
MANAGEMENT DECISIONS<br />
and man-induced) is increasing or natality is<br />
depressed, due perhaps to disease or stress. Large,<br />
slow breeding and long-lived species such as<br />
elephants are more vulnerable to environmental<br />
setbacks, such as drought, or management errors,<br />
than those that are short-lived with high growth<br />
rates because their potential for rapid recovery<br />
following disruption is low. Details on how to<br />
study the population dynamics of large mammals<br />
are given in Caughley (1977) and Sinclair and<br />
Grimsdell (1982).<br />
Sex and age structure estimates of a population<br />
are extremely important and valuable data for a<br />
manager trying to understand population<br />
dynamics. Ideally such information should be used<br />
in combination with additional and complementary<br />
population census data. This will guard against<br />
pitfalls due to imprecise or incomplete information<br />
in analysis and interpretation.<br />
<strong>The</strong> age and sex composition of a population can<br />
be influenced by conception rates, birth and death<br />
rates, calf survival and other behavioural<br />
characteristics. <strong>The</strong> proportion of individuals of<br />
each sex in each age class is changing continuously<br />
and the theoretical concept of a stable age<br />
distribution almost never exists. Populations with<br />
a preponderance of young can be expected to<br />
increase whereas a population whose age<br />
distribution is skewed towards the older age classes<br />
will remain either stable or decrease. Likewise,<br />
elephants of different sex and age classes respond<br />
differentially to environmental stimuli, such as<br />
rainfall or other stochastic events which can induce<br />
nutritional stress or pulses of growth. Chance<br />
effects alone can cause annual population growth<br />
rates in elephant populations to vary from 2% to<br />
6% in any given year.<br />
Depending on the management objective,<br />
manipulating sex and age composition through<br />
management action needs to take these<br />
considerations into account. Martin and Conybeare<br />
(1992) describe a management regime for an<br />
elephant population which includes sport hunting,<br />
culling for ecological reasons and problem animal<br />
control. Each treatment predicts a different effect<br />
on the managed population with respect to its sex<br />
and age structure.<br />
ii) Behaviour and social organisation<br />
<strong>The</strong> dynamics of a population may be affected through<br />
changes in group size or other social disruptions such<br />
as the removal of age classes which are important to<br />
14<br />
the group’s social structure and functioning. Over<br />
time, studies on the behaviour of elephants can<br />
provide a manager with an understanding of the<br />
effects of different management strategies on the<br />
behavioural and social organisation of a population<br />
(see Chapter 10 on how to study elephant<br />
behaviour). In elephants, social disruption may<br />
occur when the sex and age distribution of a<br />
population is manipulated through culling,<br />
poaching or translocation of individuals.<br />
Behavioural studies have particular relevance to<br />
the translocation of live elephants to new areas and<br />
may provide important insights into the residual<br />
effects on both source and destination populations.<br />
In the future, elephant vocalisation studies may<br />
shed even more light on the effects of such<br />
manipulations (see Chapter 11).<br />
<strong>Elephant</strong> group size and changes in group size,<br />
whether seasonal or long-term, are influenced by<br />
many factors and may have important effects on<br />
the ecology of any ecosystem (Western & Lindsay<br />
1984; Dublin 1986). <strong>The</strong>refore, elephant group size<br />
is another important variable to monitor. In some<br />
cases, group size may be influenced by habitat type<br />
and food abundance. For example, elephants often<br />
form large groups in grasslands and swamps,<br />
where food abundance allows the congregation of<br />
large numbers into a small area. In other cases,<br />
very large co-ordinated groups of elephants may<br />
be a manifestation of human disturbance such as<br />
excessive control shooting in which matriarchs are<br />
killed, or large-scale poaching. It is important for<br />
the manager to understand the cause of changes in<br />
grouping behaviour, and this can only be<br />
determined by knowing what the normal grouping<br />
patterns are for the population under consideration.<br />
iii) Body condition and disease<br />
Assessments of body condition will reflect<br />
nutritional stress in response to unfavourable<br />
habitat conditions. Such assessments can be made<br />
visually and from examination of live animals, as<br />
described by Riney (1960) and others, or by postmortem<br />
inspection of condition indices such as fat,<br />
muscle weight and size. <strong>The</strong> collection and use of<br />
data from dead elephants are discussed in Chapter<br />
18.<br />
Disease is a factor in elephant mortality. On the<br />
southern shores of Lake Kariba in Zimbabwe a<br />
small number of elephant males have developed<br />
the “floppy trunk” syndrome, a form of trunk<br />
paralysis the cause of which is still unknown.<br />
<strong><strong>Elephant</strong>s</strong> so afflicted are unable to feed, and death
from starvation results. Anthrax outbreaks are<br />
endemic in Etosha National Park in Namibia<br />
(Lindeque 1988). and encephalomyocarditis, a<br />
fatal viral infection in adult male elephants occurs<br />
in Kruger National Park, South Africa (Grobler et<br />
al. 1994). <strong>The</strong> rapid growth of rodent populations<br />
during drought spreads the virus, and in Kruger the<br />
management response has been to develop a vaccine.<br />
As well as endeavouring to discover the cause of any<br />
disease outbreak, monitoring its incidence is<br />
important in establishing whether the disease is<br />
localised or likely to spread. On the basis of such<br />
data, managers can decide what to do. <strong>The</strong>y may want<br />
to collect post-mortem samples for analysis, or they<br />
may want to destroy the afflicted animals if a suitable<br />
treatment is unavailable. In the event of an extensive<br />
disease outbreak it may become necessary to monitor<br />
mortality rates by counting carcasses, as well as live<br />
elephants, to provide carcass ratios (Douglas-<br />
Hamilton & Burrill 1991).<br />
2.5 THE INTERACTION BETWEEN<br />
HUMANS AND ELEPHANTS<br />
Wildlife managers cannot ignore the fact that elephants<br />
share much of their range with humans. Over 75% of<br />
elephant range lies totally outside the protected area<br />
network (Douglas-Hamilton et al. 1992), and in many<br />
countries there are more elephants outside the protected<br />
area network than there are inside. <strong><strong>Elephant</strong>s</strong> are,<br />
therefore, often sharing land with rural people, and with<br />
the growing human population throughout the continent,<br />
the interaction between people and elephants, and any<br />
resulting conflict, will increase. Land use practices,<br />
human demography and economic practices are,<br />
therefore, important aspects of elephant conservation.<br />
<strong>The</strong>re is an urgent need for elephant conservation to be<br />
integrated into broader land use policies and for strategies<br />
aimed at conserving elephants to include the<br />
considerations of local people, their lifestyles and their<br />
economies in all management and planning.<br />
People and elephants interact directly in a number of<br />
ways. <strong><strong>Elephant</strong>s</strong> cause damage to human property, kill<br />
people and compete with humans for water and forage<br />
resources. People kill elephants for their ivory, and also<br />
in retaliation when elephants have killed someone or<br />
destroyed human property.<br />
In the case of the illegal killing of elephants for their<br />
ivory, managers may need methods of monitoring this<br />
illegal activity and testing whether their management<br />
actions have had anyeffect. <strong>The</strong> methods to do this<br />
MANAGEMENT DECISIONS<br />
are described in Chapter 16 on monitoring law<br />
enforcement and illegal activities. Using data<br />
collected from law enforcement activities in the<br />
field, it is possible to evaluate the impacts of<br />
management actions such as anti-poaching efforts,<br />
and policy decisions such as the international ban<br />
on trade in ivory (Dublin & Jachmann 1992;<br />
Dublin et al. 1995). This kind of information is<br />
important for both wildlife managers and highlevel<br />
policy makers. Parallel studies on the<br />
sourcing of elephant tusks (see Chapter 14) may<br />
assist in identifying the origins of ivory entering<br />
the trade and, subsequently, distinguishing ivory<br />
obtained legally from ivory obtained illegally.<br />
In order to formulate strategies to minimise<br />
conflict and increase tolerance of elephants<br />
amongst rural people, wildlife managers need to<br />
know how elephants impact on people.<br />
Quantitative measurements of damage to crops,<br />
livestock and property help the wildlife manager<br />
to assess the economic and social costs of elephantrelated<br />
damage. Some methods required to do this<br />
are described in Chapter 15. Answers to who,<br />
where, what, how and why come from simple<br />
monitoring procedures which need to be in place<br />
whenever elephants cause problems on a regular<br />
basis. Avery useful and practical system for<br />
measuring problem elephant activity, the<br />
appropriateness, cost effectiveness, and<br />
practicalities of overcoming these problems<br />
through the use of fencing is given by Hoare and<br />
Mackie (1993) and Hoare (1995).<br />
<strong>Elephant</strong> managers also need to balance the costs<br />
to people of living with elephants, with the value<br />
of elephants as a resource. Innovative integrated<br />
conservation and development programmes such<br />
as the Zimbabwean Communal Areas Management<br />
Programme for Indigenous Resources<br />
(CAMPFIRE) (Child 1993; Taylor 1993) can help<br />
to educate local communities, increase their level<br />
of tolerance towards elephants, promote better and<br />
more sustainable land-use practices and contribute<br />
to the larger goal of maintaining biological<br />
diversity. Extensive wildlife areas and the wildlife<br />
they support, whether formally protected or not,<br />
will have a greater chance of survival if<br />
management authorities take into account the<br />
development needs of the local people. By making<br />
communities responsible and accountable for<br />
managing their own resources (such as elephants),<br />
while allowing them to benefit directly from the<br />
wise use of these resources, more elephants are<br />
15
MANAGEMENT DECISIONS<br />
likely to survive longer. Such approaches may be<br />
most effective where management policies allow<br />
the consumptive use of elephants through safari<br />
hunting or culling. For example, in Nyaminyami<br />
District on Lake Kariba in Zimbabwe experiments<br />
are being done on the marketing of problem elephants<br />
to trophy hunting clients in an attempt to alleviate<br />
the problem of local crop raiding (Taylor 1993). In<br />
this way culprit elephants are removed, benefits from<br />
hunting revenues and meat are returned to the affected<br />
community, and the level of offtake from the elephant<br />
population is minimised by combining problem<br />
animal control with trophy hunting.<br />
In dealing with human-elephant conflict managers<br />
also need to monitor their response or lack of response<br />
to problems, in order to evaluate the methods used to<br />
minimise the problem. Once equipped with the basic<br />
information, wildlife management authorities,<br />
researchers and other land use and administrative<br />
agencies working together can develop the most<br />
appropriate solution for the specific problem they face<br />
(Clark & Westrum 1989).<br />
2.6 ADAPTIVE MANAGEMENT<br />
Conservation in Africa should not separate research<br />
from management. Wherever possible, the two<br />
activities should operate together under a system of<br />
adaptive management. Adaptive management<br />
(Holling 1973; Bell & McShane-Caluzi 1985) can<br />
be defined simply as learning by trial and error, and<br />
as a concept it is particularly relevant to the<br />
management of the <strong>African</strong> elephant today. Changes<br />
are occurring rapidly throughout the elephants’ range<br />
and there is little time for elaborate experimentation<br />
to produce fruitful results.<br />
<strong>The</strong> practice of adaptive management involves<br />
selecting a management objective or option,<br />
implementing one or more management actions<br />
designed to meet the desired objective, and<br />
monitoring and evaluating the results of those<br />
management actions. Depending on the outcome of<br />
the chosen management action, subsequent<br />
management actions may be modified, or the original<br />
management objectives changed. Adaptive<br />
management can, thus, be seen as a team effort; one<br />
which requires inputs from all levels of the research<br />
and management staff.<br />
Choosing an option is the prerogative of the<br />
management authority and is usually a subjective<br />
decision which is made in the light of the best<br />
16<br />
available information. <strong>The</strong> chosen option,<br />
however, must take into account three primary<br />
constraints:<br />
i) <strong>The</strong> availability of administrative backup.<br />
Insufficient funds, personnel, equipment, skills and<br />
other logistical issues could limit the timing, extent<br />
or ability of management authorities to implement<br />
a management option and to then monitor and<br />
evaluate its effects. <strong>The</strong>se factors need to be<br />
critically evaluated before implementing a<br />
management decision.<br />
ii) <strong>The</strong> availability of management tools. <strong>The</strong><br />
few necessary tools include the ability to<br />
implement fire management actions; manipulate<br />
water supplies; introduce and/or remove animals,<br />
through capture and/or culling; manipulation of<br />
vegetation and control of soil erosion.<br />
iii) <strong>The</strong> degree of uncertainty. Underlying<br />
adaptive management is the uncertainty that the<br />
chosen management option will achieve its<br />
intended objective. Management action should be<br />
designed in such a manner that managers will learn<br />
equally from success or failure.<br />
Ideally management practice should be effected<br />
as an experiment with a full set of “before” and<br />
“after” records, and also control areas set aside<br />
where the management action is not carried out<br />
but where the same “before” and “after” sets of<br />
records are kept. Natural perturbations to an<br />
ecosystem can be used as experiments very<br />
effectively in the place of manipulative<br />
experimentation or active management<br />
intervention. Careful monitoring of large-scale<br />
natural perturbations may also allow the study of<br />
ecosystem functions which would not be possible<br />
through direct experimentation.<br />
<strong>The</strong> management of elephants in Africa is<br />
becoming a complex matter If elephants are to<br />
survive outside strictly protected parks and<br />
reserves, they can no longer be viewed in isolation<br />
from the people with whom they share much of<br />
their range. <strong>Elephant</strong> managers will need to<br />
integrate our knowledge of elephants and their<br />
requirements with the development challenges<br />
facing Africa as a whole, and managers, scientists<br />
and planners, at all levels will need to work<br />
together for years to come. <strong>The</strong> studies that can be<br />
carried out according to the methods described in<br />
this book provide the fundamental building blocks
towards the long-term management of elephants<br />
in Africa.<br />
References<br />
AFRICAN ELEPHANT SPECIALIST GROUP. (1993) Working <strong>Group</strong><br />
Discussion One: Aerial Survey Working <strong>Group</strong>. Pachyderm 16. 21-23<br />
BELL. R.H.V. & McSHANE-CALUZI, E. (Eds) (1985) Conservation and<br />
Wildlife Management in Africa. Proceedings of a Workshop held at Kasungu<br />
National Park Malawi, October1984. U.S. Peace Corps.<br />
CAUGHLEY, G. (1977) Analysis of Vertebrate Populations. Wiley-Interscience,<br />
New York.<br />
CHILD, B. (1993) Zimbabwe’s CAMPFIRE programme: using the high value<br />
of wildlife recreation to revolutionize natural resource management in communal<br />
areas. Commonwealth Forestry Review 72, 284-296.<br />
CLARK, T.W. & WESTRUM, R. (1989) High performance teams in wildlife<br />
conservation: a species reintroduction and recovery example Environmental<br />
Management 13, 663-670.<br />
DOUGLAS-HAMILION & BURRILL, A. (1991) Using elephant carcass ratios<br />
to determine population trends In: Low Level Aerial Survey Techniques<br />
Monograph No.4. ILCA, Addis Ababa.<br />
DOUGLAS-HAMILTON, I., MICHELMORE, F. & INAMDAR, A. (1992)<br />
<strong>African</strong> <strong>Elephant</strong> Database. UNEP/GRID/GEMS.<br />
DUBLIN, H.T. (1986) Decline of the Mara woodlands the role of fire and<br />
elephants PhD. Dissertation, University of British Columbia.<br />
DUBLIN, H.T. & JACHMANN. H. (1992) <strong>The</strong> impact of the ivory trade ban<br />
on illegal hunting of elephants in six range states in Africa. WWF International<br />
Research Report.<br />
DUBLIN, H.T., MILLIKEN, T. & BARNES. R.F.W. (1995) Four Years After<br />
<strong>The</strong> CITES ban: illegal killing of elephants, ivory trade and stockpiles IUCN/<br />
SSC/AESG.<br />
DUBLIN, H.T., SINCLAIR, A.R.E. and McGLADE J. (1990) <strong><strong>Elephant</strong>s</strong> and<br />
fire as causes of multiple stable states in the Serengeti-Mara wood lands. Journal<br />
of Animal Ecology 59, 1147-1164.<br />
FERRAR, A.A. (Ed.) (1963) Guidelines for the Management of Large Mammals<br />
in <strong>African</strong> Conservation Areas. South <strong>African</strong> National Scientific Programmes<br />
Report No. 69. CSIR, Pretoria.<br />
GROBLER, D., RAATH, C., SWANEPOEL, R., BRAACK. I.E.O & WHYTE,<br />
I.J. (1994) Encephalomyocarditis in elephants in the Kruger National Park<br />
Paper presented at the <strong>African</strong> <strong>Elephant</strong> <strong>Specialist</strong> <strong>Group</strong> Meeting, Mombasa,<br />
Kenya, May1994.<br />
MANAGEMENT DECISIONS<br />
HANKS, J. (1979) A Struggle for Survival: <strong>The</strong> <strong>Elephant</strong> Problem. Struik,<br />
Cape Town.<br />
HOARE, R. (1995) Options for the control of elephants In conflict with people.<br />
Pachyderm 19, 54-63.<br />
HOARE, R.E. & MACKIE, CS. (1993) Problem animal assessment and the use<br />
of fences to manage wildlife In the communal lands of Zimbabwe. WWF<br />
Multispecies Animal Production Systems Project Paper No.39.<br />
HOLLING, CS. (1973) Resilience and stability of ecological systems. Annual<br />
Review of Ecology and Systematics 4, 1-23.<br />
LAWS, R.M., PARKER I.S.C. & JOHNSTONE, R.C.B. (1975) <strong><strong>Elephant</strong>s</strong> and<br />
their Habitats: <strong>The</strong> Ecology of <strong><strong>Elephant</strong>s</strong> in North Bunyoro, Uganda. Clarendon<br />
Press, Oxford<br />
LINDEQUE, M. (1988) Population dynamics of elephants in Etosha National<br />
Park SWA/Namibia. PhD. Dissertation, University of Stellenbosch.<br />
MARTIN, R.B. & CONYBEARE, A.M.G. (1992) <strong>Elephant</strong> Management in<br />
Zimbabwe (Second Edition). A review compiled by the Department of National<br />
Parks &Wildlife Management Harare.<br />
MOSS, C. (1988) <strong>Elephant</strong> Memories Elm Tree Books London.<br />
RINEY, T. (1960) A field technique for assessing the physical condition of some<br />
ungulates. Journal of Wildlife Management 24. 92-94.<br />
SAID, M.Y., CHUNGE, R.N., CRAIG, G.C., THOULESS, C.R., BARNES,<br />
R.F.W.& DUBLIN, H.T. (in press) <strong>African</strong> <strong><strong>Elephant</strong>s</strong> Data base. 1995.<br />
Occasional Paper of the Species Survival Commission. Produced by IUCN in<br />
collaboration with UNEP.<br />
SINCLAIR, A.R.E. & GRIMSDELL. J.J.R. (1982) Population dynamics of<br />
Large Mammals AWLF Handbooks on techniques currently used In <strong>African</strong><br />
wildlife ecology. No.5. AWLF, Nairobi.<br />
STARFIELD, A.M. & BLELOCH, AL (1988) Building Models for Conservation<br />
and Wildlife Management. Macmillan Publishing Company, New York<br />
TAYLOR, RD. (1983) Seasonal movement of elephant in and around<br />
Matusadona National Park, Kariba. Pachyderm 2, 7-9.<br />
TAYLOR, RD. (1993) <strong>Elephant</strong> management In Nyaminyami District<br />
Zimbabwe:<br />
Turning a liability into an asset. Pachyderm 17, 19-29,<br />
WESTERN, D. & LINDSAY, W.K. (1984) Seasonal herd dynamics of a savanna<br />
elephant population. <strong>African</strong> Journal of Ecology 22, 229-244.<br />
WIJNGAARDEN, W. VAN. (1985) <strong><strong>Elephant</strong>s</strong>-Trees-Grass-Grazers:<br />
relationships between climate soils vegetation and large herbivores ins semiarid<br />
ecosystem (Tsavo, Kenya). ITC, Publication No.4.<br />
17
SECTION 2<br />
COUNTING ELEPHANTS<br />
19
SAMPLE COUNTS<br />
COUNTING ELEPHANTS<br />
Numbers and distributions of animal species, along<br />
with information on habitat and land use parameters,<br />
are essential for drawing up management and<br />
conservation plans. This section covers four of the<br />
main methods of obtaining data on elephant numbers.<br />
<strong>Elephant</strong> census techniques fall into two classes. <strong>The</strong><br />
first comprises those surveys where the elephants<br />
themselves are counted. <strong>The</strong>se are “direct counts”.<br />
<strong>The</strong> second class includes surveys where signs of<br />
elephants (dung-piles, tracks, feeding signs) are<br />
counted. <strong>The</strong>se are “indirect counts”.<br />
Direct counts of elephants can either be carried out<br />
from the air, or from the ground. In savanna habitats<br />
aerial counts remain the most effective means of<br />
elephant census (Douglas-Hamilton et al. 1992).<br />
<strong>The</strong>re are two kinds of aerial counts:<br />
sample counts and total counts. In a sample count<br />
only part, or a sample, of the area is searched and<br />
counted, and the number of animals in the whole area<br />
is then estimated from the number in the sampled area<br />
(Norton-Griffiths 1978). <strong>The</strong>se methods are covered<br />
in Chapter 3. In a total count, on the other hand, the<br />
whole of the designated area is searched, and it is<br />
assumed that all groups are located and counted<br />
accurately (Norton-Griffiths 1978). Total aerial counts<br />
are covered in Chapter 4.<br />
Aerial sample methods are today widely used for<br />
censusing elephants and monitoring their movement<br />
and habitat use. It is also only by aerial methods that<br />
areas that are not accessible on the ground can be<br />
censused. <strong>The</strong> choice of whether to use total or sample<br />
aerial counts will depend on the area to be covered,<br />
the size of the populations and the resources available<br />
in terms of trained manpower, aircraft, funding and<br />
time available. Sample counts tend to be cheaper than<br />
total counts, simply because only part of the area is<br />
searched. Total counts are, however, suitable in<br />
relatively small study areas (of the order of 1000km 2 ),<br />
and the results are easy to understand because they<br />
are not confounded by the statistical assumptions of<br />
sample counts.<br />
Where it is impossible to count elephants directly, as<br />
in the extensive forests of west and central Africa,<br />
signs of elephants such as dung piles are used to<br />
provide an estimate of elephant numbers. Dung<br />
counting methods are covered in Chapter 5.<br />
20<br />
<strong><strong>Elephant</strong>s</strong> themselves can be counted from the ground<br />
either on foot or from a vehicle, and the methods<br />
involved are described in Chapter 6. Ground counts<br />
from vehicles are practicable and give excellent<br />
results in small to medium sized areas where the<br />
country can be traversed by vehicles, and where the<br />
vegetation is reasonably open and the animals tame<br />
to vehicles (Norton-Griffiths 1978). Carrying out<br />
counts on foot is not common nowadays, but where<br />
resources are limiting they can provide good<br />
information on a population, as you will see in<br />
Chapter 6.<br />
<strong>The</strong> appropriate technique to use in counting<br />
elephants, thus, depends on the type of habitat (i.e.<br />
vegetation density and topography), the size of the<br />
area to be surveyed, the elephant density, and also<br />
the type of estimate required. Does one need an<br />
accurate estimate, one that approaches the true<br />
population size, but may have wide confidence limits,<br />
or does one need a precise estimate, preferably at<br />
regular intervals, for a population subject to legal offtake,<br />
in the form of safari hunting and culling<br />
operations. In most cases, however, a precise estimate<br />
will be sufficient, and will enable one to monitor<br />
population trends. <strong>The</strong>se statistical considerations are<br />
covered in more detail in the following chapters.<br />
References<br />
DOUGLAS-HAMIL1DN, I., MICHELMORE. F. & INAMDAR. A. (1992)<br />
<strong>African</strong> <strong>Elephant</strong> Database. UNEP/GRID/GEMS, Nairobi<br />
NORTON-GRIFFITHS, M. (1978) Counting Animals. Handbooks on techniques<br />
currently used in <strong>African</strong> wildlife ecology. No.1. (Ed. J.J.R. Grimsdell AWLF,<br />
Nairobi.
3.1 INTRODUCTION<br />
This chapter describes how to carry out a sample count of<br />
elephants using aerial survey techniques. In a sample count,<br />
only part of the study area is searched and a count made. A<br />
series of samples, which are representative of the study<br />
area are taken (Cochran 1963; Campbell 1967; Norton-<br />
Griffiths 1978). <strong>The</strong> study area, or the census zone, is the<br />
whole area for which the elephant population count is to be<br />
carried out, e.g., national park, district, etc., while the sample<br />
zone is that part of the census zone in which the elephants<br />
are actually searched for and counted. <strong>The</strong> total number of<br />
elephants in the census zone is then extrapolated from the<br />
number counted in the sample zone.<br />
3.2 THE ASSUMPTIONS AND<br />
RATIONALE OF A SAMPLE COUNT<br />
In a sample count, we take a few observations, but the<br />
conclusions we draw have a wider application. In other<br />
words, we observe a sample, but apply the conclusions to a<br />
population. For example, the assumption might be that if<br />
10% of the area is sampled, then it will contain 10% of the<br />
elephants in the census zone.<br />
<strong>The</strong> foregoing would hold if elephant distribution and<br />
vegetation conditions were uniform, in which case any kind<br />
of sample would give similar results. However, elephant<br />
numbers and distributions are far from uniform in any one<br />
census area. Similarly, elephants will be more easily seen,<br />
and thus counted, in open areas as opposed to thickly<br />
vegetated country. <strong>The</strong> sample zone, i.e., that portion of the<br />
census zone in which the elephants are counted, must,<br />
therefore, reflect any variations as much as possible.<br />
<strong>The</strong> census zone is divided into sample units which are<br />
chosen at random, meaning that every one unit, n, has<br />
an equal chance of being selected for sampling from<br />
the possible N such units in the census zone (Cochran<br />
1963; Norton-Griffiths 1978; Figs. 3.1 & 3.2). <strong>The</strong><br />
sample zone is, therefore, randomly distributed in the<br />
census zone, thus, theoretically, representing the<br />
variations in elephant numbers and distribution.<br />
Fig. 3.1: Possible transects in a census zone.<br />
SAMPLE COUNTS<br />
CHAPTER 3<br />
COUNTING ELEPHANTS FROM THE AIR - SAMPLE COUNTS<br />
Fig. 3.2. Transects randomly selected for sampling.<br />
Susan Mbugua<br />
Department of Resource Surveys and Remote Sensing<br />
P.O. Box 47146<br />
Nairobi, Kenya<br />
<strong>The</strong> population estimate of the elephants is then<br />
calculated, based on the average counted number of<br />
animals in the sample units. Since the units are randomly<br />
selected, the average number of elephants per unit in the<br />
sample will correspond to the average number of<br />
21
SAMPLE COUNTS<br />
elephants per unit in the sample will correspond to<br />
the average number in the whole population. <strong>The</strong> total<br />
population estimate is then obtained by multiplying<br />
the sample mean by the total number of units in the<br />
census zone.<br />
Thus, let<br />
N = total number of units in census zone<br />
n = number of units sampled<br />
y = sample mean<br />
<strong>The</strong>n sample estimate Y[INSERT ACCENT] = y.N<br />
or ‘y’ multiplied by ‘N’.<br />
Equally, if X elephants were counted in 10% of the<br />
census zone, then the total estimate is obtained by:<br />
22<br />
X/10.100<br />
where 100= census zone<br />
Detailed and easy to follow examples for calculating<br />
estimates and their variances are given by Norton-<br />
Griffiths (1978). Despite ensuring that samples units<br />
are randomly selected, the nature of elephant<br />
distribution may necessitate further refinement of<br />
sample units.<br />
3.3 ACCURACY AND PRECISION<br />
Sample counting assumes that the area actually<br />
sampled (sample zone) contains a corresponding<br />
percentage of the “true” population in the census<br />
zone. Due to various factors, however, this may not<br />
be the case. To start with, elephants (as indeed other<br />
animals), are not evenly distributed. Thus, different<br />
sample units in the census zone will contain varying<br />
numbers of elephants. It follows then that different<br />
population estimates will be obtained depending on<br />
the units selected for sampling, i.e., there will be large<br />
numbers of alternative estimates. This result is due<br />
to what is referred to as sampling error, and the larger<br />
the variation in numbers of elephants between the<br />
units, the larger the range of alternative estimates or<br />
confidence limits. Sampling error results from the<br />
uneven distribution of animals and the sampling<br />
technique used (Norton-Griffiths 1978). In addition<br />
to sampling error,biases also affect the population<br />
estimates. Biases are errors in one direction, e.g.<br />
underestimating. <strong>The</strong>y result from various factors -<br />
such as spotting and counting, photo counting,<br />
aircraft operations, etc. See Norton-Griffiths (1978)<br />
and ILCA (1979) for more explanation on confidence<br />
limits, sampling error and biases, and ways of<br />
minimizing them.<br />
At this point let us examine the words accuracy and<br />
precision. Consider a hypothetical population of 94<br />
elephants. Suppose that during three different<br />
surveys, we get 50, 72 and 160 elephants, giving an<br />
average of 94; alternatively we could also get 92, 97<br />
and 93, also giving an average of 94. <strong>The</strong> latter is<br />
more precise, as the “true” population lies within a<br />
narrow range, i.e., the confidence limits are low. On<br />
the other hand, an accurate estimate is very near the<br />
“true” population, but the confidence limits may be<br />
wide.<br />
Whether we aim for an accurate or precise estimate<br />
is determined by the objectives of the survey.<br />
Accurate estimates are more important if a culling<br />
operation is to take place, while precise ones are<br />
important for detecting changes in population trends.<br />
<strong>The</strong> ideal estimate would be one that is both accurate<br />
and precise.<br />
3.4 STRATIFICATION<br />
<strong><strong>Elephant</strong>s</strong> tend to be clumped in distribution, such<br />
that even when sample units are randomly selected,<br />
the estimate will have high variances. Stratification<br />
or division into areas or strata of more or less<br />
homogenous elephant density reduces the variance<br />
(see Chapter 5 - Box 5.1). Stratification can also be<br />
carried out according to vegetation type or density<br />
or other major sources of variation. Through<br />
stratification, sampling effort can be more efficiently<br />
allocated to areas of greater interest or ecological<br />
importance. <strong>The</strong> strata so identified are then sampled<br />
separately and the estimates combined for the entire<br />
census zone (Cochran 1963).<br />
3.5 SAMPLE COUNTING METHODS<br />
Several techniques of sample count have been used<br />
in elephant studies. <strong>The</strong> choice of the method to use<br />
is left to the researcher/manager, but will be heavily<br />
influenced by the following:<br />
i) objectives of the count<br />
ii) level of data accuracy required<br />
iii) time within which the results must be obtained<br />
iv) availability and level of training of personnel<br />
v) financial resources<br />
After the above have been given careful
consideration, the most appropriate method, in view of<br />
the circumstances, can be decided upon. Broadly,<br />
sampling methods fall into two main categories:<br />
transects and block counts.<br />
3.6 TRANSECTS<br />
Transect sample counts are the more widely used for<br />
counting elephants, with the sampling units being the<br />
transects. <strong>The</strong>se are straight parallel lines which run from<br />
one end of the census zone to the other and usually<br />
follow a grid system (Fig. 3.1). <strong>The</strong>y must be clearly<br />
marked on a topographical map of the census zone.<br />
<strong>The</strong> pilot flies along each transect in turn, maintaining<br />
the prescribed height and speed. <strong>The</strong> observers spot and<br />
count all elephants seen in the sampling zone as<br />
demarcated by rods (see Section<br />
3.7). Herds numbering more than five are photographed.<br />
<strong>The</strong> records must be entered directly onto data forms,<br />
or tape-recorded for later transcribing onto the data<br />
forms. <strong>The</strong> latter is more efficient, and allows the<br />
observer more time for scanning and counting.<br />
Two major transect sampling techniques are currently<br />
used for elephant counts. <strong>The</strong>y are both very similar<br />
and use similar analysis formulae, differing only in the<br />
sampling pattern.<br />
i) random transect sampling<br />
ii) systematic transect sampling<br />
Fig. 3.3: Defining the Sampling strip (source: Norton-Griffiths 1978).<br />
SAMPLE COUNTS<br />
Depending on the situation and aims of the survey,<br />
stratification can be carried out. Before I go into the<br />
sampling techniques, I will describe how to define<br />
and calibrate the sampling strip.<br />
3.7 DEFINING THE SAMPLING STRIP<br />
<strong>The</strong> sampling strip has been described by various<br />
authors (Pennycuick et al. 1972; Norton-Griffiths 1978;<br />
Ottichilo et al. 1985), and will be described only briefly<br />
here.<br />
<strong>The</strong> sampling strip is the area on the ground in which<br />
counts are made; it is defined by metal rods attached to<br />
the wing struts of an aircraft. A pair of parallel rods are<br />
attached on one or both sides of the aircraft, the strip<br />
width being determined by the distance between the<br />
rods, and the flying height.<br />
Wider rod spacing and higher flying height give wider<br />
sampling strips, and vice versa. Having decided on<br />
the flying height and strip width, the rods must then<br />
be placed at the correct spacing. By knowing what<br />
area the observer can see while the plane is on the<br />
ground, the area observed at any height can be<br />
calculated. This is carried out as follows:<br />
i) <strong>The</strong> aircraft is propped into flying position. <strong>The</strong><br />
observer sits in a relaxed and comfortable<br />
manner, from which an eye position is chosen<br />
(Fig. 3.3). This should allow effective scanning.<br />
23
SAMPLE COUNTS<br />
ii) <strong>The</strong> position of the inner rod a, is then selected.<br />
It should allow the observer’s line of sight to be<br />
clear of the wheel, but close to the aircraft body<br />
<strong>The</strong> lower window marker a´, is then so fixed<br />
that it falls in line with the eye position and the<br />
inner rod, a (Fig. 3.3).<br />
iii) Mark A is then placed on the ground, in line with<br />
the marker a’ and the inner rod. <strong>The</strong> height of<br />
the observer’s eye level from the ground, h, is<br />
measured. A second marker B, is then placed on<br />
the ground, the distance between A and B being<br />
denoted by w, and calculated as follows:-<br />
w = W.h/H<br />
Where W = required strip width<br />
H = required flying height<br />
iv) <strong>The</strong> outer rod is then placed at b, in line with<br />
point B. <strong>The</strong> observer, while maintaining his line<br />
of sight a´- a - A, makes a second mark b´ to<br />
establish a second line of b´ - b - B. If correctly<br />
positioned, the observers’ two lines of sight<br />
should be in line while he sits comfortably.<br />
Marks a´ and b´ ensure the observer’s eye<br />
position will be correct during flight, and must<br />
be kept in line with marks a and b.<br />
3.8 CALIBRATING THE STRIP<br />
WIDTH<br />
In order to ensure that the strip width set up as<br />
described above is correct, aerial calibration must be<br />
carried out. Markers are laid out on flat ground or an<br />
airstrip, at intervals of 20m. <strong>The</strong> aircraft then flies at<br />
the required height and makes passes, at right angles,<br />
to the markers. <strong>The</strong> observer(s) count and photograph<br />
the number of markers between the rods.<br />
<strong>The</strong> strip width is then calculated as follows:-<br />
Let<br />
h = average height of aircraft<br />
w = average strip width<br />
H = selected census flying height<br />
W = nominal strip width at H<br />
<strong>The</strong>n<br />
W=w.H/h<br />
If W is widely off the required strip width, the rods<br />
are repositioned, and another calibration flight carried<br />
out.<br />
24<br />
3.9 RANDOM TRANSECT SAMPLING<br />
After stratification, transects are selected at random,<br />
at right angles to a suitably chosen axis (Norton-<br />
Griffiths 1978). <strong>The</strong> number of transects selected<br />
should correspond to the desired sampling intensity.<br />
<strong>The</strong> transects are then drawn on the census area map.<br />
Data analysis is done separately for each stratum, and<br />
ultimately combined to give the total population<br />
estimate. If desired, data can be related to positions<br />
along the transect. This method has been extensively<br />
used to count elephants and gather data for other<br />
resources (Watson eta!. 1969a & b; Bell eta!. 1973)<br />
3.10 SYSTEMATIC TRANSECT<br />
SAMPLING<br />
This method is also referred to as systematic<br />
reconnaissance flight (SRF). <strong>The</strong> transects are spaced at<br />
the same interval repeatedly throughout the census zone.<br />
Each transect is divided into subunits of desired length,<br />
and during sampling, elephants are counted within the<br />
sampling strip of each subunit (see Section 3.7).<br />
This technique has been adapted by a Kenyan government<br />
department that carries out multispecies animal counting<br />
(Ottichillo et a!. 1985; Mbugua 1986). It is highly flexible,<br />
and can be modified according to objectives and<br />
constraints. In a census to establish the status of elephants<br />
in two game reserves and the surrounding areas,<br />
systematic reconnaissance flights were used (Mbugua<br />
1992). Due to time constraints which could not allow for<br />
an initial reconnaissance flight, elephants sighted outside<br />
the sampling strip were counted. <strong>The</strong> pilot deviated from<br />
the transect, and circled the groups until they were counted<br />
and photographed, and then resumed the flight path. Thus,<br />
total sample counts of the groups were obtained while<br />
ensuring a systematic search of the area. However, the<br />
transect and ‘group’ counts were analysed separately.<br />
3.11 FLIGHT PLANNING FOR<br />
TRANSECT SAMPLING<br />
As mentioned earlier, transects are flown in order, from<br />
one end of the census zone to the other. If the census<br />
zone is large, it must be broken into areas that can be<br />
covered in one census flight. <strong>The</strong>se areas must be well<br />
marked on the maps.
Animal movements within the zone at different times<br />
of the day must also be taken into consideration while<br />
flight planning.<br />
If more than two aircrafts are used, they should be assigned<br />
to different strata or parts of the census zone. Ideally, the<br />
flight should not exceed three hours to avoid fatigue of the<br />
flight crew.<br />
3.12 BLOCK SAMPLING<br />
In this method, blocks are the sampling units. <strong>The</strong>y are<br />
chosen by locating random points in space, and then<br />
counting those blocks in which a point falls. Alternatively,<br />
the whole census zone can be marked off in grids, and the<br />
necessary number for sampling selected randomly (Norton-<br />
Griffiths 1978). <strong>The</strong> block boundaries should be delineated<br />
by physical ground features. In this age of sophisticated<br />
technology, boundary definition and navigation can also<br />
be aided by high precision equipment.<br />
<strong>The</strong> observer must search the entire block, and count every<br />
elephant. To ensure this, and ascertain that no double<br />
counting occurs, the observer must keep track of the aircraft<br />
position by marking on the map the flight path, and the<br />
area covered (Fig. 3.4). Each group is counted and given<br />
an identifying number, and entered onto a data sheet. <strong>The</strong><br />
location of individuals or groups is also entered on the map.<br />
Photographs are also taken for later counting.<br />
<strong>The</strong> flight pattern can be spiral for difficult terrain, zig-zag<br />
for valley bottoms and ridges, or systematic. Of importance<br />
is that there must be some degree of overlap between the<br />
strips.<br />
Blocks are increasingly being used in counting elephants.<br />
<strong>The</strong>ir use is unsurpassed in areas where transect counts are<br />
impossible due to crew safety, e.g. in hilly country or in<br />
thick vegetation, and they have been used to check the<br />
accuracy of other counts (Thouless 1992).<br />
3.13 FLIGHT PLANNING FOR BLOCK<br />
SAMPLING<br />
<strong>The</strong> planning for block sampling is similar to that used in<br />
transect sampling. <strong>The</strong> blocks should be of a size that can<br />
be covered in a day’s flight (2.5-3 hours) or less. Smaller<br />
sized blocks have been used in test flights.<br />
Fig. 3.4. Block count using the zig-zag flight lines. <strong>The</strong> flight<br />
path is marked, and every group observed is given a<br />
number and plotted on the map. (Source: Norton-<br />
Griffiths 1978).<br />
3.14 DATA ANALYSIS<br />
Detailed explanations on analysing the data are given<br />
by Jolly (1969) and Norton-Griffiths (1978), and<br />
reference to basic statistical texts should be useful.<br />
If the sampling units (transects or blocks) are all of<br />
the same size, then Jolly’s Method I (1969) is used.<br />
<strong>The</strong> estimate is based on average number of animals<br />
in each unit, and the variance is calculated from the<br />
variance between number of animals in each unit.<br />
<strong>The</strong> results are worked out as follows:-<br />
SAMPLE COUNTS<br />
N = total number of units in population<br />
n = number of sampled units<br />
y = number of elephants counted in any one unit<br />
25
SAMPLE COUNTS<br />
y = sample mean =<br />
s 2 = sample variance (variance between<br />
y<br />
elephants counted in all units)<br />
= 1 {∑y 2 -(∑y) 2 } where ∑ is ‘the sum of’<br />
n-1 n<br />
<strong>The</strong>n population total Y = N.y<br />
26<br />
Population variance Var(Y) = N(N-n) . s 2<br />
y<br />
n<br />
Population standard error SE(Y) = √Var (Y)<br />
95% confidence limits of Y = t.SE (Y)<br />
t = n-1 degrees of freedom<br />
In some cases, particularly in transect sampling, the<br />
units will be of varying size. Jolly’s Method 11(1969)<br />
is specifically suited for these units since it eliminates<br />
the effect of difference in size of the sampling units. It<br />
is based on the calculation of the ratio between animals<br />
counted and the area searched, and the following must<br />
be known:<br />
N = total number of units from which<br />
sample was drawn<br />
n = number of units sampled<br />
Z = area of census zone<br />
z = area of each sample unit<br />
y = number of animals counted in each<br />
sample unit<br />
y<br />
n<br />
We first calculate R, which is an estimate of average<br />
density of elephants per unit area.<br />
Thus R = total animals counted<br />
total area searched<br />
= ∑y<br />
∑z<br />
<strong>The</strong>n Population total Y= R. Z<br />
To calculate the population variance, we must first<br />
establish the variance between animals in each unit,<br />
and the variance between areas of each unit. Finally,<br />
we must calculate the variance between the elephants<br />
counted in each unit, and the size of the same unit.<br />
Thus<br />
2 1) s variance between animals counted in all<br />
units<br />
= 1 {∑y2 - (∑y) 2 y<br />
}<br />
n-1 n<br />
2) s 2 = variance between the area of all sample<br />
y<br />
units<br />
= 1 {∑z 2 - (∑z) 2 }<br />
n-1 n<br />
3) s = covariance between animals counted and<br />
zy<br />
the area of each unit<br />
=1 {∑z.y-(∑z).(∑y)}<br />
n-i n<br />
Population variance<br />
= Var (Y)<br />
2 =N(N-n). (s -2.R.szy +R y<br />
2 2 .s ) z<br />
n<br />
Population standard error SE(Y) =√Var(Y)<br />
95% confidence limits of Y = +/-t. SE(Y)<br />
where t = n-1 degrees of freedom<br />
<strong>The</strong> same steps are followed for blocks, with N =<br />
numbers of blocks into which census zone was<br />
divided.<br />
<strong>The</strong>se formulae have been extracted from Norton-<br />
Griffiths (1978).<br />
3.15 CENSUS CREW AND EQUIPMENT<br />
<strong>The</strong> ideal crew should consist of a pilot, a Front Seat<br />
Observer (PSO) and two Rear Seat Observers (RSOs).<br />
In addition to helping in spotting elephants, the PSO<br />
calls out units, records survey time, speed and height,<br />
and habitat parameters if desired. <strong>The</strong> RSOs count and<br />
photograph the elephants. A crew of three; pilot, PSO<br />
and RSO can also be used, if the situation so warrants.<br />
Each member of the crew should be well trained and<br />
competent. Details of training can be found in Norton-<br />
Griffiths (1978) and in Distil et al. (1979).<br />
<strong>The</strong> main survey equipment should include good<br />
topographical maps, cameras and tape recorders. A<br />
50mm wide lens is recommended. <strong>The</strong> aircraft must be<br />
slow flying and high-winged to allow unobstructed<br />
ground view by the observers. For transect counts, it<br />
must have wing struts for attachment of rods.<br />
3.16 FLYING HEIGHT, SPEED AND<br />
STRIP WIDTH FOR SAMPLE<br />
COUNTING<br />
Various combinations of the above are used in<br />
transectsampling. Heights of between 9im and 122m, and
strip widths of 200m and 500m are recommended. <strong>The</strong>y<br />
should be varied for open and thickly vegetated<br />
country, i.e., narrower strip widths and low heights<br />
while surveying thickly vegetated areas, arid viceversa.<br />
<strong>The</strong> speed should be between 130km/hr and<br />
150km/hr.<br />
In block sampling, heights ranging between 152m<br />
and 213m should be used to facilitate spotting, with<br />
strips of between 1km and 1.5km on each side, again<br />
depending on vegetation. <strong>The</strong> aircraft can then fly<br />
low for the actual counting and photographing of the<br />
group(s).<br />
Flying height, speed and strip width all affect the<br />
observer’s ability to spot and count animals, thus<br />
introducing errors arid bias in the population<br />
estimate. An appropriate combination of height arid<br />
strip width should be decided upon depending on<br />
the nature of vegetation, elephant density and<br />
experience of observers.<br />
3.17 TRANSECTS OR BLOCKS?<br />
<strong>The</strong> transect count is superior to block count in terms<br />
of costs, navigation, fatigue and sampling error.<br />
However, transects are impossible to fly in difficult<br />
terrain, and may give unreliable results where<br />
vegetation is thick. Block sampling would be<br />
preferable in these situations. <strong>The</strong> choice of technique<br />
should be guided by the specific objectives of the<br />
count, and the prevailing circumstances.<br />
References<br />
BELL, R.H.V., GRIMSDELL, J.J.R. VAN LAVIEREN, LP. & SAYER, J.A.<br />
(1973) Census of the Kafue Iechwe by aerial stratified sampling. East<br />
<strong>African</strong> Wild life Journal 11, 55-74.<br />
CAMPBELL, R.C. (1967) Statistics For Biologists. Cambridge University<br />
Press. COCHRAN, W.G. (1963) Sampling Techniques. Wiley, London.<br />
DIRSCHL, H.J., NORTON-GRIFFTHS, M. & WETMORE, S.P. (1979)<br />
Training of aerial observer and pilots for counting animals. KREMU Technical<br />
Report 15.<br />
ILCA (1980) Bias. ILCA Monograph No.4s 177-180.<br />
SAMPLE COUNTS<br />
JOLLY, J.M. (1969) Sampling methods for aerial censuses of wildlife<br />
populations. East <strong>African</strong> Agriculture and Forestry Journal 34, 46-49.<br />
MBUGUA, S.W. (1986) Monitoring Livestock and Wildlife in Kenya. In<br />
Range Development and Research in Kenya (Eds. M. Richard, Hansen, M.<br />
Benson, Woie, & R Dennis Child).<br />
MBUGUA, S.W. (1992) A survey of the Nasolot/South Turkana and Kerio<br />
Valley/ Lake Kamnanrok <strong>Elephant</strong> Population. Typescript report.<br />
NORTON-GRIFFITHS, M. (1978) Counting Animals. Handbooks on<br />
techniques currently used in <strong>African</strong> wildlife ecology. No.1. (Ed.<br />
J.J.Grimsdell). AWLF, Nairobi.<br />
NORTON-GRIFFITHS, M. (1979) Unstratified systematic sampling:<br />
Rationale and method. In: Low-level Aerial Survey Techniques. ILCA<br />
Monograph No.4, 167-173.<br />
OTTICHILLO, W.K. & SINANGE, RK. (1985) Differences in the visual<br />
and photographic measurements in the estimation of strip widths far serial<br />
census of animal populations. KREMU Technical Report No.113.<br />
PENNYCUICK, C.J. & WESTERN. D. (1972) An investigation of some sources<br />
of bias in aerial transect sampling of large mammal populations. East <strong>African</strong><br />
wildlife Journal 10, 175-191.<br />
THOULESS, C. (1992) Experimental count of elephant in Samburu and Laikipia<br />
Districts. Kenya Wildlife Services. Typescript Report.<br />
WATSON, R.M. & TIPETT’, C.I. (1979) Examples of law-level aerial surveys<br />
conducted in Africa from 1969-1979: one firm’s experience. In: Low-Level Aerial<br />
Survey Techniques. ILCA Monograph No.4, 33-58.<br />
WATSON, RM.. PARKER, I.S.C. & ALLAN J. (1969a) A census of elephant<br />
and other large mammals in the Mkomazi region of northem Tanzania and<br />
southern Kenya. East <strong>African</strong> Wildlife Journal 7, 11-26<br />
WATSON, R.M., GRAHAM, A.D. & PARKER I.S.C. (1969b) A census of the<br />
large mammals of Loliondo Controlled Area, northern Tanzania, East <strong>African</strong><br />
Wildlife Journal 7, 43.60.<br />
27
4.1 INTRODUCTION<br />
Total counting of elephants has been adopted in<br />
many national parks, reserves and other parts of<br />
the elephants’ range in Africa. One of the reasons<br />
that total aerial counting of elephants wins favour<br />
is that elephants, being large animals, are relatively<br />
easy to spot and count compared to other animals.<br />
A review of the method and references to earlier<br />
work has been made by Norton-Griffiths (1978)<br />
which is recommended for further reading. Recent<br />
advances are given here.<br />
<strong>The</strong> aim of an elephant total aerial count is to scan<br />
the entire surface of a selected census area, and to<br />
record the position and number of each elephant or<br />
group of elephants. A total count is similar to the<br />
sample block counts described in Chapter 3, but in<br />
this case the blocks, when joined, cover the whole<br />
census zone.<br />
<strong>The</strong> flight lines should be designed with the<br />
intention of being able to spot all the elephant<br />
groups and individuals; there are a number of<br />
variations as to how this may be done.<br />
Errors can arise in failing to spot elephant groups,<br />
counting them inaccurately, or in double-counting<br />
the same groups. <strong>The</strong>se errors can be greatly<br />
reduced by training and careful attention to<br />
technique.<br />
<strong>The</strong> census zone should be divided into discrete<br />
counting blocks. By common practice these are<br />
usually defined by features such as roads, cut-lines,<br />
mountains, protected area boundaries or rivers.<br />
Rivers, however, are unsuitable as block boundaries<br />
because they tend to attract concentrations of<br />
elephants. A movement of elephants across the river<br />
while the count is going on could cause that group<br />
either to be double-counted, or to be missed<br />
altogether. It is better to use water-sheds as<br />
boundaries, as is done in the Kruger National Park<br />
28<br />
CHAPTER 4<br />
COUNTING ELEPHANTS FROMTHE AIR-TOTAL COUNTS<br />
Iain Douglas-Hamilton<br />
in South Africa,because elephants tend to be<br />
relatively sparsely distributed near them.<br />
A block should usually be of a size that can easily<br />
be covered by one aircraft in one flying day. In the<br />
case of Kenya’s Tsavo National Park, blocks vary<br />
in size from 500km 2 to 1,500km 2 , but the average<br />
size is 1,100km 2 . Each flight crew should be<br />
allocated one or more blocks to be counted per day<br />
and should be provided with flight maps of the<br />
blocks. In the Tsavo elephant count of 1994 flight<br />
crews on average spent 5.5 hours a day counting<br />
with another 1.3 hours flying to and from the block.<br />
Scanning rates on average were 210km 2 /hr<br />
(Douglas-Hamilton et al. 1994)<br />
<strong>The</strong>se days it is highly desirable to use a<br />
Geographical Positioning System (GPS) in the<br />
aircraft, both to assist in navigation and for<br />
recording waypoints (a waypoint is the location of<br />
an observation point along one’s line of flight). With<br />
a GPS block boundaries can be set conveniently<br />
using the Universal Transverse Mercator (UTM)<br />
kilometre grid on a north-south or east-west axis.<br />
This also makes the calculation of block areas easier.<br />
4.2 AIRCRAFT AND FLIGHT CREW<br />
4.2.1 Number and type of aircraft<br />
P.O. Box 54667<br />
Nairobi, Kenya<br />
<strong>The</strong> number of aircraft used depends on the size of<br />
the census zone and what is available in terms of<br />
aeroplanes, personnel, fuel, funds and time.<br />
Availability of resources may dictate whether one<br />
aircraft is used over an extended period or many<br />
aircrafts are used for a shorter period. For example,<br />
in the Kruger National Park elephant count of 1993<br />
two helicopters were used with two pilots<br />
alternating four days on and four days off.
<strong>The</strong> crew covered 20,000km 2 in three weeks. By<br />
contrast the Tsavo elephant count of 1994 used eight<br />
aeroplanes, each with a single pilot, flying for five<br />
days, and covered some 39,000km 2 .<br />
A helicopter is an ideal aircraft to use in carrying out<br />
aerial counts, as it affords observers superior visibility<br />
and it has the ability to hover while observers make<br />
an exact count of an elephant group. However, cost<br />
puts it beyond the reach of most protected area<br />
authorities. A single exception is the Kruger National<br />
Park where annual elephant counts have been<br />
conducted by helicopter since the mid 1960s, and<br />
the authorities have thus accumulated probably the<br />
most coherent total elephant count data set for any<br />
large area (Hall-Martin 1984; Whyte & Wood 1992).<br />
Fixed wing aircraft with high wings giving a clear<br />
downward field of view are also widely used and<br />
recommended. <strong>The</strong>se may be four-seaters, usually<br />
Cessnas (170s, 180s, 182s, 185s, 206s, 210s), or<br />
tandem two seaters such as Piper Supercubs or<br />
Huskies.<br />
For serious total counting it is essential for the aircraft<br />
to be equipped with a functional intercom. <strong>The</strong> noise<br />
levels in the plane make it impossible for crew<br />
members to communicate otherwise.<br />
4.2.2 Flight Crew<br />
Experience is of the greatest importance and it is<br />
generally thought that the quality of the crew affects<br />
the final number of elephants spotted and counted,<br />
although this has never been tested. <strong>The</strong> more local<br />
knowledge the pilot and observers possess the better.<br />
Observers need to be sharp-eyed and able to endure<br />
long hours in the plane, even in turbulent conditions,<br />
without airsickness.<br />
4.2.3 Routine and timings<br />
<strong>The</strong> aircraft should aim to enter the block and start<br />
scanning about one hour after dawn so that the<br />
shadows are not too long, as these make elephants<br />
difficult to spot and count. Ideally, counting should<br />
not be carried out in the heat of the day, when<br />
elephants tend to seek shade, since this increases the<br />
risk of failing to spot groups altogether or undercounting<br />
clumped groups. <strong>The</strong> hours of the “heat of<br />
the day” will obviously vary across the elephant range<br />
of Africa, and with season. On a cool day in the rainy<br />
season elephants may stay loosely dispersed and be<br />
much easier to spot and count all day long, but<br />
generally in most seasons there is a tendency for<br />
elephants to gravitate to shade from late morning to<br />
mid-afternoon. Counting should not be conducted too<br />
late either, once again to avoid long shadows. In<br />
practice, however, in the course of a major count of<br />
a big census area these niceties tend to be ignored.<br />
Pilots and crew may fly up to nine hours a day,<br />
stopping only for refueling.<br />
4.3 FLIGHT PATTERNS<br />
4.3.1 General<br />
A pilot must be able to navigate with skill. Classically,<br />
this has meant that a pilot must be able to use small<br />
landmarks to keep exact, track on a map of the<br />
aircraft’s flight path. With the invention of Global<br />
Positioning Systems (GPS) accurate navigation and<br />
recording of the position of observations has become<br />
much easier. From the moment that a block is entered<br />
the flight path can be recorded. <strong>The</strong> easiest way to<br />
do this is to switch on the logging facility of a<br />
recording GPS unit. A scale map of the exact route<br />
of the aircraft can then be printed out after the flight,<br />
with pre-digitized block boundaries and a 10km by<br />
10km UTM grid superimposed. This map is a great<br />
help in compiling block totals and subsequent<br />
analysis.<br />
If a GPS is not available the pilot and Front Seat<br />
Observer (PSO) are responsible for recording the<br />
flight path as best they can on a map, and recording<br />
the observations of animals on a check sheet as will<br />
be described below. <strong>The</strong> flight lines may vary<br />
according to the circumstances.<br />
4.3.2 Parallel lines<br />
TOTAL COUNTS<br />
Parallel lines set apart at intervals from 500m to 3km<br />
are the most commonly used flight pattern on total<br />
counts and they are particularly suitable for flat and<br />
relatively featureless land. <strong>The</strong>se lines may be drawn<br />
on a map before the flight is begun, which greatly<br />
facilitates the pilot’s task. <strong>The</strong> spacing of lines may<br />
be determined by several factors, such as the visibility<br />
of the elephants, itself a consequence of colour,<br />
contrast, vegetation cover, light and shade), the<br />
amount of flying hours available (ideally, flying hours<br />
should not be a limitation, but they often are in<br />
practice).<br />
29
TOTAL COUNTS<br />
<strong>The</strong>re are two errors associated with the spacing of<br />
parallel flight lines: the further apart the lines are,<br />
the greater the risk of failing to spot groups<br />
altogether; and the closer together the lines are, the<br />
greater the risk of counting the same group twice.<br />
As a rule of thumb a spacing of 1.5km has proved to<br />
be a realistic compromise for relatively open areas<br />
like the Tsavo National Park (see Fig. 4.1) or the<br />
Kruger National Park. In dense habitats such as the<br />
Addo National Park in South Africa or Lake Manyara<br />
National Park in Tanzania a spacing of 500m with<br />
Fig 4.1: Right paths for the 1994 Tsavo elephant<br />
30<br />
short flight lines of 10km to 15km has been used, in<br />
very open plains a separation of up to 3km may be<br />
justified. Short flight lines reduce the risk of double<br />
counting as the elephants do not have a chance to<br />
wander far between runs.<br />
In most cases east-west lines should be chosen, which<br />
have the advantage of equal light for the observers<br />
on both sides, but topography, wind direction or the<br />
shape of the block may make a north-south or other<br />
orientation preferable.
4.3.3 Variable lines<br />
A variable flight pattern adapted to drainage or<br />
topography is often used. <strong>The</strong> best known instance<br />
where the drainage lines are used to determine the flight<br />
pattern is in the annual elephant count in the Kruger<br />
National Park. A helicopter flies up and down each<br />
tributary scanning as far as the watershed of the next<br />
tributary. <strong>The</strong> advantage of the kruger method is that<br />
the pilot can navigate without having to look at a map<br />
or a GPS, which means that he can take part in the<br />
spotting.<br />
Lines may also be related to the shape of hills or<br />
mountains, where the slopes are so steep that they dictate<br />
a flight pattern that cannot ignore the contours. In this<br />
case the pilot will fly in and out of valleys in such a<br />
way that the observers have a chance to scan all the<br />
slopes that lie below them.<br />
4.3.4 Inward Spirals<br />
When a patch of thick vegetation, in which elephants<br />
maybe concealed, is found in the middle of relatively<br />
open country, an inward spiral flight pattern can be<br />
appropriate. In this case, the observers scan the inner<br />
side of the spiral and work inwards to the centre: <strong>The</strong><br />
advantage of this pattern is that it is easy for the pilot to<br />
maintain orientation and to remember where elephants<br />
have already been spotted.<br />
4.4 WHAT SHOULD BE COUNTED?<br />
Both live and dead elephants should be counted in an<br />
elephant count. Dead elephants give a great deal of<br />
information on the status of the population. In some<br />
cases it may be desirable to add in another species or<br />
two. For example, buffalos are often included as they<br />
have also have a clumped distribution like elephants<br />
and can be included without much extra effort. Rhinos<br />
are now so rare that any information on them should<br />
also be collected. It is a mistake, however, to try to<br />
include too many other species, as most of these are<br />
harder to see than elephants and will require a degree<br />
of extra effort that may detract from the efficiency of<br />
the elephant count.<br />
Dead elephants should be recorded in the following<br />
categories (Douglas-Hamilton & Hillman 1981):<br />
i) “Fresh”, in which the carcass still has flesh beneath<br />
the skin giving the body a rounded appearance,<br />
where vultures are probably present, and<br />
where the liquid pool of putrescent body fluids<br />
is still moist on the ground. This category<br />
applies to carcasses thought to be no more than<br />
three weeks old.<br />
ii) “Recent”, in which the carcass is less than one<br />
year old and may be distinguished by the<br />
presence of a rot patch around the body where<br />
the decomposition fluids have killed the<br />
vegetation; the skin is usually present and the<br />
bones are relatively unscattered, except in<br />
areas of high predator density.<br />
iii) “Old”, in which the carcass has usually<br />
decomposed to a skeleton, with bright white<br />
bones clearly visible, but where the rot patch<br />
has disappeared, or where the vegetation is<br />
beginning to regrow; the skin may still be<br />
present in arid areas, but will have disappeared<br />
in wetter zones. This category applies to<br />
elephants that have died more than one year<br />
previously.<br />
iv) “Very Old”, in which the bones are beginning<br />
to crack and turn grey; the skeletons from the<br />
air no longer stand out as distinct entities and<br />
are difficult to see; bones may exist in this<br />
form for ten years or more, but for the<br />
purposes of aerial survey almost all have<br />
vanished after seven years.<br />
Usually, the first and second categories, and the<br />
third and fourth are pooled in analysis and referred<br />
to as “Recent” and “Old”. <strong>The</strong> proportion of<br />
“Recent” in relation to the live population is an<br />
indicator of the previous year’s mortality.<br />
4.5 FLIGHT PROCEDURES<br />
TOTAL COUNTS<br />
<strong>The</strong> success of a count depends greatly on the<br />
degree of cooperation between the crew members.<br />
It is advisable to have one day of training and<br />
rehearsal before beginning serious counting. A<br />
great many errors can be removed by this practice.<br />
In any case, the count should begin with the least<br />
important blocks or those likely to have the fewest<br />
elephants, and work towards the high density<br />
blocks at the end.<br />
Each member of a flight crew has a specific role.<br />
<strong>The</strong> pilot must maintain the flight pattern and make<br />
sure that the ground is adequately covered.<br />
Common errors arise when a pilot turns back<br />
31
TOTAL COUNTS<br />
before the end of the block, or allows the flight line<br />
to wander away from the desired track. Speed and<br />
height are largely determined by the type of aircraft<br />
used but 130km/hr. and heights between 200ft and<br />
400ft. are suitable for most conditions of visibility<br />
and elephant density.<br />
When herds cannot be counted properly from the<br />
flight line the pilot should divert towards them and<br />
circle while the crew counts, and takes photographs,<br />
if necessary. If you have a helicopter there is no need<br />
to circle, you can hover while the crew counts. As<br />
mentioned earlier the most advanced helicopter<br />
counting is done in the Kruger National Park. Here,<br />
the helicopter, in a series of low passes, divides the<br />
herd into convenient units and counts them one by<br />
one until the whore herd is covered. In this case<br />
photography is unnecessary.<br />
Great care must be taken, however, to resume the<br />
original flight line at the spot at which it was broken<br />
off. This can be done by referring to ground features<br />
or using a GPS to check that you are back online.<br />
<strong>The</strong> pilot is also responsible for flying a 2-3km<br />
overlap into the adjacent block on each block<br />
boundary. <strong><strong>Elephant</strong>s</strong> on the edge of a block may cross<br />
over to another block, and either be missed by both<br />
crews or double counted. It is important, therefore,<br />
to note if they are walking in any particular direction,<br />
and to keep in touch with the neighbouring counting<br />
crew and advise them of likely crossovers on the<br />
radio. In any event, it is necessary to fly overlaps<br />
and compare results with the adjacent crew to decide<br />
in which block peripheral groups of elephants should<br />
be located for the purposes of data analysis.<br />
<strong>The</strong> pilot is responsible for all aspects of safety. He<br />
should be aware of power lines and other hazards,<br />
and should arrange with other pilots what radio<br />
frequencies are to be used and what search and rescue<br />
procedures will be followed in the event of an<br />
accident. Each pilot should keep in touch with the<br />
neighbouring crew when flying in the overlap areas<br />
of blocks, keep out of each other’s way, and liaise<br />
on elephant sightings in the areas commonly<br />
searched. <strong>The</strong> pilot may participate in the counting<br />
only in so far as he or she can comfortably do so,<br />
and this will depend on his or her experience. In many<br />
cases, the pilot’s vantage point can prove particularly<br />
useful in drawing the observers’ attention to animals<br />
coming up in the- plane’s flight path.<br />
For those aircraft equipped with a GPS the pilot<br />
should also make waypoint recordings of each<br />
observation. Such waypoints should be made<br />
32<br />
directly overhead the elephant group if possible.<br />
<strong>The</strong> Front Seat Observer (FSO) is responsible for<br />
recording observations and the corresponding<br />
waypoint on specially designed data-sheets. <strong>The</strong><br />
data-sheet includes columns for waypoint, species,<br />
estimate, film number, frames taken, revised<br />
photocount and comments (see Fig 4.2). All flight<br />
times should be recorded, including take-off, start<br />
of count, end of count, and landing. From these data<br />
the count intensity can be calculated, that is the<br />
square kilometres scanned per hour, or the hours<br />
taken to scan 1000km 2 (the average block size). <strong>The</strong><br />
total hours flown are important for calculating the<br />
cost of the count.<br />
If a GPS is unavailable, the position of the elephant<br />
group may be written directly on to a map at the<br />
time the observation is made. In this case the FSO<br />
must maintain a continuous record of the flight path<br />
including deviations and circling. It is difficult to<br />
do this with any real accuracy and the GPS<br />
recording is greatly preferable, but not to the extent<br />
that it should be considered that total counts are<br />
impossible without it.<br />
<strong>The</strong> Rear Seat Observer’s (RSO) role is to spot and<br />
count. Each RSO must scan his or her side of the<br />
plane and when an animal is spotted must call out<br />
clearly and loudly to the pilot and FSO indicating<br />
the species, the side of the aeroplane, and the range<br />
of the animals from the plane. He or she must also<br />
indicate if there is a need to circle in order to make<br />
a proper count. If a count can be made without<br />
circling, the RSO must call out the result, and the<br />
FSO must read it back so that each member of the<br />
crew can hear what has actually been recorded. This<br />
process helps to eliminate many errors in<br />
comprehension.<br />
If the herd is too large to count and needs to be<br />
photographed the RSO still needs to make an<br />
estimate and listen to the FSO’s read-back to make<br />
sure the FSO got the details right.<br />
RSO’s should make every effort not to call out their<br />
data at the same time as their fellow RSO is calling<br />
out his or hers. <strong>The</strong>y must commit their information<br />
to memory and call it out to the FSO at the earliest<br />
possible opportunity or when requested by the FSO.<br />
<strong>The</strong> dialogue might go something like this:<br />
RSO: “<strong><strong>Elephant</strong>s</strong> left, 300 metres estimate 12”<br />
Pilot: “That is waypoint 22.”
Fig 4.2: Parts of a data sheet used in the 1994 Tsavo elephant count.<br />
FSO read back: “<strong><strong>Elephant</strong>s</strong> left, 300, 12 in<br />
number, waypoint 22.”<br />
Or<br />
RSO: “<strong><strong>Elephant</strong>s</strong> right, 4 o’clock, about 20,<br />
please circle”<br />
Pilot: “OK”, then later, “I have them in<br />
sight, coming up on the right as waypoint 23”<br />
<strong>The</strong> pilot must fly as close as possible over the<br />
elephants, tipping the wing down so that the<br />
appropriate RSO is able to get a clear view and<br />
make a good count. When he comes overhead of<br />
the elephants the pilot should wait for two to three<br />
seconds and then press the waypoint toggle on the<br />
GPS to record the exact position. <strong>The</strong> delay is<br />
necessary so that the GPS has time to catch up<br />
with the actual position<br />
RSO: “Count 28”<br />
FSO reads back: “<strong><strong>Elephant</strong>s</strong>, overhead, 28,<br />
waypoint 23”.<br />
<strong>The</strong>se are the data which are recorded on the<br />
datasheet.<br />
4.6 COMPLEX HERDS<br />
TOTAL COUNTS<br />
Most errors arise from spotting and counting complex<br />
herds. <strong>The</strong> greater the density of elephants the greater<br />
the likelihood of confusion. It is well known that<br />
when one group of elephants is spotted and the pilot<br />
leaves the pre-planned flight path to count it, other<br />
groups tend to come into view. Very often one group<br />
will lead to another and another, until so many groups<br />
in close proximity have been counted that it becomes<br />
confusing to remember exactly which has been<br />
counted and which has not. This can lead both to<br />
double counting of the same group or to omitting a<br />
group that is in plain view because the crew thinks<br />
erroneously it has already been counted!<br />
<strong>The</strong>re are several ways to minimize these errors.<br />
Firstly the pilot and FSO must keep a clear head<br />
33
TOTAL COUNTS<br />
on what has been counted and what has not. It is<br />
best not to wander so far from the current flight line<br />
that you cross the path of the next flight line.<br />
Secondly, before tackling a complex group it is<br />
essential that the pilot and FSO should make a<br />
systematic plan of attack. <strong>The</strong> best way to do this is<br />
to climb up until all the elephant groups can clearly<br />
be located below you and take time to work out the<br />
order in which they are to be counted. Sometimes it<br />
is possible to allocate specific herds to be counted<br />
by individual crew members. It is vital that the order<br />
of counting be adhered to and that the RSOs do not<br />
to interrupt each other when reading out their<br />
individual counts. <strong>The</strong> RSO, therefore, should make<br />
his or her count and then listen and wait until he or<br />
she can get the full attention of the FSO. It is also<br />
vital that the FSO should give a clear read back of<br />
what he or she has written on the data-sheet.<br />
Errors in counting complex herds are most likely to<br />
occur with inexperienced crews, thus it is better to<br />
leave blocks with heavy concentrations of elephants<br />
to experienced crews. Another possibility is to send<br />
a helicopter if one is available, once the fixed-wing<br />
aircraft have identified the locations of the heavy<br />
concentrations. <strong>The</strong> helicopter, by hovering, allows<br />
observers to take their time in counting very complex<br />
aggregations of elephants.<br />
4.7 PHOTOGRAPHY<br />
When elephants are in a group too numerous to count<br />
easily, which may be anything in excess of 25, they<br />
should be photographed, provided the country is open<br />
enough to offer an unobstructed view. For large groups<br />
in the open, photography significantly improves the<br />
accuracy of counting. However, if there is a great deal<br />
of cover, photography of large herds may not make<br />
counting easier, since a significant fraction of the herd<br />
will be obscured by canopy at any one time.<br />
<strong>The</strong> pilot and FSO must coordinate closely to decide<br />
the best possible alignment for taking the photographs.<br />
<strong>The</strong> FSO will then record the waypoint on the GPS or<br />
flight map, and the waypoint number, species, film<br />
number, number of frames shot, end frame number and<br />
an estimate of herd size onto the data sheet. Fig. 4.3,<br />
after Norton-Griffiths (1978) is a model of how to make<br />
the photographs overlap properly.<br />
It is imperative that an estimate be made of the<br />
number of elephants, in the quite possible event that<br />
the films are destroyed or the camera is<br />
34<br />
malfunctioning, or the shots do not cover the whole<br />
the group.<br />
A blank should be shot into the lens cap or the<br />
photographer’s hand in between different herds or<br />
between different series of shots of one herd to allow<br />
for accurate separation in the final photographic<br />
analysis.<br />
Make sure that all your films are properly labelled.<br />
Films should be numbered in advance. <strong>The</strong> individual<br />
film number should be scratched into the emulsion<br />
on the film leader - check to make certain before you<br />
put the film in the camera.<br />
Generally, the best angle for photography is slightly<br />
oblique, but not too oblique, as young animals may<br />
be obscured by larger ones. Do not take pictures from<br />
far away or too high, as the images of the elephants<br />
may be too small to count. If the first run of<br />
photographs is unsuccessful, this fact should be<br />
recorded on the data-sheet, and further runs should<br />
be attempted until a satisfactory result is achieved.<br />
Camera speeds should 1/500th. of a second or above.<br />
Anything less will be too blurred and useless. It is<br />
essential, therefore, to use film with a speed of not<br />
less than 400A5A. Make certain that the focus is set<br />
to infinity. It is often a good idea to tape it secure for<br />
the duration of the count. You may use a 50mm or<br />
55mm lens but a 105mm or 135mm lens is preferable.<br />
Ideally, a medium range zoom lens, say 70mm to<br />
200mm zoom should be used when available.<br />
In general, aerial count photography is a skill which<br />
needs considerable training if it is to be performed<br />
to an adequate standard, and observers and pilots<br />
should be well prepared before beginning a serious<br />
count.<br />
4.8 EXPERIMENTAL BLOCKS<br />
<strong>The</strong> accuracy of a total count and bias in the method<br />
can be assessed in experimental blocks. One approach<br />
is to census a number of plots within the census zone<br />
at an intensity high enough that the crew is confident<br />
that no elephant groups are missed. <strong>The</strong>se results can<br />
be compared with the results from the same areas<br />
searched by other crews at the normal intensity to<br />
measure if there is any significant bias related to<br />
searching intensity.<br />
Another method is to send several crews into a<br />
counting block in succession and to measure the
c accuracy of the count by comparing their totals.<br />
This will allow herd by herd comparisons to be made,<br />
from which the number of groups or individual<br />
elephants missed by each crew can be estimated. In<br />
the case of the Tsavo 1994 elephant count, the average<br />
bias towards undercounting was 15%.<br />
Finally, if there is a long series of sample counts made<br />
TOTAL COUNTS<br />
Fig 4.3: When photographing a large herd the pilot must make a straight line pass along it. He must not circle, a) Wrong<br />
flight path. Some areas have been missed and it will be impossible to work out areas of overlap. b) Correct flight<br />
path. No areas are missed and overlap can be worked out (after Norton Griffins 1978).<br />
in the same area, a comparison can be made of the<br />
sample and total count elephant estimates. <strong>The</strong><br />
sample count which scans and counts a much<br />
narrower strip usually returns a higher elephant<br />
density and hence a larger estimate which may give<br />
an indication of the order of the bias in the total count.<br />
However, this will not work if the sample count has<br />
high confidence limits, which is usually the case.<br />
35
TOTAL COUNTS<br />
4.9 POST-FLIGHT PROCEDURES<br />
4.9.1 Ground support activities<br />
Flying, spotting, counting and recording on an elephant<br />
count are arduous activities and take a toll on the flight<br />
crew, especially if the pace is maintained day after day.<br />
It is advisable, therefore, to have an efficient ground<br />
crew to take care of routine activities such as refueling,<br />
transport to and from the airstrip, accommodation and<br />
meals. All should be arranged to ensure the minimum<br />
extra burden on flight crews so that they can concentrate<br />
their energies on the job in hand.<br />
<strong>The</strong> ground crew should also download GPS data<br />
on to computers; make print-outs of flight lines and<br />
waypoint records of observations; collect datasheets,<br />
fair copy maps and used films, checking that<br />
none is missing; and sort and compile data by crew,<br />
day and block.<br />
Clear and legible recording is not always possible<br />
while flying. <strong>The</strong>refore, after each day’s flying the<br />
FSO should set aside an hour or so for finalising the<br />
day’s data collection. <strong>The</strong> original data sheets and<br />
flight maps must be tidied up so that they are legible<br />
by anyone attempting to read them.<br />
After verifying the original flight data, the FSO<br />
should take a clean map and plot onto it each group<br />
by species and number of individuals (or estimated<br />
number of individuals). Ideally, this map should be<br />
printed out from the GPS data with the flight path<br />
and numbered waypoints clearly displayed. <strong>The</strong> FSO<br />
then only needs to attach the species data to each<br />
waypoint.<br />
A simple code or colour highlighting can be used to<br />
distinguish species. For example, in the Tsavo counts<br />
the convention used is a number enclosed in a circle<br />
for elephants, a square for buffalo, a cross for a dead<br />
elephant and a cross within a circle for a recently<br />
dead elephant.<br />
It is vital that these debriefing activities should be<br />
performed the same day the data is collected while<br />
the mind is still fresh with the day’s images.<br />
After printing out the location of elephant groups block<br />
by block, it is necessary to go through the records very<br />
carefully to eliminate double counts. With the GPS this<br />
becomes very easy. Even without computers and GPS<br />
systems the data can be summarised by hand, as in all<br />
the early counts in Tsavo and in Kruger, where<br />
36<br />
records go back for decades.<br />
For those observations where a waypoint was<br />
recorded for elephants, offset by a distance from the<br />
observers that has been recorded on the datasheet. a<br />
computer correction can be made based on a simple<br />
algorithm. This correction can then transpose the<br />
waypoint to its proper position.<br />
4.9.2 Analysis<br />
If the data have been compiled using the above<br />
instructions, they will form a permanent record for<br />
future workers. Check sheets need to be copied to<br />
spreadsheets, and data on each species can be<br />
compiled block by block. With the advent of<br />
Geographical Information System (GIS), the GPS<br />
waypoint data can be combined with the species data<br />
on spreadsheets to form a GIS database of<br />
observations.<br />
This system greatly enhances the scope for<br />
geographical analysis in relation to other features<br />
digitised into the database. For example, elephant<br />
numbers and densities could be plotted out and<br />
summarized on grid squares of any size by counting<br />
block or any other area unit. <strong>Elephant</strong> distributions<br />
could also be related to features such as protected<br />
status, habitat, land-use, human population density,<br />
or proximity from features such as roads or rivers.<br />
<strong>The</strong> usual practice is to summarise results by counting<br />
blocks, which reveals any large change in<br />
distribution, or trends from year to year.<br />
Corrections to the data can be calculated from the<br />
experimental blocks. <strong>The</strong> degree of undercount can<br />
be assessed from three separate sources:<br />
i) Repeat total counts of the same blocks at<br />
different scanning intensities: the difference<br />
between the block scanned at normal<br />
intensity and that scanned at high intensity<br />
gives the undercount.<br />
ii) Serial total counts made by several aircraft<br />
in the same block: the difference between<br />
the number counted by all crews gives the<br />
undercount.<br />
iii) Comparisons of total count and sample<br />
count data, if made over a long period: the<br />
sample count scanned at a higher intensity<br />
will return a higher figure and the<br />
difference again gives the undercount.
Dead elephants may be used as an indicator of relative<br />
mortality, both over the previous 12 months and for<br />
longer periods. It is thought that only between one<br />
in three and one in five dead elephants are actually<br />
seen, so actual mortality rates cannot be calculated<br />
in relation to the elephant estimate. However, the<br />
number of “recent dead” is a sensitive indicator of<br />
annual mortality which will vary in any given area<br />
from year to year. <strong>The</strong> “carcass ratio” is also a useful<br />
indicator of mortality over time or between areas. It<br />
is calculated as all dead divided by dead plus live.<br />
This has been found to vary greatly between areas<br />
and has been used as an index of the relative effect<br />
of poaching or other causes of mortality (Dublin &<br />
Douglas-Hamilton 1987; Douglas-Hamilton &<br />
Burrill 1991).<br />
4.9.3 Scanning intensity<br />
Scanning intensity can conveniently be measured as<br />
km 2 searched per hour, or minutes taken to scan<br />
10km 2 . <strong>The</strong> average for many counts is 250km 2 per<br />
hour (Norton-Griffiths 1978). Work in progress<br />
relates spotting and counting success to scanning<br />
intensity. <strong>The</strong>se results can be used to apply<br />
correction factors to old counts where the scanning<br />
intensity or flight path was recorded. <strong>The</strong>refore, it is<br />
an important parameter to record and present so that<br />
results can be compared with later counts.<br />
4.9.4Report Writing<br />
<strong>The</strong> report should present the results in a way that<br />
is of maximum use to park planners or future<br />
researchers who may want to use them as base line<br />
data.<br />
References<br />
TOTAL COUNTS<br />
DOUGLAS-HAMILTON, I. & BURRILL, A. (1991) Using elephant<br />
carcass ratios to determine trends In: Proceedings of the International<br />
Symposium on <strong>African</strong> Wildlife: Research and Management.<br />
DOUGALS-HAMILTON I.. GACHAGO. S., LITOROH, M. & MIRANGI,<br />
J. (1994)<br />
Tsavo <strong>Elephant</strong> count. Kenya Wildlife Service Typescript report<br />
DOUGLAS-HAMILTON, I. & HILLMAN, A. (1981) <strong>Elephant</strong> carcasses<br />
and skeletons as indicators of population trends in low-level aerial survey<br />
technique. ILCA Monograph.<br />
DUBLIN, H.T. & DOUGLAS-HAMILTON, I. (1987) Status and trends<br />
of elephants in the Serengeti-Mara ecosystem <strong>African</strong> Journal of Ecology<br />
25, 19-23. HALL-MARTIN, A. (1980) <strong>Elephant</strong> Survivors Oryx 15(4),<br />
355-362.<br />
HALL-MARTIN, A.J. (1984) Conservation and management of elephants<br />
in the Kruger National Park, South Africa. the Status and Conservation<br />
of Africa’s <strong><strong>Elephant</strong>s</strong>. Gland, IUCN. 104-118.<br />
NORTON-GRIFFITHS, M. (1978) Counting Animals. Handbook on<br />
techniques currently used in <strong>African</strong> Wildlife Biology No.1. (Ed. JI.<br />
Grindell) AWLF, Nairobi.<br />
WHYTE I.J. and WOOD, CA. (1992) Census results for elephant and<br />
buffalo in the Kruger National Park in 1991 and culling quotas for the<br />
1991/92 culling year. South <strong>African</strong> National Parka Board.<br />
37
5.1 INTRODUCTION<br />
Dung counts are the most common type of indirect<br />
census method for counting elephants. Since the early<br />
1980s, as interest quickened in the status of elephants<br />
in the forests of west and central Africa, more and more<br />
dung counts have been conducted. In the late 1980s<br />
researchers in India and then in south-east Asia turned<br />
to dung counts for estimating the numbers of Asian<br />
elephants, Elephas maximus. <strong>The</strong> proliferation of forest<br />
elephant surveys on both continents has stimulated the<br />
rapid evolution of dung survey techniques. In this<br />
chapter general methods of censusing elephants by<br />
dung counts will be described. <strong>The</strong>se methods have<br />
been described previously by Barnes and Jensen<br />
(1987), Dawson and Dekker (1992), and Barnes<br />
(1993). You should read Norton-Griffiths (1978) as a<br />
general introduction to animal census work. You are<br />
also strongly urged to consult Burnham et al. (1980)<br />
and Buckland et al. (1993) for the details of the line<br />
transect technique.<br />
Many of the concepts involved in dung counts are similar<br />
to those already described in the preceding chapters on<br />
aerial surveys, i.e. one goes through the same stages of<br />
stratification, arranging the layout of transects within<br />
each stratum, collecting the data on the transects, and<br />
then analysing the data. However, with dung counts one<br />
then has the further problem of converting estimates of<br />
dung-pile numbers into estimates of elephant numbers.<br />
A major difference between direct counts of elephants<br />
and dung counts is that the methods for direct counts<br />
have been worked out and standardised, and the<br />
improvements now consist of fine-tuning. On the other<br />
hand, the general methods of dung counts are still<br />
evolving. This presents you, the practitioner, with a<br />
challenge: you may have the opportunity to improve<br />
dung-counting methods yourself.<br />
38<br />
CHAPTER 5<br />
ESTIMATING FOREST ELEPHANT ABUNDANCE BY DUNG COUNTS<br />
5.2 PRELIMINARY COMMENTS<br />
A dung survey can be used in two ways. First, one may<br />
use dung as an index of elephant abundance or relative<br />
distribution. This can provide a considerable amount<br />
of valuable information about the biology of elephants<br />
in your study area (e.g. Barnes et al. 1991). For many<br />
purposes you do not need an estimate of the actual<br />
number of elephants; an estimate of the number of dungpiles,<br />
the relative distribution of dung-piles, or changes<br />
in the number of dung-piles over a period of years will<br />
give you all the information you need to manage your<br />
study area.<br />
<strong>The</strong> second option is to translate the dung data into numbers<br />
of elephants. To do this will require considerably more<br />
time and effort.<br />
To obtain an estimate of elephant numbers you will have<br />
to go through four stages:<br />
i) Estimate the numbers of dung-piles, or the density of<br />
dung-piles per km 2 .<br />
ii) Estimate the defaecation rate of elephants.<br />
iii) Estimate the mean rate of dung decay.<br />
Richard Barnes<br />
Department of Biology 0116<br />
University of California, San Diego<br />
La Jolla CA 92093-0116<br />
USA.<br />
iv) Combine the above three estimates to give you an<br />
estimate of elephant numbers or the density of<br />
elephants per km 2 .<br />
Few wildlife officers possess the range of skills required<br />
to conduct a dung count from beginning to end. If you<br />
are competent in the field but lack experience of statistics<br />
and computers, then it may be wise to find a statistician/<br />
data analyst to collaborate with you. You may find<br />
such a person at the nearest university, or possibly at a
esearch institute. Agricultural stations often have<br />
statisticians who may be interested in your problems.<br />
Failing that, you can write to the Assistant Director<br />
for <strong>African</strong> Programs, NYZS, <strong>The</strong> Wildlife<br />
Conservation Society, Bronx Zoo, New York 10460,<br />
U.S.A. or the Chair of the <strong>African</strong> <strong>Elephant</strong> <strong>Specialist</strong><br />
<strong>Group</strong>, P.O. Box 62440, Nairobi, Kenya. <strong>The</strong>se people<br />
will be able to put you in contact with a collaborator<br />
who can help.<br />
5.3 RECONNAISSANCE<br />
Having decided to conduct a survey, there is a great<br />
temptation to leap in and begin collecting data at once.<br />
However, it is essential to make a reconnaissance or<br />
preliminary investigation first, and then plan the<br />
survey carefully. <strong>The</strong> reconnaissance will show you<br />
how elephants are distributed within your study area,<br />
and therefore how it should be stratified. It will also<br />
reveal the logistical and practical problems you are<br />
likely to face. During the reconnaissance you should<br />
visit each of the major vegetation types in the census<br />
zone. You should also examine the major geographical<br />
features (rivers, valleys, roads, villages, mountains,<br />
etc.) as these will all affect your planning of the<br />
census. All your reconnaissance work will, of course,<br />
be conducted on foot. Use a pedometer to give an<br />
approximate measure of distance walked. To obtain<br />
a rough index of dung-pile density in each area, record<br />
all the droppings you see in a one-metre band on either<br />
side of you. This will enable you to gauge the relative<br />
abundance of elephants in different parts of your<br />
census zone.<br />
<strong>The</strong> importance of a reconnaissance before you plan<br />
the census cannot be over-emphasised. A<br />
reconnaissance can save you an immense amount of<br />
wasted effort later. If you are new to a forest, then as<br />
a rule of thumb, you should spend not less than 10%<br />
of the time allocated for the whole census in<br />
conducting the reconnaissance.<br />
<strong>The</strong> reconnaissance should be followed by several<br />
days at your desk when you plan the stratification,<br />
layout of transects, and the organisation of personnel,<br />
equipment and logistics. <strong>The</strong>n, having satisfied<br />
yourself that these plans fit within the limits of your<br />
budget, you can set off to cut the first transect.<br />
5.4 STRATIFICATION<br />
It is rare for elephants to be evenly distributed<br />
across a study area. One usually finds that dung-<br />
piles are more abundant in a particular vegetation type<br />
(e.g. secondary forest) and sparsely distributed<br />
elsewhere, and the reconnaissance will give you an<br />
idea of this. <strong>The</strong>se variations in density across the<br />
study area will result in a large variance and therefore<br />
wide confidence limits for your final estimate. <strong>The</strong><br />
variance can be reduced considerably by dividing the<br />
study area into strata. Each stratum is a sub-division<br />
of the study area m which the dung-pile density is<br />
more or less homogeneous. Thus one might divide a<br />
forest into three strata: one where dung-pile densities<br />
are low because of human disturbance, then a medium<br />
density stratum, and finally a stratum of mixed<br />
primary and secondary forest with no human activity<br />
and a high dung-pile density.<br />
Human activities are often more important than<br />
vegetation in determining elephant distribution, even<br />
m fairly small or sparsely inhabited forests (e.g.<br />
Butynski 1986; Barnes et al. 1991). Every forest is<br />
different, and the most appropriate form of<br />
stratification will depend upon the size and shape of<br />
the forest, the original vegetation, the history of<br />
human activity, and the present relationship between<br />
humans and elephants. This is why it is so important<br />
to get to know your forest before planning the census.<br />
5.5 ESTIMATING THE DENSITY OF<br />
DUNG-P I LES<br />
5.5.1 Distribution of transects<br />
TOTAL COUNTS<br />
<strong>The</strong> distribution of transects, both between strata and<br />
within strata, can have a marked effect upon the<br />
accuracy of your estimate and the width of its<br />
confidence limits.<br />
How should the transects be arranged? Norton-<br />
Griffiths (1978) gives a good discussion on the layout<br />
of transects. Transects may be laid out randomly or<br />
in a regular pattern. For example, in each stratum you<br />
draw a base-line running along the longest axis of<br />
the stratum. <strong>The</strong>n the transects are placed at random<br />
intervals along the base-line (use a random number<br />
table which is a published list of randomly selected<br />
numbers to decide where each transect should go),<br />
lying perpendicular to the base-line. Another option<br />
is to have the transects at regular intervals along the<br />
base-line. In that case the starting point of the first<br />
transect should be determined with a random number<br />
table.<br />
39
DUNG COUNTS<br />
From the point of view of statistical efficiency, it is<br />
preferable to have many short transects rather than a<br />
few long ones (Norton-Griffiths 1978). Thus, if you<br />
have enough money to cut 100km of transect, it<br />
would be better to have 20 transects of 5km rather<br />
than 10 transects of 10km. But, in forest one is often<br />
constrained by logistical considerations. Moving<br />
from the end of one transect to the beginning of the<br />
next can be expensive, especially when the transects<br />
are distributed across a huge area. One needs to<br />
minimise the ratio of “dead time” when travelling<br />
between transects and not collecting data, to working<br />
time when one is collecting data on transects (Barnes<br />
& Jensen 1987). Logistics may, therefore, demand<br />
that you have a few long transects. An alternative is<br />
to place transects end to end in a zig-zag pattern (Fig.<br />
5.1). <strong>The</strong>n each leg of the zig-zag is considered to be<br />
a separate transect. <strong>The</strong> starting point of the first leg<br />
should be determined using a random number table.<br />
Fig. 5.1: <strong>The</strong> zig-zag pattern for laying out transects. Each<br />
leg of the zig-zag is treated as a separate transect.<br />
How many transects should there be in each stratum?<br />
<strong>The</strong> number of transects should be proportional to<br />
the variance to be expected in each stratum. If you<br />
have not previously conducted a survey in that area<br />
you cannot know the expected variance. But variance<br />
is usually proportional to density. Thus you can<br />
allocate transects in proportion to the approximate<br />
density revealed by the reconnaissance. For example,<br />
imagine that you have enough money for 50 transects<br />
and that you have divided your study area into three<br />
strata. <strong>The</strong> reconnaissance showed that the ratio of<br />
dung-pile densities was 1:2:4 in the low, medium,<br />
and high density strata respectively. <strong>The</strong>refore the<br />
ratio of transects should be 7:14:28 in the three strata.<br />
How long should each transect be? Simulations using<br />
data from north-east. Gabon showed that the<br />
optimum transect length was 5km for that stratum<br />
(Barnes et al. 1988). Until you have some data from<br />
your own study area, you can use this figure as a<br />
rule of thumb.<br />
Having worked out the number of transects in each<br />
stratum, and the length of each transect, you should<br />
use the results from the reconnaissance to calculate<br />
approximately how many dung-piles you are likely<br />
to record in each stratum. A minimum of 60 to 80<br />
40<br />
dung-piles in each stratum is recommended<br />
(Buckland et al. 1993). You might have to adjust the<br />
numbers or lengths of transects to ensure that you<br />
achieve at least the minimum number of dung-piles<br />
in the medium and high density strata. My experience<br />
is that you are never likely to find 60 dung-piles in a<br />
low density stratum.<br />
5.5.2 Permanent versus temporary<br />
transects<br />
<strong>The</strong> earliest dung-counters used permanent transects<br />
to which they returned at regular intervals to record<br />
the disappearance of old dung piles and the deposition<br />
of new ones (Wing & Buss 1970; Jachmann & Bell<br />
1979 & 1984; Short 1983; Merz 1986). This lays one<br />
open to the criticism that elephants like to walk down<br />
paths, such as permanent transects, leaving a higher<br />
dung-pile density on transects than in the surrounding<br />
forest. In order to overcome this problem, and also<br />
because it is not feasible to revisit transects in the<br />
vast equatorial forests, Barnes and Jensen (1987)<br />
adopted a different approach. One assumes that the<br />
forest is in a steady state. That is, no elephants move<br />
in or out of the study area, and the rates of dung<br />
deposition and decay have remained constant for a<br />
long period before the census and also while the<br />
census is taking place. This means of course that you<br />
should do your dung counts either in the wet season<br />
or the dry, but not both, nor during the transition<br />
period between seasons (Barnes & Jensen 1987).<br />
<strong>The</strong>n, one need pass only once down the transect<br />
(“one-off” transects). We found that in the central<br />
<strong>African</strong> forests it was most practical for the observers<br />
to follow immediately behind the labourers cutting<br />
the transect. <strong>The</strong>n there is no possibility of bias caused<br />
by elephants defaecating on the transect between the<br />
passage of the cutters and the observers.<br />
If you are unhappy with the steady state assumption,<br />
then Hiby and Lovell (1991) provide an alternative<br />
method. <strong>The</strong>ir mathematical model was designed<br />
specifically to avoid making this assumption.<br />
5.5.3 Cutting the transect<br />
Draw the base-line and transects onto a map in pencil.<br />
<strong>The</strong>n use the north-point of the map to calculate the<br />
bearing of each transect. Remember to take into<br />
account magnetic deviation, which is the difference<br />
between grid north (north shown on your map) and<br />
magnetic north (shown by your compass). This can
sometimes be about eight degrees. It is usually iven<br />
on the map’s margin. <strong>The</strong>n set your compass to show<br />
the bearing.<br />
You will need to employ labourers to cut the transect<br />
for you. <strong>The</strong>y should carry sighting poles (paint them<br />
white or red so they stand out in the forest gloom) to<br />
ensure that they cut a straight transect. <strong>The</strong> man<br />
wielding the panga/cutlass should be replaced every<br />
hour, otherwise he will tire and the transect will<br />
proceed slowly.<br />
Do not cut a wide swathe through the forest. All you<br />
need is a straight path just wide enough for you to<br />
pass down. As you walk down the transect you scan<br />
the undergrowth on each side for elephant droppings.<br />
5.5.4 Line transects<br />
Strip transects are transects with a pre-determined fixed<br />
width, such as the type used in aerial surveys (see<br />
Chapter 3). Strip transects are not usually appropriate<br />
for dung counts in forest. This is because visibility (i.e.<br />
the probability of seeing a dung-pile) declines very<br />
rapidly with distance from the observer. Thus, in many<br />
forests the undergrowth is so thick that 50% of all dungpiles<br />
at a distance of two metres are missed by an<br />
observer (Fig. 5.2). Clearly, if you used transects<br />
DISTANCE (METERS)<br />
FROM CENTRE-LINE OF TRANSECT<br />
DUNG COUNTS<br />
that were, say, five metres wide you would miss a<br />
high proportion of the dung-piles lying within the<br />
transect. You could make the transect very narrow,<br />
perhaps one metre on either side of the observer,<br />
but that brings the disadvantage that only a small<br />
number of droppings would fall within the limits of<br />
your transect. <strong>The</strong>n your census would produce an<br />
estimate with wide confidence limits.<br />
Under these conditions the most appropriate method<br />
is the line transect technique. This technique is based<br />
upon the fact that the probability of detection by an<br />
observer declines with the object’s distance from the<br />
observer. With an adequate sample of measurements<br />
of the distance between the detected objects and the<br />
centre-line, mathematical techniques can be used to<br />
model the detection function and then estimate the<br />
density of objects.<br />
Comparisons made by Burnham et al. (1985) between<br />
line and strip transects showed that line transects<br />
produced estimates that were both more accurate and<br />
had lower standard errors (i.e., narrower confidence<br />
limits) than strip transects. During the last two decades<br />
a considerable amount of effort has gone into perfecting<br />
the line transect method of censusing. A seminal<br />
work was the monograph by Burnham et al. (1980)<br />
which formed the basis for much of the field work<br />
Fig. 5.2: An illustration of the numbers of dung-piles seen on either side by an observer as he or she proceeds down the centreline<br />
of the transect. <strong>The</strong> horizontal axis represents the distance to the left or right of the centre-line of the transect. <strong>The</strong><br />
vertical axis represents the number of dung-piles found in each distance class (0.00-0.49 metres, 0.50-0.99 metres,<br />
1.00-1.49 metres, etc) to the left or right of the centre-line. Data from N.E. Gabon.<br />
41
DUNG COUNTS<br />
done on forest elephants in the 1980s. This has now<br />
been superseded by the volume by Buckland et al.<br />
(1993) which describes the recent developments in<br />
the science of line transect surveying and in which<br />
you will find references to all the relevant literature.<br />
A concise summary of line transects is provided by<br />
Krebs (1989.)<br />
When doing a line transect census for dung-piles,<br />
the observer walks slowly down the centre-line of<br />
the transect. <strong>The</strong> perpendicular distance (x) of each<br />
dung-pile from the centre-line is measured with a<br />
good quality measuring tape (Fig. 5.3). You will find<br />
that you will record all droppings that fall on the<br />
transect centre-line or very close to it. But the further<br />
the droppings from the centre-line, the lower the<br />
likelihood of their being seen (Fig. 5.2).<br />
Very great care must be taken in measuring the<br />
perpendicular distances. Sometimes droppings lying<br />
close to the centre-line are recorded as on the centre<br />
line (x = 0), when in fact x = 10cm or x = 20cm. This<br />
can bias the final estimate (Buckland et al. 1993). Care<br />
must be taken in ensuring that the centre-line of the transect<br />
is straight and is clearly marked.<br />
F ig. 5.3: Diagrammatic representation of a line transect. <strong>The</strong><br />
observer walks along the centre-line of the transect<br />
(—). Whenever he spots a dung- pile (.),he records<br />
42<br />
Category Description<br />
A Boli intact, very fresh, moist, with odour.<br />
B Boli intact, fresh but dry, no odour.<br />
the perpendicular distance (——). Some dung-piles,<br />
especially those further from the centre-line, are not<br />
seen at all.<br />
Fig. 5.2 shows that more dung-piles at a distance 0.5-0.99m<br />
from the centre-line were recorded than in the band 0.0-<br />
0.49m. Scrutiny of the raw data suggests that the observers<br />
had a tendency to record any value of x greater than 0.45m<br />
as “0.5m”. This phenomenon, when measurements are<br />
unconsciously rounded to certain figures like 0.5,5, and 10,<br />
is called “heaping” and is common in line transect surveys<br />
(Buckland et al. 1993). To avoid it, the observers must take<br />
care in their measurements.<br />
Another practical problem is the tendency for the cutters to<br />
shift a metre or two to the side to go round a shrub instead<br />
of going straight through it. This usually happens towards<br />
the end of the day when everybody is tired. <strong><strong>Elephant</strong>s</strong> are<br />
more likely to leave dung-piles around a bush than in the<br />
middle of it, so by bending the transect you will get a shorter<br />
measurement of x than if the transect had gone straight<br />
through the bush. This will give a biased estimate of dung<br />
density.<br />
<strong>The</strong> length of the transect can be measured with a surveyor’s<br />
chain or with a topofil (called a “hip chain” in the USA),<br />
which is more practical but Less accurate.<br />
During the process of decay a dung-pile gradually diminishes<br />
in size, changes colour, and becomes partially covered by<br />
leaves. <strong>The</strong>re comes a time when it becomes less visible to<br />
someone running a transect. If you do not take this into<br />
account then the results of the census may be biased. Thus<br />
Barnes & Jensen (1987) classified dung-piles by their shape,<br />
i.e., by their probability of being spotted (Table 5.1).<br />
Categories A to D were likely to be seen, while category E<br />
was defined as the stage at which a dung-pile was unlikely<br />
to be seen by an observer at a distance of two metres or<br />
more. Note that Barnes et al. (1988) found no difference in<br />
visibility when they compared stages A to C with stage D.<br />
C Some of the boli have disintegrated; others are still recognisable as boli.<br />
D All boli completely disintegrated; dung-pile now forms an amorphous flat mass.<br />
E Decayed to the stage where it would be unlikely to be detected at a range of two metres in the<br />
undergrowth<br />
Tabel 5.1: Dung-piles can be classified according to their shape, i.e. the probability of being seen from the centre-line of a transect<br />
(after Barnes & Jensen, 1987). Only dung-iles in categories A to D are used to estimate dung-pile density.
Thus the morphological stage of each dung-pile<br />
should be recorded. Stage E dung-piles will be<br />
ignored in the analysis, but it is still useful to record<br />
them. Sometimes in areas of low elephant density you<br />
may find only stage E dung-piles and they may then<br />
give you some index of elephant abundance.<br />
All data should be recorded systematically on checksheets.<br />
See Fig 5.4.<br />
km A,D Xi <strong>Elephant</strong> GeneraNotes Vegetation Type<br />
sign<br />
0.00 Start from road Secondary forest.<br />
0.27 canopy > 5m<br />
Secondary canopy < 5m<br />
(recently abandoned<br />
0.65 plantation)<br />
0.93 Secondary canopy > 5m<br />
1.34 Marsh<br />
2.00 Alarm call of Primary forest with<br />
grey checked dense under-storey<br />
mangabey<br />
3.62 Ravine<br />
3.73 Footprints<br />
signs of<br />
feeding<br />
3.94 D 1.7 Dropping<br />
4.17<br />
4.21 C2 0.6 Dropping Abandoned village,<br />
5.22 D 2.4 Dropping Secondary canopy<br />
> 5m<br />
5.23 Gorilla nest<br />
(group of 5)<br />
5.24<br />
5.27 Stream Marsh<br />
5.28<br />
5.29 Hunter’s camp Primary forest with<br />
dense understorey<br />
Fig. 5.4: Example of a check-sheet to use in line-transect<br />
survey.<br />
5.5.5 Analysis<br />
<strong>The</strong> mathematics of line transect surveys are<br />
complicated and consequently a computer is essential.<br />
You will need a programme to analyse the data.<br />
Several are already available. For example,<br />
TRANSECT was written by Burnham et al. (1980).<br />
A user-friendly programme called ELEPHANT, based<br />
on Burnham et al. (1980) and employing the Fourier<br />
series model, has been written by Dekker and Dawson<br />
(1992) to accompany their booklet on counting Asian<br />
elephants (Dawson & Dekker 1992). It is designed<br />
for use by wildlife officers. Although it is a simple<br />
programme to use, you still need to understand the<br />
rudiments of using a computer, such as creating data files.<br />
While the Fourier series model is robust and flexible<br />
(Burnham et al. 1980), and will provide a good fit to<br />
most dung-pile data, it is not necessarily the best. <strong>The</strong><br />
hazard rate model is being used increasingly for<br />
animal census work. For example, White (1992) used<br />
it to analyse elephant dung-pile densities in the Lope<br />
Game Reserve in Gabon. A new programme,<br />
DISTANCE, which allows you to select different<br />
models, and also a range of different options, has been<br />
prepared by Laake et a!. (1993). This is designed to<br />
be used in conjunction with the manual by Buckland<br />
et al. (1993). This programme will enable you to get<br />
the most out of your hard-won data, but most wildlife<br />
officers will find the technicalities baffling. If you<br />
are setting out to do line transects for the first time,<br />
you would be well advised to use Dekker and<br />
Dawson’s (1992) programme. <strong>The</strong>n, as you gain<br />
experience and confidence, you can consider<br />
graduating to the more sophisticated analyses<br />
promoted by Laake et al. (1993).<br />
Whichever programme you select, you will have to<br />
create a data-file containing the data on perpendicular<br />
distances. <strong>The</strong> programme will read this file and use<br />
the perpendicular distances to calculate f(0) This is<br />
an estimate of the reciprocal of the effective strip<br />
width (ESW). This is defined as the perpendicular<br />
distance for which the number of dung-piles missed<br />
between the line and the ESW is equal to the number<br />
of dung-piles beyond the ESW that are detected. See<br />
Burnham et al. (1980) and Buckland et al. (1993) for<br />
details.<br />
<strong>The</strong> density of dung-piles, D, is then:<br />
D =<br />
n.f(0)<br />
2L<br />
DUNG COUNTS<br />
where n is the number of droppings and L is the total<br />
length of the transects in which they were recorded.<br />
<strong>The</strong> methods for estimating the variance of D and<br />
the confidence limits are given by Bumham et al.<br />
(1980) and Buckland et a!. (1993). <strong>The</strong> calculations<br />
are done automatically by the programmes<br />
ELEPHANT and DISTANCE.<br />
<strong>The</strong> data should be analysed separately for each<br />
stratum, and then combined to give an overall estimate<br />
for the whole study area (Norton-Griffiths 1978).<br />
43
DUNG COUNTS<br />
5.6 DEFAECATION RATES<br />
5.6.1 Data collection<br />
<strong>The</strong> defaecation rate is the average number of dungpiles<br />
produced per elephant per day. Defaecation rates<br />
have been estimated for forest elephants by Wing and<br />
Buss (1970), Merz (1986), and Tchamba (1992). You<br />
should estimate defaecation rates in your own study<br />
area, because there are likely to be variations from<br />
one place to another. However, this is not always<br />
possible, in which case you should use the estimate<br />
from the site which is most similar to yours in terms<br />
of rainfall and vegetation.<br />
One way to obtain data on defaecation rates is to<br />
follow elephants, as Tchamba (1992) did: follow a<br />
group’s tracks, record all droppings, camping at night<br />
and then following up the tracks the next day. If you<br />
know the number of individuals in the group and the<br />
length of time represented by the tracks you followed,<br />
then you can calculate the total number of elephanthours<br />
(the number of elephants multiplied by the<br />
number of hours). Assuming you did not miss any<br />
droppings and no animals left or joined the group,<br />
then you can calculate the number of dung-piles per<br />
elephant per day. A modification of this method is<br />
being employed in Cameroon by the WCS research<br />
team (J. Powell pers. comm.): a radio-collared<br />
elephant is located in the early morning and a peg<br />
44<br />
BOX 5.1: VARIANCE AND ASSOCIATED TERMS<br />
left as a marker. <strong>The</strong> next morning the animal is again<br />
located. <strong>The</strong>n one walks back along the group’s tracks,<br />
recording all dung-piles, until the peg is found.<br />
You must ensure that your observation periods are<br />
reasonably long (a minimum of five or six hours but<br />
preferably twelve), that you obtain an adequate<br />
number of observation periods, and that they are<br />
evenly distributed throughout the 24-hours because<br />
of diurnal variations in defaecation rate (Dawson<br />
1990).<br />
A word of warning. <strong><strong>Elephant</strong>s</strong> become very cunning<br />
when they suspect they are being followed in thick<br />
vegetation. Do not underestimate them.<br />
It may seem easier and safer to watch elephants from<br />
a hide and record their defaecations. However, when<br />
such a hide is at a drinking place, you may get a biased<br />
estimate because elephants have a habit of defaecating<br />
when they approach water.<br />
5.6.2 Analysis<br />
For each observation period, the defaecation rate<br />
per hour is the total number of defaecations divided<br />
by the total number of observation hours. Multiply<br />
this by 24 to give a daily rate, and then calculate<br />
the mean, variance and confidence limits by the<br />
usual means.<br />
One must understand the distinction between the true population size and the estimated population size. <strong>The</strong><br />
true population size is the actual number of elephants in the study area. Usually we do not know the value of<br />
this figure. <strong>The</strong> estimated population size is what we calculate the population to be using the data collected<br />
in a survey. We hope that this estimate will be close to the true population size. In that case it is an accurate<br />
estimate. Often however, there is something causing a consistent error in the estimate, so that it either overestimates<br />
or under-estimates the population size. <strong>The</strong> difference between the true population size and an<br />
estimate is called bias. In aerial surveys the most important source of bias is observer efficiency, the failure<br />
of observers to see all the animals in their sample units (Caughley & Goddard 1972). This is a much larger<br />
source of error than you might realize. Another source of bias in aerial surveys may be faulty altimeter<br />
leading to an error in the estimate of strip width (Norton-Griffiths 1978). However, computer simulations<br />
suggest that observer efficiency is not a source of bias in dung surveys which use the line transect method<br />
(Barnes et al. 1988).<br />
A second type of error is sample error. This is the random variation one always finds in biological studies. If<br />
you conduct repeat surveys of the same area, each estimate will be slightly different from the others because<br />
of this random variation. If you look at the results from one survey you will find the randomly-selected<br />
transects contain different numbers of animals or droppings from the transects in the other surveys of the<br />
same area. Animals or droppings are never evenly distributed. Some transects will contain many droppings,<br />
while others will contain few, and you may have some transects with none at all.
DUNG COUNTS<br />
For each survey, the estimates from the individual transects will tend to cluster about the mean value. This<br />
is the simple average (the sum of the estimates from the n transects divided by n). If the estimates from the<br />
individual transects are tightly clustered around the mean (Fig. 5.5), it means there is little variation between<br />
transects. This variation is measured by the variance. In this case the variance is low. If the estimates from<br />
the transects are widely spread (Fig. 5.5b), then the variance will be high.<br />
Fig. 5.5: An illustration of variance. In each of the graphs above, the mean number of droppings per transect is estimated<br />
to be 20. In graph a) the variance is low and the estimates from the different transects are clustered tightly<br />
above the mean. In graph b) the variance is high and there is greater spread of estimates above the mean.<br />
<strong>The</strong> standard error is the square root of the variance. <strong>The</strong> 95% confidence limits are found by multiplying<br />
the standard error by a fact t. For large samples t = 1.96 for 95% confidence limits. In wildlife surveys one<br />
usually calculates the 95% confidence limits, but there may be situations when you want to calculate 90% or<br />
99% confidence limits.<br />
<strong>The</strong> confidence limits are usually expressed as a range above and below the estimate. For example, an<br />
estimate of 100 droppings with confidence limits of +20 is usually written as 100±20. <strong>The</strong> confidence limits<br />
mean that if you were to re-sample the population repeatedly and calculate the population estimate, 95% of<br />
your estimates would fall between 80 and 120. <strong>The</strong>y can also be interpreted to mean that there is a 95%<br />
certainty that the true population size lies between 80 and 120.<br />
An estimate with a small variance and narrow confidence limits is termed a precise estimate. An estimate<br />
can be inaccurate but precise. That means the estimate differs by a large amount from the true population<br />
size, but it has narrow confidence limits. Of course, we hope that all our estimates will be both accurate and<br />
precise.<br />
This topic is discussed in greater detail in Norton-Griffiths (1978).<br />
45
DUNG COUNTS<br />
5.7 DUNG DECAY RATES<br />
5.7.1 Data collection<br />
Estimating the rate of dung decay is very timeconsuming.<br />
It needs to be done at the same time as the<br />
line transect is being conducted. This means that you<br />
will need two teams, one to do the line transect census<br />
and the other for dung decay observations. Or you could<br />
use the same team to do the line-transects in the first<br />
year and the dung decay observations at the same season<br />
in the following year.<br />
your study area) for several weeks. However, Barnes<br />
and Barnes (1992) showed that if you used the<br />
Goodman method of analysis, then the estimate of<br />
decay rate is insensitive to truncation. That is, if all<br />
except two droppings have decayed then you can stop<br />
the observations and start analysing the data. Ignoring<br />
the last two droppings will have no effect upon the<br />
estimate of dung decay rate. But this only holds if you<br />
use the Goodman method.<br />
<strong>The</strong> aim is to estimate the mean daily rate of dung decay<br />
by measuring the time that each dung-pile in a sample<br />
takes to pass from deposition to stage E. Data collected<br />
in the Kakum National Park in Ghana indicates that 50<br />
dung-piles is the optimum number for obtaining a good<br />
estimate of decay rate in any one season. It is worth<br />
aiming for 55 or 60 in case some are disturbed by<br />
poachers or lost in other ways.<br />
Searching for fresh dung-piles may take longer than<br />
you anticipate because you must be sure of the date of<br />
deposition of the dung-pile. It is usually difficult to<br />
estimate the age of droppings that are more than 48<br />
hours old; distrust anybody who claims they can do so<br />
unless you have tested them with known-age droppings.<br />
It is best to search for droppings that have been<br />
deposited within the preceding 24 hours. Each dungpile<br />
should be marked and mapped so that you can<br />
return at weekly intervals. You should return to each<br />
dung-pile until it reaches stage E. Note that there is a<br />
degree of subjectivity in the definition of stage E. This<br />
subjectivity is an important potential source of error.<br />
However, we have found in Ghana that with practice<br />
different observers can be trained to be remarkably<br />
consistent in deciding on the transition point between<br />
stages D and E. <strong>The</strong> important thing is to be consistent<br />
in the definition you use, and to use the same definition<br />
in both your line-transect survey and in your decay<br />
observations. Before starting a dung census you should<br />
spend several days walking through the study area to<br />
decide upon your definition of the D/E transition.<br />
Dung-piles do not age uniformly. Some pass from<br />
46<br />
deposition to stage E in ten days. Others take a hundred<br />
days (Barnes & Barnes 1992). <strong>The</strong> fact that all your<br />
dung-piles except two have decayed can be an extreme<br />
nuisance. You may spend a lot of money to monitor<br />
just two lone dung-piles (they invariably seem to be at<br />
opposite ends of your study area) for several weeks.<br />
However, Barnes and Barnes (1992) showed that if you<br />
used the Goodman method of analysis, then the estimate<br />
of decay rate is insensitive to truncation. That is, if all<br />
except two droppings have decayed then you can stop<br />
the observations and start analysing the data. Ignoring<br />
the last two droppings will have no effect upon the<br />
estimate of dung decay rate. But this only holds if you<br />
use the Goodman method.<br />
5.7.2 Analysis<br />
<strong>The</strong> analysis of dung decay rates is complicated by the<br />
non-uniform process of decay. At first the process of<br />
decay was thought to be exponential (Short 1983;<br />
McClanahan 1986; Barnes & Jensen 1987). But<br />
Dawson (1990) showed that this was not the case, and<br />
her conclusion has been confirmed since then by a<br />
number of large samples of decaying dung-piles<br />
(Grimshaw & Foley 1990; Reuling 1991; L. White pers.<br />
comm.). <strong>The</strong> methods of analysing these data are still<br />
evolving. One method has been described by Dawson<br />
(1990); another, based on Goodman s (1984) model of<br />
mammalian survival rates, is given by Barnes and<br />
Barnes (1992). Others are being developed (R. Sukumar<br />
pers. comm.).<br />
5.8 CALCULATING THE NUMBER OF<br />
ELEPHANTS<br />
<strong>The</strong> number of elephants (E) is calculated from the<br />
dung-pile density (Y), the defaecation rate (D), and the<br />
decay rate (r) by the equation (McClanahan 1986;<br />
Barnes & Jensen 1987):<br />
Y.r<br />
E =<br />
D<br />
<strong>The</strong> individual variances of Y, r, and D each contribute<br />
to the variance of E. This variance can be calculated in<br />
three different ways. all described by Barnes (1993).<br />
Another method has been worked out by Dr. R. Sukumar<br />
(pers. comm.) and will be published shortly.<br />
If you want to avoid the steady state assumption, then<br />
Hiby & Lovell (1991) have prepared a programme that<br />
will give an estimate for E. But this still requires<br />
observations of dung decay and it also requires an<br />
estimate of defaecation rate.
5.9 MISCELLANEOUS TIPS<br />
A potential source of error is an elephant’s habit of<br />
walking while defaecating. This means that some boli<br />
may fall in one pile and the rest in another, and<br />
sometimes the boli may fall in three separate piles. If<br />
you pass along later when the boli have reached stage<br />
D (an amorphous mass), you will not be able to tell<br />
whether it was two separate defaecations or one<br />
defaecation falling in different piles. I have found<br />
that even experienced trackers may think they know<br />
but cannot tell.<br />
When faced with this problem, one should note<br />
clearly on the check-sheet that the dung-piles may<br />
be either from the same or different defaecations.<br />
<strong>The</strong>n when analysing the data, do two separate<br />
analyses. In the first assume these dung-piles all<br />
belonged to the same defaecation (i.e. use the mean<br />
of their perpendicular distances). In the second,<br />
assume that they are separate defaecations. <strong>The</strong>re may<br />
be a large difference between the two estimates, but<br />
since you cannot tell which is the true figure (or since<br />
some may have come from two defaecations and<br />
some from only one, the true figure may lie<br />
somewhere between the two) you must simply present<br />
the two estimates.<br />
Savanna elephants show seasonal variations in<br />
defaecation rate (Barnes 1982), and Wing & Buss’<br />
(1970) results indicated this was also true of elephants<br />
in the Budongo Forest in Uganda. But Tchamba’s<br />
(1992) study in Cameroon showed no seasonal<br />
variations. <strong>The</strong>re are, however, marked seasonal<br />
variations in decay rate. In some habitats there will<br />
also be seasonal variations in the visibility of dungpiles.<br />
<strong>The</strong>se seasonal changes mean that you should<br />
complete a dung count within one season. If you are<br />
surveying a very large area, then you might have to<br />
survey one stratum in the wet season, go and do some<br />
other type of work in the dry season, and then survey<br />
the next stratum in the wet season of the next year.<br />
Make copies of your field data as soon as possible<br />
after you have collected it. Place a sheet of carbon<br />
paper under your checksheet so that you make a<br />
carbon copy as you record the data. Or copy the<br />
check-sheet out in the evening. If you have only one<br />
copy then you risk losing the results of all your hard<br />
work when a canoe overturns, the camp burns down,<br />
or your haversack is stolen.<br />
Do make a list of every item you will need in the<br />
field, and take spares. When you are six days’ walk<br />
from the nearest village there is nothing more galling<br />
than realising that the pencil you dropped in the rapids<br />
was your last.<br />
5.10 CONCLUSION<br />
DUNG COUNTS<br />
While it may be true that “counting elephants will<br />
not save them” (Boshe 1990), most elephant<br />
conservation efforts are preceded or even triggered<br />
by a census of one sort or another. For example, the<br />
large forest conservation project now underway in<br />
the Nouabale area of northern Congo was stimulated<br />
by the results of the forest elephant surveys conducted<br />
by Wildlife Conservation International (Fay 1991;<br />
Fay & Agnagna 1991; Barnes et al. 1993). It is often<br />
difficult to stimulate politicians or senior officials to<br />
do anything until you have some numbers. Numbers<br />
give substance to your arguments.<br />
You must have a thick skin if you are going to count<br />
elephants. If the goal of your work is to provide data<br />
to be used in making management decisions (e.g.<br />
culling, ivory trade), then you will be attacked<br />
simultaneously by those who claim your estimates<br />
are inflated and those who believe them to be too<br />
low. You must be completely objective. Avoid setting<br />
out to prove there are too many elephants and so they<br />
should be culled, or that there are too few. Your<br />
prejudices might unconsciously cause you to bias your<br />
results. Ideally, you should collect and analyse the<br />
data in a professional and objective manner; then the<br />
management decisions based on your results should<br />
be taken by a higher authority.<br />
Dung counts can, if done properly, give estimates that<br />
are accurate (i.e., close to the true population size)<br />
and precise (i.e., with narrow confidence limits), as<br />
shown in a series of experiments conducted by<br />
Jachmann (1991) in Burkina Faso. In fact, Jachmann<br />
(1991) showed that in both respects sample counts of<br />
dung were superior to sample counts of the elephants<br />
themselves.<br />
5.11 ADDRESSES TO OBTAIN<br />
COMPUTER PROG RAMMES<br />
l. <strong>The</strong> programme ELEPHANT can be obtained<br />
from:<br />
<strong>The</strong> Director, Wildlife Institute of India,<br />
Post Bag 18,<br />
Dehra Dun - 248001,<br />
India.<br />
47
DUNG COUNTS<br />
2. <strong>The</strong> programme DISTANCE can be obtained from:<br />
48<br />
<strong>The</strong> Colorado Cooperative Fish &<br />
Wildlife Research Unit,<br />
201 Wagar Building,<br />
Colorado State University,<br />
Fort Collins,<br />
Colorado 80523, USA.<br />
Both programmes are distributed free of charge.<br />
Acknowledgements<br />
I thank James Agyei-Ohemeng, Stephen Asamoah and<br />
Malcolm Stark for commenting on an earlier version of<br />
this chapter. This chapter is based upon field work conducted<br />
in the central <strong>African</strong> forests with the support of NYZS,<br />
<strong>The</strong> Wildlife Conservation Society. I thank Dr. David<br />
Woodruff for the provision of facilities in the Biology<br />
Department at the University of California, San Diego,<br />
USA.<br />
References<br />
BARNES, R.F.W. (1982) <strong>Elephant</strong> feeding behaviour in Ruaha National Park,<br />
Tanzania. <strong>African</strong> Journal of Ecology 20, 123-136.<br />
BARNES, R.F.W. (1993) Indirect methods for counting elephants in forest.<br />
Pachyderm 16, 24-30.<br />
BARNES, R.F.W. & BARNES, K.L. (1992) Estimating decay rates of elephant dungpiles<br />
in forest. <strong>African</strong> Journal of Ecology 3O, 316-321.<br />
BARNES, R.F.W. & JENSEN, K.L. (1987) How to count elephants in forests IUCN<br />
<strong>African</strong> <strong>Elephant</strong> & Rhino <strong>Specialist</strong> <strong>Group</strong> Technical Bulletin I, 1-6. Version en français<br />
“Comment compter les éléphants de fôrest?, traduction Dr. H. Mertens.<br />
BARNES, R.F.W., JENSEN K.L., ALERS, M.P.T. & BLOM, A. (1988) Le nombre<br />
et Ia distribution des éléphants dans les fôrests du nord-est du Gabon. Typescript report<br />
to La Direction de Ia Faune et de Ia Chasse. Wildlife Conservation international 34 pp.<br />
BARNES, R.F.W., BARNES, K.L., ALERS, M.P.T. & BLOM, A. (1991) Man<br />
determines the distribution of elephants in the rain forests of northeastern Gabon.<br />
<strong>African</strong> Journal of Ecology 29, 54-63.BOSHE, J. (1990) Counting elephants will not<br />
save them. Swara 12(3), 13-14.<br />
BUCKLAND, S.T., ANDERSON, D.R., BURNHAM, K.P. & LAAKE, J.L (1993)<br />
Distance Sampling: Estimating Abundance of Biological Populations. Chapman &<br />
Hall, London & New York.<br />
BURNHAM, K.P., ANDERSON, D.R., & LAAKE, J.L. (1980) Estimation of<br />
density from Fine transect sampling of biological populations. Wildlife<br />
Monographs 7Z I- 202.<br />
BURNHAM, K.P., ANDERSON, D.R., & LAAKE, J.L. (1985) Efficiency and bias<br />
in strip and line transect sampling. Journal of Wildlife Management 49, 1012-1018.<br />
BUTYNSKI, T.M. (1986) Status of elephants in the Impenetrable (Bwindi) Forest,<br />
Uganda. <strong>African</strong> Journal of Ecology 24 189-193.<br />
CAUGHLEY. G.J. GODDARD, J. (1972) Improving the estimates from inaccurate<br />
censuses Journal of Wildlife Management 36, 135-140.<br />
DAWSON, S. (1990) A model to estimate density of Asian elephants (Elephas maximus<br />
in forest habitats. M.Sc. <strong>The</strong>sis. University of Oxford, U.K.<br />
DAWSON. S. & DEKKER, A.J.F.M. (1992) Counting Asian elephants in forests. FAO, Bangkok.<br />
DEKKER, A.J.F.M. & DAWSON. S. (1992) ELEPHANT. Wildlife Institute of India,<br />
Dehra Dun.<br />
FAY, J.M. (1991) An elephant Loxodonta africana) survey using dung counts in the<br />
forests of the Central <strong>African</strong> Republic. Journal of Tropical Ecology 7, 25-36.<br />
FAY, J.M. & AGNAGNA, M. (1991) A population survey of forest elephants Loxodonta<br />
africana cyclotis in northern Congo. <strong>African</strong> Journal of Ecology 29, 177-187.<br />
GOODMAN, D. (1984) Statistics of reproductive rate estimates, and their implications<br />
for population projection. Report of the International Whaling Commission Special<br />
Issue 6,161-173.<br />
GRIMSHAW, J.M. & FOLEY, C.A.H. (1990) Kilimanjaro <strong>Elephant</strong> Project 1990:<br />
Final Report. Typescript, Friends of Conservation, Nairobi.<br />
HIBY, L. & LOVELL, P. (1991) DUNGSURV—a program for estimating elephant<br />
density from dung density without assuming “steady state”. In: Censusing <strong><strong>Elephant</strong>s</strong><br />
in Forests: Proceedings of an International Workshop (Eds. by U. Ramakrishnan, J.A.<br />
Santosh, & R Sukumar). pp. 73-79.Asian elephant Conservation Centre, Bangalore.<br />
JACHMANN. H. (1991) Evaluation of four survey methods for estimating elephant<br />
densities. <strong>African</strong> Journal of Ecology 29, 184-195.<br />
JACHMANN, H. & BELL, R.H.V. (1979) <strong>The</strong> assessment of elephant numbers and<br />
occupance by means of dropping counts in the Kasungu National Park, Malawi. <strong>African</strong><br />
Journal of Ecology 17, 231-241.<br />
JACHMANN, H. & BELL, R.H.V. (1984) <strong>The</strong> use of elephant droppings in assessing<br />
numbers occupance, and age structure: a refinement of the method. <strong>African</strong> Journal of<br />
Ecology 22, 127-141.<br />
KREBS, C.J. (1989) Ecological Methodology. Harper & Row, New York.<br />
LAAKE, J.L., BUCKLAND, S.T., ANDERSON, D.R. & BURNHAM, K.P. (1993J<br />
DISTANCE User’s Guide. Colorado Cooperative Fish & Wildlife Research Unit,<br />
Colorado State University, Fort Collins, CO 80523.<br />
McCLANAHAN, T.R. (1986) Quick population survey method using faecal droppings<br />
and a steady state assumption. <strong>African</strong> Journal<br />
MERZ G (1986) Counting elephants Loxodonta africana cyclotis is) in tropical rain<br />
forests with particular reference to the Tai National Park, ivory Coast. <strong>African</strong> Journal<br />
of Ecology 24, 61-68.<br />
NORTON-GRIFFITHS, M. (1978) Counting Animals. Handbooks on techniques<br />
currently used in <strong>African</strong> wildlife ecology. Ed. J. J. Grimsdell. No.1. AWLF, Nairobi.<br />
REULING, MA. (1991) <strong>Elephant</strong> Use of the Marang Forest Reserve in Northern<br />
Tanzania. M.Sc. <strong>The</strong>sis. University of Washington, USA.<br />
SHORT, J.C. (1983) Density and seasonal movements of the forest elephant<br />
(Loxodonta africana cyclotis Matschie) in Bia National Park, Ghana. <strong>African</strong><br />
Journal of Ecology 21, 175-184.<br />
TCHAMBA M. (1992) defaecation by the <strong>African</strong> forest elephant (Loxodonta<br />
africana cyclotis) in the Santchou Reserve, Cameroun. Nature et Faune 7, 27-31.<br />
WHITE, L.J.T. (1992) Vegetation history and logging \damage: effects on rain<br />
forest mammals in the Lope Reserve, Gabon. Ph.D. <strong>The</strong>sis, University of<br />
Edinburgh.<br />
WING, L.D. & BUSS, 1.0. (1970) <strong><strong>Elephant</strong>s</strong> and forests, Wildlife Monographs<br />
19, 1-92
CHAPTER 6<br />
DIRECT COUNTS OF ELEPHANTS FROM THE GROUND<br />
H. Jachmann<br />
6.1 INTRODUCTION<br />
<strong>The</strong> most direct way to estimate the abundance of<br />
an elephant population is to Count all individuals<br />
in a defined area. An estimate of population density<br />
is obtained simply by dividing the number counted<br />
by the size of the area censused, and the density<br />
figure obtained in this way can then be applied to<br />
surrounding areas with similar characteristics, such<br />
as soil types and vegetation. Census methods based<br />
on this approach are usually called quadrat, plot<br />
or strip-sampling methods. Defining an area or<br />
establishing a plot and then counting all the<br />
elephants within it on foot or from a vehicle can<br />
be very time consuming and impractical, and<br />
certainly impossible if the target elephant<br />
population is mobile or if individuals are widely<br />
scattered. As an alternative, transect and linetransect<br />
methods have been devised to estimate<br />
animal abundance. Both can be carried out on foot<br />
or from a vehicle, and the principles that apply<br />
are very similar to those used in estimating<br />
elephant abundance using dung counts (see<br />
Chapter 5).<br />
This chapter begins with a brief description of<br />
transect counts on the ground, and then goes on to<br />
discuss line-transect methodology. You are<br />
strongly advised to read Norton-Griffiths (1978)<br />
for an introduction to survey work, and Burnham<br />
et al. (1980) and Buckland et al. (1993) for a<br />
thorough statistical background on line-transect<br />
sampling.<br />
6.2 TRANSECT COUNTS<br />
<strong>The</strong> simplest form of estimation of numbers from<br />
observation data uses linear extrapolation. That is,<br />
having surveyed a defined area within a region,<br />
such as a transect with a fixed width, and assuming<br />
that all the animals within that area have been seen,<br />
Luangwa Integrated Resource Development Project<br />
P.O. Box 510249<br />
Chipata, Zambia<br />
applying the calculated density to the whole region.<br />
This method produces the best results in open<br />
country where there is no visibility problem. In all<br />
other cases the method will be inadequate in at least<br />
two ways that result in error in the estimate of animal<br />
abundance:<br />
i) it is difficult to define accurately the area<br />
that has been surveyed; and<br />
ii) one assumes that all individuals have been<br />
seen in the surveyed area. This assumption,<br />
however, is not realistic when using a<br />
transect of fixed width in woodland<br />
habitats, for instance. In this case the<br />
population estimates will be negatively<br />
biased, that is, one will estimate fewer<br />
elephants than there actually are in an area.<br />
<strong>The</strong>se problems can be overcome by using variable<br />
fixed-width transects, whereby the width of the<br />
transect is adjusted according to the vegetation<br />
density. In open country, the width of the transect may<br />
be as much as 500m; while in areas of dense<br />
vegetation, the fixed width may be reduced to l00m.<br />
This technique, however, has the same sources of error<br />
as the fixed-width method described above. King’s<br />
method was the first technique to use this variable<br />
visibility profile, taking the average sighting distance<br />
as half the effective strip width or half the width of<br />
the strip censused. Although the method is weak and<br />
usually produces overestimates of density (Norton-<br />
Griffiths 1978), it does not require much training to<br />
carry Out the field procedure and the data analysis.<br />
Another approach is Kelker’s method (unpublished<br />
dissertation), where the distance of each group of<br />
elephants from the transect line is measured. <strong>The</strong><br />
number of groups observed are tallied by distance<br />
from the transect line, i.e. all groups falling between<br />
49
DIRECT COUNTS<br />
0-10m, l0-20m, etc. <strong>The</strong> number of elephants in each<br />
distance category or belt is then plotted against the<br />
sighting distance from the transect (Fig. 6.1). <strong>The</strong><br />
resulting curve will drop off steeply for a particular<br />
distance away from the transect. This point is taken<br />
as one half of the effective strip width. <strong>The</strong> precision<br />
of the estimate will improve with a declining belt<br />
size, e.g. belt intervals of 25 metres will provide<br />
considerably better estimates than belt intervals of<br />
100 metres. Small belt sizes are only practical,<br />
however, when the elephants are used to the presence<br />
of people and vehicles, otherwise no observations<br />
will be made in the first few belts.<br />
Although Kelker’s method is somewhat better than<br />
the ones described previously, it usually leads to<br />
overestimates of density (Norton-Griffiths 1978. <strong>The</strong><br />
method will only work if the observations drop off<br />
in a fairly abrupt manner.<br />
Fig. 6.1: An adaptation of Kelker‘s method: number of<br />
animals counted in 25m belts (abscis) of<br />
increasing distance from the transect line<br />
(ordinate). <strong>The</strong> point at which the numbers drop<br />
off is taken as half the effective strip width, which<br />
is 175m in this hypothetical case.<br />
<strong>The</strong> precision of the method is limited when the<br />
observations drop off gradually or shows a sine or sshaped<br />
pattern.<br />
Essentially, the only approach which reduces<br />
considerably is the line-transect method discussed<br />
below.<br />
50<br />
6.3 LINE-TRANSECT SAMPLING<br />
6.3.1 Line-transect sampling theory<br />
In line-transect sampling the observer progresses through<br />
the area following a straight line of known length (transect).<br />
He or she records each animal, notes the distance of the<br />
animal from the observer when spotted and using a compass,<br />
its bearing, which is then converted to a sighting angle<br />
relative to the transect (Fig. 6.2). As a result, the observer is<br />
able to calculate the perpendicular distance of each animal<br />
from the transect. <strong>The</strong> width of the transect is not fixed and<br />
changes constantly according to the visibility or density of<br />
the vegetation along that particular segment of the transect.<br />
<strong>The</strong> width of the transect also differs for each species of<br />
animal when multi-species counts are conducted.<br />
<strong>The</strong> data from a line-transect survey are a set of distances<br />
and angles and the resultant sample size itself (i.e., number<br />
of groups seen and number of transects walked). <strong>The</strong> Set<br />
of distances and angles are transfomed to a set of<br />
perpendicular distances of the elephants from the transect<br />
line. <strong>The</strong>se perpendicular distances are then used in a<br />
statistical model to calculate the elephant density for the<br />
area. <strong>The</strong> basic idea underlying such a model is that the<br />
probability of detecting an elephant decreases as its<br />
distance from the transect line increases. Mathematically,<br />
this idea is represented by a function or curve called the<br />
Fig. 6.2 Diagrammatic representation of a line-transect sample<br />
and the data that should be collected for a detected<br />
elephant <strong><strong>Elephant</strong>s</strong> detected show the perpendicular<br />
distance to the transect line. Those on the line are always<br />
detected, while those further away have a lower<br />
probability of being detected. <strong>The</strong> observer is at position<br />
0, the elephant detected at position E and P is the point<br />
perpendicular to the elephant. <strong>The</strong> sighting distance<br />
is S, the sighting angle is T and the perpendicular<br />
distance is D.
detection function g(x), where x is the perpendicular<br />
distance (Fig. 6.3). This is the conditional probability<br />
of observing an elephant, given that the animal is at<br />
perpendicular distance from the transect line. <strong>The</strong>re<br />
are numerous factors that affect the probability of<br />
detecting animals: for example, alertness, interest and<br />
training of observers, habitat conditions, time of year,<br />
time of day and elephant group size, etc. If linetransect<br />
sampling depended upon the detection<br />
probability being a simple function of x or the<br />
perpendicular distance from the transect of all<br />
sighted animals over the entire study period, it<br />
Fig. 6.3: Hypothetical example of a frequency diagram of<br />
perpendicular distance data for groups of animals<br />
observed. <strong>The</strong> detection function (g(x)) is<br />
indicated, but is not to scale.<br />
would be of little value, because such a condition<br />
does not exist in reality. Fortunately, analytical<br />
methods exist that are not affected by variations in<br />
detection probability for each sighting or over the<br />
course of the study. Mathematically, the detection<br />
function is allowed to be a mixture of many simple<br />
functions: g(x) = g 1 (x) + + g(x), where each g 1 (x)<br />
applies to a set of detection c conditions (Burnham<br />
et al. 1980). Although the detection function is related<br />
to many factors, the spatial distribution of elephants<br />
is one factor to which it is not related.<br />
6.3.2 Density estimation<br />
In Chapter 5 on dung counts it was stated that the<br />
mathematics of line-transect techniques are<br />
complicated and the use of a computer is<br />
essential. This is also the case with direct counts,<br />
and you are advised to seek the help of someone<br />
well versed in computers and statistics to help<br />
you analyse your data and explain the<br />
assumptions of the different methods for doing<br />
so.<br />
<strong>The</strong> conceptual background of all line-transect<br />
estimation is as follows. <strong>The</strong> estimator of the<br />
density (D) of (n) observations over a transect<br />
with length (L) can be expressed as:<br />
D =<br />
<strong>The</strong> unknown parameter (a) can be referred to as<br />
one-half the effective strip width of the transect,<br />
where the relationship between (a) and the<br />
detection function is the integral of the detection<br />
curve:<br />
∫ a =<br />
6.3.3 Field procedure<br />
n<br />
2.L.a<br />
w<br />
0 g (x) d (x)<br />
DIRECT COUNTS<br />
<strong>The</strong> major advantage of the line-transect sampling<br />
technique is the relative ease of its<br />
implementation in the field. <strong>The</strong> placement of<br />
transect lines may be either temporary or<br />
permanent. Permanent transect lines, delineated<br />
by markers, should be considered if the transects<br />
are to be surveyed periodically. Use of permanent<br />
transects enables pairing of the data for the<br />
analysis of differences in density over time and<br />
thereby increases the power of such analyses.<br />
When the survey areas have been selected, the<br />
layout of transects must be determined. That<br />
layout will depend on statistical design<br />
requirements, but as the field examples at the end<br />
of this chapter will show, considerations of<br />
logistics supplies and access will in practice often<br />
determine the final survey design.<br />
51
DIRECT COUNTS<br />
As with dung counts (see Chapter 5), the<br />
following factors are of the utmost importance:<br />
i) defining a straight line of travel;<br />
ii) obtaining accurate measurements of<br />
distances and angles; and<br />
iii) ensuring that all elephants on, and very near, the<br />
transect line are detected with certainly<br />
Although the field procedure is relatively simple (see<br />
Section 6.3.1) some understanding of the theory is<br />
essential for obtaining good estimates of density. <strong>The</strong><br />
entire procedure of line-transect sampling is based<br />
on being able to follow a straight transect line or series<br />
of straight line segments. This is almost always<br />
compromised to some degree in the field because of<br />
physical obstacles such as trees, rivers and rock<br />
formations, and the difficulty of trying to maintain a<br />
straight line and searching for elephants<br />
simultaneously. However, unless the line of travel is<br />
defined in some manner, accurate measurements of<br />
perpendicular distances cannot be obtained. If the<br />
observer tends to walk towards the elephants when<br />
they are sighted, the perpendicular distance and<br />
sighting angle will be negatively biased and the<br />
density estimate positively biased.<br />
It is important to consider the statistical design or the<br />
determination of the desired level of sampling effort<br />
and its allocation over both the study area and the<br />
duration of the study. Factors that affect the level of<br />
effort include the number of transect lines, the length<br />
of each line, the frequency With which each line is<br />
surveyed, and the number of observers or teams of<br />
observers that conduct the study. <strong>The</strong> placement of<br />
transect lines within the study area is critical.<br />
Transects can be placed systematically, randomly, or<br />
in a stratified design. <strong>The</strong> lines should not be too close<br />
together, nor should they overlap. Stratifying the study<br />
area by some feature such as habitat type is often done<br />
and may be useful under certain circumstances.<br />
However, a stratified design presents a potential<br />
pitfall. If each stratum contains a sufficient length of<br />
lines to provide a sample large enough to enable<br />
analysis of the data by stratum, no problems arise.<br />
However, if the effort per stratum is insufficient to<br />
analyse the distance data separately by stratum, the<br />
data will have to be pooled over several strata before<br />
analysis. Such pooling will lead to a biased estimator<br />
of average density, unless the total line length<br />
allocated to the strata is in proportion to the area of<br />
each stratum (Burnham et al. 1980).<br />
52<br />
<strong>The</strong> timing sequence must be considered in<br />
conducting a survey, including such major<br />
considerations as the time of the year for the survey<br />
and the assignment of observers to the replicate lines<br />
or repeats of transects. It also includes lesser<br />
considerations such as the starting and stopping time<br />
of observation during a single day and even the<br />
direction of travel. <strong>The</strong> main objective in these<br />
considerations is to avoid confounding any changes<br />
in density that may occur over time with the sequence<br />
in which the lines are surveyed.<br />
6.3.4 Data analyses<br />
<strong>The</strong> raw data collected in the field consists of sighting<br />
distances, sighting angles, group sizes, the number<br />
of groups of elephants and the number of transects<br />
walked. <strong>The</strong> field bearings should be converted to<br />
angles relative to the bearing of the transect. Because<br />
a group of elephants is treated as a single observation<br />
and the overall data analyses deal in terms of densities,<br />
the mean group size should be calculated. <strong>The</strong>n the<br />
data can be analysed using an appropriate computer<br />
programme such as TRANSECT (Burnham et al<br />
1980), allowing the Fourier Series, Modified Hayne,<br />
Generalized Hayne and Hayne estimators to be used.<br />
<strong>The</strong>re are several other computer programmes<br />
available for the analysis of line-transect data.<br />
However, to my knowledge, TRANSECT is the most<br />
user-friendly programme and it allows the use of these<br />
four different estimators.<br />
As was stated earlier, if you have more than 40<br />
observations of elephant groups you should use the<br />
Fourier Series estimator. With fewer observations,<br />
each of the remaining three estimators can be<br />
determined. A statistician will help you to establish<br />
which of the models generated by each of the<br />
estimators best fits your data (explains the most<br />
variance), and thus which model to use for your<br />
elephant density estimation.<br />
6.3.5 Level of precision<br />
In line-transect sampling, the sample size or the<br />
number of sightings of groups or individual<br />
animals determines the precision of the<br />
population density estimate, independent of the<br />
type of estimator used for the analysis (Jachmann<br />
1992). <strong>The</strong> relationship between the number of<br />
sightings (S) and the coefficient of variance (CV)<br />
follows an orthogenal hyperbolic curve (Fig. 6.4)<br />
(see Chapter 5 - Box 5.1 for an explanation of
Fig. 6.4 <strong>The</strong> relationship between the number of sightings<br />
of groups and individuals of a species and the<br />
precision of the density estimate, (co-efficient of<br />
variance). <strong>The</strong> relationship is significant at<br />
P
DIRECT COUNTS<br />
March 1988 on the Nazinga Game Ranch in<br />
Burkina Faso (Jachmann 1988a, 1991). In Nazinga<br />
human disturbance meant that the elephants were shy<br />
and thus avoided the roads (Jachmann 1988b, 1989).<br />
<strong>The</strong> survey took approximately six days to complete<br />
and covered 267km of roads. Sighting angles and<br />
sighting distances were used to calculate the<br />
perpendicular distances. Twice the mean<br />
perpendicular distance was used as the transect width,<br />
and the 95% confidence limits were calculated by<br />
counting the same stretch of road a number of times<br />
and using the variance of the estimates as an<br />
approximation of the sample error (Burnham et al.<br />
1980). <strong>The</strong> road count gave a population estimate of<br />
293, about 20% lower than the aerial total count for<br />
that year (Table 6.2), which was considered a<br />
conservative estimate (Jachmann 1991).<br />
While population estimates obtained through road<br />
counts may be biased, road counts may be the only<br />
practical method of censusing an area when the<br />
available survey budget is limited. A cost-benefit<br />
analysis showed that at the Nazinga Game Ranch, a<br />
single line-transect survey on foot was four to eight<br />
times more expensive than a road survey (Jachmann<br />
1988a, 1991).<br />
6.5 FIELD EXAMPLES<br />
6.5.1 General<br />
Two field examples of transect counts are presented:<br />
one from the Lupande Game Management Area in<br />
the central Luangwa Valley in Zambia (Jachmann<br />
1992), and one from the Nazinga Game Ranch in<br />
Burkina Faso (Jachmann 1991). In both cases, multispecies<br />
counts were carried out using line-transect<br />
methodology to estimate animal densities and to<br />
determine the annual hunting quotas for selected<br />
species. However in these examples the results and<br />
54<br />
discussion will be restricted to elephant population<br />
estimates.<br />
6.5.2 <strong>The</strong> Lupande Game<br />
Management Area (GMA),<br />
Zambia<br />
6.5.2.1 Layout of transects<br />
In the survey block of the Lupande GMA (3,728km 2 ),<br />
a total of 41 transects were placed at 5km intervals,<br />
with a total length of 317.5km (four transects with a<br />
length of 10km and 37 transects with a length of<br />
7.5km). <strong>The</strong> transects were covered twice in 1992,<br />
the first time in late July and the second time in late<br />
October (late dry season).<br />
<strong>The</strong> layout of transects was more or less determined<br />
by the limited number of roads in the survey area.<br />
After finishing a transect, the team of observers had<br />
to cover the same distance back to the road. Transects<br />
were laid out in such a way as to allow a team of<br />
observers to be able to finish each transect within one<br />
morning. In spite of the above constraints, the number<br />
of transects, as well as the total length of transects,<br />
was chosen to give a more or less even distribution<br />
of transects over the survey area, with approximately<br />
1km of transect for each 12km 2 of survey block. With<br />
the exception of a few transects in the north, all<br />
transects ran east-west or had a magnetic bearing of<br />
900 or 2700. All transects were marked with a starter<br />
tag, showing a number that corresponded to the length<br />
and magnetic bearing of the transect.<br />
6.5.2.2 Walking transects<br />
<strong>The</strong> transects were surveyed by six teams, usually of<br />
three people each, consisting of a teamleader, a<br />
wildlife scout and a village scout. All transects were<br />
walked from 7.OOa.m. to 10.00a.m. Prior to the first<br />
survey, in July, all teams attended a three-day seminar<br />
to get acquainted with line-transect theory, distance<br />
estimation and the use of a compass, pedometer and<br />
range-finder. A compass was used to follow a straight<br />
line by sighting of landmarks on the line of travel as<br />
Method of Population<br />
Surveying Year Estimate 95% C.I. Estimator<br />
Aerial Census 1989 366 Total Count<br />
Foot Survey 1987 487 210-774 Fourier Series<br />
Foot Survey 1988 306 0-952 Mod. Hayne<br />
Vehicle Survey 1988 293 0-728 Perp. Distance<br />
Table 6.2: <strong>Elephant</strong> population estimates in the Nazinga Game ranch, Burkina Faso (Jachmann 1991).
well as taking bearings to the object(s) relative to the<br />
transect line. In order to estimate the distance covered<br />
on the transect StepSets 400 pedometers were used.<br />
This equipment was calibrated every other day, over<br />
a 400m distance, automatically indicating personal<br />
step-length. It indicates the distance walked with a<br />
25m precision, while a series of replicate lines<br />
showed an error of 5-10% for each of the pedometers<br />
used during the survey. On slopes, however, a<br />
rangefinder was used to determine the profile distance<br />
covered on the transect.<br />
In relation to the straight line of the transect, the<br />
following information was recorded each time an<br />
animal/group was spotted:<br />
• the species;<br />
• the number of animals in the group;<br />
• the distance to the animal from the<br />
observer; and<br />
• the compass bearing of the animal,<br />
ensuring that all readings had been taken<br />
on the line of the transect.<br />
6.5.2.3 Results<br />
During the two foot surveys only 14 elephant groups<br />
were sighted, totaling 62 individuals, and giving a<br />
mean group size of 4.43. <strong>The</strong> population was<br />
estimated at 403±185(95% Confidence limits 22-<br />
783), using the Generalized Hayne estimator. An<br />
aerial sample survey, covering 6% of the Lupande<br />
area, gave a population estimate of 666 ± 258 (95%<br />
Confidence limits 160-1172), which is not<br />
significantly different from the estimate obtained<br />
through line-transect sampling.<br />
6.5.3 <strong>The</strong> Nazinga Game Ranch,<br />
Burkina Faso<br />
6.5.3.1 Layout of transects<br />
On the Nazinga Game Ranch (1,000km 2 ), 30<br />
transects with a total length of 562.1km were<br />
traversed. <strong>The</strong> transects ran from the south boundary<br />
to the north boundary of the ranch (a magnetic<br />
bearing of 1800). Each team was dropped off at the<br />
start of a transect and picked up at the end of it. This<br />
survey design could be used because of the extensive<br />
road network that provided easy access to the entire<br />
region. In 1987, three foot surveys were carried out<br />
DIRECT COUNTS<br />
during the first weeks of February. April and May<br />
(late dry season). In 1988, only one foot survey was<br />
carried out in April. All transects were marked with a<br />
starter tag as well as a tag at the end of each transect.<br />
Walking the transects was done in essentially the same<br />
way as in the Lupande area in Zambia.<br />
6.5.3.2 Results<br />
<strong>The</strong> data collected on the three foot surveys carried<br />
out in 1987 were combined to give an elephant<br />
population estimate of 487±277 (n=35), using the<br />
Fourier Series estimator to determine the population<br />
density (Table 6.2). <strong>The</strong> single foot survey carried<br />
out in 1988 gave a population estimate of 306±646<br />
(n=7), using the Modified Hayne estimator (Table<br />
6.2). <strong>The</strong> combined estimate for 1987 is 33% higher<br />
than the result of the aerial census (100% coverage)<br />
carried out in 1989 (Table 6.2). <strong>The</strong> single foot survey,<br />
carried out in 1988, gave an estimate that was 16%<br />
lower than the result of the 1989 aerial census. <strong>The</strong><br />
larger sample size of the combined surveys gave a<br />
higher degree of precision compared to the single foot<br />
survey, but the estimate from the single foot survey<br />
was more accurate (Table 6.2).<br />
6.5.4 Discussion and conclusions<br />
Both the survey designs in Nazinga and Lupande used<br />
permanent transects that were covered three times and<br />
two times a year respectively, to increase the number<br />
of sightings and thus the precision of the final<br />
estimates (this does not include the single foot survey<br />
carried out in Nazinga in 1988). <strong>The</strong>re were, however,<br />
two major differences between the two survey<br />
designs: first, in Nazinga, the percent coverage was<br />
roughly six times higher than in the Lupande GMA<br />
and second, the infrastructure in Nazinga allowed the<br />
length of each transect to be determined exactly,<br />
whereas the use of pedometers in the Lupande area<br />
introduced an error of at least 5-10% in the estimate<br />
of the length of each transect. In addition, elephant<br />
densities in Nazinga were roughly three times higher<br />
than those in the Lupande area. Consequently, one<br />
would expect the population estimate obtained at<br />
Nazinga to be more precise (or have a narrower<br />
confidence interval) than that obtained in the Lupande<br />
GMA. This, however, was not the case! <strong>The</strong><br />
population estimate from Nazinga gave a standard<br />
error of 57% with 35 elephant groups detected,<br />
whereas the population estimate from Lupande gave<br />
a standard error of 46% with only 14 elephant groups<br />
detected. <strong>The</strong> explanation is that at Nazinga, during<br />
most of the dry season, the entire elephant population<br />
55
DIRECT COUNTS<br />
is compressed into an area of less than 400km 2<br />
(Jachmann 1989). In practice this means that during<br />
the foot surveys elephants were observed in only a<br />
few of the 30 transects covered, resulting in a<br />
population estimate with wide confidence intervals<br />
(low level of precision). What did we learn from<br />
this? If the survey in Nazinga was designed<br />
exclusively to count elephants, the appropriate<br />
thing to do was to stratify or divide the area into<br />
areas of high elephant density and low elephant<br />
density, using the detailed information available<br />
on seasonal elephant distribution (Jachmann<br />
1988b, 1989). <strong>The</strong> placing of transects in the<br />
resulting two strata should have been proportional<br />
to the elephant density (i.e., more transects in the<br />
high density area), considerably reducing the<br />
variance and therefore the confidence limits of the<br />
final estimate. In the Lupande area, however,<br />
elephants were more or less evenly distributed over<br />
the entire survey block and, if the aim of the survey<br />
had been to count elephants only, it would have<br />
been needless to stratify the area.<br />
When determining the statistical design of a linetransect<br />
study, (e.g. the desired level of sampling<br />
effort and its allocation over the study area as well<br />
as the duration of the study), in theory, we should<br />
carefully establish the number of transects<br />
required, the length of each transect, the placement<br />
of transects, and the frequency with which they<br />
should be surveyed. In practice, however, the<br />
available survey budget appears to be the single<br />
most important factor determining the survey<br />
design. In the Lupande GMA for instance, a<br />
coefficient of variance of 25% is realisable for<br />
some of the more common species, but not for the<br />
estimation of elephant densities.<br />
56<br />
<strong><strong>Elephant</strong>s</strong> occur at such low densities that a survey<br />
designed to obtain a coefficient of variance of 25%<br />
would require at least 50 observations. This would<br />
be very labour intensive and, above all, extremely<br />
expensive. For the Lupande GMA, the cost of a<br />
single survey is approximately US$2,500. <strong>The</strong><br />
elephant population estimates were derived from<br />
the data collected during two surveys, with a total<br />
cost of approximately US$5,000. If we set the<br />
acceptable level of precision at 25% (CV), we<br />
would need roughly four times the coverage of our<br />
previous two surveys, at a total expense of about<br />
US$20,000. Hence, the principle is to maintain a<br />
balance between the precision required for<br />
management purposes and the amount of labour, time<br />
and total costs involved to complete the exercise.<br />
References<br />
BUCKI.AND, ST. ANDERSON, D.R. BURNHAM K.P. & LAAKE J.L. (1993)<br />
Distance Sampling: Estimating Abundance of Biological Populations, Chapman<br />
& Hall, London & New York.<br />
BURNHAM K.P. ANDERSON. D.R. & LAAKE, J.L. (1980) Estimation of<br />
density from line transect sampling of biological populations. Wildlife<br />
Monographs 72, 1-202.<br />
JACHMANN. H. (1985s) Comparison of road and ground surveys of large<br />
mammals at the Nazinga Game Ranch Nazinga Special R ports, Series C, No.33<br />
JACHMANN. H. (1988b) Numbers, distribution and movements of the Nazinga<br />
elephants. Pachyderm 10, 16-21.<br />
JACHMANN. H. (1989) Nombre. Répartition et déplacements des éléphants<br />
de Nazinga Nature et Faune 5, 25-13.<br />
JACHMANN, H. 91) Evaluation of four survey methods for estimating elephant<br />
densities, <strong>African</strong> Journal of Ecology 29, 188-195.<br />
JACHMANN, H. (1992) Introduction to line-transect sampling 1992 population<br />
estimates and 1993 off-take quotas for the Lupande Game Management Area.<br />
LIRDP, Chipata Zambia<br />
NORTON-GRIFFITHS, M. (1978) Counting Animals. Handbooks on techniques<br />
currently used In <strong>African</strong> wildlife ecology No. 1. (Ed. J.J.R. Grimsdell). AWLF,<br />
Nairobi.
SECTION 3<br />
STUDYING POPULATIONS<br />
57
7.1 INTRODUCTION<br />
For anyone starting out to study an elephant population an<br />
essential question has to be asked first: what is the topic of<br />
study, or in other words, what does the researcher want to<br />
find out about these particular elephants? <strong>The</strong> answer will<br />
determine how well one has to know the population. If the<br />
goal is to find out how many elephants there are in a given<br />
area, or to find out how many and what their range is, or to<br />
find out the numbers, range, and what habitats they use<br />
within that range, or even the numbers, range, habitat use<br />
and feeding preferences, then the researcher might set out<br />
to study the elephants with methods involving aerial counts,<br />
radio tracking, ground transects and direct observation of<br />
feeding elephants. If, however, in addition to, or instead of,<br />
the above objectives, the researcher wants to describe the<br />
social structure, behaviour and demography of the study<br />
animals then he or she would have to get to know the<br />
members of the population on an individual basis.<br />
Individual recognition can be an important tool in any<br />
elephant study, and in this chapter I will cover the methods<br />
used to identify and catalogue individuals. But there are<br />
additional ways of knowing elephants and I will also discuss<br />
the techniques I have used for collecting a variety of data<br />
on individuals and groups of elephants.<br />
7.2 FIRST STEPS IN KNOWING A<br />
POPULATION<br />
7.2.1 How to find elephants<br />
Wherever your study area is, the best place to begin is with<br />
the local people, that is either with the people living in the<br />
area or, if it is a national park or reserve, with the wardens<br />
and rangers. Find out where elephants have been sighted,<br />
what trails they use, what drinking spots are favoured.<br />
Also ask people where they have seen elephant dung.<br />
58<br />
CHAPTER 7<br />
GETTING TO KNOW A POPULATION<br />
Cynthia Moss<br />
Amboseli <strong>Elephant</strong> Research Project<br />
<strong>African</strong> Wildlife Foundation<br />
P.O. Box 48177<br />
Nairobi<br />
Kenya<br />
Try to get an idea of the elephants’ daily movement<br />
patterns so that you will know where to expect to find<br />
them in the morning, midday and evening.<br />
If there have been any aerial counts carried out of your<br />
study animals, try to get copies of the maps with the<br />
sightings and numbers indicated. <strong>The</strong>se data will tell<br />
you for each count where elephants were seen on one<br />
day in one year under particular environmental<br />
conditions. But don’t expect the elephants to be in the<br />
same places when you set out. It is important to realise<br />
that elephants are very flexible in their behaviour; it is<br />
virtually impossible to say, “the elephants always come<br />
to such and such place at a particular time”. However,<br />
elephants are water-dependent, which in their case<br />
means that they have to drink, at the very least, every<br />
third day, but much more commonly, they drink every<br />
day. This water dependence can be a great aid to<br />
researchers, especially if water is restricted to only a<br />
few places in the study area. Find out where the water<br />
holes, springs, rivers, swamps, bore holes, wells, etc.<br />
are. If there are signs (dung, footprints) that elephants<br />
have used particular water sources, then start looking<br />
for your elephants in these areas.<br />
7.2.2 How to approach elephants<br />
Once you begin to get an idea of where the elephants<br />
can be found, the next step is approaching and observing<br />
them. This stage of the study is going to differ widely<br />
depending on the history of the elephants in the area<br />
and the habitat. <strong>The</strong> range of situations in Africa is<br />
extreme: from highly habituated elephants living in<br />
open, accessible terrain to very wary elephants living<br />
in thick forest.<br />
In the case of forest elephants, it will most likely be<br />
impossible to approach and observe them in the forest
itself. Rather, it is better to let them approach you.<br />
To do this a hide or blind can be set up in a clearing<br />
that elephants are known to frequent, say one<br />
where they obtain salt. For savanna elephants the<br />
logistics are usually less difficult and there are<br />
more choices.<br />
Depending on the status of the study area, there<br />
will be various ways to try to get near elephants<br />
living in non-forest habitats. If the research is<br />
being conducted in a national park with tourists<br />
present, you will probably be more or less<br />
restricted to a vehicle. On private land or<br />
communal land, research could be carried out on<br />
foot, but being on the ground is not necessarily an<br />
advantage. It can be dangerous, and you don’t have<br />
the benefit of height. An alternative could be to<br />
carry out some of the study from camel or<br />
horseback.<br />
Whatever form of transport you use, there are<br />
certain rules of approach which apply under almost<br />
all conditions. <strong><strong>Elephant</strong>s</strong> have mediocre eyesight,<br />
but good hearing and an excellent sense of smell.<br />
In most cases wind direction will be an important<br />
element. Except with the most habituated elephants<br />
in national parks, it will be best to approach the<br />
elephants with the wind coming from the elephants<br />
to you, that is downwind from them. If you are<br />
using a vehicle in an area where elephants run<br />
away at the sound of an engine, you will probably<br />
have to leave the vehicle some distance from the<br />
elephants and proceed on foot. In this case, you<br />
should have an experienced tracker or guide with<br />
you. Remember, elephants can move very fast; and<br />
if you are working in an area where they have been<br />
hunted, poached, or harassed they are more likely<br />
to charge.<br />
Let us assume for the moment that the elephants<br />
under study live in some sort of protected area and<br />
are partially habituated to vehicles. One of your<br />
aims is to have them get more and more used to<br />
you as your research progresses so that eventually<br />
you will be able to observe undisturbed elephants.<br />
<strong>The</strong> first months of your study will be important<br />
in establishing your relationship with your study<br />
animals. <strong>The</strong> key is to be as non-threatening as<br />
possible. Try to follow these important rules:<br />
i) Always approach elephants very slowly.<br />
ii) Do not try to get too close; as soon as the<br />
elephants start to turn or move away, stop and<br />
turn off your engine.<br />
GETTING TO KNOW A POPULATION<br />
iii) Do not approach elephants from behind their<br />
movement or behind their direction of<br />
orientation.<br />
iv) Whenever possible, make a large detour<br />
around a group and approach the elephants<br />
from an angle or head on or, better yet, stop<br />
and let them come to you.<br />
If you consistently approach elephants in this way<br />
they will gradually get accustomed to having you<br />
around and will soon realise that it is not worth<br />
the effort of moving away.<br />
In areas where elephants are prone to charging<br />
vehicles rather than running away, it is still<br />
important to use the above guidelines. In most<br />
cases I would suggest holding your ground when<br />
an elephant charges, especially if the elephant has<br />
displayed indecision by shuffling backwards or<br />
forwards or vocalising before it actually charges.<br />
<strong>The</strong> exception is with a bull in musth (see Chapter<br />
1) who might go through a whole set of<br />
demonstrations before charging. He may or may<br />
not follow through, but it is definitely best not to<br />
wait and find out. In a serious charge, an elephant<br />
simply puts its head down and attacks with no<br />
hesitation and often with no vocalisation. If the<br />
elephant is coming at you at full speed in what<br />
appears to be a serious charge, one technique to<br />
try to stop it is to reach your hand out the window<br />
and bang the side of the door, making as loud and<br />
sharp a sound as you can. This is a method taught<br />
to me by lain Douglas-Hamilton who has had a<br />
great deal of experience with charging elephants.<br />
For me it has worked every time. However,<br />
“discretion is the better part of valour” until you<br />
are very familiar with the elephants you are<br />
studying.<br />
Once again, depending on the goals of your study,<br />
at the beginning it is worth weighing the pros and<br />
cons of using intrusive, disturbing methods to<br />
collect data, such as darting and immobilising<br />
members of family groups for radio-collaring or<br />
taking blood samples. If you are not trying to<br />
habituate your study animals then there is no<br />
problem with using these methods, but if you are<br />
trying to gain the confidence of the elephants, you<br />
might find yourself erasing all the patient work<br />
you have carried out by suddenly changing your<br />
behaviour in attempting to dart them. <strong><strong>Elephant</strong>s</strong><br />
definitely have very long memories and one bad<br />
experience can make them wary of vehicles or even<br />
of individual researchers for years after.<br />
59
GETTING TO KNOW A POPULATION<br />
7.3 COLLECTING INFORMATION<br />
7.3.1 Baseline data<br />
From the very first day of your study you can start<br />
collecting data on the elephants, even those that are<br />
running away from you. In order to conform with<br />
other studies which are being carried out, I<br />
recommend collecting certain baseline data on every<br />
group or single individual that you encounter. In this<br />
way, the same information can be compared and<br />
contrasted for elephants across Africa.<br />
<strong>The</strong> baseline data are:<br />
i) Date, Time<br />
ii) Place<br />
iii) Habitat type<br />
iv) Activity<br />
v) Number in the group<br />
vi) Type of group (bull, cow/calf, mixed)<br />
<strong>The</strong> date and time need no explanation. For place<br />
you will have to decide how refined you want the<br />
sighting record. In Amboseli we use grid squares of<br />
1km 2 . <strong>The</strong> habitat type will depend on the study area,<br />
but there are broad guidelines for Africa (see Pratt et<br />
al. 1966). As soon as a group is sighted, note the<br />
activity that the majority of elephants in the group<br />
are exhibiting. In Amboseli we distinguish eight<br />
activities: moving while feeding, feeding, resting,<br />
comfort behaviour (dusting, scratching,<br />
mudwallowing, etc.), interacting, drinking, walking,<br />
standing, if there is no majority activity we code for<br />
that. <strong>The</strong>se activities are used for general sightings.<br />
In behavioural studies more categories would be used<br />
and the above eight would be broken down (See<br />
Chapter 10).<br />
<strong>The</strong> final two categories of baseline data, number in<br />
the group and type of group may sound<br />
straightforward but there are actually some problems<br />
and pitfalls in obtaining accurate information.<br />
7.3.2 Counting elephants<br />
<strong><strong>Elephant</strong>s</strong> are surprisingly difficult to count from the<br />
ground, even in open areas with good visibility. One<br />
would think that such large animals would be easy<br />
to count but it is their very size that causes the<br />
problem. <strong>The</strong> big ones block the observer’s view of<br />
the small and middle-sized ones. When elephants are<br />
moving in a clump it is virtually impossible to get an<br />
60<br />
accurate count. Even after 26 years of experience if<br />
I try to count a clumped group of over 10 elephants I<br />
will get three different totals if I count the group three<br />
times in a row.<br />
Of course, you can get an approximation of how<br />
many are in the group by counting several times, but<br />
in order to get an exact count you will have to wait<br />
until the group is spread out. <strong>The</strong> easiest group to<br />
count is one that is moving in single file. <strong>The</strong> next<br />
easiest is a group that is feeding. A resting group is<br />
difficult to count because small calves get lost in the<br />
middle.<br />
Whenever possible, watching elephants from a slight<br />
rise or better yet from a hill is a great help. One other<br />
aid is to wait for a group to cross a road and then<br />
count each individual as it crosses. However, if the<br />
group is moving fast and two or three are crossing at<br />
once, it will be difficult to get an exact count. When<br />
collecting data on group numbers it is best to have a<br />
qualifying code which indicates how accurate the<br />
count is. (In Amboseli we use: 0 = no count; 1 =<br />
poor or partial; 2 = good estimate; 3 = exact.) In this<br />
way when you come to analyse your data you will<br />
be able to take the quality of the count into<br />
consideration.<br />
One further problem which may arise in counting<br />
groups of elephants is trying to decide what a group<br />
is, in other words where the group begins and ends.<br />
This question may arise when there is a loose<br />
aggregation of elephants spread over an area. It may<br />
be difficult to decide if there is one large group<br />
present or two or three smaller groups. <strong>The</strong> definition<br />
of group that I use is: “any number of elephants<br />
moving together with no individual farther away than<br />
the distance that is equal to the diameter of the coordinated<br />
body of the group at its greatest point”<br />
(Moss 1983).<br />
7.3.3 <strong>Group</strong> Type and Composition<br />
<strong><strong>Elephant</strong>s</strong> are basically found in three types of<br />
groups: 1) all male groups, 2) cow/calf groups, and<br />
3) mixed groups (which are cow/calf groups with<br />
adult males present). Despite the fact that there is<br />
discernible sexual dimorphism in adult elephants,<br />
many people find it difficult to distinguish males from<br />
females.<br />
Before you even try to look at the elephant’s physical<br />
characteristics, there are some clues which will help<br />
you. Females are only very, very rarely found on their<br />
own. <strong>The</strong>refore, if you come upon a single animal it
is very likely to be a male. Second, cow/calf groups<br />
are made up of animals of different sizes from tiny<br />
calves standing only 85cm at the shoulder to large<br />
adult females standing up to 270cm. If you encounter<br />
a group that is fairly uniform in size with no small<br />
animals, it is probably all-male. Needless to say, you<br />
will have to confirm the sex and age composition<br />
before you record the type of group.<br />
7.4 DETERMINING SEX AND AGE<br />
7.4.1 Sexing elephants<br />
Adult elephants are strikingly sexually dimorphic in<br />
body size. Both male and female elephants grow<br />
throughout their lifetime but female growth levels<br />
off at around 25 years of age while male growth<br />
continues steadily (Laws & Parker 1968). By age 50<br />
a male might be 330cm to 360cm at the shoulder and<br />
weigh six or seven tons. Females rarely reach more<br />
than 270cm at the shoulder and may weigh<br />
GETTING TO KNOW A POPULATION<br />
approximately three tons at the same age. This<br />
difference in body size can be a useful aid in<br />
determining sex for the older adults.<br />
In addition, male tusk shape and weight is different<br />
from females. Males have much thicker and more<br />
tapering tusks than females whose tusks tend to be<br />
uniform in circumference until the tip. But more<br />
obvious is the size of male tusks compared to that of<br />
females. <strong>The</strong> largest male tusks ever recorded were<br />
100.8kg each; the largest females tusks were only<br />
29.7kg each.<br />
A further difference in appearance between males and<br />
females is in head shape. Males have rounded heads<br />
which are broader between the eyes. Females tend to<br />
have pointed heads and the area between the eyes is<br />
narrower (Fig 7.1a). <strong>The</strong>se characteristics are<br />
distinguishable even in calves.<br />
Just as in any other mammal, the final arbiter of<br />
determining sex is the external reproductive<br />
organs. <strong>The</strong> problem with elephants is that<br />
the genitals are not easily visible under most<br />
Fig. 7.1a: Male (left) and female (right) head shape differences: male is broader between the eyes and forehead slopes; female<br />
is narrow between the eyes and tusks, and forehead forms a sharper angle.<br />
61
GETTING TO KNOW A POPULATION<br />
circumstances and in most habitats. A male elephant<br />
has no external testicles and the penis is enclosed in<br />
a sheath (Fig 7.Ib). <strong>The</strong> female elephant’s vulva hangs<br />
low between the hind legs with the opening facing<br />
the ground unlike most ungulates whose vulva is just<br />
below the anus.<br />
Even when elephants are in short grass and their<br />
whole bodies are visible, it is not always easy to<br />
view the genitals because they are hidden by the<br />
legs for much of the time. <strong>The</strong> best way to see the<br />
genitals clearly is from behind. <strong>The</strong> male has a<br />
62<br />
ridge which runs down from the anus and in<br />
between the hind legs, emerging as the end of the<br />
sheath just in front of the hind legs. <strong>The</strong> female<br />
has folds which end in the squared off opening of<br />
the vulva (Fig. 7.2). When an elephant urinates it<br />
is usually obvious which sex it is, but sometimes<br />
the clitoris of a female calf can be mistaken for a<br />
penis.<br />
Adult females can also be distinguished by their<br />
mammary glands or breasts which are located<br />
between their front legs. An elephant has two<br />
Fig. 7.1b Male (above) and female (below) body shape differences: male underside slopes up towards front legs, penis sheath<br />
visible; female underside more parallel to ground, breasts on adults visible.
easts, each with one nipple. Male and female breasts<br />
look the same until a female becomes pregnant for<br />
the first time. <strong>The</strong>n the breasts begin to swell and<br />
grow and once a female has had a calf she will always<br />
have some breast development even when she is not<br />
suckling a calf.<br />
7.4.2 Ageing free-ranging elephants<br />
<strong>The</strong>re are several methods for ageing elephants,<br />
ranging from recording the births of individuals and<br />
thus absolutely knowing their age to rough estimates<br />
based on general appearance. Once again the type of<br />
study that is being planned will determine what<br />
methods will be used. For example, the Amboseli<br />
<strong>Elephant</strong> Research Project was always intended to<br />
be a long-term project with the goal of following the<br />
life history of each animal. By the beginning of 1994<br />
there were over 537 known-aged elephants in a<br />
population of 832, ranging from newborn calves to<br />
animals 22 years old.<br />
GETTING TO KNOW A POPULATION<br />
Fig. 7.2: Female (left) and male (right) from behind: female vulva squared off with opening facing ground, folds of skin from<br />
tail down to opening male has ridge that extends from below tail down in between the legs and forms sheath with<br />
opening facing forward. Note also that female body shape is more rounded and sides often extend beyond pelvis while<br />
male has a narrower shape.<br />
Birth registration along with individual recognition<br />
is the most accurate method of collecting demography<br />
data, but it will usually be important to estimate the<br />
age structure of the population in a time span of less<br />
than 30 or 40 years! Luckily for elephant researchers<br />
there are other methods available.<br />
Because elephants grow throughout their lifetime, the<br />
larger an elephant is, the older it is. Age estimates<br />
can be made based on shoulder height (Laws et al.<br />
1975; Lee & Moss 1995), back length (Laws 1969;<br />
Croze 1972) and footprint length (Western et al. 1983;<br />
Lee & Moss 1986; Lee &Moss 1995). Methods of<br />
measuring these parameters on live elephants can be<br />
found in the papers cited. Dead or immobilised<br />
elephants, of course, can be measured on the ground<br />
(see Chapter 18).<br />
Another method of ageing a dead elephant is by<br />
its teeth. During an elephant’s lifetime it acquires<br />
six sets of molars, each of which comes in at a<br />
certain age and wears down at a certain rate (See<br />
63
GETTING TO KNOW A POPULATION<br />
64<br />
BOX 7.1: ESTIMATING THE AGE OF ELEPHANTS USING MOLAR EVALUATION TECHNIQUES<br />
<strong>The</strong> age of an elephant can be determined by observing the stage of molar progression. <strong><strong>Elephant</strong>s</strong> develop six molars in each<br />
quadrant of their jaws during their lifetime. Each erupts at a certain age and wears at a particular rate. Two techniques have been<br />
developed for using molars to age elephants. Laws (1966) had used tooth eruption and wear to establish thrity age classes, while<br />
Sikes (1968) has used the number of lamellae or ridges on the tooth that disappear in the process of wear.<br />
Discrepancies in both methods have been pointed out by Jachmann (1988), who highlights the problems of the use of these molar<br />
evaluation techniques for ageing adolescent and mid-adult age classes, as well as the problem of variation between populations.<br />
Jachmann (1988) goes on to make some adjustments to Laws’ age classes, and stresses that the measurements of the length and<br />
width of a molar is sufficient to identify the correct molar number.<br />
Fig. 7.3: Diagram illustrating tooth measurements<br />
and terms (Source: Laws 1966).<br />
Molar number Molar length (cm.) Molar width (cm.)<br />
<strong>The</strong> method presented here is adapted from Laws’ method<br />
of ageing elephants using molars, and incorporates the<br />
adjustments made by Jachmann (1988).<br />
On finding the jaw of a dead elephant or in an<br />
immobilisation operation one should determine the number<br />
of molars that are present in the lower jaw of the elephant.<br />
One should then measure the length and width of the molar<br />
closest to the front of the mouth using calipers (see Fig.<br />
7.3). Compare the measurement of the tooth to those in<br />
Table 7.1 to identify the tooth as either M1, M2, M3, M4,<br />
M5 or M6.<br />
M1 1.0 - 4.0 1.3 - 2.0<br />
M2 5,0 - 7.0 2.5 - 4.0<br />
M3 9.5 - 14.0 3.9 - 5.2<br />
M4 13.0 - 17.5 5.0 - 6.8<br />
M5 17.5 - 22.5 5.9 - 8.5<br />
M6 22.0 - 31.0 6.4 - 9.4<br />
• If the molar length you measure falls into two molar number classes, (for example between M3 and M4 or<br />
between M5 and M6) then the molar width should be used to identify the correct molar number.<br />
• If the molar width you measure falls between two molar number classes, then the molar length should be<br />
usedtoidentify the correct molar number.<br />
• If both molar width and molar length fall between two molar classes, then the molar should belong to the<br />
molar class whose maximum width or length dimensions are closest to the measured dimensions.<br />
Having assigned the molar to one of these molar numbers, the identified molar should be examined for the extent<br />
of eruption and degree of wear. One should determine whether there were any previous teeth lost by looking for<br />
empty socket of the previous tooth. Using the group classes describes in Table 7.2 one can then determine the age<br />
of the elephant.<br />
Table 7.1: Molar length and width for molar numbers one through six (Manspeizer & Delelegn 1992).
<strong>Group</strong> Mean Description<br />
Class Age<br />
GETTING TO KNOW A POPULATION<br />
<strong>Group</strong> 0 No teeth worn, M1 protruding above bone; M2 lamellae fused; M3 forming.<br />
I<br />
<strong>Group</strong> 0.5 Slight wear, M1 and M3 protruding above bone; M3 forming.<br />
II<br />
<strong>Group</strong> 1 M1 well worn showing lozenges (anterior root eroded); M2 moderate wear showing III<br />
lozenges; M3 above bone, may be showing slight wear.<br />
<strong>Group</strong> 2+0.5 M1 lost, and no socket showing; M2 well worn, first two enamel loops may be confluent;<br />
IV M3 Worn to enamel of first two lamellae.<br />
<strong>Group</strong> 3+0.5 M2 well worn, anterior few lamellae lost; M3 well into wear, 5-6 enamel loops showing;<br />
V M4 Still within alveolus (see Fig 7.3).<br />
<strong>Group</strong> 4+1 M2 well worn, only 1-3 enamel loops remaining; M3 all except last lamella in wear: M4<br />
VI well Formed lamellae visible in alveolus, but unfused.<br />
<strong>Group</strong> 6+1 M2 Lost; M3 all lamellae in wear; M4 lamellae fused, first 4-5 lamellae in wear showing<br />
VII above bone, first 1-2 at gum level (stained), none in wear.<br />
<strong>Group</strong> 8+1 M3 first 2-3 lamellae loops confluent, anterior edge of tooth eroding; M4 alveolus not open.<br />
VIII<br />
<strong>Group</strong> 10+1 5 enamel loops of M4 showing. Socket of previous tooth in the anterior part of the M4 tooth<br />
IX visible.Second from last enamel loop on lamellae just starting to open. Alveoli of M5 visible<br />
behind M4.<br />
<strong>Group</strong> 12+1 M4 well worn in the anterior parts with the exception of lost lamellae beginning to wear.<br />
X M5 formed but fused without any wear.<br />
<strong>Group</strong> 14+1 M4 well worn on all the lamellae. M5 lamella just starting to open with little wear on first<br />
XI two enamel loops. First four lamellae visible and fused on M5.<br />
<strong>Group</strong> 16+1 Anterior edge of M4 eroded. Anterior 2-3 enamel loops confluent. M5 anterior lamellae fused and<br />
XII 5-6 visible. First 1-3 lamellae at gun level or just in wear.<br />
<strong>Group</strong> 18+1 M4 eroded and anterior few lamellae confluent. Enamel loops confluent. M5 anterior lamellae<br />
XIII visible (6-7). First 3-4 in wear and showing enamel loops.<br />
<strong>Group</strong> 20+1 M4 highly eroded and only two loops showing. <strong>The</strong> first enamel loop is confluent with<br />
XIV the second. M5 with 4-5 enamel loops visible. Last lamellae barely starting to wear.<br />
<strong>Group</strong> 22+1 M4 not visible; only socket seen. M5 first two enamel loops confluent. Five enamel loops visible<br />
XV on M5. Last lamellae barely showing wear.<br />
<strong>Group</strong> 24+2 M5 anterior part highly eroded. Third enamel loop beginning to form confluence with second<br />
XVI loop. Six fully developed enamel loops visible. Last amellae showing wear. M6 alveolus<br />
visible.<br />
<strong>Group</strong> 26+2 M5 last 7 enamel loops fully developed and visible. Enamel loops 4-6 confluent. M6<br />
XVII lamellae fused and visible. M6 lamellae not in wear. Alveoli of M6 present.<br />
65
GETTING TO KNOW A POPULATION<br />
<strong>Group</strong> 30+2 M5 last 6 enamel loops eroded. Anterior part highly eroded and confluent. M6 a nterior 1-2<br />
XVIII lamellae showing signs of wear. Rest of lamellae fused. Alveoli of M6 present but being closed<br />
out by M6 lamellae.<br />
<strong>Group</strong> 32+2 M5 erosion of anterior border, a few anterior lamellae are confluent and project as a shelf or have<br />
XIX broken off; M6 first 2-3 lamellae in wear, one or more enamel loops showing.<br />
<strong>Group</strong> 34+2 M5 nearly th same as in <strong>Group</strong> XIX; M6 has 3-4 enamel loops complete.<br />
XX<br />
<strong>Group</strong> 36+2 M5 only 5-6 enamel loops left; erosion of posterior border may have commenced; M6 had 5-6<br />
XXI enamel loops complete.<br />
<strong>Group</strong> 39+2 M5 socket only for 2-3 enamel loops remain; M6 has 8-9 enamel loops complete; no erosion of<br />
XXII anterior border. This and subsequent groups show no further development of alveoli.<br />
<strong>Group</strong> 43+2 M5 only socket remains; M6 last 2-3 lamellae not in wear, erosion of anterior border has begun.<br />
XXIII<br />
<strong>Group</strong> 45+2 M5 usually vestige of socket; M6 all except last lamellae in wear.<br />
XXIV<br />
<strong>Group</strong> 47+2 M6 erosion of anterior border, first 3-4 enamel loops confluent.<br />
XXV<br />
<strong>Group</strong> 49+2 M6 erosion of anterior border, first 3-4 enamel loops remain.<br />
XXVI<br />
<strong>Group</strong> 53+2 M6 anterior third of tooth missing, 6 complete enamel loops remain.<br />
XVII<br />
<strong>Group</strong> 55+4 M6 has only 4 complete enamel loops remaining.<br />
XVIII<br />
<strong>Group</strong> 57+ 4 M6 has 6 or less enamel loops remaining, all but 1 or 2 are confluent.<br />
XXIX<br />
<strong>Group</strong> 60+4 M6 less than about 15 cm of tooth remains rooted; remainder broken off or projecting as<br />
XXX a shell; all remaining enamel loops are confluent.<br />
Adapted from Laws (1966) and Jachmann (1988) by Manspeizer & Delellegn (1992).<br />
Table 7.2: Age group classes of the <strong>African</strong> elephant as defined by molar wear<br />
Box 7.1 and Laws 1966). By examining the lower<br />
jaw for tooth eruption and wear, an age can be<br />
assigned to the elephant at death. Sometimes an<br />
immobilised elephant’s teeth can be examined but<br />
this would not be a feasible method of getting an<br />
overall age structure for a population.<br />
For those Situations in which measurements cannot<br />
be taken, elephants can be assigned ages by visual<br />
assessment. With experience it is possible to estimate<br />
the ages of elephants by using a combination of<br />
66<br />
characteristics such as size, physical development,<br />
eruption of tusks, the length and circumference of<br />
tusks, and body shape and proportions (See Box 7.2<br />
for guidelines). Calves up to 10 years old are easy to<br />
age to ± one year, and elephants 10-20 years old can<br />
usually be assigned an age to ± two years. Individuals<br />
20 years and older are more difficult to age by eye,<br />
particularly females. Since males continue to grow<br />
in shoulder height and weight throughout their<br />
lifetime it is not difficult with experience to<br />
distinguish a 25-year-old from a 35-year-old, or a
BOX 7.2: GUIDE TO AGEING<br />
ZERO TO 10 YEARS OLD (MALES AND FEMALES)<br />
<strong>The</strong> calf sizes given below are relative to an adult female between 25 and 45 years old with a should height of about 250cm.<br />
Allowances have to be made for claves with younger or older mothers.<br />
AGE SHOULDER HEIGHT DEVELOPMENT<br />
Newborn Top of shoulder reaches lower Wrinkles Thin, stiff-legged; sometimes part of umbilical cord attached; whites<br />
below mother’selbow’; can easily walk of eyes often red; backs of ears bright pink; often hairy on head and<br />
beneath her back.<br />
2-3 weeks Same as above. Walking well’ more filled out in body’ backs of ears no longer pink;<br />
trunk is short and slender but exploring, picking up sticks.<br />
3-4 months Reaches to below point of mother’s elbow. More rounded, fatter, begins trying to feed on grass; spends time<br />
away from mother, plays with other calves.<br />
8-9 months Reaches elbow; can still pass under mother Feeding adeptly and continuously for long stretches; capable of<br />
but probably scraping. drinking with trunk.<br />
1 year Shoulder taller than breast level of mother, Head and ears look in proportion to each other and body.<br />
reaching to wrinkles above elbow.<br />
1-2 years Top of shoulder midway between elbow Trunk looks more in proportion; tusks of male calves may show<br />
and junction of leg withtorso, the “armpit”. beyond the lip from 18 months on (depending on region of (Africa).<br />
2-3 years Reaches mother’s armpit. Tusks of most male calves and many female calves will show;<br />
mother may show signs of trying to wean calf.<br />
3-4 years Top of shoulder above mother’s armpit; Almost all calves will show at least 5-7 cm of tusks; most calves<br />
backalmost level with anal flap and still suckling, but some may be weaned.<br />
reacheslower quarter of mother’s ear.<br />
4-5 years Reaches mother’s anal flap or above. Tusks are 15-18cm long; has probably Stopped suckling and<br />
may have a younger sibling.<br />
5-6 years Appears to be about one-quarter the size of Tusks area bout 20-23cm long; has probably male and female<br />
an adult female’ back almost level with behaviour become more pronounced: female calves allomother<br />
middle of mother’s ear. younger calves; male calves seek out other males for sparring.<br />
6-7 years Shoulder and back height above base of Tusks begin to splay out in both males and females; sexual<br />
mother’s tail and above middle of ear. differences discernable: males have thicker tusks and heavier<br />
bodies.<br />
7-8 years Back level with adult female’s eye Tusks are usually splayed by now; no longer Look calf-like,<br />
and well above base of tail. but more like a small adult.<br />
8-9 years Overall size in height and length Tusks are about 25-30cm.<br />
over half an adult female.<br />
GETTING TO KNOW A POPULATION<br />
9-10 years Overall size almost three quarters of an Males are larger than females of same age<br />
adult female. And spend more time on periphery of family;<br />
females are more integrated in family.<br />
67
GETTING TO KNOW A POPULATION<br />
35-year-old from a 50-year-old. In addition, not<br />
only does a bull continue to grow in shoulder<br />
height and in tusk circumference but his head gets<br />
larger across the forehead and at the base of the tusks,<br />
giving the head a more hour-glass appearance from a<br />
front view as he gets older (Poole 1989). Other<br />
characteristics such as the size of the head in relation<br />
to the body and the thickness of the neck and trunk<br />
can also be used as indicators of age in males.<br />
Females continue to grow slightly in shoulder height<br />
throughout their life but this is barely perceptible.<br />
(Laws & Parker 1968). However,females’ back length<br />
increases with age and this dimension has been used<br />
as a guide in estimating age (Laws 1969; Croze 1972).<br />
In addition, tusk circumference and length increase<br />
as females get older. Overall appearance is also an<br />
aid. Older females get bonier around the shoulders<br />
and head, and the tops of their ears fold down more<br />
and appear to be positioned lower in relation to the<br />
68<br />
10 AND ABOVE – SUGGESTED AGE CLASSES FOR FEMALES.<br />
10-15 years Thin tusks, probably still splayed rather than convergent; more square in body shape than<br />
older females who are rectangular.<br />
15-20 years Tusks begin to take on their adult configuration, that is convergent, straight, or asymmetrical<br />
with one higher than the other.<br />
20-35 years Circumference of tusks at base distinctly bigger than teenaged females.<br />
35-50 years Tusks marginally thicker; back has lengthened so that animal appears long in body.<br />
Over 50 years Hollow above the eyes, ears held lower, longer back length, sometimes long tusks.<br />
10 AND ABOVE – SUGGESTED AGE CLASSES FOR MALES<br />
10-15 years Male head shape (sloping rather than angular) more noticeable; tusk circumference and<br />
should height greater than females of same age.<br />
15-20 years At about 17 years old males reach same height as largest adult females over 40.<br />
20-25 years Taller than all adult females; but most still slender and narrow in the head compared to<br />
older males.<br />
25-40 years At about 25 years old male head shape has changed to an hour glass shape, that is wide at<br />
eyes and wide at base of tusks; the head gets broader as it moves through this age class;<br />
shoulder height increases steadily.<br />
Over 40 years Very big, tower over largest females by three feet or more at shoulder; neck thick; overall<br />
body heavy set; tusk circumference at lip strikingly greater than younger males and all females.<br />
head and shoulders than those of younger females<br />
(Moss 1988).<br />
In Amboseli we have assigned each animal a known<br />
or estimated year of birth. For purposes of analysis<br />
we have used the following age classes:<br />
0A 0-4.9 years<br />
0B 5-9.9<br />
1A 10-14.9<br />
1B 15-19.9<br />
2 20-24.9<br />
3 25-34.9<br />
4 35-49.9<br />
5 50+<br />
For surveys in other areas and for workers trying to<br />
attain an age structure for shorter term studies, I<br />
suggest using five-year age classes up to 20 and above<br />
that age using 15-year classes. Thus Class 2 would<br />
become 20-34.9, Class 3,35-49.9 and Class 4,50+.
7.5 INDIVIDUAL RECOGNITION<br />
7.5.1 Why use individual<br />
recognition?<br />
<strong>The</strong>re are many aspects of elephant ecology and<br />
behaviour that would be difficult or simply<br />
impossible to study without knowing individuals.<br />
Let’s take some examples. Say you wanted to<br />
understand the distribution and association patterns<br />
of elephants over a given range. You could go out on<br />
your first day and start recording numbers and<br />
locations of elephants at various places and times.<br />
<strong>The</strong> first group you sighted might consist of 12<br />
animals feeding in quadrat A-5. <strong>The</strong> second day you<br />
might to see a group of 12 in A-5 again, but you could<br />
not say if they were the same 12 animals, or whether<br />
five were the same and seven were different. Without<br />
knowing individuals, you could not begin to collect<br />
data which would show either consistency or fluidity<br />
in group composition, nor could you say anything<br />
about the ranging patterns of individuals or groups.<br />
Now say you are studying social behaviour. What<br />
could you record about the behaviour of those 12<br />
animals in the group you saw on Day l other than<br />
that they were in a group of a certain size and that<br />
they exhibited certain behaviours which you<br />
observed. In order to say something about who was<br />
affiliated with whom or who was dominant to whom,<br />
you would have to know them as individuals. <strong>The</strong>n<br />
you could carry out the kinds of studies described in<br />
Chapter 10.<br />
If the purpose of your study is to track the<br />
population’s demography over time, there is no better<br />
way to get a complete and accurate picture than<br />
collecting data on birth rates, mortalities, interbirth<br />
intervals, age at sexual maturity, etc. for known<br />
individuals.<br />
7.5.2 When is it appropriate to use<br />
individual recognition as a<br />
technique?<br />
It is all well and good to explain why knowing<br />
individuals is important, but it is not always practical<br />
to attempt to do so. If the study population is very<br />
large, say over 2,000, then it would be very difficult<br />
to try to get to know every individual. In some cases<br />
it might be better to learn to identify just the adults<br />
GETTING TO KNOW A POPULATION<br />
or maybe just one or two adults from each family<br />
unit and maybe only the large adult bulls. <strong>The</strong>n too,<br />
if the habitat is a difficult one in which to observe<br />
elephants, such as forest or thick bush, it might not<br />
be worthwhile to try to use the recognition method.<br />
When designing your study questions and topics, it<br />
will be important to be realistic about what you can<br />
and cannot do under the particular conditions in your<br />
study site. If individual recognition is feasible and it<br />
will help you answer some of your questions then it<br />
is definitely worthwhile.<br />
7.5.3 What makes an elephant<br />
identifiable?<br />
No two elephants are alike, and once a researcher<br />
starts watching elephants and trying to distinguish<br />
one from another, he or she will begin to see the<br />
variety of individual characteristics: size and shape<br />
of the body and tusks, posture and way of moving,<br />
relative proportions (i.e. long legs, big head, small<br />
ears, etc.). Eventually one can recognise an elephant<br />
in the same way that one recognises a friend walking<br />
away on the other side of a Street. However, an<br />
absolutely positive means of identification is<br />
necessary as well as this more generalized “gestalt”<br />
recognition.<br />
lain Douglas-Hamilton (1972) pioneered a reliable<br />
method of recognising individual elephants by their<br />
ears, and this method is now widely used in elephant<br />
studies throughout Africa. <strong>The</strong> patterns on the ears<br />
make each elephant unique and actually very easy to<br />
recognise. <strong><strong>Elephant</strong>s</strong> usually have holes, nicks, and<br />
tears on the edges of the ears. In addition, the veins<br />
in the ears are often prominent and the pattern they<br />
form is unique, as precise a means of identification<br />
as human fingerprints, and a lot easier to see. A<br />
combination of nicks and holes and vein patterns<br />
guarantees accurate identification, once a good<br />
photograph has been taken.<br />
7.5.4 Where to start<br />
As described earlier, elephants can be found in three<br />
kinds of groups. <strong>The</strong> best place to start is with these<br />
groups, taking into account what type they are.<br />
a) Single bull or all-bull group<br />
In this case, an attempt should be made to identify<br />
all the individuals. Note the number in the group and<br />
69
GETTING TO KNOW A POPULATION<br />
the relative ages. <strong>The</strong>n look for striking individual<br />
characteristics such as:<br />
70<br />
i) Tusklessness<br />
ii) One-tuskedness<br />
iii) Broken tusks<br />
iv) Large holes or tears in ears<br />
v) Broken ears<br />
vi) Scar tissue on body<br />
vii) Deformities and injuries, e.g. missing trunk<br />
tip, no tail<br />
Try to make a note and possibly a drawing for each<br />
individual. For example your note might read: “large<br />
bull, class 3 or 4, with broken right tusk and V-shaped<br />
nick out of lower left ear”. <strong>The</strong> next step is to start taking<br />
photographs, which is covered in more detail below.<br />
b) Cow/calf groups<br />
This type of group can initially be treated in a different<br />
way from an all-bull group. Rather than trying to identify<br />
every individual, your immediate goal should be to try<br />
to distinguish only the adult females. You can work on<br />
the calves later if they are a necessary part of your study.<br />
Once again the notes that you take will be very<br />
important. Start by noting how many animals there are<br />
in the group and then break it down into ages: how<br />
many adults, how many calves and roughly of what<br />
ages. Find the adult females and note down any<br />
outstanding characteristics in the same way as with the<br />
bulls, such as tusklessness, big holes or nicks in the<br />
ears, etc. <strong>The</strong>n start taking photographs.<br />
7.5.5 Photographing elephants<br />
l recommend photographs over drawings because<br />
drawings cannot show the finer details of the vein<br />
patterns on the ears. l also recommend black and white<br />
film over colour film because l have found that there is<br />
much sharper detail in the prints. l use either Kodak<br />
Tri-X 400 ASA or Fuji 400 ASA. <strong>The</strong>se are fast films<br />
which can be used even in fading light.<br />
A good 35mm camera with a zoom lens in the range of<br />
80-200mm or l00-300mm is essential. If individual<br />
recognition is going to be attempted in areas where it is<br />
difficult to get close to elephants, then a lens of up to<br />
600mm may be required. However, in using a long lens<br />
it will be necessary to use a tripod, monopod, or at the<br />
very least, a bean bag rested on a vehicle door to ensure<br />
sharp prints. Even with a shorter, lighter lens l<br />
recommend steadying the camera with one of the above<br />
methods or by resting it against the door or window<br />
frame if you are in a vehicle. <strong>The</strong> sharper the photograph<br />
the better.<br />
Taking good black and white photographs is actually<br />
more difficult than working in colour. Light is extremely<br />
important. <strong>The</strong> best conditions for getting optimal<br />
contrast for highlighting the holes, nicks, bumps and<br />
vein patterns is in slight crosslighting, that is when the<br />
sun is to one side but shining on the ear. However, l<br />
hasten to add that usually you will be having a hard<br />
enough time just getting the elephant in frame, so the<br />
refinement of the lighting is something of a luxury.<br />
Nevertheless, there is no point in taking a photograph<br />
in poor light, such as when the elephant is backlit, that<br />
is when the elephant is between you and the sun.<br />
<strong>The</strong> goal is to get the head, ears and tusks in the picture.<br />
When photographing an elephant that is side-on to you,<br />
wait until the ear is flat against the neck and shoulder<br />
and be sure you can see the holes and nicks through the<br />
viewfinder. Your own eye will tell you what the best<br />
angle and light is. If you have time take more than one<br />
frame of each ear. If you are photographing with the<br />
elephant against the sky l recommend opening up half<br />
a stop, that is overexposing slightly. <strong>The</strong> light meter<br />
will be balancing the bright sky with the dark elephant,<br />
but you may have to override what it registers, to be<br />
sure that the elephant is not underexposed. Most cameras<br />
can be set to over- or under expose automatically by<br />
however many stops you require.<br />
Ideally, for each individual you will want three<br />
photographs: one of the left ear and tusk, one of the<br />
right ear and tusk, and one head-on showing the tusk<br />
configuration. If you are close enough, focus in on the<br />
head and tusks only, but if you are farther away just<br />
take the whole elephant. Later on, in the printing you<br />
can blow up the head and tusks. If the elephant has scar<br />
tissue, lumps, deformities or oddities in body shape then<br />
you might want to photograph the whole body.<br />
Probably the most important aspect of taking ID photos<br />
is the note-taking. <strong>The</strong>re is little point in taking dozens<br />
of photographs of a group and then later trying to sort<br />
out which left ear goes with which right one. It is far<br />
better to make a note for every frame taken. <strong>The</strong><br />
following is an example of the method l use:<br />
(Before photographing you would have recorded all the<br />
basic sighting data and then the group size and<br />
composition and any striking characteristics of<br />
individuals, perhaps even making one or two drawings<br />
of ear patterns.) Let us assume that this family had four<br />
adult females. Until they are registered they will simply<br />
be called F (for female) l through 4:
Film #26<br />
2 pics right ear of largest<br />
female—Fl, right tusk<br />
higher, lump on right<br />
shoulder 1-2<br />
l pic left of - 15 yr.<br />
old—F2, with large V nick<br />
in right ear 3<br />
2 pics left of F3—-20-2Syr<br />
old, even convergent tusks<br />
with first-year calf 4.5<br />
l head-on of F4—35-44) yr<br />
old, left one-tusk 6<br />
This might be all you can get on this occasion, but<br />
you would be doing very well to have photographed<br />
all four of the adult females. On the next encounter<br />
you would try to get the other ears and head-on<br />
photographs of the individuals to complete the IDs.<br />
7.5.6 Setting up recognition files<br />
In Amboseli each elephant above the age of about<br />
eight years old has an identity card with its<br />
photographs pasted on it. <strong>The</strong> photograph number<br />
(roll number, plus frame number.) and the date the<br />
photograph was taken are marked under each photo.<br />
This system of indexing ensures that duplicates can<br />
be readily produced from the negatives and provides<br />
a means of matching each photo with the field notes<br />
recorded at the time. Additional information on the<br />
card should include the animal’s name or number,<br />
its estimated or known birth date, its mother if known,<br />
its family if known, the area it tends to be found in;<br />
and, in the case of an adult female, her offspring and<br />
their years of birth. It might also be helpful to include<br />
information on where and when the animal was first<br />
seen. If you will be dealing with a large population<br />
and do not expect to resight individuals often, you<br />
could include each sighting of the individual on the<br />
back of the card.<br />
BOX 7.3: MEASURING ELEPHANTS AND ASSESSING GROWTH<br />
GETTING TO KNOW A POPULATION<br />
Because cows and calves and bulls are found in<br />
different social contexts, it is useful to have<br />
different filing systems for them. Since adult,<br />
independent bulls live in loose, fluid groupings and<br />
are often found on their own, and also might travel<br />
widely, a bull simply has to be recognised by his<br />
own characteristics. We have found that filing them<br />
by size, and therefore age class, is the most helpful<br />
system.<br />
Females and their calves live in more or less stable<br />
family groups, which is a great aid to identification. <strong>The</strong>re<br />
are many clues that the family can give you before you<br />
even identify the first individual. First the number and<br />
composition of the group might help, then the area the<br />
group is found in may add another piece to the puzzle; and<br />
even the behaviour of the members, whether they run away<br />
or are tolerant, might be suggestive of who they are. But<br />
of course, ultimately you will have to look at their ears and<br />
tusks and body characteristics to identify the individuals.<br />
If you can recognise one adult female, the chances of<br />
identifying the others are much improved. For this reason<br />
it is generally best to file the recognition cards by family<br />
rather than by age or ear characteristics. Thus once you<br />
find the card for the known individual and then look through<br />
the cards for the other family members, you should be<br />
able to identify the other adults fairly quickly. Needless to<br />
say, you cannot assume that the others are present or that<br />
there are no new ones there.<br />
7.6 SETTING UP LONG-TERM<br />
<strong>The</strong> final step in setting out to study an elephant<br />
population is a carefully thought-out plan for how to<br />
keep the records. <strong>The</strong> types and topic of your study<br />
will determine how you will design the data base.<br />
You will save youeself much tedious work and<br />
dissapointment if the record-keeping is efficient and<br />
flexible. A computer is probably essential in most<br />
cases, but where one is not available good check sheets<br />
(see Chapter 10) and other t kinds of record sheets on<br />
which tabulations can easily be made are invaluable.<br />
Studies of elephants frequently depend on assessments of size to reconstruct the age structure of the population,<br />
but the determination of size is a considerable problem. A variety of direct measures of stature and weight, as<br />
well as a number of techniques for non-invasive assessment, have been attempted.<br />
Stature measures show considerable differences between populations (Table 7.3). A number of studies have<br />
measured shoulder height in wild <strong>African</strong> elephants, using a variety of photographic techniques (Douglas-Hamilton<br />
1972; Croze 1972; Jachmann 1988; Lee & Moss 1995). <strong>The</strong>se techniques rely on using either a reference height<br />
during photographing, or measuring the distance to the elephant for a known lens focal length. One rather<br />
complex method is to use stereo-photos (e.g. Douglas-Hamilton 1972) and another more simple one is to take a<br />
71
GETTING TO KNOW A POPULATION<br />
72<br />
picture of an animal from a specific site, wait until it has moved on, then place a measuring pole in the front foot<br />
impression and take a second identical picture of the pole. <strong>The</strong> elephant as measured on the photograph can then be<br />
compared with the pole measures on the second photograph (Western et al. 1983). Jachmann (1985) measured from<br />
the camera to the elephant’s position, with a known focal length. Another similar technique is to use a lens with a fixed<br />
digital caliper to accurately measure lens extension (invented for whales, Jacobsen 1991) to photograph the elephant.<br />
<strong>The</strong> extensions are calibrated against known pole heights and a simple linear formula then can be derived for relating<br />
the extension recorded in the field when photographing the elephants to the distance measured on the print. Photographic<br />
techniques are quick and relatively accurate, although expensive in terms of film. Another statural measure that gives<br />
reliable information about size and age is that of backlength. This can be recorded in the same way as shoulder height,<br />
and such measures can also be made from an aeroplane traveling at a specific height (Croze 1972). Again, some<br />
calibration against a known measure must be made for each flight and height. <strong>The</strong> differences between measures of<br />
total head to anal flap backlength and scapula to anal flap backlength appear to be relatively unimportant (Lindeque &<br />
van Jaarsveld 1993), and both give reliable indices of overall size.<br />
MALES FEMALES<br />
AFRICA<br />
Uganda<br />
Murchison 317 274 Laws 1966, Laws et al. 1975<br />
Murchison South 307 252 “<br />
Queen Elizabeth<br />
Kenya<br />
298 252 “<br />
Tsavo nd 272 Laws 1966<br />
Amboseli<br />
Malawi<br />
304 232 Lee & Moss 1995<br />
Kasungu<br />
Zambia<br />
295 252 Jachmann, in Lindeque & Jarrsveld 1993<br />
Luangwa<br />
Zimbabwe<br />
375 250 Hanks 1972<br />
Hwange<br />
Namibia<br />
350 300 Haynes 1991<br />
Etosha<br />
ASIA<br />
Tamil Nadu/Madras<br />
345 262 Lindeque & van Jaarsveld 1993<br />
Captive 258 231<br />
Wild Born 273 240 Sukumar, Joshi & Krishnamurthy 1988<br />
Table 7.3: Measures of asymptotic or maximum shoulder height among adult elephants in different populations.<br />
It is also possible to estimate stature indirectly, especially in populations living in areas where a good impression of the<br />
hind footprint length can be obtained. Hind footprint length is known to relate to shoulder height and age in <strong>African</strong><br />
elephants and thus can be used to assess age distributions in a population as well as overall size of the animals (Western<br />
et al. 1983). This measure can be reliably determined, and is easily replicated across observers. <strong>The</strong> length from the<br />
hell of the foot through to the arch (rather than the tip) of the toe is made on footprints which are clearly visible and not<br />
in deep soil, mud or sand. One easy means to check for the effect of the substrate is to measure the observer’s footprint<br />
over a number of paces. <strong>The</strong>se can be compared with the length of the shoe and some idea of error introduced by<br />
substrate and walking can be assessed. It is then necessary to ensure that measures of elephant footprints are only<br />
made in substrates that do not distort the measurement. Several footprints from the same animal should be measured<br />
to ensure reliability.<br />
<strong>The</strong> relationship between footprints and age have only been determined for one population of known aged <strong>African</strong><br />
elephants (Lee & Moss 1986, Poole 1989). Since there could be inter-population variation, these measures may only<br />
be a rough guide. As a general rule, animals with foot prints of less than 25 cm are under five years old, while those<br />
over 50 cm are large bulls of 30+ years (figure 7.4). Bulls have a larger footprint length than do females at all ages over<br />
five, and their inclusion will distort any population age profiles, unless the sex of the animal is known when the<br />
measurement is taken.<br />
<strong>The</strong> relations between shoulder height and footprint appear to follow a linear relationship (Western et al.<br />
1983; Lee & Moss 1995). <strong>The</strong> shoulder height increases at roughly six times footprint length. Thus footprint
Figures 7.4: <strong>The</strong> mean footprint length for age, with standard deviations, for 1668 male and 204<br />
female <strong>African</strong> elephants in Amboseli National Park, Kenya. Data from P.C. Lee &<br />
C.J. Moss 1995.<br />
Length can be used to estimate both size and age. For Asian elephants, the standard measure has been to use the<br />
circumference of the front foot, which predicts should height as 2.03 multiplied by the foot circumference (Sukumar<br />
et al. 1988). However, this measure can only reliably be determined from tame or captive animals, and thus is of<br />
limited use in field studies.<br />
Comparable measures of size can be taken from dead or immobilized animals, with the understanding that shoulder<br />
height may be larger than standing height due to compression while upright, and that foot sizes may be hard to<br />
accurately determine when the foot is not placed flat against the ground.<br />
Determination of age is essential when attempting to assess growth. Most studies rely on a large cross-sectional<br />
sample, since longitudinal growth is typically difficult to assess. Longitudinal growth measures are, however,<br />
currently available from <strong>African</strong> elephants only in one study of five wild animals who were immobilized to fit<br />
radio-collars (Lindeque and van Jarsveld 19930, and some other data are available from a small sample of captive<br />
animals (Laws 1966; Hanks 1972; lang 1980). For Asian elephants, both longitudinal and cross-sectional growth<br />
have been assessed of the different growth curves available, and their results suggest that the use of the three<br />
standard curves, Von Bertalanffy, Gompertz and logistic, provide similar results in assessing rates of growth,<br />
especially for the post-weaning ages (five years onwards). <strong>The</strong>y note that using non-linear curve fitting techniques<br />
produce more accurate growth curves than do methods of linearisation.<br />
<strong>The</strong> three most frequently used equations for sigmoidal curves are presented below. A further curve without a<br />
sigmoidal function, an asymptotic exponential curve, can also be used. <strong>The</strong>se curves assume that growth over the<br />
separate measurement intervals is linear, but there are few other options for describing curves.<br />
Con Bertalanffy: L t = L as [1 - e - k(t - t 0 ) ] (size)<br />
W t = W as [1 - e - k(t - t 0 ) ] 3 (mass)<br />
Gompertz: L t = L as . b rt<br />
Logistic: L t = L as / 1 + b r t<br />
Asymptotic: L t = L as - b (e - kt )<br />
GETTING TO KNOW A POPULATION<br />
L t = length at time (t); L as = asymptotic length, K = rate constant, b = an empirically derived constant, r = rate<br />
function for time (t). Full details can be found in Zullinger et al. (1984) and Lindeque & van Jaarsveld (1993).<br />
P.C. Lee, University of Cambridge, Department of Biological Anthropology, Downing Street, Cambridge, U.K.<br />
73
GETTING TO KNOW A POPULATION<br />
l highly recommend at the outset consulting with<br />
researchers working on elephants and other mammals<br />
in Africa so that at least part of the data base that you<br />
create will conform to an Africa-wide model. Ideally<br />
we should aim for a network of information on elephant<br />
populations that can easily be compared and<br />
contrasted.<br />
References<br />
CROZE, H. (1972) A modified photogrametric technique for assessing age<br />
structures of elephant populations and its use in Kidepo National Park. East<br />
<strong>African</strong> Wildlife Journal 1O 91-115.<br />
DOUGALS-HAMILTON, I. (1972) On the ecology and behaviour of the <strong>African</strong><br />
elephant D. Phil. <strong>The</strong>sis. University of Oxford, U.K. 268pp.<br />
HANKS, J. (1972) Growth of the <strong>African</strong> elephants (Loxodonta africana). East<br />
<strong>African</strong> Wildlife Journal 10: 251-272.<br />
HAYNES, G. (1991) Mammoths, Mastodonts, and <strong><strong>Elephant</strong>s</strong>, Cambridge<br />
University Press, Cambridge.<br />
JACHMANN, H. (1985) Estimating age in <strong>African</strong> elephants. <strong>African</strong> Journal<br />
of Ecology 23: 199-202.<br />
JACHMANN, H. (1988) Estimating age in <strong>African</strong> elephants: a revision n of<br />
Laws’ molar evaluation technique. Africa journal of Ecology 22: 51-56.<br />
JACOBSEN, J. (1991) Photoscale 2: A photogrammetric method for<br />
measuring the distance to an object and the size of that object. Published by<br />
Author, Arcata, C.A.<br />
LANG, EM. (1980) Observations on growth sod molar change in the <strong>African</strong><br />
elephant. <strong>African</strong> Journal of Ecology 18: 217-234.<br />
LAWS, R.M. (1966) Age criteria for the <strong>African</strong> elephant, Loxodonta africanas.<br />
East <strong>African</strong> Wildlife Journals 4, 1-37.<br />
LAWS R.M. (1969) <strong>The</strong> Tsavo Research Project Journal of Reproduction and<br />
Fertility, Supplement 6: 495-531.<br />
LAWS, R.M. & PARKER I.S.C. (1968) Recent studies on elephant populations<br />
in East Africa. Symposium of the Zoological Society of London 20, 319-359<br />
74<br />
.<br />
LAWS. R.M., PARKER I.S.C. & JOHNSTONE, R.C.B. (1975) <strong><strong>Elephant</strong>s</strong> and<br />
their habitats: <strong>The</strong> ecology of elephants in North Bunyoro, Uganda. Clarendon<br />
Press, Oxford. 376pp.<br />
LEE. P.C. & MOSS, C.J. (1986) Early maternal investment in male and female<br />
<strong>African</strong> elephant calves. Behavioural Ecology and Sociobiology 18, 353-361.<br />
LEE, P.C. & MOSS, C.J. (1995) Structural growth in known-age <strong>African</strong><br />
elephants:(Loxodonta africana). Journal of Zoology London 236, 29-41.<br />
LINDIQUE, M. & VAN JAARSVELD. A.S (1993) Post natal growth of<br />
elephants Loxodonta africanas in Etosha National Park, Namibia. Journal of<br />
Zoology, London 229: 319-030.<br />
MANSPEIZER, I. & DELELLEGN, Y. (1992) Ethiopian <strong>Elephant</strong> Conservation<br />
Development Programme Field Manual. Ethiopian Wildlife Conservation<br />
Organisation.<br />
MOSS, C.J. (1983) Oestrous behaviour and female choice in the <strong>African</strong> elephant<br />
Behaviour 86, 167-96.<br />
MOSS, C.J. (1988) <strong>Elephant</strong> Memories. Thirteen years loan the life of an<br />
elephant family. William Morrow and Company, New York. 336pp.<br />
MOSS, C.J. (1990) <strong><strong>Elephant</strong>s</strong> in Tarangire. Pachyderm 13, 26-30.<br />
POOLE, J.H. (1989) <strong>The</strong> effects of poaching on the age structure and social<br />
and reproductive patterns of selected East <strong>African</strong> elephant populations. <strong>The</strong><br />
Ivory Trade and the Future of the <strong>African</strong> <strong>Elephant</strong>, Ivory Trade Review <strong>Group</strong>,<br />
Report No. 2<br />
POOLE, J.H. (1989) Announcing intent: the aggressive stats of musth in <strong>African</strong><br />
elephants. Animal Behaviour 37:140-152.<br />
PRATT, D.J., GREENWAY, P.J. & GWYNNE, M.D. (1966) A classification of<br />
East <strong>African</strong> rangeland. Journal of Applied Ecology 3, 369-382.<br />
SIKES S.K. (1968) <strong>The</strong> <strong>African</strong> elephant, Loxodonta africana a field method<br />
for estimating age. Journal of Zoology. London 154, 235-248.<br />
SUKUMAR, R., JOSHI, N.V. & KRISHNAMURTHY, V. (1988) Growth in<br />
the Asian elephant. Proceedings of the Indian Academy of Science (Animal<br />
Science) 97: 561-571.<br />
WESTERN, D., MOSS, C.J. & GEORGIADIS, N. (1983) Age estimation and<br />
population age structure of elephants: from footprint dimensions. Journal of<br />
Wildlife Management 47(4), 1192-1197.<br />
ZULLINGER, E.M., RICKLEFS, R.E., REDFORD, K.E. & MACE, G. M.<br />
(1984) Fitting sigmoidal equations to mammalian growth curves. Journal of<br />
Mammalogy 65: 607-636.
8.1 INTRODUCTION<br />
<strong>The</strong> movements of elephants and related species like<br />
mammoths must have been pondered upon almost<br />
since primitive man first began to hunt them. Ivory<br />
hunters such as William Bell (1923), returned to<br />
hunting grounds that had been productive in earlier<br />
safaris only to find that their quarry was no longer<br />
there. Today an understanding of the movements of<br />
elephants is important as wild areas have diminished<br />
and the survival of elephants has become dependent<br />
upon the establishment of relatively small<br />
conservation areas which will have to be adequate<br />
for elephant conservation for many hundreds of years<br />
into the future.<br />
8.2 WHY STUDY ELEPHANT<br />
MOVEMENTS?<br />
A knowledge of elephant movements can answer a wide<br />
range of questions relevant to their general ecology and<br />
thereby to their long-term conservation and<br />
management. Some of the areas one could look at are:<br />
a) Home range<br />
In many respects, the size of an elephant’s home range<br />
is an indication of the availability of essential resources,<br />
restrictions imposed by the size of the respective<br />
conservation area (where applicable), and the degree<br />
of disturbance (perhaps man-induced) to which the<br />
animal is exposed. Where water and food are abundant<br />
and disturbance is minimal, it can be expected that home<br />
ranges will be small. For example, in the Kruger<br />
National Park home ranges have been shown to be<br />
relatively small at a calculated mean of 909km 2 (Whyte<br />
1993) while in a more arid environment in Namibia,<br />
they tend to be much larger at a calculated mean of<br />
between 5,860km 2 and 8,693km 2 (Lindeque &<br />
Lindeque 1991), presumably as elephants in this<br />
CHAPTER 8<br />
STUDYING ELEPHANT MOVEMENTS<br />
I.J.Whyte<br />
National Parks Board<br />
Kruger National Park<br />
Private Bag X402<br />
Skukuza 1350. South Africa<br />
environment need to be more mobile and opportunistic,<br />
due to limited availability of food and water. This basic<br />
information can give important clues to the avenues<br />
future research should take.<br />
In some instances, conservation areas (or the ranges<br />
of elephants) extend across international boundaries,<br />
and an understanding of the movements is important<br />
to the relevant conservation authorities in order to<br />
synchronise census work, co-ordinate management<br />
plans, etc. An example of this is the contiguous<br />
elephant range which extends from southern Angola<br />
and northern Namibia through south-western Zambia<br />
and northern Botswana into western Zimbabwe<br />
(Douglas-Hamilton et al. 1992). <strong>The</strong> movements of<br />
the elephants herein are not well understood and, as<br />
a result, the size of the total population is not<br />
accurately known. An understanding of the<br />
movements across these international boundaries<br />
would contribute greatly to the development of a<br />
conservation plan for the population as a whole.<br />
b) Seasonal or periodic long distance movements<br />
This is an aspect which falls within the realms of a<br />
normal home-range study, but also movements of<br />
this nature indicate areas which may be of vital<br />
importance to the long-term conservation of that<br />
population, and which may (in some cases) lie<br />
outside of conservation areas. Moss (1988) and<br />
Lindeque and Lindeque (1991) describe areas of this<br />
sort outside the Amboseli and Etosha National Parks<br />
respectively.<br />
c) Dynamic relationships between darts, herds<br />
and individuals<br />
This is an aspect which may not be of direct<br />
management importance but is of importance in<br />
understanding elephants and their ecology <strong>The</strong><br />
relationships that have so painstakingly been<br />
75
MOVEMENTS<br />
unravelled through classic studies like those of Moss<br />
(1988) would be far less meaningful if the movement<br />
patterns had not been so well understood. <strong>The</strong>se<br />
studies were possible through direct observation in<br />
Amboseli, due to the small sizes of both the reserve<br />
and the elephant population. In a larger area<br />
containing a larger population, other methods such<br />
as the use of radio telemetry would have been<br />
essential.<br />
d) Foraging behaviour and spatial use of resources<br />
One of the fundamental aspects of understanding the<br />
ecology of elephants in any particular area is knowing<br />
how the animals use the resources at their disposal.<br />
<strong>The</strong> study of foraging behaviour is dependant not only<br />
on knowing what food and other resources are<br />
available and how they are distributed, but also on an<br />
understanding of the movements of the animals in<br />
and around the plant communities and waterpoints.<br />
e) Specific management questions (e.g. which<br />
herds frequent which areas)<br />
From a management point of view, it may be<br />
important to understand which elephant clans or<br />
groups have home ranges that allow access to<br />
vulnerable plants (or plant communities) or perhaps<br />
which elephants may be. potential problem animals,<br />
such as “crop raiders” outside established<br />
conservation areas. <strong>The</strong> knowledge helps a manager<br />
having to conduct culling operations, allowing him<br />
to identify which groups he should concentrate upon.<br />
Also, knowing which elephants are where is useful if<br />
selective trophy hunting is practised.<br />
It is known from studies in the Kruger National Park<br />
(Whyte 1993), that a culling operation may induce a<br />
certain degree of movement among other elephants<br />
in the area. If it is important to cull animals from a<br />
particular area only, it is essential to know where the<br />
animals concerned have gone in response to such a<br />
cull so that attention is then not diverted to non-target<br />
groups.<br />
8.3 AVAILABLE TECHNIQUES FOR<br />
STUDYING MOVEMENTS<br />
8.3.1 Techniques not involving radiotracking<br />
<strong>The</strong> success of techniques not using radio-tracking is<br />
dependent on the type of information required and<br />
76<br />
on the terrain. <strong>The</strong>re are two basic methods, both of<br />
which require fairly tractable study animals that do<br />
not flee when approached. <strong>The</strong> first is a long-term<br />
study in which all the localities of particular animals<br />
seen are recorded, and slowly a picture of the homerange<br />
emerges. <strong>The</strong> method relies on being able to<br />
identify specific animals either by particular physical<br />
features (such as ear nicks and tears, tusk shape and<br />
size, etc.) or having fitted them with colour coded<br />
collars. As such animals cannot always be located<br />
when required, the data are acquired mainly from ad<br />
hoc resightings. Much of Moss’ study (1988) was<br />
conducted in this manner but she was able to identify<br />
nearly all of the approximately 750 elephants in the<br />
Amboseli population’- a remarkable achievement.<br />
<strong>The</strong> second is a technique in which identifiable study<br />
animals are followed for continuous periods and all<br />
movements/activities are recorded. This is an<br />
extremely time-consuming method which would<br />
usually be used for the collection of data other than<br />
that pertaining strictly to movement, such as feeding<br />
or behavioural studies. Movement data can, of course,<br />
be acquired as a spin-off to these other priorities.<br />
<strong>The</strong>se two methods can of course be combined and<br />
specific identifiable animals can be tracked or<br />
followed for continuous periods at regular intervals.<br />
A limitation of both these techniques is that certain<br />
inaccessible localities which the animals may visit<br />
either occasionally or regularly may never be<br />
recorded, giving a bias of unknown magnitude to the<br />
result.<br />
8.3.2 Conventional radio-tracking<br />
8.3.2.1 General<br />
Before a radio-tracking study is initiated by<br />
someone who has little or no experience in this<br />
field, a substantial review of techniques and<br />
problems concerned with radio-tracking should be<br />
conducted. Amlaner & Macdonald (1980) and<br />
Cheeseman & Mitson (1982) are useful references.<br />
A comprehensive review article was also published<br />
by Harris et al. (1990).<br />
Radio-tracking involves puffing a small radio<br />
transmitter attached to a collar or harness on an<br />
elephant. <strong>The</strong> transmitter emits a pulsing signal<br />
on a predetermined frequency which can be<br />
detected on a radio receiver set to the same<br />
frequency. <strong>The</strong> signal is detected through a<br />
directional (Yagi) antenna attached to the receiver
set to the same frequency. <strong>The</strong> signal is detected<br />
through a directional (Yagi) antenna attached to<br />
the receiver which in turn emits an audio signal<br />
through a speaker or headphones. <strong>The</strong> strongest signal<br />
will be received when the antenna is directed straight<br />
at the transmitter.<br />
<strong>The</strong> great advantage of using radio telemetry is that the<br />
study animal(s) can nearly always be located when<br />
required. This means that little time is wasted looking<br />
for the animal, and study periods can be planned to<br />
allow for the most meaningful subsequent analysis of<br />
the data. It does happen from time to time that the terrain<br />
will prevent the signal from being received -usually<br />
when the animal is low down in a valley - as the<br />
reception of high frequency radio signals is dependent<br />
on “line of sight” conditions. <strong>The</strong> range of radio<br />
transmitters (the distance at which a signal can be<br />
received) is very variable under field conditions. In poor<br />
terrain the range may be very small, but when both the<br />
receiver and the study animal are located on high points,<br />
the range can be as much as 40-50km.<br />
<strong>The</strong>re are a few different methods of determining or<br />
“fixing” the position of the collared animal,<br />
depending on the kind of study being conducted and<br />
the type of data required. <strong>The</strong> different methods can<br />
be separated into two basic group - those in which<br />
only the position of the animal is determined and<br />
those in which the animal is approached after radio<br />
contact has been made and until visual contact is<br />
achieved. This first is achieved through “remote”<br />
sensing either by triangulation or from the more<br />
recent development of satellite tracking (see Chapter<br />
12). Usually, the only data that can be obtained by<br />
these “remote” methods are estimates of the animal’s<br />
position (on a map) and/or the point’s grid reference.<br />
However, if the position of the animal can be<br />
estimated to a satisfactory degree of accuracy, this<br />
can be coupled to a vegetation! habitat map or a<br />
Geographic Information System (GIS) if one has been<br />
developed for the particular study area concerned<br />
(GIS is a computerised database containing<br />
geographic information such as soil type, vegetation,<br />
rivers, roads, topography, etc.). Such information can<br />
then be used’to infer relationships between the study<br />
animals and their physical and/or biological<br />
environment.<br />
<strong>The</strong> second type of data in which the animal is<br />
approached and visual contact is achieved, after radio<br />
contact with it has been made, allows the accurate<br />
plotting of the animal’s position and the collection<br />
of other data pertaining to habitat, social grouping,<br />
as well as behaviour.<br />
MOVEMENTS<br />
8.3.2.2 Potential sources of error using<br />
“remote” radio-tracking<br />
Remote radio tracking is prone to three types of error<br />
(Macdonald & Amlaner 1980):<br />
a) System error<br />
i) Inaccuracies in the directionality of the antenna<br />
Due to the nature of such work, antennae seldom<br />
survive undamaged for long. Buckling of the antenna<br />
may lead to inaccuracies and equipment should be<br />
tested occasionally (particularly after having<br />
sustained damage) by“ground truthing” - testing the<br />
equipment on a transmitter located at a known<br />
locality.<br />
ii) Inaccuracies imposed by the geometry of<br />
triangulation<br />
If it is only necessary to ascertain the animal’s position<br />
(remote radio tracking), this can be done by the observer<br />
pinpointing his own position on a map (either a base<br />
station or the position he finds himself in once a signal<br />
has been obtained) and then determining the compass<br />
bearing of the source of the signal. A line can then be<br />
drawn on the map from the observer’s position (Fig.<br />
8.1: “Base station 1”) through the source of the signal<br />
(Point A). By doing this from two (from Base station 2<br />
through Point B) or more points in quick succession,<br />
an estimate of the position or a “fix” of the study animal<br />
can then be made. This will be where the lines on the<br />
map converge (Point AB). <strong>The</strong> method is known as<br />
“triangulation”. <strong>The</strong> true direction of the animal can<br />
always be expected to be a few degrees either to the left<br />
or right of the bearing taken, and although the plotted<br />
position will be at the point of intersection of these two<br />
bearings (Point AB), the animal may be anywhere in<br />
the shaded area X. Triangulation is most accurate when<br />
the bearings from the two receivers intersect at about<br />
90 (area X on Fig. 8.1). As the angle of intersection<br />
either increases (Area Z) or decreases (Area Y) from<br />
the ideal 90, the potential for error will increase. In other<br />
words, as the study animal approaches the line between<br />
the two receivers (Point DE), accuracy diminishes. Also,<br />
the farther the animal is from the base stations (Point<br />
AC), the smaller will be the angle between the bearings<br />
from the two receivers, which also reduces precision.<br />
<strong>The</strong> difficulties and limitations of the method are<br />
discussed in more detail by Heezen and Tester (1967),<br />
Taylor and Lloyd (1978), Macdonald (1978) and<br />
Macdonald and Amlaner (1980). This method<br />
was used with success on elephants by Fairall<br />
(1980).<br />
iii) Other inaccuracies<br />
Errors can result from misreading bearings, due<br />
to taking the reading from a magnetic compass<br />
77
MOVEMENTS<br />
Fig. 8.1: Potential errors in the geometry of triangulation<br />
too close to the vehicle. Error can also be the result of the antenna<br />
being mounted too low - it should be at least one wavelength<br />
above the vehicle’s roof.<br />
b) Movement error<br />
A delay between the taking of bearings to pinpoint the animal’s<br />
position will result in error. <strong>The</strong> magnitude of the error will be<br />
determined by the speed at which the animal is moving, the time<br />
lag between taking the bearings and the animal’s position<br />
78<br />
relative to the localities where the bearings were taken<br />
(geometric error).<br />
c) Topographical error<br />
High frequency radio waves are attenuated by vegetation<br />
and tend to reflect off topographical features, the higher the<br />
frequency, the greater is this tendency. Inaccuracies due to<br />
topography are variable and need to be learned for the<br />
particular study area concerned.
All the mthods discussed below also have certain<br />
nherrent advantages and disadvantages in terms of<br />
cost effectiveness and labour intensiveness. <strong>The</strong>se<br />
should also be borne in mind when planning a study.<br />
8.3.2.3 Radio-tracking from the ground<br />
Radio-tracking elephants from the ground is usually<br />
conducted from a vehicle. Apart from the fact that<br />
elephants are dangerous animals, they have relatively<br />
large home ranges and to find the collared animal in<br />
a home range which may be as large as 1,000km 2 or<br />
more often means wasting much time in covering the<br />
ground between high points while searching for the<br />
initial “contact”.<br />
Depending on the requirements of the study, it may<br />
only be necessary to ascertain the animal’s position<br />
by triangulation (remote tracking). This method was<br />
used to track elephants by Fairall (1980). <strong>The</strong> main<br />
drawback of this method is that it does not allow the<br />
collection of any other (often very useful) additional<br />
data, and that the method is prone to movement error,<br />
topographical error and geometric inaccuracies.<br />
If visual contact of the study animal and its family<br />
group must be made (in order to determine the sex<br />
and age structure of the group, to undertake feeding<br />
studies or to determine habitat condition, etc.), the<br />
animal can then be approached once the initial<br />
radio contact has been made by moving toward<br />
the signal either by vehicle or on foot. <strong>The</strong><br />
advantage of approaching elephants on foot is that<br />
little disturbance occurs if due attention is given<br />
to noise and wind direction, but this must be<br />
conducted with extreme caution. Approaching<br />
elephants by vehicle usually requires off road work<br />
which is invariably noisy and results in<br />
observations on disturbed rather than relaxed study<br />
animals. An additional advantage of gaining visual<br />
contact with the study animal is that it eliminates<br />
the errors associated with remote sensing as its<br />
position can be accurately plotted on a map,<br />
particularly with modem’“Global Positioning<br />
Systems” (GPS) technology. (<strong>The</strong>se small handheld<br />
instruments can indicate positions by precise<br />
latitudinal and longitudinal co-ordinates of the<br />
operator to an accuracy of within ±50m anywhere<br />
on the earth’s surface from signals received from<br />
orbiting satellites. See also the section on GPS in<br />
Chapter 12).<br />
Radio tracking from the ground is reasonably<br />
cheap, requiring only the running costs of the<br />
vehicle and the usual overhead costs such as salary,<br />
etc. It is labour-intensive in that many hours are<br />
MOVEMENTS<br />
often spent travelling through a large homerange<br />
trying to make initial contact with the<br />
required study animal.<br />
Bertram (1980) gives some very useful advice<br />
to those who may be about to embark on a study<br />
making use of radio telemetry:<br />
i) Routinely time the signal rate of each<br />
transmitter fitted to obtain advance<br />
warning of impending battery failure.<br />
ii) Carry at least one spare radio collar<br />
with you at ail times so that collars<br />
giving such warning of battery failure<br />
can be replaced before contact with the<br />
animal (and perhaps the collar itself)<br />
is irretrievably lost. Also, a spare<br />
collar allows checking the receiving<br />
equipment should a problem be<br />
suspected.<br />
iii)Fit a collar to more than one animal in<br />
a social group so that the group can<br />
still be found in spite of the failure of<br />
one. <strong>The</strong> frustration of losing contact<br />
is extreme!<br />
iv)Habituate animals by dealing with<br />
them as quietly and gently as possible<br />
so that they can be observed without<br />
disturbance. This also facilitates the<br />
easy fitting and recovery of collars.<br />
8.3.2.4 Radio-tracking by triangulation<br />
from base stations<br />
This method requires the establishment of two<br />
or more base stations, each equipped with a<br />
receiver and a tall, sensitive antenna. <strong>The</strong>se<br />
stations should be located on the highest ground<br />
available in the study area which would offer<br />
the best possibility of receiving signals from the<br />
animals’ collars. <strong>The</strong> positions of these base<br />
stations are then plotted on the map and manned<br />
during the time that the animals are to be<br />
tracked. Compass bearings of the direction of<br />
the study animal is determined from all base<br />
stations simultaneously at predetermined times.<br />
<strong>The</strong> localities of the animal can be determined<br />
later by triangulation, as described above.<br />
This method is very useful for activity studies<br />
as regular plots of each animal (hourly, half<br />
hourly or at whatever interval is required) will<br />
79
MOVEMENTS<br />
allow the determination of the path that the<br />
animal follows by connecting the respective<br />
“fixes”. Distances moved can then be<br />
calculated. <strong>The</strong> drawback of the method is that<br />
it does not allow for the collection of other data<br />
(see Section”8.5.3). <strong>The</strong> method is also prone to<br />
topographical error and geometric inaccuracies. <strong>The</strong>se<br />
can be minimised if the local topography is well<br />
understood.<br />
<strong>The</strong> method will only be useful in a study area offering<br />
suitable high ground (such as a high escarpment<br />
overlooking a low lying home-range) on which base<br />
stations can be established. <strong>The</strong> large home-ranges<br />
of elephants will often make contact with the animals<br />
impossible from fixed base stations if suitable high<br />
ground is not available. Given these prerequisites, the<br />
method is fairly cheap once the initial outlay of<br />
establishing and equipping the base stations has been<br />
achieved. Travel is minimal and many fixes can<br />
thereafter be obtained for a minimal expense.<br />
8.3.2.5 Radio-tracking from the air<br />
Radio-tracking from the air has proved to be an<br />
extremely useful method, particularly when, as in the<br />
case of elephants, the study animals often live in open<br />
savanna environments, and in these habitats they are<br />
easily visible from the air. In inaccessible areas aircraft<br />
are also particularly useful. Another great advantage<br />
of using aircraft is to save time. From altitudes of up<br />
to 5,OOOft above ground level, radio signals can be<br />
picked up from distances of upto 60 or70km! This<br />
means that a study animal can be found quickly<br />
whenever required.<br />
<strong>The</strong> method involved will be dependent on the type<br />
of aircraft that is available, but small fixed≠-wing<br />
aircraft, helicopters and micro-light aircraft have been<br />
used with success. Helicopters can provide high<br />
quality data as the ability to hover allows assessment<br />
of the age and sex structure of the group. Habitat data<br />
can also be accurately acquired. Tracking can be<br />
accomplished by holding the antenna out of the<br />
window; no special fittings to the aircraft are needed.<br />
However, the extremely high running costs of a<br />
helicopter and their unavailability in distant rural areas<br />
usually preclude its use.<br />
Small fixed-wing aircraft can also provide high≠<br />
quality data on both habitat variables and group<br />
composition. An additional advantage is that they can<br />
travel fast, so many different study animals or groups<br />
can be located over a wide area in a relatively short<br />
time. <strong>The</strong>y are far less expensive than helicopters and<br />
are more generally available, but running costs are<br />
80<br />
still high enough to make this a severe drawback, and<br />
tracking flights need to be carefully planned to realise<br />
their full potential as they can usually not be carried<br />
out regularly. <strong>The</strong>se aircraft require the mounting of<br />
an external antenna or two - usually one on each wing.<br />
Both antennae are connected to the receiver inside<br />
the aircraft by way of a two-way switch box. Through<br />
this, either the left, right or both antennae can be<br />
selected. <strong>The</strong> initial signal is obtained by listening on<br />
both antennae, and then selecting left or right to<br />
determine which side of the aircraft the animal is on.<br />
<strong>The</strong> aircraft is then turned towards the animal until<br />
the signal strength from both antennae is the same.<br />
By constantly switching between the left and right<br />
antennae the aircraft’s direction is adjusted to maintain<br />
equal signal strength. <strong>The</strong> signal strength increases<br />
as the animal is approached, and if the terrain and<br />
vegetation are suitable, the study animal is easily<br />
located.<br />
Micro-light aircraft have the distinct advantage over<br />
the other two in that they are relatively cheap to<br />
acquire and maintain, and to learn to fly (which<br />
eliminates the additional expense of hiring a pilot).<br />
<strong>The</strong>y can be easily operated from bush strips and are<br />
relatively quiet, which limits disturbance. <strong>The</strong>ir<br />
disadvantages in comparison to other aircraft are that<br />
they are sensitive to bad weather and have limited<br />
speed and range.<br />
Data recording in the form of written notes is difficult<br />
in an aircraft as the time available while the study<br />
animals are within visual range is limited. If the<br />
researcher is also the pilot, the problem is even more<br />
difficult (as flying the aircraft is clearly the priority!).<br />
A small hand-held dictaphone or tape recorder is very<br />
useful under these conditions, and the data can be<br />
transcribed later.<br />
<strong>The</strong> position of the animal can be plotted very<br />
precisely if the pilot/observers know the area well<br />
and if accurate maps of the area are available. This<br />
necessity is obviated if the aircraft is fitted with a<br />
GPS.<br />
Another great advantage of tracking from the air is<br />
that it eliminates all of the errors and inaccuracies<br />
associated with remote tracking listed above (see<br />
Section 8.3.2.2) as the position of the study animal<br />
can be plotted exactly.<br />
8.3.2.6 Radio-tracking using satellites<br />
Satellite radio tracking is a relatively new technology<br />
which improves the logistics of data acquisition by
circumventing many of the deficiencies encountered<br />
with conventional remote telemetry techniques.<br />
Factors such as hazardous weather conditions,<br />
darkness, international boundaries, remoteness and<br />
extensive animal movements do not hinder the<br />
systematic collection of data (Fancy et al. 1987). See<br />
Chapter 12 for more information on satellite-tracking<br />
and new methods of studying movements such as<br />
GPS.<br />
8.4. WHAT SORT OF DATA ARE<br />
REQUIRED?<br />
8.4.1 General<br />
Data gathered regularly at predetermined times will<br />
allow better analysis of the results. Areas used or<br />
distances moved can be satisfactorily compared if<br />
they were measured over the same time spans.<br />
An animal’s movements and home-range will usually<br />
not be entirely stable but will change with time. An<br />
animal’s requirements are more easily met at certain<br />
times of year than others, thus reducing the space<br />
needed to meet these requirements. Seasonal<br />
environmental changes may even require that longdistance<br />
movements be undertaken, resulting in very<br />
large home-ranges. Such movements may take the<br />
form of regular migrations or irregular vagrant<br />
movements to optimise locally favourable conditions.<br />
Ideally, studies should be made over more than two<br />
full annual cycles.<br />
<strong>The</strong> kinds of data required depends on what sort of<br />
questions need to be answered. If it is only necessary<br />
to know what sort of areas elephant clans utilise, then<br />
remote plots of animals in neighbouring clans taken<br />
as regularly as possible will probably suffice. But if<br />
other questions also need answering (such as how<br />
many individuals make up the various clans? Do all<br />
clan members use the same range? Do habitat types<br />
influence movement? How does rainfall affect<br />
movement? etc.), then other types of data will be<br />
required, but it is beyond the scope of this chapter to<br />
look into all of these as they include other techniques<br />
such as habitat analyses, botanical surveys, etc.<br />
8.4.2 Home-range<br />
For many kinds of animals, a home-range<br />
is one of the keys to their ability to survive<br />
and reproduce, and a knowledge of the homerange<br />
requirements of the species is essential to the<br />
understanding of its general ecology. But studies of<br />
home-ranges have been somewhat vague. This is<br />
because the techniques used do not allow for the<br />
monitoring of the exact position of the animal at all<br />
times. Data almost invariably are of the form of<br />
sporadic fixes of the animal’s position, taken either<br />
at regular or irregular time intervals, when the<br />
whereabouts of the animal during the intervening time<br />
is not known. <strong>The</strong> data therefore can only present a<br />
vague image of the actual nature of the study animal’s<br />
home-range, but the more intensively the study is<br />
conducted, the clearer the image becomes.<br />
<strong>The</strong> intensity with which any such study is conducted<br />
is often limited by budgetary constraints or else time<br />
constraints due to other responsibilities of the<br />
researcher, but any data that can be gathered over a<br />
sufficient period of time will give some indication of<br />
the area that any particular animal uses as its homerange.<br />
8.4.3 Grid systems<br />
MOVEMENTS<br />
Any useful analysis of plotted positions of the study<br />
animal is dependent on a grid system. Such a grid<br />
can follow one of the recognised geographical coordinate<br />
systems such as latitude/longitude (i.e., either<br />
decimal degrees or degrees/minutes/seconds), a<br />
projection system such as the Universal Transverse<br />
Mercator (UTM), or a Cartesian system in which a<br />
grid is drawn over a map of the study area at a scale<br />
which suits the requirements of the study. Any one of<br />
the geographical co-ordinate systems is useful as these<br />
are usually compatible with GIS programs but most<br />
such studies rely on a Cartesian system as their grid<br />
references can usually be rendered GIS-compatible<br />
through a simple conversion program. Both the<br />
vertical and horizontal grid lines should be given<br />
numeric values (not alphabetic or alphanumeric) as<br />
positions anywhere on the grid are thus assigned an<br />
arithmetic character which subsequently allows for<br />
certain mathematical procedures to be carried out.<br />
<strong>The</strong> size of the Cartesian grid cells should be<br />
chosen to reflect the inherent error in calculating<br />
each fix. In other words, if the calculated position<br />
is expected to be within one kilometre of the<br />
elephant’s actual position, grid cells should<br />
ideally be 1km x 1km. Although grids need not<br />
be square or be of any specific size, to use grids of<br />
100m x l00m or 1km x 1km can simplify the<br />
81
MOVEMENTS<br />
Fig. 8.2: A Cartesian grid overlaying the fixes representing a hypothetical home-range.<br />
later analysis of the data. Fig. 8.2 illustrates such a grid<br />
of 1km x 1km which has been further subdivided<br />
(bottom right hand corner) into 100m x l00m blocks.<br />
To illustrate this, point A in the bottom right hand block<br />
would have a grid reference of 134.007 (longitudinal<br />
(Y) are given before the (X) latitudinal values). Each<br />
of the plots on this hypothetical figure can be assigned<br />
a six-numbered reference point which implies that it<br />
lies in a particular block which has an area of 100m x<br />
100m <strong>The</strong> calculation of the mean X and Y values of<br />
all points indicates the theoretical centre point (or<br />
“centre of activity”) of the home range.<br />
8.4.4 Seasonal or periodic long<br />
distance movements<br />
<strong><strong>Elephant</strong>s</strong> may leave conservation areas either<br />
seasonally or periodically. As such movements may<br />
cover long distances, their whereabouts may not be<br />
known during these times, and the only realistic way<br />
of finding out which elephants go where is to monitor<br />
their movements through radio tracking. A problem<br />
like this was described by Lindeque and Lindeque<br />
(1991) in Namibia. Under these circumstances<br />
tracking from base stations or from the ground is<br />
unrealistic or impossible options so the tracking has<br />
82<br />
to be conducted either from the air or by satellite.<br />
Satellite tracking can be satisfactory if accurate plots<br />
are obtained, but unless several animals in these groups<br />
have been fitted with Platform Transmitter Terminals<br />
or PTT’s (see Chapter 12), it will not be known how<br />
many animals are involved in these movements and<br />
which animals go where. Under these circumstances,<br />
tracking by aircraft is an ideal method as accurate plots<br />
of the position can be obtained (particularly if used in<br />
conjunction with a GPS) and detailed information can<br />
also be gained on group structure. Knowing where<br />
the animals have gone is useful but it would be of<br />
much greater interest to know why they went there<br />
and then other data on such aspects as habitat variables<br />
may also be obtained.<br />
8.4.5 Dynamic relationships between<br />
clans, herds and individuals<br />
This kind of study ideally requires the concurrent study<br />
of several elephants in the same and different clans.<br />
Adult cows collared many kilometres apart may be of<br />
the same clan and the subsequent definition of the sizes<br />
and shapes of their respective home ranges can help<br />
illustrate their relationships.
In the absence of computer back-up, the use of coloured<br />
pins (each collared animal having its own colour) is a<br />
useful, simple method of showing these relationships.<br />
Each time a study animal is located a pin of the relevant<br />
colour is stuck into a map at the appropriate grid<br />
reference and gradually there emerges a much clearer<br />
picture of the home ranges than can be given by convex<br />
polygons (see Section 8.5.2). <strong>The</strong> convex polygons of<br />
the home ranges of neighbouring elephant clans in the<br />
Kruger National Park (Whyte 1993) indicate a large<br />
degree of overlap, but the use of a “coloured pin”<br />
technique would have shown the clear core areas which<br />
are not usually used by the clan’s neighbours.<br />
Grid references are again key data types for use in<br />
subsequent analyses.<br />
8.4.6 Foraging behaviour and spatial<br />
use of resources<br />
<strong>The</strong> study of foraging behaviour requires the study<br />
animal to be within sight of the observer so that details<br />
of what the animal is eating can be noted. This is not<br />
within the scope of an ordinary movement study and<br />
questions like “what plant species are being utilised?”<br />
must be answered by direct observation. Radio<br />
telemetry is a useful tool for this type of study as study<br />
animals can be easily located and relocated should<br />
visual contact be lost. Questions such as “are there<br />
favoured foraging areas? How far do elephants move<br />
from water to reach these areas? What times of day do<br />
elephants move to and away from water?” can all be<br />
answered through the study of movement.<br />
It is clear that all of these types of study have two<br />
particular aspects in common. <strong>The</strong>y require firstly that<br />
the position of the animal be accurately plotted.<br />
Secondly, an adequate grid system which can give any<br />
locality an accurate grid reference is vital for the<br />
subsequent analysis of the data. Initial observations in<br />
the field can be done by making a pencil mark on an<br />
accurate map”- grid references can be worked out later.<br />
8.5 TECHNIQUES FOR DATA<br />
ANALYSIS<br />
8.5.1 Simple analysis of movements<br />
<strong>The</strong> measurement of movement is an analysis of the<br />
distance moved in relation to the time taken to cover<br />
MOVEMENTS<br />
the distance. To get the best possible measurement<br />
of an animal’s movements it would be necessary<br />
to plot its exact position (and take the time) at<br />
every step it took. This is obviously ridiculous but<br />
to do so any less frequently than this will clearly<br />
introduce a degree of error into the measurement,<br />
as the path an animal would take between<br />
successive plots will never have been a perfectly<br />
straight line, and the less frequently a fix is<br />
obtained the greater will the error become. A<br />
movement study should therefore attempt to obtain<br />
accurate fixes as frequently as possible and the<br />
time that each fix is taken is as important a part of<br />
the data set as the radio fix itself. Depending on<br />
the time intervals between fixes, tracking can be<br />
considered to be either continuous or<br />
discontinuous.<br />
For continuous tracking radio fixes should be taken<br />
at short intervals (< 15 minutes) to produce a series<br />
of fixes which would provide a rough<br />
approximation of the animal’s travel route. This<br />
is useful for determining the intensity of home.<br />
range use, activity patterns, and interactions<br />
between individuals if more than one animal is<br />
radio-collared.<br />
Discontinuous tracking involves locating the<br />
animal at either discrete or random time intervals.<br />
This technique is useful for determining home<br />
ranges. Time intervals should be selected to<br />
minimise the problems of auto-correlation which<br />
facilitates the analysis (see Harris et al. 1990).<br />
Another advantage is that the method allows the<br />
simultaneous study of a larger number of animals<br />
from separate social groups, discrete populations<br />
or sympatric species.<br />
a) Patterns of movement<br />
An animal will clearly never travel at consistent speeds<br />
for any length of time, and there will be differences in<br />
the amount of movement according to daily as well as<br />
seasonal cycles. Daily cycles will show variations<br />
depending on the time of day, due to rest periods (even<br />
sleep), special treks to water or to a particular food<br />
source, etc. To study these would ideally require<br />
continuous tracking over several 24-hour periods. <strong>The</strong>se<br />
activities may show a seasonal variation and thus such<br />
24-hour tracking periods should be conducted at all<br />
times of the year.<br />
A second pattern of movement may be undertaken by a<br />
migratory species on a seasonal basis to another completely<br />
separate part of its range. Discontinuous tracking can<br />
provide adequate data as long as fixes are obtained<br />
83
MOVEMENTS<br />
regularly. It may conduct the study for more than<br />
one season to determine how fixed the migration<br />
pattern may be. <strong>The</strong>se movements can be<br />
satisfactorily mapped (Fancy et al. 1987), but<br />
discontinuous tracking has limitations in showing<br />
just how the animal moved. Continuous tracking<br />
can better show mean distances moved over various<br />
time periods, and can therefore give an additional<br />
dimension to the data.<br />
b) Mean distance travelled<br />
In all of these studies the mean distance moved is<br />
of interest. This facilitates the meaningful<br />
comparison of different data sets. Mean hourly<br />
distance moved will vary if the animals are<br />
foraging, resting or migrating. <strong>The</strong> more intensively<br />
the pattern of movement of the animal is being<br />
studied, the more frequently will it be necessary to<br />
locate the animal. Mean short distance (daily)<br />
movements will require continuous tracking, while<br />
those of an animal on migration could be tracked<br />
discretely or even randomly. Of course, the more<br />
often radio fixes are taken, the higher the quality<br />
of the data.<br />
8.5.2 Analysis of home range<br />
As mentioned earlier, the study of a home range<br />
will present only an image of the actual nature of<br />
the study animal’s home range, but the more<br />
intensively the study is conducted, the clearer the<br />
image becomes. To overcome this basic<br />
shortcoming, many different techniques have been<br />
devised to analyse and present home-range data.<br />
To go into these in any detail is way beyond the<br />
scope of this chapter, but they have been reviewed<br />
by Harris et al. (1990) and summarised here, with<br />
relevant references included for those who require<br />
further detail. <strong>The</strong> respective methods are illustrated<br />
in Fig. 8.3, using fictitious data. <strong>The</strong> 28 data points<br />
in all of the methods illustrated are identical, but<br />
no actual analysis has been conducted upon them -<br />
they are used only to show what the respective<br />
analyses can illustrate.<br />
a) Sample size (Fig. 8.3a)<br />
One of the fundamental aspects of a home range<br />
study is the collection of enough fixes to represent<br />
adequately the home range. This is fairly easily<br />
determined because as the number of fixes<br />
increases, so does the observed area of the home<br />
range. Initially the increase in the area is rapid but<br />
this tails off until eventually a point is reached<br />
where an increase in the number of fixes does not<br />
result in an increase in home-range area (see Whyte<br />
84<br />
1993). This point is known as the asymptote (Stickel<br />
1954). After this point has been reached, further data<br />
collection is still useful for certain studies (intensity<br />
of home range use) but the boundaries of the home<br />
range will largely have been established. With<br />
elephants, however, this may not be quite so simple<br />
as they have large home ranges which may or may<br />
not be well utilised over a short period, and longterm<br />
studies may still reveal sudden unexpected<br />
increases. For example, in the Kruger National Park,<br />
one adult elephant cow increased the area of her<br />
known home range by 36% (from<br />
1,200km 2 to 1,630km’) due to one fix in an area<br />
where she had not previously been recorded over a<br />
period of 52 months subsequent to being collared<br />
(see Fig. 8.4).<br />
b) Minimum convex polygon (Fig. 8.3b)<br />
This technique is one of the simplest for home-range<br />
calculation and which is still one of those most<br />
frequently used. <strong>The</strong> great advantage is that it is<br />
the only technique that is strictly comparable<br />
between studies. It does not rely on complex<br />
statistical procedures; and for most management<br />
purposes, the polygon tells the manager what the<br />
probable range of the animal will be, even if there<br />
are unused areas within it. A disadvantage is that<br />
all data points are encompassed, including<br />
peripheral ones well beyond the main area of<br />
activity. It therefore includes some areas which are<br />
seldom or never visited. This method also gives no<br />
indication of intensity of range use, though the<br />
inclusion of the fixes in the polygon does give a<br />
useful visual impression (Fig. 8.3b). <strong>The</strong>se<br />
disadvantages can be reduced by using concave<br />
polygons (Glutton-Brock et<br />
al. 1982) or restricted polygons (Wolton 1985). This<br />
method is probably most useful when used in<br />
conjunction with one of the other techniques.<br />
c) Grid cells (Fig. 8.3c)<br />
Another non-statistical technique is the overlaying<br />
of grid cells. <strong>The</strong> method is useful for representing<br />
habitat usage (Lawrence & Wood≠-Gush, 1988).<br />
Voigt and Tinline (1980) used grid cell methods in<br />
which the cells adjacent to cells containing a fix<br />
were included in the analysis (influence cell<br />
method) and another (linked cell) in which cells<br />
between those containing successive fixes which<br />
were close enough in time but far enough apart for<br />
the animal to have been moving between them in a<br />
nearly straight line were also included. Home-range<br />
size is calculated by adding up the number of<br />
“active” cells.<br />
<strong>The</strong> grid cell system is useful for calculating the
Fig. 8.3: Aspects of home-range data collection and methods of analysis.<br />
MOVEMENTS<br />
85
MOVEMENTS<br />
Fig. 8.4: Recorded home-range of an adult elephant cow in the Kruger National Park showing the influence of one “fix” on the<br />
area of the minimum convex polygon.<br />
86
theoretical centre point or “centre of activity” from<br />
the point of intersection of the mean X and Y<br />
coordinates of all of the fixes. This point is used in<br />
some of the other analyses.<br />
d) Sorted polygon (Fig. 8.3d)<br />
This method was used by Voigt and Tinline (1980)<br />
in which the“centre of activity” is first determined.<br />
Each fix is numbered according to its direction from<br />
this centre of activity (i.e., from 0. through 360) and<br />
the points are then joined in numerical order resulting<br />
in a polygon looking something like a “star burst”.<br />
This method yields a smaller polygon than the<br />
minimum convex but it removes much of the<br />
uncertain area between far-out adjacent fixes. <strong>The</strong><br />
area of this polygon can then be calculated.<br />
e) Probabilistic methods (Fig. 8.3e)<br />
In these methods home-ranges are analysed as<br />
probabilistic circles or ellipses in which the ellipse<br />
boundary can be used to define home-range size.<br />
<strong>The</strong>y suffer from certain statistical assumptions which<br />
will seldom hold true in nature and thus, though they<br />
are useful for academic analyses, they are less useful<br />
to managers requiring a more graphic image of home<br />
range.<br />
f) Harmonic mean (Fig 8.3f)<br />
This elegant technique was developed by Dixon and<br />
Chapman (1980) by which one or more centres of<br />
activity, home-range size and configuration can be<br />
determined. This is a mathematical procedure<br />
utilising a grid system in which values are calculated<br />
at each grid intersection to form a matrix on which<br />
isopleths are drawn like contour lines. <strong>The</strong> technique<br />
is particularly useful for highlighting core areas and<br />
those of relatively high and low usage within the<br />
home range.<br />
8.5.3 Inferring use of habitat and<br />
behaviour from movement data<br />
In many conservation areas much of the basic<br />
“spadework”, such as the compilation of plant and<br />
animal species lists, the mapping of soils, geology,<br />
landscapes, vegetation types and/or plant<br />
communities has now been conducted. If such<br />
vegetation/habitat maps are available for the study<br />
area (either on a GIS system or on a map where the<br />
vegetation types are accurately drawn), a certain<br />
amount of information on foraging behaviour and<br />
spatial use of resources can be inferred. This is<br />
because an accurate grid reference of the location of<br />
the elephant can be cross-referenced to indicate in<br />
which habitat type the animal is located. <strong>The</strong><br />
proportion of time spent in any particular habitat type<br />
will be indicative of its importance to the study animal<br />
or species which, in the case of an elephant study,<br />
could highlight plant species or communities at risk,<br />
thereby indicating avenues for future research. <strong>The</strong><br />
more accurate the fix of the animal and the more<br />
accurate the vegetation map, the better will be the<br />
quality of the inferred information. Fig. 8.5 shows<br />
the same hypothetical home range as in Fig. 8.2 but<br />
this time with a vegetation map and Cartesian grid<br />
superimposed. Of the 50 fixes shown, eight (16%)<br />
were in the forest and 42 (84%) were in the savanna.<br />
Only three (6%) were recorded on the east bank of<br />
the river. Otherwise they apparently avoided the<br />
riverine types (unlike real elephants). If these were<br />
real data, such an analysis would tell us something<br />
about this animal’s home range and its preferred<br />
habitat types.<br />
Certain behaviours could also be inferred. For<br />
example, as these elephants apparently avoided the<br />
riverine areas, fixes on the river could indicate<br />
drinking and thus favourite drinking times. This could<br />
be corroborated by direct observations.<br />
8.6 ADDRESSES OF SUPPLIERS<br />
Satellite telemetry<br />
1. Service Argos, Inc.,<br />
1801 McCormick<br />
Drive, Suite 10,<br />
Landover MD 20785, U.S.A.<br />
2. Telonics Inc.,<br />
92 E. Impala Ave.,<br />
Carpinteria, CA 93013, U.S.A.<br />
Conventional telemetry<br />
1. Telonics Inc.,<br />
2. Wood-Ivey Systems Corp. (WISCO),<br />
P O Box 4609,<br />
Winter Park, FL 32793, U.S.A.<br />
Global Positioning Systems (GPS)<br />
1. Trimble Navigation,<br />
P O Box 3642,<br />
Sunnyvale,<br />
CA 94088-3642, U.S.A.<br />
MOVEMENTS<br />
87
MOVEMENTS<br />
Fig. 8.5: A Cartesian grid overlaying a hypothetical vegetation map and fixes representing a home-range.<br />
88<br />
2. Garmin,<br />
9875 Widmer Road,<br />
References<br />
Lenexa, Kansas 66215, U.S.A.<br />
3. Magellan Systems Corporation,<br />
960 Overland Ct.,<br />
San Dimas,<br />
CA 91773, U.S.A.<br />
Acknowledgements<br />
l would like to thank the National Parks Board of<br />
South Africa for permission to present this overview.<br />
My thanks are also due to Dr. Gus Mills for help<br />
with literature and access to his reference collection.<br />
Dr. Harry Biggs made useful comments on grid<br />
systems. Mr. Danie Pienaar provided the basis of the<br />
map used in fig. 8.4.<br />
References<br />
AMLANER, C.J. & MACDONALD, D.W. (Eds.) (1980) A handbook on<br />
biotelemetry and radio tracking. Pergamon Press, Oxford.<br />
BELL. W.D.M. (1923) <strong>The</strong> wanderings elephant hunter. Neville Spearman &<br />
<strong>The</strong> Holland Press, London.<br />
BERTRAM, B. (1980) <strong>The</strong> erengeti radio tracking program. In: A handbook on<br />
biotelmetry and radio tracking, (Eds. C.J. Amlaner & D.W. Macdonald), Pp.<br />
625-631. Pergamon Press. Oxford.<br />
CHEESEMAN, C.L. & MITSON, R.B. (Eds.) (1982) Telemetric studies of<br />
vertebrates. Symposium of the Zoological Society of London 49, 1-368.<br />
CLUTTON-BROCK, T.H., CUINNESS. F.E. & ALBON, S.D. (1982) Red deer<br />
behaviour and ecology of two sexes. Edinburgh University Press, Edinburgh.<br />
DIXON, K.R. & CHAPMAN, J.A. (1980) Harmonic mean measure of animal<br />
areas. Ecology 61, 1040-1044.<br />
DOUGLAS-HAMILTON, I., MICHELMORE, F. & INAMDAR. A. (1992)<br />
<strong>African</strong> elephant database, European Commission <strong>African</strong> <strong>Elephant</strong> Survey<br />
and Conservation Programme. UNEP/CRID/GEMS, Nairobi.<br />
FAIRALL, N. (1980) A radio tracking study of young translocated elephants.<br />
In: A handbook on biotelemetry and radio tracking (Eds. C.J. Amlaner & D.W,<br />
Macdonald), Pp. 673-678. Pergamon Press, Oxford.<br />
FANCY. S.G., PANK, L.F., DOUGLAS, D.C., CURBY. C.H., GARNER. G.W.,<br />
MSTRUP. S,W. & REGELIN, W.L. (1987) Satellite telemetry -a new tool for<br />
wildlife research and management. U.S. Fish & Wildlife Service. Resource<br />
Publication 172, 54. Washington, U.S.A.
HARRIS S.. CRESSWELL, W.J., PORDE, P.G., TREWHELLA, W.J.,<br />
WOOLLARD, T. & WRAY. S. (1990) Horne-range analysis using radio-tracking<br />
data- a review of problems and techniques particularly as applied to the study<br />
of mammals. Mammal Review 20 (2/3), 97-123.<br />
HEEZEN, K.L & TESTER, J.R. (1967) Evaluation of radio-tracking by<br />
triangulation with special reference to deer movements. Journal of Wildlife<br />
Management 124-141.<br />
LAWRENCE, A B. & WOOD-GUSH, D.G.M. (1988) Home-range, behaviour<br />
and social organisation of Scottish Black-faced sheep. journal of applied Ecology<br />
25 25-40.<br />
LINDEQUE. M. & LINDEQUE. P.M. (1991) Satellite tracking of elephants in<br />
northwestern Namibia. <strong>African</strong> Journal of Ecology 29, 196-206.<br />
MACDONALD, D.W, (1978) Radio racking some applications and limitations.<br />
In: Animal marking: Recognition marking of animals in research. (Ed. B.<br />
Stonehouse), pp. 192-204. Macmillan, London.<br />
MACDONALD, D.W & AMLANER C.J. (1980) A practical guide to radio<br />
tracking.In: A handbook on biotelemetry and radio tracking, (Eds. C.J. Amlaner<br />
& D.W, Macdonald), pp. 143-159. Pergamon Press, Oxford.<br />
MOVEMENTS<br />
MOSS, C.J. (1988) <strong>Elephant</strong> memories. Thirteen years in the life of an elephant<br />
family. Elm Tree Books, London.<br />
STICKEL, L.F, (1954) A comparison of certain methods of measuring ranges<br />
of small mammals. Journal of Mammalogy 35, 1-15.<br />
TAYLOR, K.D. & LLOYD. H.G. (1978) <strong>The</strong> design, construction and use of a<br />
radio-tracking system for sore British mammals. Mammal Review 8, 117-139.<br />
VOIGT, D.R. & TINIINE, R.R. (1980) Strategies for analysing radio tracking<br />
movement data. In: A handbook on biotelemetry and radio tracking (Eds. C.J.<br />
Amlaner & D.W. Macdonald), pp. 387-404. Oxford. Pergamon Press.<br />
WHYTE, 1.J. (1993) <strong>The</strong> movement patterns of elephants In the Kruger National<br />
Park in response to culling and environmental stimuli. Pachyderm 16, 72-80.<br />
WOLTON, R.J. (1985), <strong>The</strong> ranging and nesting behaviour of wood mice,<br />
Apodemus sylvaticus Rodentia: Muridae), as revealed by radio tracking. Journal<br />
of Zoology 206, 203-224.<br />
89
9.1 INTRODUCTION<br />
<strong>The</strong> study of the interactions between elephants and<br />
their habitats is of interest both to ecological scientists<br />
and to wildlife managers (see Chapter 2). <strong>The</strong><br />
management goals of a protected area authority can<br />
vary from the preservation of habitats in a chosen status<br />
quo (e.g. Martin & Conybeare 1992), to the<br />
maintenance of maximal biodiversity (Western 1989),<br />
to the conservation of ecological processes which<br />
allows latitude for habitat change (Sinclair 1983). <strong>The</strong><br />
impact on habitats caused by elephants while feeding,<br />
particularly on woody plants, has been viewed with<br />
alarm or equanimity, depending on the observer’s value<br />
system (Caughley 1983) and his management goals.<br />
Generally, researchers are asked by managers to address<br />
a question which can be expressed simply as “are<br />
elephants causing the reduction of a woodland?” <strong>The</strong><br />
decision to be made by managers is whether<br />
intervention is necessary to reduce or otherwise control<br />
the density of the elephant population, if the reduction<br />
of woodlands is seen as undesirable. It may be possible<br />
to provide an answer fairly readily to this simple<br />
question and to related questions about the rate of the<br />
change, but the management of wildlife areas might be<br />
improved if research can pose and answer more difficult<br />
questions about all the factors controlling woodland<br />
establishment and change.<br />
<strong>The</strong> study of elephant-habitat interactions is very broad<br />
and includes not only the elephants’ population<br />
dynamics, density, distribution and diet selection, but<br />
also the population dynamics and responses to<br />
environmental stresses of the plant communities. <strong>The</strong><br />
interaction between elephants and trees involves the<br />
effects of elephants on plant survival and recruitment<br />
and the effects of changing food supplies on the<br />
elephants’ survival. <strong>The</strong>se are huge topics, with a long<br />
history of research and a vast literature in each area. It<br />
is also the case that tree populations are affected by<br />
90<br />
environmental factors other than elephants. <strong>The</strong>se factors<br />
include fire, climatic extremes such as drought, high rainfall<br />
and flooding or frost and high wind, browsing by other<br />
herbivores and the activities of man.<br />
<strong>Elephant</strong> population dynamics are generally slow - they are<br />
long-lived, reproduce at a low rate, and have low mortality.<br />
Trees are also relatively slow-growing. Achieving a complete<br />
understanding of the interactive processes involved would<br />
require several centuries of observation, but a framework<br />
for understanding can be developed through building models<br />
of the hypothesised relationships between elephants and their<br />
habitats. A model can be simple or complex, from a diagram<br />
with boxes and arrows on a piece of paper to a detailed<br />
systems model on a computer. Any model developed should<br />
be seen as a tool for describing and understanding a system<br />
which operates on a scale which is larger than the human<br />
life span.<br />
Since the most obvious feature of the interaction between<br />
elephants and habitats is the effect of elephants’ feeding on<br />
plants, and since this is usually the question of most<br />
immediate concern to wildlife management authorities, this<br />
chapter will focus on the measurement of plant responses to<br />
elephant herbivory and describe some methods to study this<br />
in relative detail. It will discuss other aspects of elephanthabitat<br />
interactions in broad terms and provide information<br />
on the literature sources of these subjects.<br />
9.2 METHODS FOR ASSESSING<br />
CHANGES IN TREE POPULATIONS<br />
9.2.1 General<br />
CHAPTER 9<br />
STUDYING ELEPHANT- HABITAT INTERACTIONS<br />
Keith Lindsay<br />
Environment & Development <strong>Group</strong><br />
13 St. Giles<br />
Oxford OX1 3JS, U.K.<br />
As discussed above, there are many possible levels of<br />
inquiry into elephant-habitat interactions. On a basic level,
a simple description of the extent of elephant impact<br />
on trees will suffice. To gain a deeper understanding<br />
of the population dynamics of trees, it is necessary<br />
to look at the rate of loss of adult, canopy level trees,<br />
and the rates of establishment, growth and survival<br />
of smaller size classes through time. <strong>The</strong> degree to<br />
which these rates are affected by elephants as well<br />
as by other factors, such as fire and other herbivores,<br />
is also important.<br />
9.2.2 Vegetation mapping<br />
At the outset of any programme of elephant-habitat<br />
research, it is essential to have some form of map of<br />
the geographical distribution of the main vegetation<br />
communities. Such a map is useful for two reasons:<br />
a) to determine the relative area and location of<br />
specific vegetation communities of concern, such as<br />
riverine woodland or hilltop thickets, and b) to<br />
provide a basis for the stratification of sampling effort<br />
(see below).<br />
Vegetation mapping in its most ideal form is done<br />
by reference to satellite images supported by<br />
numerous measurements of plant species<br />
composition on the ground. Computer-aided<br />
classification and multivariate statistical techniques<br />
(Jongman et al. 1987) allow the classification of site<br />
measurements of vegetation composition into habitat<br />
types or communities and refine the interpretation<br />
of satellite images. Mapping at a more modest level<br />
is accomplished by visual examination of aerial<br />
photos and delineation of apparent community types,<br />
again with checking and correction on the ground.<br />
However, even this level of technical sophistication<br />
is not always available. In the absence of a detailed<br />
vegetation map, even a rough estimate of the<br />
distribution of vegetation types would be preferable<br />
to none at all.<br />
9.2.3 Historical accounts<br />
Information on the trend through time in the structure<br />
of plant communities and elephant densities can come<br />
from historical accounts, whether written or verbal<br />
(Dublin 1991; Campbell 1991) Historical information<br />
is particularly useful if it is accompanied by<br />
photographs in which the localities can be identified<br />
and revisited for comparison (e.g. Lock 1993). More<br />
quantitative data on changes in tree cover can come<br />
from analysis of aerial photographs or satellite images<br />
(see Section 9.2.4).<br />
9.2.4 Remote sensing<br />
HABITAT INTERACTION<br />
<strong>The</strong>re are a number of sources which can provide<br />
data on the nature of habitat on a broad geographical<br />
scale. <strong>The</strong>se include various forms of remote sensing,<br />
a broad term which includes both images obtained<br />
from satellites and from aircraft.<br />
Satellite images are useful for mapping and assessing<br />
changes in ground cover over large areas at a<br />
relatively low cost. Images are produced from<br />
measurements of the reflectance of light at different<br />
wavelengths, some of which are specifically directed<br />
at vegetation cover. A variety of satellites have been<br />
launched, beginning with Landsat l in 1972 and<br />
followed by others in the Landsat series and the<br />
French SPOT system in 1986, with a steady<br />
improvement in the spatial and spectral resolution<br />
of the sensors.<br />
Budd (1991) discusses the relative merits of different<br />
satellite products. An advantage of satellite data is<br />
that they can be analysed readily by computers,<br />
particularly with Geographic Information Systems<br />
(GIS). This can allow rapid classification of large<br />
areas of ground if the reflectance characteristics of<br />
vegetation can be identified. <strong>The</strong> reflectance data are<br />
well-suited for classifying vegetation which is fairly<br />
uniform over large areas, and less so when the pattern<br />
of spatial variation is complex. <strong>The</strong>y can be used to<br />
great effect for mapping areas of bare ground or<br />
burned areas. However, there are a number of factors<br />
which can affect the reflectance of vegetation<br />
including the complexity of plant vertical or<br />
horizontal structure and variations in moisture<br />
content, soil type, atmospheric effects such as dust<br />
or water vapour and the angle of the sun at different<br />
times of year. As noted above in the discussion of<br />
vegetation mapping, sophisticated computer<br />
techniques can also be a drawback when these<br />
facilities are not available, and this can put satellite<br />
data out of the reach of many. <strong>The</strong>re are a number of<br />
remote sensing centres located in Africa where<br />
images can be processed on request and a growing<br />
number of companies which specialise in these<br />
techniques. <strong>The</strong> application of satellite imagery to<br />
elephant -habitat interaction is still an early stage,<br />
but may ultimately prove to be a very useful<br />
technique (Nellis & Bussing 1990).<br />
Quantitative information on habitat structure over large<br />
areas, and through time can be obtained from aerial photos.<br />
Generally the type of photographs which are available for<br />
this purpose are vertical photographs produced by<br />
91
HABITAT INTERACTION<br />
government departments responsible for mapping and<br />
are available at a scale of roughly l :50,000, which may<br />
also be in stereo pairs.<br />
Photographs at a larger scale, such as l :4500, can be<br />
undertaken for the specific purpose of habitat<br />
monitoring (e.g. Viljoen 1990). Often these<br />
photographs are taken with “false colour” film which<br />
is sensitive to infra-red light which detects leafy<br />
vegetation more effectively. For this purpose, it is<br />
possible to purchase relatively high quality cameras,<br />
by manufacturers such as Hasselblad, which can be<br />
mounted in the body of a small fixed-wing aircraft.<br />
<strong>The</strong> smaller scale photographs are generally useful<br />
only for examining changes in tree canopy, while<br />
larger scale photographs may be used for both shrubs<br />
and trees. It may also be possible to identify<br />
individual tree species on the larger scale photos, but<br />
rarely on those of the small scale.<br />
Methods of analysis usually involve outlining<br />
identifiable vegetation patches or areas of bare ground<br />
as polygons with a marker pen and then overlaying<br />
these with a specially designed sheet consisting of a<br />
calibrated random distribution of dots. <strong>The</strong> number<br />
of dots counted, multiplied by a certain factor will<br />
give you the area of the defined polygon (e.g. Dublin<br />
1991; KCS 1991). Tree densities within such<br />
delineated areas may be counted directly (Croze<br />
1974). More sophisticated techniques. involving<br />
image analysis software in computer systems have<br />
also been developed (Viljoen 1990), and when such<br />
equipment is available, it can reduce the amount of<br />
time required for data analysis.<br />
Another source of data on the spatial distribution<br />
of woodland change are low-level (300ft agl)<br />
systematic aerial surveys which are often<br />
undertaken by researchers for censusing large<br />
herbivore populations (See Chapters 3 and 4).<br />
During such surveys, an observer can estimate and<br />
map the relative extent of damaged or fallen trees<br />
(A. Verlinden pers. comm.).<br />
9.2.5 Ground-based vegetation<br />
sampling<br />
Ground-based photographs provide a visual record of<br />
the state of habitats. Qualitative information can be<br />
obtained from comparison of ground-based<br />
photographs from earlier observers (Dublin 1991).<br />
More quantitative information can be derived from<br />
such an approach if the photographs are taken as<br />
panoramas from precisely the same spot on repeated<br />
92<br />
occasions (Dunham 1989). <strong>The</strong>re are limitations<br />
to this technique, since as plants become more<br />
sparse and distant from the photographic point, they<br />
are increasingly difficult to recognise.<br />
Ultimately the most detailed data must come from<br />
examination and enumeration of plants in groundbased<br />
vegetation sampling. <strong>The</strong> most accurate and<br />
repeatable measures come from vegetation plots. It<br />
is necessary to examine the vegetation in sample areas<br />
which are representative of the area as a whole.<br />
Sample sites should be located on the ground without<br />
bias and this can be done by using a map with an<br />
overlying grid and choosing the points to sample with<br />
a random number table. However, as Anderson and<br />
Walker (1974) point out, it is best to locate sample<br />
sites within zones or strata which are relatively<br />
uniform or homogeneous plant communities, rather<br />
than on the ecotone or boundary between types. Such<br />
stratified vegetation sampling can be done with the<br />
use of a map of the main vegetation community types.<br />
<strong>The</strong> method of sampling may also be<br />
“plotless”. Such methods include the Point Centred<br />
Quarter (PCQ) technique (Croze 1974) which<br />
measures the distance to the nearest plant, or the<br />
occlusion quadrat or Bitterlich stick (Lewis 1991)<br />
which uses the angular overlap of tree canopies with<br />
a calibrated measuring gauge to estimate cover and<br />
density. <strong>The</strong>se methods may be useful for a one-off<br />
survey but they tend to give over- or under≠estimates<br />
when vegetation is dumped or cover is high or<br />
variable. <strong>The</strong>y are also difficult to replicate at later<br />
dates.<br />
<strong>The</strong> most reliable method involves counts within<br />
defined areas on the ground (e.g. Anderson &<br />
Walker 1974; Barnes 1983; Guy 1981; McShane<br />
1987; Mueller-Dombois 1972; Mwalyosi 1987).<br />
Since this method is the one most commonly used<br />
by researchers in the study of elephant - habitat<br />
interactions, it is discussed in more detail in Box<br />
9.1.<br />
Measurements of individual plant species should<br />
include plant density, canopy cover, canopy<br />
volume and extent of damage by elephants or other<br />
agents in broad categories (Anderson & Walker<br />
1974). Plant height or classification into categories<br />
such as adult trees (>3m), shrubs (1-3m), seedlings<br />
(0.15-im) and new seedlings (
BOX 9.1: GROUND-BASED VEGETATION PLOTS<br />
include: 0, 1-25, 25-50, 50-75, 75-99, 100 (the latter<br />
indicates the tree is dead). Estimates of percentage<br />
bark stripping should be recorded separately. Finally,<br />
it should be noted whether damage is new (i.e., fresh,<br />
within the last year) or old.<br />
Unless the intention is to gather data quickly and not<br />
to return to the same plot, the plots should be<br />
permanently marked so that they can be returned to<br />
for repeated measurements. Concrete or stone<br />
markers, probably a pyramid or cone buried in the<br />
ground, are needed because elephants will disturb less<br />
permanent markers (G.C. Craig pers. comm.). A<br />
detailed record should be kept of the location of the<br />
plot, with distance and compass bearing from the<br />
nearest road, and notes on landmarks and vegetation.<br />
HABITAT INTERACTION<br />
Ground-based vegetation plots involve counting plants in defined areas on the ground. <strong>The</strong> number of plants counted can be<br />
converted to density by dividing the total area sampled. <strong>The</strong> number of plants in different height categories or damage classes<br />
can be expressed as a proportion of the total number counted.<br />
Vegetation plots can be of different configurations: either “belt’ transects or square or circular quadrats of varying size. Generally<br />
the most convenient to use are transects since they can be aligned on a compass bearing down the centre line, with a constant<br />
width measured by a tape measure stretched out on either side. It takes more time and effort to measure and delineate a square<br />
quadrat on the ground and there is a greater chance of incorrectly counting plants at the edge of the quadrat. Transects can also<br />
be aligned to fall within narrow vegetation types, such as riverine fringes, or to run at right angles to known gradients in<br />
environmental conditions so as to minimise the variation between transects. A circular plot, with a fixed point in the middle and<br />
a measuring tape used to delineate the outer boundary may be used for relatively small plots, such as up to 100m in radius. This<br />
method may be particularly useful for one-off surveys.<br />
Decisions on the size of the sample plot, such as the length and width of transects, should be based on the number of trees,<br />
shrubs or seedlings which can be included. This is a function of plant density and generally, shrubs are more numerous than<br />
trees, and seedlings more numerous than shrubs. This means that, along a transect, the broadest width dimension must be used<br />
for counting trees, with narrower widths for shrubs and seedlings. Anderson and Walker (1974) recommend that at least 10<br />
individuals of the dominant woody species be included in each transect and I would recommend at least 20 should be included.<br />
In their examples, Anderson and Walker (1974) used transects of length 50-100m and of width 1-10m for shrubs and 5-100m<br />
for trees.<br />
Vegetation is patchy and both plant density and impact effects are not likely to be distributed evenly across the study area. For<br />
this reason, it is necessary to have several replicate transects within each habitat type to include the range of variation present<br />
but still have acceptable confidence intervals on the measurements taken. As a rough guide, at least 20 replicate transects<br />
should be measured. <strong>The</strong> aim should be to count several hundred, and if possible thousand, trees of the species of concern in<br />
each habitat type.<br />
Some initial sampling of trees in transects of varying dimensions should be down to allow you to determine the size and<br />
number of transects which will give reasonable confidence intervals, on the order of 10-20% of the estimate.<br />
Statistical analysis should include descriptive statistics such as the calculation of means and confidence intervals and comparison<br />
between habitat types or of the same type at different time with analysis of variance. Count data obtained for trees in transects<br />
are not normally distributed so these will need to be transformed by taking the (natural) logarithm of the count + 1 (since one<br />
cannot take the logarithm of zero). Analyses should be performed on the log-transformed data, then restored back to counts for<br />
the display of results. Note that the restored confidence intervals will not be symmetrical.<br />
However, vegetation may be of limited use since<br />
elephants may remove the trees. When available,<br />
Global Positioning System (GPS) receivers<br />
should be used for locating the exact<br />
geographical coordinates of vegetation plots.<br />
9.2.6 Survivorship studies<br />
<strong>The</strong> rates of survivorship of trees of different<br />
size classes, and promotion or reversal of trees<br />
to different classes is best studied with tagged<br />
trees. Metal tags with a number punched on them<br />
can be nailed to tree trunks or wired to smaller<br />
stems. <strong>The</strong>se must be visited regularly so that<br />
the loss of tags can be distinguished from the<br />
93
HABITAT INTERACTION<br />
disappearance of the tree. Counts of tagged trees<br />
killed by different damage agents from one visit<br />
to the next can be used to calculate the survival<br />
rates per unit time of different size classes.<br />
Notes on individual tree locations, such as<br />
distance along a transect and perpendicular<br />
distance from the centre line should be kept to<br />
assist with identification. A knowledge of the<br />
relationship between size and age of trees is also<br />
important at this level of analysis (Dublin et al. 1990).<br />
9.2.7 Experimental approaches<br />
<strong>The</strong> most effective experimental approach to assess<br />
the effects of elephant impact on vegetation is to<br />
assess plant responses under differences in elephant<br />
density. It is important that other factors, such as soils<br />
or habitat structure are held constant so that the only<br />
factor which varies is elephant density.<br />
Exclosures, where an area of habitat is protected by<br />
an elephant-proof fence, as in Sengwa (Guy 1989) or<br />
a ditch as in Murchison Falls National Park, Uganda<br />
(Lock 1993) or Tsavo National Park, Kenya (van<br />
Wijngaarden 1985) only give an indication of plant<br />
dynamics in the total absence of elephants. If an<br />
exclosure is established when elephant densities are<br />
low but rising, it can show how vegetation conditions<br />
would remain had the increase not occurred. If<br />
established at high density after impact has occurred,<br />
it can give information on recovery rates of<br />
vegetation. Exclosures are often used in conjunction<br />
with fire exclusion plots to separate the effects of<br />
elephants from other environmental factors (Lock<br />
1993).<br />
It may be possible to make use of manipulations<br />
which produce variations in elephant density in<br />
different areas e.g. different culling intensities, inside<br />
versus outside parks, etc. <strong>The</strong> former was proposed<br />
for Tsavo (Laws 1969) and is being contemplated for<br />
Kruger National Park, South Africa (A. Hall-Martin<br />
pers. comm.).<br />
Density gradients are the most powerful method of<br />
obtaining information on the relationship between<br />
animal use and vegetation condition (Andrew 1988).<br />
This happens at naturally occurring sites which are<br />
attractive to elephants, such as water sources or<br />
mineral licks or when there is concentration in a<br />
national park due to poaching (Western 1989).<br />
However, because these are also generally associated<br />
with gradients in soil type and vegetation<br />
communities, the effects of simple differences in<br />
94<br />
elephant density are confounded. <strong>The</strong>re are two<br />
possible approaches to this sort of problem. One is to<br />
study the vegetation at artificially created water points<br />
or salt licks, especially if they are in otherwise uniform<br />
habitat. <strong>The</strong> other is to establish transects which run<br />
parallel to the known environmental gradients but at<br />
a distance from the waterpoint sufficiently far so as<br />
to avoid the effects of density J.ndu Toit pers. comm.).<br />
<strong>Elephant</strong> densities will converge on artificially<br />
constructed waterpoints. such as those in Hwange<br />
National Park, Zimbabwe (Conybeare 1991). It is then<br />
possible to measure vegetation on radial transects<br />
(Thrash et al. 1991). It is also necessary to have a<br />
measure of elephant density along the transect, which<br />
can be assessed by dung counts or direct observations.<br />
In such cases It should be possible to relate directly<br />
elephant densities to change in habitat structure. It is<br />
critical that the length of time of elephant occupancy<br />
at the different densities is known. For example, in<br />
the analysis of vegetation change around waterpoints<br />
for livestock in the Kalahari of Botswana, Perkins<br />
and Thomas (1993) found that both age of the<br />
waterpoint and livestock stocking rate were important<br />
factors in determining habitat condition.<br />
<strong>The</strong> data for this type of experiment can be examined<br />
by plotting the measurements against distance from<br />
the waterpoint and looking for correlations with<br />
elephant density measures. <strong>The</strong> development of a<br />
gradient in vegetation condition over time can be<br />
followed, as the elephants/area! time variable<br />
increases. A further experimental level can be added<br />
by varying the regime of water provision to look at<br />
the change and recovery of vegetation after different<br />
periods of sustained impact (Child 1968).<br />
9.3 ELEPHANT BIOLOGY. DIETS<br />
AND IMPACT ON VEGETATION<br />
<strong>The</strong> areas of interest in the study of elephant habitat<br />
interactions are elephant population densities in the<br />
study area through time, food choices, and rates of<br />
impact on woody vegetation by elephants in relation<br />
to environmental factors.<br />
<strong>Elephant</strong> densities may be measured in the whole area<br />
or in key areas of concern in different seasons. <strong>The</strong>re<br />
should be an examination of elephant<br />
distribution in relation to habitat resources<br />
such as minerals and water supplies. <strong>Elephant</strong>
densities can be expected to be high near water sources<br />
in dry seasons and there may be changes through time<br />
in elephant densities. Increase in density can occur as<br />
numbers increase through reproduction or immigration<br />
into protected areas. Declines in elephant density can<br />
occur after culling operations or poaching.<br />
Feeding choices may be examined by direct<br />
observations of behaviour (see Chapter 10) or more<br />
indirect methods. While the former is the most obvious<br />
way of obtaining direct information about elephant<br />
diets, there are a number of problems. It is not always<br />
possible to observe elephants, if the animals in a given<br />
area are not easy to approach because of the lack of<br />
visitors or the presence of poachers. Viewing conditions<br />
may not allow it in dense habitat, rough terrain, or at<br />
night-time. <strong>The</strong>re is a need to achieve balanced<br />
sampling with respect to use of areas and habitat types.<br />
Differential feeding rates may mean that observations<br />
of diet choice are biased against foods with high intake<br />
rates.<br />
Indirect methods of estimating diet include examining<br />
stomach samples from shot elephants, analysis of faecal<br />
samples and plant-based methods (Chafota 1994; de<br />
Villiers et al. 1991).<br />
9.4 MODELS OF ELEPHANT- HABITAT<br />
INTERACTION<br />
Models of the responses of plant populations to elephant<br />
impact have been developed by Caughley (1976),<br />
Norton-Griffiths (1979), Barnes (1983), Dublin et al.<br />
(1990) and Craig (1992). Of these, the approach taken<br />
by Dublin et al. (1990) in modelling tree population<br />
dynamics may be the most useful. All these models have<br />
their particular advantages, but tend to depend on the<br />
nature of the mathematical formulae involved. An<br />
approach which avoids this drawback is rule-based<br />
modelling, as advocated by Starfield and Bleloch (1986).<br />
9.5 OTHER SPECIES AFFECTED BY<br />
THE INTERACTION<br />
Censuses of other mammals, birds or other animal<br />
species can be conducted to determine which are<br />
affected negatively or positively by the habitat change<br />
induced by elephants. More detailed study of the<br />
habitat requirements of such species would reveal the<br />
aspects of habitat which are most critical.<br />
HABITAT INTERACTION<br />
9.6 CHOOSING A STUDY APPROACH<br />
AND METHODS AND PREPARING<br />
A RESEARCH PROPOSAL<br />
As Taylor (1993 and in Chapter 2) notes, the design of<br />
a research or monitoring programme should be linked<br />
from the outset to clear management goals, and this is<br />
especially true in the case of elephant-habitat<br />
interactions. In broad terms, research involves<br />
observations or experiments aimed at testing hypotheses<br />
about ecological processes, and is not always directly<br />
related to management. Monitoring is a form of research<br />
which is specifically intended to detect change in<br />
ecosystems and can be designed to provide feedback<br />
on the effectiveness of management actions in achieving<br />
pre-determined goals. Research may be undertaken in<br />
short or long term projects while monitoring is expected<br />
to provide results over the medium to longer term. If<br />
the management of ecosystems is truly “adaptive”, its<br />
actions or even goals are reassessed and modified on<br />
the basis of results from research and monitoring.<br />
Equally, research or monitoring approaches may be<br />
modified as results come in or management goals<br />
change.<br />
Deciding on what to study will require giving much<br />
thought to both the goals of the research and the<br />
logistical constraints under which you are operating, so<br />
that the study is focused very clearly on the questions<br />
you want to ask and your ability to obtain answers in a<br />
reasonable time period. It cannot be emphasized too<br />
strongly that the extra time spent at the beginning in<br />
designing a research plan can save a vast amount of<br />
wasted time, effort and resources later on. A clear<br />
research proposal should be drafted and circulated for<br />
comment, both within the government or research<br />
institution where you work and among professional<br />
colleagues, by correspondence if necessary. You should<br />
not be shy of consulting the established national or<br />
international experts in your field of study, and if you<br />
are in doubt about whom to contact, you may start with<br />
the IUCN/SSC <strong>African</strong> <strong>Elephant</strong> <strong>Specialist</strong> <strong>Group</strong>, the<br />
body specifically constituted to encourage technical<br />
cooperation on elephant management.<br />
It is recommended that the relevant management<br />
authorities are consulted in the development of a<br />
research or monitoring plan. It is likely that the process<br />
of consultation may at least alert the management<br />
authorities to your activities and could well initiate a<br />
degree of mutual understanding. Whether or not you<br />
receive useful comments from the managers, the<br />
process should at least make you aware of their<br />
concerns and open the possibility of dialogue.<br />
95
HABITAT INTERACTION<br />
Different objectives require different types of treatment. If<br />
the managers want quick estimates of the rate and extent of<br />
woodland loss, a one≠off, extensive survey of trees is called<br />
for. This may be necessary on a broad geographical scale<br />
or only in key areas of concern. If a more comprehensive<br />
understanding of woodland dynamics is called for, then<br />
sites of fixed vegetation plots should be returned to on a<br />
regular basis, possibly yearly. <strong>The</strong> age structure of the tree<br />
population should be assessed, along with survival rates of<br />
different size classes, reversal rates to lower size classes<br />
and recruitment to the adult stage. Repeated measurements<br />
of permanently identified stands of trees are needed for this<br />
type of information.<br />
<strong>The</strong> study proposal should set a time schedule for research<br />
activities and a deadline for achieving results and preparing<br />
a report on them. This is particularly important in studying<br />
elephant -habitat interactions, since the time scale on which<br />
the ecological events occur is long, but the time scale on<br />
which answers are required for management decisions is<br />
generally short. <strong>The</strong>re is a danger with an open-ended study<br />
of a difficult problem that no answer will be emerge apart<br />
from the unsatisfactory “more research is needed”. Another<br />
danger is that the researcher will be asked to provide answers<br />
that go beyond what his results can provide into the realm<br />
of unsupported opinion. An agreement in advance between<br />
researcher and manager would help to avoid these twin<br />
evils.<br />
<strong>The</strong>re are different scales in space and time that must be<br />
considered in planning a study approach:<br />
a) Geographical or spatial scale<br />
This involves the location and types of area concerned,<br />
from protected areas to areas with a limited degree of human<br />
occupation to areas adjacent to or including intensive human<br />
activity. <strong>The</strong> study area may encompass the whole range of<br />
the national population or focus on key areas of specific<br />
concern.<br />
b) Time scale<br />
Knowledge of past events and trends in the vegetation can<br />
place the present measurable conditions in context, and<br />
provide insight on the large-scale processes already<br />
underway. Information on tree populations and elephant<br />
densities from as far as back as possible into the past up to<br />
the present is needed for the determination of the rate and<br />
direction of change and for generating possible scenarios<br />
for the immediate, short-term and longer-term future.<br />
Logistical aspects to consider include the availability<br />
and competence of biologists and field workers, time,<br />
equipment (including transport), other running costs<br />
and methods of analysis to be used. An overbearing<br />
constraint on all these aspects is the funding available<br />
96<br />
to support the proposed activities.<br />
A successful approach to a large problem, such as elephant<br />
- habitat interactions, is to divide it into manageable parts,<br />
so that an overall research programme can be defined,<br />
composed of individual projects each of which are “doable”<br />
and which may be tackled in order of priority as and<br />
when resources allow. A summary of the methods which<br />
are recommended for use in addressing the different<br />
questions raised by a consideration of management<br />
objectives can be found in Table 9.1.<br />
References<br />
ANDERSON, & WALKER, B.H. (1974) Vegetation composition and elephant<br />
damage in the Sengwa Wildlife Research Area. Rhodesia. Journal of the Southern<br />
<strong>African</strong> Wildlife Management Association 4,1-14.<br />
ANDREW. M. H. (1988) Grazing impact in relation to livestock watering points.<br />
Trends in Ecology and Evolution I3(I2), 336-339.<br />
BARNES, R.F.W. (1981) Effects of elephant browsing on woodlands in a<br />
Tanzanian National Park: measurements, models and management Journal of<br />
Applied Ecology 20, 521-540.<br />
BUDD, J.T.C. (I991) Remote sensing techniques for monitoring land-cover. In<br />
Monitoring for Conservation end Ecology (Ed. B. Goldsmith). pp. 33-59.<br />
Chapman and Halt, London. London.<br />
CAMPBELL, A. (1991) History of elephants in Botswana, In: <strong>The</strong> Future of<br />
Botswana’s <strong><strong>Elephant</strong>s</strong> (Ed. P. Hancock), pp. 5 -1 5 . Kalahari Conservation Society,<br />
Gaborone.<br />
CAUGHLEY, G.J. (1976) <strong>The</strong> elephant problem - an alternative hypothesis. East<br />
<strong>African</strong> Wildlife Journal 14, 265-283.<br />
CAUGHLEY,G.J. (1983) Dynamics of Large mammals and their relevance to<br />
culling. In: Management of Large Mammals in <strong>African</strong> Conservation Areas (Ed.<br />
R.N. Owen Smith), pp.115-126. Haum, Pretoria.<br />
CHAFOTA, J. (1994) Factors governing selective impacts of elephants on woody<br />
vegetation. Ph.D. <strong>The</strong>sis. University of the Witswatersrand, South Africa.<br />
CHILD. G. (1968) An ecological survey of Northeastern Botswana UNDP/FAO<br />
Report to the Government of Botswana.<br />
CONYBEARE, A.M.G. (1991) <strong>Elephant</strong> occupancy and vegetation change in<br />
relation to artificial waterpoints in a Kalahari sand area of Hwange National<br />
Park.D. Phil. <strong>The</strong>sis. University of Zimbabwe, Harare,<br />
CRAIG, G.C. (1992) A simple model of tree/elephant equilibrium. In: <strong>Elephant</strong><br />
Management in Zimbabwe, 2nd Edition (Eds. R.B. Martin & A.M.G. Conybeare),<br />
86. Department of National Parks and Wild Life Management, Republic of<br />
Zimbabwe, Harare.<br />
CROZE, H. (1974) <strong>The</strong> Seronera bull problem II. <strong>The</strong> trees. East <strong>African</strong> Wildlife<br />
Journal 12, 29-47.<br />
DE VILLIERS. PA., PIETERSEN, EW., HUGO. T.A., MEISSNER, H.H. & KOK.<br />
O.B. (I991) Method of sampling food consumption by free-ranging elephant.<br />
South <strong>African</strong> Journal of Wildlife Research 21. 23-27.<br />
DUBLIN, H.T. (I991) Dynamics of the Serengeti-Mara woodlands, An historical<br />
perspective. Forest & Conservation History 35, 169-178.<br />
DUBLIN, H.T., SINCLAIR A.R.E. & MCGLADE, J. J. (1990) <strong><strong>Elephant</strong>s</strong> and<br />
fire as causes of multiple stable states in the Serengeti-Mara woodlands. Journal<br />
of Animal Ecology 59, 1147-1164.<br />
DUNHAM, K.M (1989) Long-term changes in Zambezi riparian woodlands,as<br />
revealed by photopanoramas. <strong>African</strong> Journal of Ecology 27, 263-276.
GUY, P.R. (1981) Changes in the biomass and productivity of woodlands in the<br />
Sengwa Wildlife Research Area, Zimbabwe. Journal of Applied Ecology 18, 507-<br />
519.<br />
GUY, P.R. (1989) <strong>The</strong> influence of elephants and fire on a Brachystegia-<br />
Julbermardia woodland in Zimbabwe. Journal of Tropical Ecology 5, 216-226.<br />
JONGMAN, R.H.G., TER BRAAK, C.J.F. & VAN TONGEREN, O.F.R. (Eds.)<br />
(1987) Data Analysis in Community and Landscape Ecology. Pudoc, Wageningen.<br />
KCS (1991) Tree canopy cover within the dry season range of elephant in the<br />
Chobe National Park. Unpublished report by Ecoserve for the Kalahari<br />
Conservation Society, Gaborone.<br />
LAWS. R.M. (1969) <strong>The</strong> Tsavo Research Project. Journal of Reproduction and<br />
Fertility, Supplement 6, 495-531.<br />
LEWIS D.M. (1 99 1) Observations of tree growth, woodland structure and elephant<br />
damage of colophospermum mopane in Luangwa Valley Zambia. <strong>African</strong> Journal<br />
of Ecology 29, 207 221,<br />
LOCK. J.M. (1993) Vegetation change in Queen Elizabeth National Park, Uganda:<br />
1970-1988, <strong>African</strong> Journal of Ecology 31, 106-117,<br />
MARTIN. R.B. & CONYBEARE, A.M.G. 1 992) <strong>Elephant</strong> Management sty<br />
Zimbabwe (Second Edition). Department of National Parks and Wild Life<br />
Management, Republic of Zimbabwe. Harare.<br />
MCSHANE, T.O. (1987) <strong>Elephant</strong>-fire relationships in Combretum/Terminalia<br />
woodland in south-West Niger. <strong>African</strong> Journal of Ecology 25, 79-94.<br />
MUELLER-DOMBOIS, D. (1972) Crown distortion and elephant distribution in<br />
the woody vegetations of Ruhuna National Park, Ceylon. Ecology 32, 208-226.<br />
MWALYOSI, R,B,B, (1987) Decline of Acadia tortilis in Lake Manyara National<br />
Park, Tanzania. <strong>African</strong> Journal of Ecology 25, 51-53,<br />
NELLIS, M.D. & BUSSING, C.E. (1 990 ) Spatial variation in elephant impact on<br />
the Zambezi Teak Forest in the Chobe National Park, Botswana, Geocarto<br />
International 2,55-57.<br />
HABITAT INTERACTION<br />
One Off Repeated Exclosure <strong>Elephant</strong> <strong>Elephant</strong> Modelling Studies of<br />
Research Historical Satellite Aeral vegetation vegetation and / or population behaviour interaction other<br />
questions accounts imager photographs survey samples gradients studies studies dynamics species<br />
Goegraphical<br />
distribution of<br />
habitat structure<br />
types and damage<br />
in elephant range<br />
L SML SML S ML<br />
Amounts of woody L<br />
cover and damage<br />
in specific areas<br />
SML S ML<br />
Rate of change<br />
in habitat structure<br />
L ML ML ML ML<br />
Distribution of<br />
elephant density<br />
L SML<br />
Rate of change<br />
in elephant density<br />
L ML<br />
Effect of elephant<br />
density on habitat<br />
structure<br />
L ML ML ML ML ML SML SML<br />
Effect on other<br />
animal species<br />
L SML<br />
Scenarios for<br />
different<br />
management<br />
options<br />
ML<br />
Table 9.1 <strong>The</strong> research methods which are most appropriate to address questions derived from management objectives. Coded<br />
entries in the table refer to the time scale addressed: S= short term, the current situation. M= medium term, reflecting<br />
events over, say, 2-5 years. L= long term, covering a period ranging from 5+ years to several decades.<br />
NORTON-GRIFFITHS, M. (1979) <strong>The</strong> influence of grazing, browsing and fire<br />
on the vegetation dynamics of the Serengeti. In: Serengeti. Dynamics of an<br />
Ecosystem (Eds. A.R.E. Sinclair & M. Norton-Griffiths), pp. 310-352. University<br />
of Chicago Press, Chicago.<br />
PERKINS, J.S. & THOMAS, D.S.G. (1993) Spreading deserts or spatially confined<br />
environmental impacts? Land degradation and cattle ranching in the Kalahari of<br />
Botswana. Range Degradation and Rehabilitation 4, 179-194.<br />
SINCLAIR A.R.E. (1983) Management of conservation areas as ecological<br />
baseline controls.. In: Management of Large Mammals in <strong>African</strong> Conservation<br />
Areas (Ed. R.N.Owen-Smith). pp. 13-22. Haum, Pretoria,<br />
STARFIELD, A.M. & BLELOCH, A.L. (1986) Building Models for Conservation<br />
and Wildlife Management. McGraw-Hill. New York<br />
TAYLOR,R.D, (1993) Working <strong>Group</strong> Discussion Three: <strong>Elephant</strong> -habitat<br />
working group. <strong>African</strong> <strong>Elephant</strong> <strong>Specialist</strong> <strong>Group</strong> Meeting 37.22 November 1992.<br />
Pachyderm 17. 10-18,<br />
THRASH. I., NEL P.J., THERON. G.K., & BOTHMA, J. du P. ( 1991 ) <strong>The</strong> impact<br />
of the provision of water for game on the woody vegetation around a dam in the<br />
Kruger National Park. Koedoe 34, 131-148,<br />
VAN WIJNGAARDEN, W, (1985) <strong><strong>Elephant</strong>s</strong> -Trees Grass - Grazers; relationships<br />
between climate, soils, vegetation and large herbivores in a semi-arid savanna<br />
ecosystem. ITC Publication No. 4, Wageningen.<br />
VILJOEN, A.J. (1990) <strong>The</strong> use of video digitised aerial photographs and image<br />
processing techniques for resource management in the Kruger National Park, Sooth<br />
Africa. In: proceedings: Resource Ecology 90, Second International Symposium<br />
on Advanced Technology in Natural Resource Management. Washington, D.C.,<br />
12-15 Nov. 1990.’<br />
WESTERN, D. (1989) <strong>The</strong> ecological role of elephants in Africa. Pachyderm 12,<br />
42-45,<br />
97
10.1 INTRODUCTION<br />
Why study behaviour? Among elephants, as in any<br />
species, behaviour provides insights into the ways in<br />
which animals live and die, what they eat and how<br />
they find it, how they form groups, mate and rear<br />
young. Behavioural studies can examine ranging<br />
patterns, feeding behaviour, social dynamics, mating,<br />
care of young and communication. <strong>The</strong>y can thus<br />
increase our understanding of basic biology and<br />
sociality of elephants in the wild, and form an integral<br />
part of management strategies and conservation<br />
programmes.<br />
<strong>The</strong> first step in any behavioural study is to decide<br />
the kinds of questions which will be addressed. This<br />
is particularly important, since once a question has<br />
been defined, then the kinds of data needed, the detail<br />
and quantity of data required and the duration of the<br />
study will become clear. In the past, field biologists<br />
would locate their subjects and basically record all<br />
behaviours of interest. However, more recent<br />
behavioural studies recognise that time and money<br />
are limited. <strong>The</strong> most effective ways to collect<br />
information are to formulate a hypothesis, or test a<br />
model; or to highlight one particular aspect of<br />
behaviour which specifically needs investigation in<br />
a specific population. Hypothesis testing and model<br />
building are relatively complex and require a good<br />
familiarity with the appropriate literature before the<br />
study begins. Studies of specific populations also need<br />
some background research, both to identify the<br />
question of interest and in order to make broader<br />
comparisons with other populations. <strong>The</strong>se two<br />
approaches, the theoretical and the population<br />
specific, are not mutually exclusive, and in many<br />
cases data collected from a particular population can<br />
be used to revise and refine existing models. <strong>The</strong><br />
important point remains; first define your question<br />
in order to determine the best way to gather data!<br />
98<br />
CHAPTER 10<br />
STUDYING THE BEHAVIOUR OF ELEPHANTS<br />
P.C. Lee<br />
University of Cambridge<br />
Department of Biological Anthropology<br />
Downing Street<br />
Cambridge, U.K.<br />
How, then, is the focus of the study decided? <strong>The</strong>re<br />
are both practical and theoretical ways to decide<br />
how to select behaviour for study. For elephants,<br />
practical questions are often of greater immediate<br />
relevance than more theoretical issues. But even<br />
if the choice of a research question is determined<br />
by practical considerations, a number of basic<br />
principles in the study of behaviour should be<br />
borne in mind. In terms of classical ethology or<br />
studies of behaviour, there are four main areas of<br />
investigation (Tinbergen 1963). <strong>The</strong>se are<br />
development, causation, function and evolution,<br />
defined as follows:<br />
i) Questions about development address how the<br />
behaviour comes about during the life of the<br />
animal. A developmental question can chart the<br />
presence and form of behaviour from infancy to<br />
adulthood, for example the change from suckling<br />
to independent feeding, or it can focus on a single<br />
phase during development, such as play fighting<br />
and its relation to aggression.<br />
ii) Causation relates to how the behaviour is<br />
produced and the mechanisms by which a<br />
behaviour is evoked. It often has a physiological,<br />
anatomical or neurological component. For<br />
example, the heightened aggressiveness of bulls<br />
in musth (see Chapter 1) can be understood in part<br />
in relation to the hormonal changes with are<br />
associated with the musth state.<br />
iii) Function seems relatively straightforward;<br />
what does the behaviour accomplish? However, the<br />
current utility of behaviour (what the behaviour<br />
does at the present moment) can be examined<br />
separately from the more general adaptive function
(i.e, to increase survival or reproduction). At this level<br />
of study, the focus should be on immediate function<br />
-what does the behaviour achieve at the time it<br />
occurs?<br />
iv) Evolution of a behaviour can rarely be tackled<br />
through a study of existing behaviour, In most cases,<br />
a behaviour evolved in the history of the species, and<br />
it may or may not serve the same function at the<br />
current moment. This emphasises the need to keep<br />
the questions of current utility and past adaptation<br />
separate in generating hypotheses.<br />
If the behavioural study takes a theoretical approach,<br />
an understanding of the difference between these four<br />
areas of study is crucial to the establishment of the<br />
specific hypotheses which will be tested. An<br />
hypothesis is an explicit statement of a link between<br />
cause and effect. In the sense of classical logic, “if<br />
A, then B”. An hypothesis may be difficult to prove<br />
definitively, but it should be capable of being<br />
disproved - or falsified. A behavioural study using<br />
hypothesis testing must be designed to test the<br />
proposed causes and their effects, and will need<br />
careful attention to statistical methodology.<br />
On the other hand, practical issues may be central to<br />
the determination of the research question. For example,<br />
an ecological study of elephant - habitat interactions<br />
may be necessary in order to assess the impact of<br />
elephants on vegetation in a confined area over the long<br />
term. In this case, the behavioural component of the<br />
study might be to examine elephant feeding rates, food<br />
choice, seasonal ranging patterns, and group<br />
distribution, in combination with a programme of<br />
vegetation monitoring (see Chapter 9). Another example<br />
of a practical problem leading to the formulation of a<br />
behavioural research strategy might be the conservation<br />
issues involved in studies of the genetics of small<br />
populations. By observing mating and rearing behaviour<br />
in a population, far greater information on the genetic<br />
contributions of different individuals to subsequent<br />
generations will be made available, and the assumptions<br />
of the genetic models can be refined and made specific<br />
to the particular population.<br />
10.2 DEFINING BEHAVIOUR<br />
10.2.1 General<br />
In order to study behaviour, it is first necessary for the<br />
observer to define the behaviour. In most studies,<br />
BEHAVIOUR<br />
these identifications take the form of a definition,<br />
which is made by the observer. Behaviour can be<br />
defined either by its motor patterns or actions; for<br />
example categories of locomotion can be straightforwardly<br />
defined as walking, standing or running.<br />
Alternatively, these same motor actions can simply<br />
be lumped together in a category called<br />
“locomotion” or “moving”. Here, the behaviour is<br />
defined by its outcome rather than by any specific<br />
actions. However, if an elephant is taking a mouthful<br />
of grass for every two steps forward, the definition<br />
of this act as feeding or as walking is subjective,<br />
and the actual term applied to the behaviour depends<br />
on the goals of the study. If the aims of the study are<br />
energetic or ecological, the term “feeding while<br />
walking” might be most appropriate, and a careful<br />
assessment of steps per mouthful is essential in<br />
defining the behaviour. If, however, the study is<br />
examining play behaviour among calves, a more<br />
general term such as “moving” might be sufficient<br />
as a description of the activity. Behaviour can also<br />
be defined by its context, such as a general category<br />
called “oestrous behaviour” on the part of a female<br />
elephant, which is expressed specifically in the<br />
presence of a bull (see Moss 1983 and Chapter 1).<br />
<strong>The</strong> important point is that the activities are observer<br />
defined”- and as such a record needs to be kept of<br />
the definitions and their rationales. This record<br />
should be referred to during the course of the study,<br />
to ensure that the formal, written definition and the<br />
practical categories actually recorded over time<br />
remain the same. It is also important that categories<br />
of behaviour are mutually exclusive - each action<br />
or outcome is used only in a single definition; they<br />
should be easily replicated both by the same observer<br />
in separate observations and by different observers;<br />
and finally, the categories should be limited in<br />
number. This will reduce errors leading to unreliable<br />
data collection. Some familiarity with previous<br />
studies is helpful in that terms and definitions can<br />
be standardised with other researchers allowing for<br />
comparisons with a number of studies.<br />
<strong>The</strong> identification of a behaviour of interest, and the<br />
associated definition, present problems of subjective<br />
judgement. Often a behaviour’s apparent function<br />
may be confused with its definition, thus limiting<br />
the observer’s perspective on the behaviour, or his<br />
or her ability to see the behaviour outside its<br />
specifically defined context. For example, the simple<br />
act of calling head to head, tusk to tusk contact<br />
between bulls’“play fighting” assumes that the males<br />
are a) playing and b) using motor patterns seen in<br />
fighting. Neither assumption needs to be true, and<br />
99
BEHAVIOUR<br />
thus calling the behaviour”“sparring” eliminates<br />
this potential source of bias. <strong>The</strong> problems of bias<br />
in the study of behaviour must be addressed<br />
constantly, from the initial step of deciding the<br />
study’s aims, then with the definitions of<br />
behaviour, and subsequently with how the data are<br />
collected, analysed and interpreted.<br />
10.2.2 Categories of behaviour<br />
<strong>Elephant</strong> behaviour can be divided into the broad<br />
categories of activities, interactions, and<br />
associations. Activities are those acts performed<br />
in normal maintenance or on a regular basis, such<br />
as foraging, drinking or travelling. Interactions are<br />
behaviours exchanged between individuals. An<br />
interaction can occur between two animals<br />
(dyadic) or three (triadic) or several more<br />
(polyadic). <strong>The</strong> interaction can either be one where<br />
individuals simultaneously engage in some<br />
behaviour, or one where there is a sequential<br />
exchange. For example, two calves playing can<br />
take the form of head-to-head pushing<br />
-simultaneous and similar behaviour, or<br />
alternatively, one chases and the other flees -<br />
sequential behaviours, simultaneously exchanged<br />
(Lee 1986). Depending on the nature of the study,<br />
it can be important to distinguish between these<br />
types of interaction. A further important aspect of<br />
interactions can be distinguished during data<br />
collection; the identity of the individual who<br />
initiates the interaction and that of the recipient<br />
can be recorded. For example, during aggressive<br />
encounters between bulls, musth bulls are more<br />
likely to initiate a chase, while the non-musth<br />
subordinate males are more likely to flee (see<br />
Poole 1987, 1989).<br />
Associations are not behaviour in the strict sense<br />
of the term; however, the determination of<br />
associations is often vital to understanding<br />
behaviour, its context and its consequences. An<br />
association reflects the propensity or likelihood<br />
of individuals to be found in the same place at<br />
the same time. Several general measures of<br />
associations can be made. <strong>The</strong> first of these is<br />
the “nearest neighbour”. <strong>The</strong> identity (for<br />
example, age/sex class) of two individuals and<br />
the distance between those individuals can be<br />
recorded to provide information about the<br />
strength of an association. Alternatively the<br />
number and types of individuals found within<br />
some specified distance to a single individual can<br />
be noted.<br />
100<br />
Distance measures can either take the form of<br />
estimates of real distance such as metres, which<br />
need to be practised for accuracy. Alternatively,<br />
the distance could be expressed as “elephant<br />
lengths”, using some standard reference length<br />
(e.g. adult female body length, or trunk length).<br />
Measures of proximity can be complemented with<br />
another measure of association, that of approaches<br />
and leaves. Here the individuals who initiate any<br />
change in proximity and the subsequent response<br />
of others are recorded, as if the change in distance<br />
between them was an interaction. Analysis of these<br />
types of data will be discussed below.<br />
One problem raised by the study of associations is<br />
that of defining an elephant group. Since elephants<br />
can be found in ” groups” that range in size from<br />
two to 2,000, an operational definition of a group<br />
should be an essential starting point for a study.<br />
Sufficient information exists to use as a starting<br />
point the concept of a co-ordinated body of any<br />
number of elephants engaged in similar activities,<br />
travelling in the same direction and none of whom<br />
is further away than the diameter of the main body<br />
of the group (Lee 1987). This definition contains<br />
no assumptions about the composition of the<br />
group, whether bulls, cows and-calves or mixed<br />
sex groups, nor does it imply that a group and a<br />
family unit are synonymous. Indeed, a careful<br />
definition of a group allows for detailed studies of<br />
group composition and individual stability in<br />
association patterns.<br />
10.2.3 Duration of behaviour<br />
In general terms, elephant and other animals’<br />
behaviour occurs either as a discrete event or over a<br />
longer period, as a state of behaviour. Events tend to<br />
be characterised by a single quick occurrence, for<br />
example placing a trunkful of grass in the mouth is a<br />
single event of short duration. However, the state of<br />
feeding or taking a number of trunkfuls, can last for<br />
several consecutive minutes or even several hours.<br />
<strong>The</strong> way in which the behaviour is to be sampled<br />
depends on whether it is an event or a state. Events<br />
are best sampled as frequencies (number per unit<br />
time), while a state can be expressed as a function of<br />
its duration (time spent in the state). <strong>The</strong> recognition<br />
of the type of behaviour, event or state, is of crucial<br />
importance to sample design and determines how<br />
frequently observations are made and for how long.<br />
Several types of measures have been defined (e.g.<br />
Martin & Bateson 1986). <strong>The</strong>se are the latency of
the behaviour, expressed as the time between one<br />
new food, One means of ensuring that each event<br />
and the occurrence of some specified second event.<br />
For example, the delay between a threat and a<br />
retreat can be measured in terms of latency to<br />
respond to aggression. <strong>The</strong> next is that of<br />
frequency, or how many times the behaviour<br />
occurs within a specified time period; e.g. the<br />
number of trunkfuls of food per minute. This can be<br />
expressed as a rate of occurrence per unit time. <strong>The</strong><br />
duration of a behaviour is the measure of how long<br />
the behaviour lasts, and is expressed as seconds or<br />
minutes (length of time) per event. Finally, the<br />
intensity of the behaviour can be recorded. Here, some<br />
qualitative assessment of the level of arousal is made,<br />
and this tends to be a subjective decision, or a post<br />
hoc determination made during analysis. For example,<br />
a greeting accompanied by vocalisation, defecation<br />
and urination can be rated as of a higher intensity<br />
than simple trunk to face contact (Moss 1988).<br />
A final consideration is that of bouts. If a behaviour<br />
consists of a discreet motor pattern or act which is<br />
followed by another act of the same type, the<br />
behaviour can be considered to occur in a bout. For<br />
example, a suckling calf may make nipple contact,<br />
break off sucking for a short time to take a step, then<br />
make contact and suckle again. <strong>The</strong> problem<br />
presented here relates to the issue of dependence; the<br />
several nipple contacts are all behaviourally linked<br />
together. <strong>The</strong> calf continues to suck until some milk<br />
intake has been achieved, and scoring each separate<br />
contact as a suckling event would artificially inflate<br />
the frequencies of suckling. This is a problem because<br />
the behaviour at the start of the suckling attempt<br />
actually determines the behaviour that will follow that<br />
event, and the starting behaviour also determines how<br />
long the state will last. Thus each record of suckling<br />
behaviour is statistically (and practically) dependent<br />
on the previous behaviour. To overcome this problem,<br />
the separate contacts to the nipple can all be classed<br />
within one bout of suckling, and another separate<br />
suckling bout can be determined after a set time has<br />
elapsed. Here, the latency to resume suckling can be<br />
measured and a criterion for separating bouts<br />
determined from these latencies. Another example of<br />
the problem of dependence in bouts is that of feeding.<br />
If an elephant is feeding in the first record of<br />
behavioural observation, then what is the probability<br />
it will still be feeding in the second record? If the<br />
interval between records (sampling intervals) is small,<br />
then the second record is statistically likely to be a<br />
consequence of the first record. If, however, the interval<br />
between records is longer, then there may be an equal<br />
probability that the elephant will be moving or feeding<br />
new food. One means of ensuring that each record is<br />
equally likely to sample any behaviour (and thus be<br />
an independent record of events) is to use a long<br />
interval between records. However, this may mean<br />
that rare events are completely missed during<br />
sampling. Statistical methods for the analysis of<br />
behaviour thought to occur in the form of a bout have<br />
been devised and are discussed by Slater and Lester,<br />
(1982). <strong>The</strong>se examples show that recording<br />
behaviour in fine detail allows for more exact analysis,<br />
and that issues of how best to analyse the observations<br />
must always be considered in designing the sampling<br />
methodologies.<br />
10.3 BEHAVIOURAL SAMPLING<br />
10.3.1 Sampling techniques<br />
BEHAVIOUR<br />
How the behaviour is to be sampled depends initially<br />
on the study’s aims, which determines which<br />
behaviours are to be recorded. Sampling procedures<br />
are then dictated by the need to record behaviour<br />
that occurs as an event or to record the duration of<br />
states, And finally, they will be affected by the biases<br />
or dependency in the behaviour.<br />
<strong>The</strong> best technique for sampling animal behaviour<br />
is to make a continuous recording of the selected<br />
behaviours from a specific individual. This is the<br />
Focal Animal Sampling method pioneered by<br />
Jeanne Altmann (1974). A single animal is chosen,<br />
and a record of its behaviour is made for a specified<br />
period of time. <strong>The</strong> subject must be relatively easy<br />
to identify, to locate and to remain with during the<br />
sampling period. <strong>The</strong>se requirements limit the<br />
applicability of this technique in many studies of<br />
elephants. However, focal animal sampling can be<br />
extended to groups or age/sex classes. <strong>The</strong><br />
principle of this technique is to remain with and<br />
record behaviour from a specific sample group,<br />
for example a family unit, at established intervals<br />
for a set length of time. Again, the period of time<br />
chosen for the focal sample needs to reflect the<br />
possibility of observing the behaviour of interest<br />
during that sample. A focal sample designed to<br />
examine feeding could be as short as ten minutes,<br />
if feeding occurs every two to three minutes.<br />
However, if the behaviour of interest is rare, such<br />
as suckling or play, then samples of several hours<br />
duration may be necessary in order to pick up the<br />
behaviour. Within the focal sample, behaviour can<br />
be recorded either only at specified intervals<br />
101
BEHAVIOUR<br />
during the sample, such as every five minutes for a<br />
one-hour period, or continuously throughout the<br />
specified period (Fig. 10.1). Sampling intervals are<br />
pre-determined points in time during an observation<br />
when behaviour will be recorded, and the<br />
determination of the interval depends on the rate of<br />
occurrence and the duration of the behaviour. It is<br />
essential to avoid the problem of bias in data<br />
collection, which occurs when the sampling interval<br />
is short, relative to how long a behaviour lasts. This<br />
is the problem of dependence in the data, which was<br />
mentioned in relation to bouts.<br />
Interval Sampling£can be either instantaneous, in<br />
that only the behaviour which occurs at the specified<br />
time point is noted, or zero-one sampling where only<br />
the first occurrence of an event is recorded during<br />
the specified interval. This latter technique poses<br />
analytical problems in that no duration can be<br />
measured and frequencies of rare events tend to be<br />
over-represented, while those of very common events<br />
tend to be under-represented (Altmann 1974; Dunbar<br />
1976; Martin & Bateson 1986; but see Rhine &<br />
Linville 1980). <strong>The</strong> technique of continuous<br />
recording allows for precise durations to be attached<br />
to events, and accurate rates of occurrence can be<br />
determined. Such samples are, however, timeconsuming<br />
in terms of both data collection and<br />
analysis and prone to unexpected termination due to<br />
poor visibility or loss of the focal animal. <strong>The</strong>y also<br />
limit the number of individuals that can be sampled<br />
during a short study period. Such samples are<br />
probably best made using an event recorder or<br />
computer.<br />
102<br />
TIME<br />
A S ST S/ST S/ST ST ST<br />
B O F O/F O/F O F<br />
C 1 2 3 4 5 6 7 8 9 10<br />
P P P P P P P<br />
D 1 2 3 4 5 6 7 8 9 10<br />
Y N N Y N Y N Y N N<br />
One alternative technique is that of Scan sampling.<br />
In this method, a number of different individuals are<br />
located and their behaviour is recorded at a specific<br />
time. This is a powerful and effective means of<br />
sampling for basic activities and common<br />
interactions, or for associations between individuals.<br />
However, it must be stressed that repeated scans on<br />
the same individuals or a number of individuals in<br />
the same group carry a risk of producing dependence<br />
in the measured behaviour. Care must be taken to<br />
ensure that if more than one record is made from a<br />
group, each scan is made at intervals great enough<br />
to ensure that the first behaviour recorded will not<br />
determine the subsequent records - in other words at<br />
independent intervals. It should also be recognised<br />
that group activities are often co≠ordinated, and<br />
therefore records from several elephants will be<br />
dependent on the location and group activity; for<br />
example if the group is at a water hole, it is likely<br />
that several elephants will be drinking, and the<br />
proportion of time spent drinking will again be<br />
artificially raised. Furthermore, if two animals are<br />
interacting, and scans are made of both, then the rate<br />
of interaction will also be doubled in comparison to<br />
the “real” rate of interaction. If individual A is playing<br />
with individual B, then recording two scans of<br />
playing will over-estimate the frequency of play as<br />
well as the degree of association. <strong>The</strong> scan intervals<br />
and choice of subjects need to be carefully designed<br />
to avoid this problem. It is very important to sample<br />
evenly across the range of age and sex classes<br />
represented in the group to minimise the potential<br />
sources of bias.<br />
Fig I0.1 An illustration of different sampling techniques in relation to the occurrence of behaviour. A the behaviour to<br />
be sampled (S= Start, ST = Stop); B Continuous recording (0 - Behaviour On, F = Behaviour off); C;<br />
Instantaneous recording on the interval (P = - Behaviour Present on interval); D; Zero-one records of behaviour<br />
during the interval (Y = Behaviour recorded during interval, N = Behaviour not recorded, since only the first<br />
occurrence is noted). Numbers relate to the consecutive intervals in which the behaviour is to be sampled.<br />
>
Behaviour-Dependent sampling is designed to<br />
maximise data collection on rare events. If, for<br />
example, the study is to focus on relatively<br />
infrequent events, for example calf play or the<br />
behaviour of oestrous females during matings, then<br />
the most efficient means of collecting data is to begin<br />
observations only when the behaviour of interest<br />
occurs. While this maximises the detail that can be<br />
collected with respect to the specific behaviour of<br />
interest, such samples cannot be used to determine<br />
frequencies of events.<br />
A final category of observation is that of Ad Libitum<br />
Sampling. This is really a grand name for writing<br />
down specific behaviour of interest when it occurs<br />
unrelated to any interval or time sampling technique.<br />
It is useful only when the visibility of all individuals<br />
is similar, so that all animals are equally likely to be<br />
randomly recorded in a specific behaviour, and for<br />
behaviour which does not vary in the likelihood of<br />
attracting the observer’s attention. It is, however,<br />
an excellent means of gathering data on events which<br />
are unlikely to occur in normal samples such as<br />
births, and for interactions where the direction of<br />
the interaction is of specific interest and the event is<br />
too rare to be sampled extensively by other means,<br />
such as threats or fights between bulls (e.g. Poole<br />
1987).<br />
10.3.2 <strong>The</strong> problems of bias<br />
<strong>The</strong>re are methodological and statistical problems<br />
associated with all these techniques, and the method<br />
chosen will usually be a compromise between<br />
observation conditions, absolute accuracy, complete<br />
independence and sample sizes. <strong>The</strong> main problems<br />
to overcome are those of dependence in the data<br />
collection, which can either be incorporated into the<br />
sampling design or into the analysis. If the behaviour<br />
is recorded at minute one, and again at minute 10,<br />
these two intervals can only be used in an analysis<br />
of frequency of behaviour if it is known that the<br />
behaviour did not occur for the entire 10-minute<br />
period. Otherwise a behaviour that has only occurred<br />
once with a duration of 1O minutes will be counted<br />
as occurring twice, and the frequencies grossly<br />
inflated. In most cases, sampling intervals which are<br />
practical in the field tend to under-represent rare<br />
events and over-represent states with long durations.<br />
Some balance needs to be struck between these<br />
problems, and this is best achieved by ensuring that<br />
the primary sampling interval is longer than the<br />
mean duration of the main behaviour of interest.<br />
During analysis, it is possible to exclude intervals<br />
BEHAVIOUR<br />
which appear to be subject to dependence. Thus, if<br />
behaviour lasts for seven minutes on average, the<br />
data from 10 minute intervals can be analysed. It is<br />
better to over-sample slightly and then reject data at<br />
a later stage than to wish that more samples had been<br />
taken after the fact!<br />
It is important to consider some other general biases.<br />
One of these is time of day. If certain activities are<br />
more likely to happen at specific times of the day,<br />
then over-representation of these times during<br />
observations can produce distorted estimates of rates<br />
of occurrence (see Harcourt 1978). For some<br />
behaviour, such as maintenance activities, it is<br />
essential to ensure that samples are evenly spread<br />
throughout the day. If certain behaviours are more<br />
likely to occur at the same time, for example if<br />
suckling is most likely when animals are resting,<br />
then determining the frequency of suckling if all<br />
observations are made during feeding periods will<br />
be futile. Such problems usually become apparent<br />
only during the analysis phase, and it is worth<br />
bearing them in mind during data collection and<br />
adjusting sampling intervals or sampling intensity<br />
(the frequency of sampling) over the course of the<br />
study.<br />
Another bias can be that of habitat. When behaviour<br />
is associated with specific habitats then efforts must<br />
be made to sample evenly across habitats. Some<br />
behaviour, such as feeding or drinking, is obviously<br />
habitat-dependent, while resting may be more<br />
frequent in wooded areas. <strong>The</strong>se considerations are<br />
critical if the sampling is designed to estimate the<br />
proportion of time spent in specific activities.<br />
Another habitat. specific bias is that of visibility. It<br />
may be impossible to observe elephants in dense<br />
bush, or in deep wet swamps. Alternatively,<br />
elephants may be nervous or disturbed in some<br />
habitats, such as those with poor visibility or near<br />
human settlements or farms. While these problems<br />
are unavoidable in any study, their potential effects<br />
on data collection and results of subsequent analysis<br />
need to be considered.<br />
<strong>The</strong> dynamics of an elephant group can also pose<br />
problems, in that activities may be tightly<br />
synchronised within the group, as noted above. <strong>The</strong><br />
resulting frequencies of a behaviour may thus<br />
depend on the size of the group when the behaviour<br />
is recorded. This emphasises the need to have a large<br />
enough sample to be able to account for observations<br />
drawn from groups of different sizes. <strong>The</strong><br />
methodological drawbacks need to be borne in mind,<br />
although it may be impossible in practice to ensure<br />
103
BEHAVIOUR<br />
that samples are representative of all the possible<br />
groups sizes. Such data should be presented with the<br />
cautionary note.<br />
A final bias may be that of the observer’s presence.<br />
Humans often change the behaviour of the animals<br />
they observe simply by being nearby. Wariness, flight<br />
and aggression are all possible elephant responses to<br />
human observers. Ensuring that subjects are relaxed<br />
around observers, or that observations are made at a<br />
distance great enough not to alter behaviour is an<br />
essential part of any study. <strong>The</strong> process of<br />
habituation’- getting animals used to the observer -<br />
is time-consuming (see Chapter 7).<br />
10.3.3 Field experiments<br />
<strong>The</strong>re are times when the most appropriate method<br />
for studying behaviour is to manipulate a behaviour<br />
and observe the consequences. It can not be stressed<br />
too emphatically that in order to accomplish<br />
successfully a field experiment, the range of potential<br />
consequences should be known. Blind<br />
experimentation with a large, intelligent and longlived<br />
animal with excellent individual recognition and<br />
memory (see Moss 1988) cannot be justified.<br />
However, many forms of field experimentation, when<br />
carefully approached, can produce extremely useful<br />
information, especially those relating to vocal and<br />
olfactory communication (see Poole & Moss 1989<br />
and Chapter 11). Field experimentation typically<br />
consists of presenting a known stimulus to a novel<br />
group or individual and recording the consequences<br />
of this presentation. <strong>The</strong> choice of stimulus, its mode<br />
of presentation and the recording of behaviour are<br />
subject to the same constraints and design techniques<br />
as are observations of normal behaviour, with the<br />
additional constraint of ethical or welfare<br />
considerations.<br />
10.4 DATA COLLECTION<br />
TECHNIQUES<br />
10.4.1 Sampling protocol<br />
First find your elephant! This is in fact more difficult<br />
to accomplish than might be thought. Choice of<br />
animals as subjects needs to be incorporated into<br />
the study design. <strong>The</strong> biases discussed above must<br />
be carefully considered, and the effects of time of<br />
104<br />
day, habitat, group size, group composition,<br />
activity and so on, all need to be examined with<br />
respect to the choice of subjects.<br />
<strong>The</strong> method least open to subjective or observer bias is<br />
to use some random sampling criterion. However, the<br />
randomisation of subjects is only possible when it is<br />
known that such individuals can be located with relative<br />
ease! In a random sampling method, a predetermined<br />
list of subjects would be generated. If the subjects are<br />
to be bulls, then where individual identities are known,<br />
they could be assigned to a sample order from a random<br />
number table (a published list of randomly selected<br />
numbers). If, as is more likely, identities are not known,<br />
then age classes (see Chapter 7) could be randomly<br />
sampled. <strong>The</strong> random assignment of age classes to the<br />
priority list of samples might produce a list of subjects<br />
as follows: male 1A, male 1A, male 3, male 4, male 2<br />
etc. Thus, the first bull to sample would be a young<br />
bull in age class 1A or 10-15 years, followed by<br />
another of the same age, then a bull in class 3 or 25-<br />
35 years, then one in class 4 or 35-50 years, and<br />
another in class 2 or 20-25 years, etc. (see Chapter 7<br />
and Poole 1989). A non-random but also<br />
predetermined list could be to take the first bull<br />
encountered in each age class, rotating through the<br />
classes throughout the sampling period. A list more<br />
prone to bias, but easier to follow would be to choose<br />
subjects as a function of their first sighting. As long<br />
as the next individual chosen was not in proximity<br />
to the previous subject, this technique maximises data<br />
collection for search time, which is always an<br />
important consideration in data collection. It can not<br />
be stressed too strongly that each sample on different<br />
individuals should be independent of the previous<br />
sample made, and that no single individual or age/<br />
sex class should be overly represented in the total<br />
samples.<br />
One excellent means of locating and sampling<br />
independent groups or individuals of appropriate age/<br />
sex classes is to use a transect method. A predetermined<br />
search route is established, and all elephants contacted<br />
along this route are sampled over a specified time<br />
period. A transect has the specific advantage in that<br />
the chosen search route can be designed to sample<br />
evenly specific habitats or areas, and thus an accurate<br />
representation of elephant distributions and group sizes<br />
in each habitat can be made. However, the transects<br />
must also be made so that factors such as time of<br />
day are also considered. Thus a route that is<br />
followed on one day at a specified time should<br />
also be taken at different times of day and in<br />
different seasons, producing an equal number of<br />
points for day, month and year in each habitat. One
minor problem is that elephants tend not to<br />
concentrate on routes at the observer’s request. Thus<br />
the elephants of interest can be known to be<br />
elsewhere, and the transect will produce what is<br />
known as negative sightings or no record of elephants<br />
in the area. <strong>The</strong>se negative sightings are also<br />
important, for they allow for an accurate assessment<br />
of preference and avoidance of specific areas.<br />
An alternative method is simply to choose the first<br />
animal or group containing the appropriate age/ sex<br />
class which is contacted at a specific time of day in a<br />
habitat. This group or individual can then be observed<br />
for a set period of minutes to hours, or even over 24<br />
hours where possible. While this tends to bias<br />
observations towards those groups which are more<br />
readily located, such as very large and visible groups,<br />
or towards habitats where visibility is good, it<br />
maximises sampling intensity and minimises time loss<br />
through searching. Typically, some compromise will<br />
be struck between the random and the first sighting<br />
techniques which will depend on the time and energy<br />
available for observation.<br />
STANDARD RECORD:<br />
It should be noted that the method of observation again<br />
depends on the aims of the study. A study of young<br />
animals will obviously benefit from selectively and<br />
intensively sampling only those groups with relevant<br />
potential subjects such as calves, while one designed to<br />
examine habitat use needs to ensure equal representation<br />
of habitats used or not used by elephants. <strong>The</strong> intensity<br />
and effectiveness of sampling techniques depend on the<br />
ability to locate elephants, and to approach or observe<br />
them, and this will influence the study’s design.<br />
10.4.2 Recording data<br />
Sample/Identity Date/Time<br />
Location/Habitat Weather<br />
<strong>Group</strong> Size <strong>Group</strong> Type<br />
a) Checksheets<br />
<strong>The</strong> least technologically complicated, and thus the<br />
least prone to failure (and the cheapest) way to<br />
record data is to use a checksheet (Fig. 10.2).<br />
Checksheets are merely a means for ordering<br />
observations onto paper, and thus can be designed<br />
to collect data at any level of complexity. A simple<br />
checksheet will consist of a number of<br />
columns wherein predetermined categories of<br />
TIME ACTIVITY NEIGHBOUR DISTANCE NEIGHBOUR ACT.<br />
00<br />
05<br />
10<br />
15<br />
20<br />
25<br />
30<br />
BEHAVIOUR<br />
TIME (S/ST) APPROACH AGGRESSION CONTACT VOCAL PLAY<br />
Figure 10.2 A sample checksheet including both an instantaneous record for events and a timed continuous record for states and<br />
interactions. In the standard record, background information relevant to the sample is noted. In the next section, activities<br />
and nearest neighbours are recorded at five minute intervals. In the third section, the time of all interactions (start and<br />
stop) within the 30-minute observation can be recorded and the type of interaction coded into the appropriate column.<br />
105
BEHAVIOUR<br />
behaviour can be scored as and when they occur.<br />
Typically, standard information will be assigned to<br />
each checksheet - for example, date, time, location,<br />
weather conditions, sample number. <strong>The</strong>n specific<br />
information is encoded such as the individual or the<br />
age-sex class under observation, its group size,<br />
activity, habitat, and individuals in proximity or the<br />
general group composition. For a scan sample, this<br />
may be all that is recorded before proceeding to the<br />
next scan. In a focal sample, a number of such scans<br />
will be made on the same individual at the<br />
predetermined intervals, and along with this<br />
information a continuous record of all other behaviour<br />
or interactions can be made in the appropriate<br />
columns (see Fig. 10.2 & 10.3). Checksheets allow<br />
for rapid, accurate recording within predetermined<br />
categories, using codes placed within columns.<br />
Alternatively, categories of behaviour can simply be<br />
ticked as and when they occur. Greater detail can be<br />
written out in longhand, if some space is kept for<br />
notes. Checksheets using columnar form are also very<br />
easy to analyse, since it is quick and efficient to sum<br />
events in each column.<br />
b) Field notes<br />
Field notes tend to be a longhand record of all<br />
observations of interest, which can be transcribed<br />
onto a checksheet later. Field notes or observations<br />
can also be made into a tape recorder and<br />
subsequently coded onto sheets. <strong>The</strong>se records can<br />
either be of the ad libitum type, or of standardised<br />
sampling protocols, where the recording device is in<br />
the first instance a notebook. <strong>The</strong>se have the<br />
advantage of being inexpensive and easy for anyone<br />
to use, the sequences of behaviour can be preserved,<br />
106<br />
Scan Sheet No:<br />
and behaviour which does not easily fit into categories<br />
can be recorded. However, notebooks have the<br />
disadvantage of requiring considerable writing.<br />
c) Tape recorders and video cameras<br />
Tape recorders and video cameras are useful when<br />
much behaviour is occurring with great rapidity and<br />
the observer does not wish to lose visual contact with<br />
subjects to write on the checksheet. However, like all<br />
equipment, tapes, tape-recorders and video cameras<br />
are prone to failure in the field; considerable training<br />
is required before they can be used properly; and they<br />
are costly in terms of subsequent time needed for<br />
transcription or video tape analysis. Video cameras<br />
are especially useful when some documentary<br />
evidence would come in handy.<br />
d) Computer event recorder<br />
<strong>The</strong> most technologically complex mode of recording<br />
observations is the computer event recorder, where<br />
all sequential and continuous observations of acts and<br />
interactions can be coded together with time and<br />
identity keys. Computer events recorders require<br />
constant power levels, rather complex programmes<br />
for the encoding of data and even more complex<br />
programmes for the subsequent decoding and<br />
analysis. If computers are to be used in the field, it is<br />
essential to procure a hard (paper) copy of the<br />
observations on a very regular basis to guard against<br />
equipment and programme failure. As these machines<br />
become smaller, more powerful and more robust, they<br />
will prove to be the checksheets of the future.<br />
However, for those on a tight budget or with little<br />
access to power and technology, the checksheet<br />
remains a potent observational tool.<br />
Date Time Loc Hab GP B/ ID Act Food NN NN NN NN<br />
Size CC Act Food Dis<br />
Fig. 10.3 A sample check sheet used to make scan samples on groups of elephants, for sampling activity and proximity from a range<br />
of age/sex classes. Location (Loc) and Habitat type (Hab) are entered for each separate group or elephant sampled, along<br />
with group size and composition (e.g. the number of bulls and cows/calves -B/CC). <strong>The</strong>n the identity or age/ sex class of the<br />
scan subject (ID) is noted for that time along with the identity of the nearest neighbour (NN), its activity and food types, as<br />
well as distance between elephants. Other information could easily be incorporated, such as the general group activity, the<br />
presence of interesting elephants (oestrous females, musth bulls), the identity of the families composing the group and so on.
BOX 10.1: SMAPLING PROTOCAL FOR STUDYING ELEPHANT BEHAVIOUR<br />
Priority 1: Determine which elements of behaviour are to be investigated, and why.<br />
a) Establish the research question, its theoretical or practical aim, its cost and how long it will take.<br />
Example:<br />
Mother-calf dynamics<br />
<strong>The</strong>oretical relevance: Maternal investment, development of sex differences<br />
Practical issues: Calf survival, family dynamics, reproductive rates, growth<br />
Cost and Duration: Specific to site and methodology used<br />
Priority 2: Ageing and sexing of individuals in the populations, identification, habituation to<br />
observer.<br />
a) Establish a contact point with elephants. That is, how they will be observed and where they will be found.<br />
Will elephants be observed from hides, platforms or vehicles? Remember that static observation sites will<br />
provide site specific and probably activity specific data. Observations can be made on foot, but this carries<br />
substantial risk if the elephants are wary.<br />
Evidence of elephant presence (vegetation damage, fresh dung, vocalisations) can aid in determining areas<br />
of high use. Transect drives or predetermined search routes through an area known to contain reasonable<br />
densities of elephants can be used as a starting point for finding elephants.<br />
b) Age and sex the population (Chapter 7). This will provide the essential demographic information on the<br />
populations and the necessary background for choosing the subjects (and topics) for the behavioural study.<br />
c) Identification of individuals (see Chapter 7). While individual identification is not a prerequisite of<br />
behavioural studies, far more information can be obtained and the validity of results will be greater when<br />
distinctions can be made between different matriarchs, families, or mature bulls. Establish a photographic<br />
or line drawing file of ears, tusks, body shape and size, which can be consulted rapidly under field conditions<br />
(see Chapter 7).<br />
Example: Identify individual mothers, and where possible, calves; age and sex calves; age mothers; determine<br />
family compositions.<br />
Priority 3: Determination of subjects for observational study.<br />
BEHAVIOUR<br />
a) Establish the subjects for study. In conjunction with the focus of research, use the information available<br />
about the population structure, its distribution through space and individual identification to make decisions<br />
about which animals to target in the study.<br />
b) Establish an observation protocol. Determine the frequency and duration of observation periods. Determine<br />
how and when to locate and observe new subjects, and how many repeated observations on the same<br />
individuals or same age/sex class are needed. Determine how observations are to be spread throughout<br />
seasons, months, 24-Hour periods, and across locations and activities if possible.<br />
Example: Choose enough families for observations so as to be able to match subject calves for sex, age and<br />
family size. Control if possible, for differences in family composition. Alternate between detailed<br />
observations on specific calves (focal samples) and random scans of all calves contacted once perday<br />
to minimise individual variance. Focal sample duration to be determined by maximum period of<br />
uninterrupted contact, as well as the frequency of behaviours interest.<br />
107
BEHAVIOUR<br />
10.5 ANALYSIS DESIGN<br />
Throughout this chapter, the problem of bias in<br />
sampling protocol has been stressed in order to facilitate<br />
accurate and reliable analysis and interpretation of<br />
results. A number of other features of analysis should<br />
be considered in behavioural studies.<br />
Sample sizes must be large enough for robust statistical<br />
treatment when the study aims to go beyond simple<br />
description and test hypotheses. One specific problem<br />
is that many observations of a behaviour will not in<br />
themselves produce a large sample size; the<br />
observations must be drawn from a large enough sample<br />
of individuals or groups so that no single observation<br />
will contribute disproportionately to the overall total.<br />
Hence the emphasis on the even spread of samples over<br />
time, age classes, habitats, etc. If there is not an even<br />
spread, few statistical tests will be possible. Good<br />
computer software for statistical analysis helps greatly<br />
in this area, but students of behaviour should be aware<br />
that their observations seldom fit the requirements of<br />
normal distributions, matched sample sizes, even<br />
variance, etc., required for the application of parametric<br />
tests, and thus some familiarity with non-parametric<br />
statistics (e.g. Siegel & Castellan 1988) is essential. A<br />
statistician will help explain the difference between these<br />
two types of tests.<br />
108<br />
Priority 4: Determination of behaviour to be recorded<br />
a) Define the behaviour of interest. For each behaviour type, record a definition so that it can be replicated by<br />
others and remain consistent across the duration of the study.<br />
b) Determine the method of recording. Trial samples will probably be needed to ensure that behaviour is<br />
recorded accurately, quickly and reliably over time. Establish codes, check sheets or computer inputs for<br />
making a permanent record of events, states, durations, interactants, directionality of interactions, outcomes<br />
of interactions and associated consequences. Ensure through practice observations that each record of<br />
behaviour is independent.<br />
c) Maximise sampling frequency and duration to ensure a statistically reliable sample of behaviour, of individuals<br />
and to correct for variance due to time of day, habitat, season and activity. Adjust sampling frequency and<br />
duration as the study progresses to ensure equal representation of subjects and correct for variance. Tally<br />
(add up or code) observations throughout the study. Keep a record of any changes to the sampling protocol<br />
over time.<br />
Example: Calf and mother energetics assessed by record of maintenance activities, foraging, habitat use and<br />
group size. Mother / calf interactions, assessed by play, sucking or contact, by taking focal samples<br />
on different calves, while measures of time spent in activities or in proximity can be assessed from<br />
random scans on claves from a wide range of ages, sexes and family compositions. Additional<br />
measures, such as growth, can be determined from footprints, while reproductive events can be<br />
continuously monitored during the course of the study.<br />
<strong>The</strong>re are three main forms for the analysis of<br />
behavioural observations (Lee 1983). Events can be<br />
counted (tallied) and expressed as a rate per observation<br />
time. <strong>The</strong> tallies can also be used to produce estimates<br />
of the proportion of observation time spent in different<br />
events or acts for separate subjects. Direct measures of<br />
the duration of states can be made and used to calculate<br />
descriptive statistics for the different states. If data are<br />
collected from individuals who are known to be<br />
different, it is always important to retain the identity of<br />
those individuals in the analysis, so as to minimise the<br />
differential contribution of any single animal. <strong>The</strong> same<br />
is true if samples are collected from recognised age/sex<br />
classes, so as to ensure equal representation across a<br />
population of animals.<br />
A second form of analysis is that of the ratio. Here the<br />
frequency of one event is expressed relative to that of<br />
another event. For example, the ratio of steps to trunkfuls<br />
can be used to describe the intensity and energetics of<br />
foraging. Ratios imply that the behaviours which are<br />
analysed together are indeed associated in some way. It<br />
is important to demonstrate analytically this relationship<br />
before creating the ratio. Finally, the observations can<br />
be used to derive an index. An index is specifically useful<br />
for assessing elements of relationships or interactions<br />
that cannot be directly measured. <strong>The</strong>y do not represent<br />
“real” time, and as derived measures,
are difficult to use in statistical tests since<br />
expected distributions can not be known. However,<br />
as an approximation or description of an<br />
interaction or relationship, they remain a powerful<br />
analytical tool.<br />
<strong>The</strong>re are many indices that have been used in<br />
behavioural analyses. Some are simple<br />
calculations of the relative contribution of different<br />
proportions to an overall sum, such as an index of<br />
dietary diversity or heterogeneity. Another is an<br />
index which assesses individual responsibility for<br />
initiating interactions (Hinde & Atkinson 1970).<br />
Another common index used in behavioural studies<br />
relates to associations and uses proximity data to<br />
calculate an index of association. <strong>The</strong>re are many<br />
different association indices available, which vary<br />
in the way in which the separate and joint<br />
observations are used in calculations (e.g. White<br />
& Burgman 1990). One of the more useful indices<br />
for elephants is that discussed by Ginsberg and<br />
Young (1992) of the simple ratio of sightings as<br />
X/N-D, which represents the number of sightings<br />
in which individuals or groups A and B are seen<br />
together (X), divided by the total number of<br />
viewing periods (N), minus the number of viewing<br />
periods in which neither A nor B is sighted (D).<br />
A final difficulty to overcome during analysis is<br />
how to cope with truncated observations, or<br />
incomplete records of states during an observation.<br />
In many cases, a sample may be interrupted by<br />
the loss of visibility. If this happens, a record<br />
of”“out-of-sight” should be noted, so that<br />
proportions of time can be corrected. If poor<br />
visibility leads to an incomplete record of a state,<br />
then again, this observation should be discarded<br />
in analysis. In some cases, a timed sample may<br />
start when the animal is already engaged in a<br />
behaviour. Again, the duration for the ongoing state<br />
is incomplete, and should be discarded, as should<br />
one that carries on beyond the end of the timed<br />
sample. In the latter case, it is possible to continue<br />
recording the behaviour until it terminates, in order<br />
to measure a duration completely, but the extended<br />
sample time should be excluded in calculations of<br />
frequency It may be best to abandon a sample, and<br />
restart it again in its entirety at some later time if<br />
the loss of visibility is extensive. Following<br />
elephants over rough terrain or through thick bush<br />
tends to increase the loss of observation time, and<br />
the design of the sampling interval should always<br />
keep in mind the probability of completing a full<br />
observation period.<br />
10.6 CONCLUSIONS<br />
<strong>The</strong> study of elephant behaviour is a difficult but<br />
rewarding task which needs to be well thought out.<br />
<strong>The</strong> aims of the study should be clearly stated; the<br />
methodology should be appropriate to those aims,<br />
involve minimal disruption to the elephants’ normal<br />
behaviour, and be unlikely to stress the animals. With<br />
large, long-lived animals that have considerable<br />
individual variation in their behaviour,<br />
generalisations can be difficult to make unless sample<br />
sizes are large, and the study period is extensive.<br />
Nevertheless, data critical to the survival and<br />
successful management of elephants can be obtained<br />
from behavioural studies, and the practical difficulties<br />
can be overcome through the careful design of<br />
observations.<br />
10.7 FURTHER READING<br />
Jeanne Altmann’s paper remains essential reading:<br />
Altmann, J.<br />
(1974) Observational study of behaviour:<br />
sampling methods.<br />
Behaviour 49:<br />
227-65.<br />
<strong>The</strong> following books are very useful introductions<br />
to behavioural observations and their applications:<br />
McFarland, D. (Editor) (1981)<br />
<strong>The</strong> Oxford<br />
Companion to Animal Behaviour.<br />
Oxford<br />
University Press, Oxford.<br />
BEHAVIOUR<br />
Martin, P. and Bateson, P. (1986) Measuring<br />
Behaviour: An Introductory Guide.<br />
Cambridge University Press,<br />
Cambridge.<br />
Sackett, G.P. (Editor) (1978)<br />
Observing Behaviour<br />
Vol. II: Data Collection and Analysis Methods.<br />
University Park Press, Baltimore.<br />
Lehner, P.N. (1979) Handbook of Ethological<br />
Methods. Garland STMP Press, New York.<br />
109
BEHAVIOUR<br />
Some statistical knowledge is helpful prior to<br />
starting a study. Basic texts are:<br />
References<br />
110<br />
Siegal, S. and Castellan, N.J. Jr. (1988)<br />
Non parametric Statistics for the Behavioural<br />
Sciences.<br />
McGraw-Hill, London.<br />
Snedcor, G.W. and Cocran, W.G. (1980)<br />
Statistical Methods (7th Edition). Iowa State<br />
University Press, Ames, Iowa.<br />
Sokal, R.R. and Rohlf, F.J. (1981) Biometry<br />
(2nd Edition). W.F. Freeman, San Fransisco.<br />
ALTMANN, J. (1974) Observational study of behaviour: sampling methods.<br />
Behaviour 49, 227-65.<br />
DUNBAR. R.I.M. (1976) Some aspects of research design and their<br />
implications in the observational study of behaviour. Behaviour 58,79-98.<br />
GINSBERG, J.R. & YOUNG, T.P. (1992) Measuring associations between<br />
Individuals or groups in behavioural studies. Animal Behaviour 22, 377-379.<br />
HARCOURT, A. H. (1978) Activity periods and patterns of social interaction:<br />
a neglected problem. Behaviour 66, 121-35,<br />
HINDE, R.A. & ATKINSON, S. (1970) Assessing the roles of social partners<br />
in maintaining mutual proximity, as exemplified by mother-infant relations<br />
in rhesus monkeys. Animal Behaviour 18, 169-76.<br />
LEE. P.C. (1983) species, study sites and methods. In Primate Social<br />
Relationships: An Integrated Approach (Ed. R.A. Hinde), pp 8-16. Blackwell,<br />
Oxford.<br />
LEE. P.C. (1986) Early social development among <strong>African</strong> elephant calves.<br />
National Geographic Research 2, 388-401.<br />
LEE P.C. (1987) Allomothering among <strong>African</strong> elephants. Animal Behaviour<br />
35, 228-91.<br />
MARTIN, P. & BATESON, P. (1986) Measuring Behaviour: An Introductory<br />
Guide. Cambridge University Press, Cambridge.<br />
MOSS, C.J. (1983) Oestrous behaviour and female choice in the <strong>African</strong><br />
elephant. Behaviour 86, 167-96.<br />
MOSS, C.J. (1988) <strong>Elephant</strong> Memories. Thirteen Years in the life of an<br />
<strong>Elephant</strong> family. Willian Morrow and Company, New York.<br />
POOLE, Ill. (1987) Rutting behaviour in <strong>African</strong> elephants the phenomenon<br />
of musth. Behaviour 102, 283-316.<br />
POOLE, J.H. (1989) Announcing intent: the aggressive state of musth in<br />
<strong>African</strong> elephants, Animal Behaviour 37, 140-152.<br />
POOLE, J.H. & MOSS, C.J. (1989) <strong>Elephant</strong> mate searching: group dynamics<br />
and vocal and olfactory communication. Symposium of the Zoological Society<br />
of London 65,111-125,<br />
RHINE, R.J. & LINVILLE, A.K. (1980) Properties of one-zero scores in<br />
observational studies of primate social behaviour: tine effect of assumptions<br />
on empirical analyses. Primates 21, 111-22,<br />
SIEGAL, S. & CASTELLAN, N.J. (1988) Nonparametric Statistics for the<br />
Behavioural Sciences. McGraw-Hill, London.<br />
SLATER, P.J.B. & LESTER, N.P. (1982) Minimising errors in splitting<br />
behaviour into bouts. Behaviour 79, 153-161.<br />
TINBERGEN, N. (1963) On aims and methods of ethology. Zietschrift fur<br />
Ticrpsychologie 20, 410-33.<br />
WHITE, F.J. & BURGMAN. M.A. (1990) Social organization of the pygmy<br />
chimpanzee (Pan paniscus) - multivariate analyses of intra-community<br />
associations. American journal of Physical Anthropology 83, 093-201,
SECTION 4<br />
DEVELOPING RESEARCH TECHNIQUES<br />
111
11.1 INTRODUCTION<br />
<strong>The</strong> study of vocal communication in elephants is a<br />
new and exciting field. Scientists first realised as<br />
recently as the 1980s that a large proportion of elephant<br />
vocal communication actually takes place below the<br />
30Hz low-frequency limit of human hearing, i.e., it is<br />
infrasonic. It has now been established that the vocal<br />
repertoires of <strong>African</strong> and Asian elephants include a<br />
wide variety of infrasonic “rumbles”, in addition to<br />
the better known audible vocalisations such as<br />
trumpets and screams (see Berg 1983; Payne et at.<br />
1986; Poole 1988; Poole et al. 1988). Humans can<br />
usually detect infrasonic calls when they are close to<br />
a vocalising elephant, since the harmonics (whole<br />
number multiples of the fundamental frequency) in<br />
most rumbles extend into the audible range. However,<br />
we cannot hear the fundamental frequencies of these<br />
infrasonic calls, which typically lie between 14 and<br />
35Hz. <strong>The</strong>se extremely low fundamental frequencies<br />
give rumbles an unusual property - the potential to be<br />
heard over very long distances (e.g. Payne 1989;<br />
Langbauer et al. 1991).<br />
Understanding communication in elephants is<br />
undoubtedly one of the most important steps in the<br />
process of understanding elephant social organisation,<br />
and studies of vocal communication are a critical<br />
component of this. Communication is at the basis of<br />
each elephant’s complex social life. <strong>The</strong> unusually<br />
extensive social networks that elephants appear to<br />
establish (Moss & Poole 1983) may be at least partly<br />
a function of the opportunities for long-distance<br />
communication that infrasound affords. Studies of<br />
vocal communication can also provide information<br />
on the cognitive abilities of elephants - their skills of<br />
social recognition through calls and the complexity<br />
of the messages that they are able to send and receive.<br />
112<br />
CHAPTER 11<br />
STUDYING VOCAL COMMUNICATION IN ELEPHANTS<br />
Karen McComb<br />
School of Biological Sciences,<br />
Biology Building, University of Sussex, Falmer<br />
Brighton BN1 9QG, U.K<br />
Amboseli <strong>Elephant</strong> Research Project, , <strong>African</strong> Wildlife Foundation<br />
P.O. Box 48177, Nairobi, Kenya<br />
Knowledge of how elephants use calls to co-ordinate<br />
their activities could enable us to identify vocal<br />
stimuli that, when replayed, might be used to move<br />
groups away from areas where they are causing<br />
damage. More generally, studies of communication<br />
will provide essential baseline information for<br />
elephant management and conservation by revealing<br />
the nature and extent of social ties within natural<br />
populations.<br />
In this chapter I shall outline the techniques that are<br />
currently available for studying vocal communication<br />
in elephants. Two techniques are central to any study<br />
of vocal communication -making sound recordings<br />
of calls, and monitoring the responses of listening<br />
subjects when these calls are replayed under<br />
controlled conditions (McGregor et al. 1992). This<br />
powerful combination allows the investigator to study<br />
not only the structural differences between calls, but<br />
also how other members of the species react to them.<br />
Most studies of elephant communication will involve<br />
a combination of recording and playback, and will<br />
be supplemented with vocal analysis. In all cases,<br />
this level of study should be preceded and<br />
complemented by opportunistic observations of the<br />
vocal exchanges that occur between elephants during<br />
their normal daily lives. <strong>The</strong> observational work will<br />
be particularly important in helping to define the<br />
questions to be tackled in a study and will contribute<br />
to the formulation of clear testable hypotheses.<br />
Whether the aim is to determine the processes that<br />
underlie social recognition, or to identify infrasonic<br />
stimuli that could be used to deter elephants from<br />
crop raiding, the questions must be well defined at<br />
the outset of the study (see McGregor et at. 1992;<br />
Barnard et al. 1993).
11.2 RECORDING ELEPHANT<br />
VOCALISATIONS<br />
11.2.1 General<br />
<strong>Elephant</strong> vocalisations pose quite a challenge to<br />
sound recordists - amateur and professional alike.<br />
While the elephant ear is specialised for detecting<br />
very low frequencies (Heffner & Heffner 1980;<br />
Heffner et al.1982), this is not true of the human ear,<br />
or of the average microphone and tape recorder.<br />
Stringent precautions must therefore be taken to<br />
ensure that the infrasonic frequencies of calls are<br />
being accurately captured on tape. Below, I discuss<br />
the rules which should be employed when choosing<br />
recording equipment, the range of equipment that is<br />
currently available, and the ways in which this<br />
equipment can be employed to make high-quality<br />
recordings of elephant vocalisations. <strong>The</strong> goal of the<br />
investigator at all stages in the process should be to<br />
make recordings that are clear and accurate<br />
representations of real vocalisations. <strong>The</strong> ultimate test<br />
is whether these recordings, when reproduced at the<br />
correct volume, would sound convincing to an<br />
elephant.<br />
11.2.2 Equipment<br />
a) <strong>The</strong> frequency response of the system<br />
Not being capable of hearing the fundamental<br />
frequencies of infrasonic vocalisations ourselves, we<br />
cannot assess whether a sound recording system is<br />
doing its job properly by simply listening to it. Before<br />
embarking on recording, it is essential to check that<br />
the proposed equipment is technically capable of<br />
recording across the whole range of frequencies that<br />
occur in elephant vocalisations. <strong>The</strong> basic<br />
requirements for recording are a microphone, a tape<br />
recorder and possibly, depending on the type of<br />
microphone used and its compatibility with the<br />
recorder, a power supply/pre-amplifier unit to link<br />
them. 1 <strong>The</strong> range of frequencies over which each item<br />
of equipment can record accurately will be listed as<br />
the “Frequency Response” in the “Specifications”<br />
section of the instruction manual. No weak links in<br />
the chain can be tolerated - all the items of equipment<br />
involved must be capable of recording frequencies<br />
down to 10Hz or less. Ensuring that the recording<br />
system has an adequate high frequency response is<br />
less problematic-most high quality microphones and<br />
recorders can deal with frequencies up to 20,000Hz,<br />
which is well above the upper limit of the frequencies<br />
found in elephant rumbles and trumpets.<br />
b) Microphones<br />
Various microphones offer the required frequency<br />
response (see above). When choosing from the<br />
available range, it is best to look for a fairly robust<br />
microphone, capable of withstanding some exposure<br />
to dust and fluctuation in humidity levels and<br />
sensitive enough to record over moderate distances.<br />
<strong>The</strong> two types that have been most commonly used<br />
by elephant researchers so far are the Sennheiser<br />
MKH 110 and the Bruel & Kjaer series oft /2”<br />
microphones (e.g. models 4149 and 4155). Of these,<br />
the Sennheiser employs an element of directionality,<br />
which enables it to capture the upper harmonics of<br />
rumbles more efficiently than the omnidirectional<br />
equivalent. However, for the lowest frequencies, all<br />
the available microphones will effectively behave in<br />
an omnidirectional fashion. Microphones should<br />
always be used with basket wind shields and covers<br />
to minimise distortion caused by air movement close<br />
to the microphone (see below).<br />
c) Tape recorders<br />
<strong>The</strong> microphone should be connected either to an open<br />
reel tape recorder or to a digital audio tape (DAT)<br />
recorder. DAT records in a format that minimises tape<br />
hiss - a particular advantage where the original recording<br />
is to be amplified and played back to elephants. DAT<br />
recorders are also more compact and thus easier to<br />
handle in fieldwork conditions than equivalent open reel<br />
tape recorders. It would be advisable to review the<br />
specifications of available recorders at the time of<br />
purchase. Two recorders that have already proved<br />
successful are the Sony TCD D10 DAT recorder with a<br />
DC modification (to bring its frequency response down<br />
to 0Hz), and the Nagra IV SJ open reel tape recorder<br />
which records down to 0Hz on the FM channel.<br />
11.2.3 <strong>The</strong> tricks of the trade<br />
COMMUNICATION<br />
a) <strong>The</strong> problem of wind<br />
One of the main obstacles to making good<br />
recordings of elephant vocalisations in field<br />
conditions is the effect of air movement on the<br />
1 <strong>The</strong> need for a power supply/pre-amplifier unit should beascertained by consulting the manufacturers of both the tape recorder and<br />
microphone. Some recorders can power microphones from their own internal supply, while others will require the fitting of a<br />
battery operated unit between microphone and recorder, If the equipment specifications indicate a discrepancy between the output<br />
signal from the microphone and the required input signal for the recorder, appropriate capacitors may also be incorporated into the<br />
power unit to compensate for this.<br />
113
COMMUNICATION<br />
recording system. As discussed above, equipment<br />
appropriate for recording infrasonic calls must be<br />
sensitive to frequencies down to 10Hz or below. This<br />
is in contrast to normal recording systems that<br />
effectively respond only down to frequencies of 50Hz.<br />
Individuals who have previously made field<br />
recordings with a normal system will be surprised at<br />
the dramatic difference the low frequencies make; the<br />
wind contains strong low frequency components and<br />
while the lowest frequencies are filtered out by a<br />
standard recording system, these are fully effective<br />
when the infrasonic recording system is used. <strong>The</strong><br />
strong low frequency components are enough to<br />
overload the microphone even at very low wind<br />
velocities, and this manifests itself as physical breakup<br />
in the record signal. <strong>The</strong> effect is so great that<br />
recording usually has to be confined to periods when<br />
it is relatively still (e.g., early morning and late<br />
evening). A wind shield (a rigid tube of flexible<br />
material on a basket framework) and wind cover (a<br />
sock that fits over the shield, often made of artificial<br />
fur) should always be used to minimise air movement<br />
close to the microphone.<br />
b) <strong>The</strong> best way to organise a recording session<br />
When first faced with the task of recording<br />
vocalisations from a group of elephants, the<br />
temptation to try to capture everything on tape should<br />
be resisted. <strong>The</strong> best recordings are obtained when a<br />
clear goal is kept in mind during a recording session<br />
and a particular individual is singled out as the subject<br />
to be recorded. For example, the best recordings of<br />
contact calls and answers from adult females are likely<br />
to be obtained when an individual female becomes<br />
separated from the rest of her family group. In this<br />
case, the microphone might be directed either at the<br />
separated individual or at a member of the main group<br />
that would be expected to call to her. In contrast, if<br />
the aim is to study calls between mothers and their<br />
calves, mother-calf pairs can be singled out for<br />
recording. Rarer events such as mating pandemonia<br />
might be treated opportunistically - although if<br />
particular females are known to be in oestrus these<br />
could be selectively followed to obtain recordings of<br />
the oestrus chorus and post-copulatory calls.<br />
c) Operating the equipment<br />
Recordings should be made from a vehicle or hide<br />
positioned close to the vocalising subject; distances<br />
of 15-25m are ideal if this does not interfere with the<br />
behaviour of the elephants. Fixing the microphone in<br />
a position where it is pointing towards the subject<br />
will add less extraneous noise to the recording than<br />
holding it directly. Ideally, the recording sensitivity<br />
level on the tape recorder should be adjusted to<br />
114<br />
produce a maximum deflection of 5db to 10db below<br />
peak on the peak level meter. One important effect of<br />
air movement is to enforce a reduction in recording<br />
level. Only when it is completely still can the most<br />
sensitive setting be used; with increasing turbulence<br />
the recording level must be reduced to avoid overload<br />
(which results in the distortion of the recorded signal).<br />
d) Documenting the recordings<br />
Because calling is often difficult to predict, the tape<br />
has to be kept running during the recording session.<br />
This uses up a lot of tape, but is the only way of<br />
ensuring that the best calls will be recorded intact.<br />
Tapes which contain no useful calls can be reused in<br />
a later session. A running commentary detailing which<br />
individual vocalised and the Context in which each<br />
call was given should be kept on tape alongside the<br />
calls themselves, as should background information<br />
such as the date, time, wind speed, etc. (see McGregor<br />
et al. 1992),<br />
Pin-pointing which animal gave each call is not as<br />
easy as it sounds. By virtue of their structure,<br />
infrasonic calls are difficult for human listeners to<br />
locate spatially. Thus, when the subject being recorded<br />
is among other elephants, there will sometimes be<br />
doubt as to whether that individual or another in the<br />
group was responsible for the call. It is essential to<br />
note these uncertainties on tape. <strong>The</strong>re are some visual<br />
cues that indicate when an elephant is calling - in<br />
particular, calling tends to be accompanied by back<br />
and forward ear movement (ear flapping) and may<br />
be preceded or followed by periods of listening (see<br />
Poole et al. 1988). For loud calls, the mouth<br />
sometimes visibly opens. This cue cannot be relied<br />
upon in every case, however, as the mouth is often<br />
hidden by the trunk and for some softer calls mouth<br />
opening is often very slight. <strong>The</strong> same is true of<br />
forehead vibration, which has been used as a cue to<br />
infrasonic calling in Asian elephants (see Payne et<br />
al. 1986), but is difficult to pick up in <strong>African</strong><br />
elephants.<br />
e) Sound recording from a radio collar<br />
<strong>The</strong> above discussion on recording infrasound applies<br />
to sound recordists using hand-held microphones and<br />
recorders, which is the usual situation. Scientists in<br />
Zimbabwe, however, have actually incorporated small<br />
radio microphones into elephant radio collars (Payne<br />
1989). <strong>The</strong>se radio microphones can transmit a<br />
continuous record of the collared elephant’s<br />
vocalisations back to a base station where it is stored<br />
digitally on computer for later analysis. While this is<br />
an elegant solution to the problem of recording<br />
elephant vocalisations, it obviously involves the major
operation of immobilising and fitting cumbersome<br />
collars to elephants, and is beyond the scope of most<br />
research projects. Furthermore, the recordings are<br />
only useful if accompanied by detailed information<br />
on the behaviour of the vocalising elephant which<br />
can be synchronised with the recording track.<br />
11.2.4 Recording networks<br />
Recent technology offers the opportunity to monitor<br />
simultaneously the location and calling behaviour of<br />
elephants over a chosen area (Langbauer<br />
et al. 1991; Kiernan 1993). A four-channel<br />
instrumentation tape recorder can be used to record<br />
from four radio microphones placed in a square array<br />
(e.g. 0.25km by 0.25km). By comparing the signals<br />
recorded from each of the four microphones, using a<br />
digital signalling processing board, each vocaliser’s<br />
location can be calculated relative to the co-ordinates<br />
of the microphone array. Using this “passive acoustic<br />
location system”, it is possible to record conversations<br />
between different groups of elephants while pinpointing<br />
their locations at the same time. This sort of<br />
approach could be very useful when attempting to<br />
study elephant communication on a larger scale, but<br />
it requires substantial technical expertise and backup.<br />
11.3. ACOUSTIC ANALYSIS OF CALLS<br />
11.3.1 General<br />
<strong>The</strong> aim of acoustic analysis is to classify the calls<br />
by their structure so that differences between<br />
individuals and differences between call types can<br />
be picked out. Having established measurable<br />
differences, playback experiments may be used to<br />
test whether these structural differences have any real<br />
meaning for the elephants i.e., whether the elephants<br />
also distinguish between different calls on this basis,<br />
While vocal analysis is an important part of studying<br />
vocal communication in elephants, it is a specialist<br />
topic in itself (see Ladefoged 1962), and I shall review<br />
the techniques only briefly here.<br />
11.3.2 <strong>The</strong> equipment<br />
As was the case for the recording system, the<br />
specifications of the analysis equipment must be<br />
checked to ensure that it can deal adequately with<br />
frequencies down to 10Hz. A wide range of options<br />
are available, but the equipment tends to be very<br />
expensive. For this reason it is more sensible to<br />
make use of existing facilities at university and<br />
government research laboratories than to set up a<br />
new system.<br />
Sound analysis breaks down vocalisations into their<br />
component waveforms, providing a visual<br />
representation of how the vocal energy in the call<br />
is distributed on a frequency axis, a time axis, or<br />
both. Three of the most useful formats for displaying<br />
elephant vocalisations are spectrogram, power<br />
spectrum and waveform outputs (see Fig. 11.1).<br />
Spectrograms (Fig. 11.la) show how the energy<br />
content of a call is distributed across its component<br />
frequencies over a chosen time window. In this<br />
format, frequency is represented on the vertical axis,<br />
time on the horizontal axis, and the “blackness” of<br />
the trace represents the relative amount of energy<br />
at each frequency. Power spectra (Fig. 11.1b)<br />
average the energy over a selected slice (in time) of<br />
the call and show how it is distributed across the<br />
frequency spectrum. Here frequency is on the<br />
horizontal axis and the energy content (or<br />
amplitude) is on the vertical axis. Waveforms (Fig.<br />
1l.lc) display the individual vibrations that make<br />
up the sound wave. In this sort of display, time is<br />
on the horizontal axis and phase (stage of the wave<br />
cycle) on the vertical axis. Some sound analysis<br />
systems (e.g. the Kay DSP 5500 Sonagraph) provide<br />
all three display formats.<br />
11.3.3 Making acoustic measurements<br />
COMMUNICATION<br />
<strong>The</strong> best way to take an initial look at a call is to<br />
display it as a spectrogram. In this format most call<br />
types will appear as a series of narrow black bands<br />
at regularly spaced intervals; these represent the<br />
fundamental frequency and harmonics. <strong>The</strong><br />
fundamental frequency, seen as the lowest of the<br />
narrow black bands, is the primary frequency of<br />
vibration of the elephant’s vocal cords and the main<br />
determinant of call pitch. Wider areas of black,<br />
spanning several harmonics, are also visible on the<br />
spectrogram. <strong>The</strong>se “formants” are the product of<br />
resonances in the elephant’s vocal tract, and affect<br />
the quality of the call. Measurements of the<br />
fundamental frequency and formants can be made<br />
by using the spectrogram display, supplemented<br />
with information from the spectrum and waveform<br />
formats (see e.g., Fig. 11.1). On the basis of these<br />
characteristics and additional ones such as the<br />
115
COMMUNICATION<br />
Figure 11.1: Common forms of sound analysis display for elephant “contact answer” vocalisation (overlapping a more distant<br />
contact call).<br />
a) Spectrogram Time (0-15.13 secs) on the horizontal axis and Frequency (0-1000HZ) on the vertical axis.<br />
b) Power Spectrum (taken at peak fundamental frequency) Frequency (0-1000Hz) on the horizontal axis and Relative<br />
Amplitude on the vertical axis.<br />
c) Waveform: Time (0-0.59secs) on the horizontal axis and Phase on the vertical axis.<br />
length and tonal quality of the calls, different call types<br />
and differences between individuals in calls of the<br />
same type can be identified (for statistical tests see<br />
Barnard et al. 1993; Siegal & Castellan 1988; Sokal<br />
& Rohlf 1969).<br />
11.4 PLAYBACK<br />
11.4.1 Preparing calls for playback<br />
Calls that are selected for playback should be clear,<br />
with the level of the recorded signal high relative to<br />
the level of the background noise on tape. However,<br />
calls that were recorded at such a high level that they<br />
caused microphone overload, i.e., the peak level meter<br />
registers above peak for the recorded signal, should<br />
not be used as these are likely to be distorted. Calls<br />
that have not been recorded intact (e.g. the beginning<br />
of the call has been clipped), calls that include breaks<br />
due to wind noise and calls that include unnatural<br />
116<br />
background noise must also be excluded. All the<br />
signals recorded on tape will be amplified for<br />
playback - thus wind breaks and background noise<br />
will become much more noticeable. Having<br />
selected the best calls, these can be used either in<br />
their original form for playback, or edited onto<br />
another tape. Editing might simply involve<br />
transferring a selected call intact to another tape,<br />
to make it more accessible and to isolate it from<br />
the preceding and subsequent recorded signals.<br />
Computer-based editing facilities are also<br />
available, however, and can be used to modify call<br />
structure or to synthesise new versions of the call.<br />
11.4.2 <strong>The</strong> problem of habituation<br />
<strong><strong>Elephant</strong>s</strong> show a diminished response to stimuli<br />
to which they are repeatedly exposed. This<br />
“habituation” should be avoided at all costs, for<br />
it is rarely reversible. To minimise the chances<br />
of habituation one must: 1) leave at least a week,<br />
preferably longer, between playback experiments
to the same group of subjects; 2) use short playback<br />
signals - it is better not to exceed one or two calls, or<br />
a single sequence of calls, during a playback session;<br />
3) never use recordings that sound “abnormal” as<br />
playback stimuli - subjects will habituate to these<br />
more quickly. It is important to be on the lookout for<br />
signs of habituation at all times, and when it is evident<br />
that particular groups of elephants are starting to<br />
ignore playback signals, additional playback<br />
experiments should not be conducted on these<br />
animals.<br />
11.4.3 <strong>The</strong> equipment<br />
To reproduce calls from a tape recording, the line<br />
output of the tape recorder must be connected to a<br />
power amplifier and speaker. Again, both these items<br />
of equipment should have flat frequency responses<br />
from approximately 10Hz.<br />
a) Amplifiers<br />
As the equipment will usually<br />
have to be operated under field conditions, it must be<br />
possible to power the amplifier from a 12V battery<br />
supply. Good quality car stereo amplifiers are<br />
particularly suitable. <strong>The</strong> power output of the<br />
amplifier should be such that it can, when used in<br />
combination with the speaker, reproduce the calls at<br />
their natural volumes. <strong>The</strong>re is no substitute for trial<br />
and error here - the efficiencies of different speakers<br />
will vary according to their design (see below), and<br />
while a 300W amplifier may produce the required<br />
amplification for some, a higher wattage will be<br />
needed for others. <strong>The</strong> correct playback volume for<br />
each call should be determined prior to conducting<br />
experiments by adjusting the settings of the playback<br />
system until the speaker produces a sound pressure<br />
level (SPL) typical of an elephant giving that call type<br />
from the same distance. It is usual to measure the<br />
SPLs of calling elephants with either an SPL meter<br />
or a calibrated recording system, and to match the<br />
speaker volume against this using an SPL meter. Poole<br />
et al. (1988) document the SPLs typical of the<br />
common call types.<br />
b) Loudspeakers<br />
Loudspeakers that can deal with frequencies as low<br />
as 10Hz tend not to be available as commercial<br />
products and usually have to be custom-built for the<br />
purpose. One of the major problems associated with<br />
producing elephant calls is the need to vibrate the<br />
speaker diaphragm back and forward accurately at<br />
the natural frequency of vibration of the elephant’s<br />
vocal cords (14 times/second for some infrasonic<br />
COMMUNICATION<br />
calls). <strong>The</strong> excessive strain that this exerts on the drive<br />
unit can be dealt with either by building an extremely<br />
large and heavy duty speaker that has the rigidity to<br />
force the air back and forwards at approximately the<br />
required rate, or by building speaker enclosures that<br />
themselves modify the pattern of vibration of the<br />
diaphragm, making it more accurate and efficient<br />
(bandpass boxes and horn speakers). Because of their’<br />
higher fidelity reproduction and greater efficiency<br />
(less power required to drive them), bandpass boxes<br />
and horn speakers are preferable to the simpler heavy<br />
duty options. Of these two, bandpass boxes can be<br />
built as lighter, more compact units than equivalent<br />
horn speakers and thus probably provide the best<br />
option for elephant playbacks. A sixth order bandpass<br />
box, with dimensions of 0.75m x 0.75m x 0.75m and<br />
a weight of around<br />
40kg, has already been used successfully for field<br />
playbacks to elephants.<br />
11.4.4 Outline of a playback experiment<br />
<strong>The</strong> loudspeaker should be moved into position prior<br />
to the start of the experiment and sufficient time left<br />
for the elephants to settle down before playback<br />
begins. <strong>The</strong> vocalisations may be played from a<br />
vehicle, if the subjects are habituated to the presence<br />
of vehicles, or from a position on the ground if<br />
sufficient cover is available. While the distance<br />
between the speaker and the subjects will obviously<br />
depend to some extent on the question that is being<br />
asked, it is inadvisable to use playback distances of<br />
less than 50m unless vegetation cover is very thick.<br />
<strong>The</strong> aim is to create a situation that is realistic for the<br />
listeners; the farther away the speaker, and the thicker<br />
the cover, the less these elephants will expect to see<br />
or smell the calling elephant. Where responses to<br />
different calls are being compared in a series of<br />
playbacks, subject-speaker distances should be kept<br />
constant throughout.<br />
Playbacks may be given to single individuals or to<br />
groups, depending on the question that is being<br />
addressed by the experiment. <strong>The</strong> best situation for a<br />
playback is one where the subjects are resting or<br />
feeding quietly in one place. It is, in general, very<br />
difficult to orchestrate a playback experiment if<br />
elephants are on the move. As well as the logistic<br />
difficulties of positioning the speaker, moving<br />
elephants tend to be focused on reaching their<br />
destination (e.g., a watering place) and may ignore<br />
stimuli to which they would otherwise have<br />
responded.<br />
117
COMMUNICATION<br />
Having found an appropriate group of subjects, provided<br />
that they remain settled during the pre-playback period<br />
(see below), the playback signal can then be delivered<br />
at the appropriate volume (details in Section 11.4.3). It<br />
is inappropriate to play the subjects any of their own<br />
calls, as this would obviously create a highly unrealistic<br />
situation and jeopardise the success of future playbacks<br />
to the same group.<br />
11.4.5 Monitoring elephant responses<br />
Video provides one of the best formats for recording<br />
elephants’ responses to playback. It can give a more<br />
complete record of events than a written summary, and<br />
may be accessed repeatedly to extract further<br />
information. This is a particular advantage at the start<br />
of a series of experiments, when it allows the observer<br />
to remain flexible about which behavioural<br />
measurements to take. When using video, the<br />
investigator should make a prior decision on which<br />
individuals to follow with the camera if the group<br />
becomes dispersed. Choosing always to include the<br />
matriarch in the record, for example, is one way of<br />
allowing a standardised comparison to be made across<br />
groups.<br />
Notable responses to playback include: listening (ears<br />
extended and stiffened while body is held still), smelling<br />
(with trunk in raised or lowered position), approach to<br />
or retreat from the speaker, calling, increases in group<br />
cohesion (group members “bunch up”, calves in<br />
particular tending to move closer to adults) and increases<br />
in temporal gland secretion (pers. obs.; see also Poole<br />
& Moss 1989; Langbauer et al. 1988 & 1991). Because<br />
many response measures can be gauged only in relation<br />
to previous behaviour, several minutes of pre-playback<br />
behaviour should also be recorded on videotape. <strong>The</strong><br />
inclusion of a running time clock on screen during a<br />
playback record will allow latency measurements to be<br />
made more easily, e.g., time between onset of playback<br />
and onset of approach to the loudspeaker.<br />
Once the responses to playback have been summarised<br />
as behavioural measurements of the type described<br />
above, statistical comparisons can be used to investigate<br />
whether different categories of playback elicit the same<br />
or different responses. Depending on what the playbacks<br />
are being used to test, the categories might be calls given<br />
in different contexts, calls given in the same context by<br />
different individuals or sexes, calls played back from<br />
different distances, etc. Where different categories do<br />
elicit different responses, spectrographic analysis may<br />
help to determine the basis on which listeners are<br />
making a distinction.<br />
118<br />
11.5 CONCLUSION<br />
This chapter provides information on the range of<br />
techniques currently available for studying elephant<br />
communication. Individual investigators must decide<br />
which of these are most appropriate for their own<br />
particular studies. <strong>The</strong> choice should be made on the<br />
basis of the question that is being addressed, and will<br />
usually be straightforward once the hypotheses have<br />
been defined clearly. For studies involving sound<br />
recording and playback, sufficient funding must be<br />
secured at the outset. <strong>The</strong> purchase of specialist items<br />
of equipment for recording and playback may cost<br />
upwards of US$8,000. All studies should be preceded<br />
by careful consultation of the existing literature on vocal<br />
communication in elephants and on methods of<br />
observation and experimental design (Chapters 7 & 10;<br />
Martin & Bateson 1993; McComb 1992; McGregor et<br />
al. 1992; Barnard et al. 1993).<br />
Acknowledgements<br />
I thank Cynthia Moss, Joyce Poole, Soila Sayialel and<br />
Katito Sayialel for introducing me to studying elephant<br />
communication in the field; and Cynthia Moss and<br />
Angela Turner for comments on the first draft of this<br />
manuscript. My own research on elephant<br />
communication has been supported by the <strong>African</strong><br />
Wildlife Foundation, the Association for the Study of<br />
Animal Behaviour, Aylestone Ltd. Cambridge,<br />
Newnham College Cambridge, the Royal Society of<br />
London and Tusk Charity.<br />
References<br />
BARNARD, C., GILBERT, F. & McGREGOR, P. (1993) Asking Questions in<br />
Biology: Design, Analysis and Presentation in Practical Work. Longman Scientific<br />
and Technical, Harlow.<br />
BERG, J.K. (1983) Vocalisations and associated behaviours of the <strong>African</strong><br />
elephant. Zietschrift fur Tierpsychologie 63, 63-79.<br />
HEFFNER, R. & HEFFNER, H. (1980) Hearing in the elephant (Elephas<br />
maximus).Science 208, 518-520.<br />
HEFFNER R. HEFFNER, H. & STICHMAN, N. (1982) Role of the elephant<br />
pinna in sound localisation. Animal Behaviour 30, 628-629.<br />
KIERNAN, V. (1993) <strong>The</strong> pentagon’s green flag of convenience. New Scientist<br />
139 (1886). 12-13.<br />
LADEFOGED, P (1962) Elements of Acoustic Phonetics. University of<br />
Chicago Press, Chicago.
LANGBAUER W.R., PAYNE, K.B., CHARIF, R.A., THOMAS, EM. (1988)<br />
Responses of captive <strong>African</strong> elephants to playback of low- frequency calls.<br />
Canadian Journal of Zoology 67, 2604-2607.<br />
LANGBAUER W.R., PAYNE, K.B., CHARIF, R.A., RAPAPORT, L. &<br />
OSBORN, F. (1991) <strong>African</strong> elephants respond to distant playbacks of low -<br />
frequency conspecific calls. Journal of Experimental Biology 157, 35-46.<br />
MARTIN, P. & BATESON, P. (1993) Measuring Behaviour: an Introductory<br />
Guide. Cambridge University Press, Cambridge.<br />
MOSS, C.J. & POOLE, J.H. (1983) Relationships arid social structure of <strong>African</strong><br />
elephants. In: Primate S al Relationships: An Integrated Approach. (Ed. R.A.<br />
Hinde). Blackwell Scientific Publications, Oxford.<br />
McCOMB, K. (1992) Playback as a tool for studying contests between social<br />
groups. In: Playback end Studies of Animal Communication: Problems and<br />
Prospects. (Ed. P.K. Mcgregor), pp. 111-119. Plenum Publishing Corporation,<br />
London.<br />
ÍMcGREGOR, P.K., CATCHPOLE, C.K.. DABELSTEEN, T. FALLS, J..B.,<br />
FUSANI, L.. GERHARDT, H.C., GILBERT, F., HORN, A.G., KLUMP, G.M.,<br />
KROODSMA, D.E., LABRECHTS, M.M, McCOMB, K.. NELSON, D.A.,<br />
PEPPERBERG, I.M., RATCLIFFE, L., SEARCY, W.A. & WEARY, D.M.<br />
(1992) Design of playback experiments. In: Playback and Studies of Animal<br />
Communication. (Ed. P.K. Mcgregor), pp. 1-9. Plenum Publishing Corporation,<br />
London.<br />
COMMUNICATION<br />
PAYNE, K.B. (1989) <strong>Elephant</strong> talk National Geographic 176(2), 264-277.<br />
PAYNE, K..B., LANGBAUER, W.R.& THOMAS, E.M. (1986) infrasonic calls<br />
of the Asian elephant (Elephas maximus). Behavioural Ecology and Sociobiology<br />
18 297-301.<br />
POOLE, J.H. (1988) <strong>Elephant</strong> trunk calls. Swara xx (6), 29-31.<br />
POOLE, J., PAYNE, K. LANGAUER, W.R., MOSS, C.J. (1988) <strong>The</strong> social<br />
contexts of some very low frequency calls of <strong>African</strong> elephants. Behavioural<br />
Ecology Sociobiology 22, 385-392.<br />
POOLE, J.H. & MOSS, C.J. (1989) <strong>Elephant</strong> mate searching: group dynamics<br />
and vocal and olfactory communication. Symposium of the Zoological Society<br />
of London 61, 111-125.<br />
SIEGAL, S. & CASTELLAN, N.J. (1988) Nonparametric Statistics for the<br />
Behavioural Sciences. McGraw-Hill, London.<br />
SOKAL, R.R.& ROHLF, F.J. (1969) Biometry: <strong>The</strong> Principles and Practice of<br />
Statistics in Biological Research. W.H. Freeman and Company, San Francisco.<br />
119
12.1 INTRODUCTION<br />
In Chapter 8 you have seen that the radio tracking of<br />
wild animals has been an essential tool of wildlife<br />
research and management, providing information about<br />
the movements of individuals which could not have<br />
been collected any other way. Most radio tracking is<br />
done using<br />
‘conventional’ collars, which transmit very high<br />
frequency (VHF) radio pulses. Animals are located by<br />
homing, or by triangulation from the ground, or from<br />
aircraft, using a directional aerial and purpose-built<br />
radio-receiving equipment in line-of-sight of the<br />
transmitter. Depending on the local conditions, and the<br />
power output of the collar, this distance may be from a<br />
few hundred metres to over a hundred kilometres. Radio<br />
tracking of this kind is also known as ‘conventional’<br />
tracking, and it suffers from a number of limitations<br />
(see Chapter 8).<br />
In view of the limitations of conventional radio tracking,<br />
it is not surprising that the idea of remote tracking of<br />
wildlife, using signals received by satellites orbiting<br />
above the earth, has been received with considerable<br />
enthusiasm. Under ideal circumstances, this can allow<br />
one to follow the movements of animals night and day,<br />
wherever they may be, without having to stir from a<br />
computer terminal and armchair.<br />
Satellite tracking of wildlife has been possible since<br />
the early 1980s, using a system operated from France<br />
by Service Argos and the National Oceanic and<br />
Atmospheric Administration (NOAA) meteorological<br />
satellites. It has been successfully carried out on polar<br />
bears, caribou, musk oxen, wandering albatrosses and<br />
a variety of other species (Fancy et al. 1988; Harris et<br />
at. 1990). It has also been used on elephants in Namibia<br />
(Lindeque & Lindeque 1991), Kenya (Thouless et al.<br />
1992), Cameroon (M. Tchamba pers. comm.) and Zaire<br />
(K. Hillman-Smith pers. comm.). However, for a<br />
number of reasons to be discussed later, satellite tracking<br />
120<br />
CHAPTER 12<br />
SATELLITE TRACKING OF ELEPHANTS<br />
Chris Thouless<br />
c/o WWF East <strong>African</strong> Regional Office<br />
P.O. Box 62440, Nairobi, Kenya<br />
Environment and Development <strong>Group</strong><br />
11 King Edward Street, Oxford OX1 4HT, U.K.<br />
of elephants presents some particular difficulties, and<br />
results have not always satisfied expectations. Further<br />
advances are being made, both with the Argos System<br />
and with other techniques of tracking animals by<br />
satellite, and it is possible that many of the problems<br />
currently experienced will soon be overcome.<br />
12.2 THE ARGOS SYSTEM<br />
<strong>The</strong> Argos system depends on TIROS satellites operated<br />
by NOAA, which orbit round the earth at an altitude of<br />
850km, about 14 times each day, passing close over the<br />
north and south poles. <strong>The</strong>re are supposed to be at least<br />
two in orbit at any one time (although there may actually<br />
be between one and four in operation), and there are<br />
plans to launch new satellites on an annual basis to<br />
maintain continuous operation.<br />
Coded radio signals are sent out from the transmitter,<br />
or platform transmitter terminal (PTT), on the elephant,<br />
at intervals of typically 60-90 seconds. As an orbiting<br />
satellite passes over a transmitting PTT it may detect<br />
some of these signals. If a sufficient number of signals<br />
are received during the course of a satellite overpass,<br />
the satellite can calculate the location of the PTT.<br />
(Actually, it will calculate two possible positions; one<br />
on either side of the satellite’s track. <strong>The</strong> more likely of<br />
the two positions is determined from previous locations<br />
and transmitter velocity.)<br />
<strong>The</strong> location of a PTT is estimated using the Doppler<br />
shift (the change in the apparent frequency of the signal<br />
as a result of the relative movement of the transmitter<br />
and receiver) in the signals from the PTT received by a<br />
satellite while it passes overhead. As the satellite is<br />
moving towards the PTT, the detected frequency will
e slightly higher than the transmitted frequency of<br />
401.650MHz, and the frequency becomes lower as<br />
the satellite moves away. Calculations of the rate of<br />
change of the frequency and the point at which the<br />
received frequency should be the same as the<br />
transmitted frequency allow the satellite to calculate<br />
the distance and direction of the PTT from its orbital<br />
path at the closest point. <strong>The</strong> clearer and more<br />
consistent signals that are received from the PTT,<br />
the higher will be the precision of the calculated<br />
location. Service Argos grades locations from Class<br />
0 (NQ0), which has a low associated accuracy, and<br />
may be derived from as few as two signals, to Class<br />
3 (NQ3) for which Argos claims that 68% of locations<br />
will be given within I50m of the true position. We<br />
have found Class 0 locations to be of little value,<br />
since errors are often greater than 20km (Thouless—<br />
et al. 1992). Data collected by the satellite are<br />
downloaded to various ground stations and then to<br />
the Argos data processing centres in Landover,<br />
Maryland, U.S.A., and in Toulouse, France. Results<br />
are distributed to users by telephone modem, telex,<br />
hard-copy printouts or floppy discs. Data can also<br />
be collected directly from the satellite using a Local<br />
User Terminal (LUT) which includes an antenna, a<br />
dedicated receiver and a microprocessor (Lindeque<br />
& Lindeque 1991).<br />
12.3 FREQUENCY AND QUALITY OF<br />
LOCATIONS<br />
For a particular satellite overpass, the chance that a<br />
position can be resolved is determined by how many<br />
signals are received from the PTT during the time<br />
that the satellite is overhead. This in turn is<br />
determined by the strength of the emitted signals,<br />
the pulse repetition rate of the PTT, and the angular<br />
altitude of the satellite. If the path of the satellite is<br />
sufficiently distant from the PTT that it passes over<br />
low on the horizon, then the time available for<br />
receiving signals from the PTT will be reduced, and<br />
there is likely to be more interference with the signal<br />
from vegetation, but if it passes nearly vertically<br />
overhead, it is more difficult for the satellite to<br />
calculate a location.<br />
Transmitters on elephants have generally produced<br />
poorer quality information than those on other<br />
animals, as measured by the number of locations<br />
determined, and their quality. <strong>The</strong>re appear to be three<br />
main reasons for this:<br />
SATELLITE TRACKING<br />
i) Most elephant studies have been carried out<br />
relatively close to the equator. <strong>The</strong> polar orbit of<br />
the TIROS satellites means that there are fewer<br />
overpasses per day on the equator than in temperate<br />
or polar latitudes. Because all satellite overpasses<br />
or orbits pass over both poles, but each successive<br />
orbit passes over different points on the equator,<br />
as you get closer to the equator a smaller proportion<br />
of orbits come within sight of a particular point on<br />
the ground. With two satellites receiving data there<br />
may be more than 20 useful overpasses at high<br />
latitudes, compared with as few as four at the<br />
equator (Fancy et al. 1988).<br />
ii) <strong>The</strong> large fluid mass of an elephant’s body close<br />
to the PTT’s aerial reduces its effectiveness and<br />
results in less power being radiated from the<br />
transmitter. As a result, putting a collar on a<br />
elephant may produce less than half the number<br />
of locations that would be produced while being<br />
tested on the ground (Thouless et al. 1992).<br />
Better results have been obtained in Cameroon<br />
(M. Tchamba pers. comm.). This may be because<br />
the collars used in the study had a spacer keeping<br />
the aerials away from the elephant’s skin, thus<br />
improving transmission efficiency.<br />
iii) Although external whip aerials provide good<br />
signal transmission, the strength and dexterity<br />
of elephants make it necessary to use a less<br />
efficient antenna bonded inside the collar<br />
12.4 THE PROBLEM OF PRECISION<br />
Analysis of data on animal movements assumes that<br />
locational information is fairly accurate. Locational<br />
errors in conventional tracking may result from<br />
inaccurate triangulation, or because the maps of the<br />
study area are unsatisfactory. Large errors can result<br />
from signal bounce, but they can often be identified<br />
by field workers, because of their experience with<br />
the animal, and knowledge of the study area (see<br />
Chapter 8). <strong>The</strong> general magnitude of expected errors<br />
is often well known, and observations will not differ<br />
greatly in their errors. This is not the case with<br />
satellite tracking, since the tracker is often remote<br />
from the study area.<br />
<strong>The</strong> precision of locations from conventional<br />
tracking can usually be described in a simple<br />
manner, for instance, that all the locations are<br />
accurate to within 1km or 200m. Describing the<br />
precision of locations from satellite tracking is<br />
121
SATELLITE TRACKING<br />
more complicated; Service Argos says, for example,<br />
that 68% of Class 2 locations are accurate to within<br />
350m. A higher proportion of locations will be<br />
accurate to within 500m, and it is likely that only a<br />
small proportion will be in error by more than 1km.<br />
However, it is possible that a very small proportion<br />
of locations will be in error by a much larger amount,<br />
and because the tracker is not on the spot, he or she<br />
may not be able to identify and eliminate these<br />
occasional errors, which will provide faulty biological<br />
information. In species and study areas where it is<br />
possible to get several locations during the course of<br />
a day, faulty locations can be eliminated by<br />
comparison with others, but for elephants this will be<br />
more difficult. It may be possible to eliminate some<br />
false locations on the basis of physical improbability;<br />
for example, Lindeque and Lindeque (1991) rejected<br />
locations in the Atlantic Ocean, but often they will<br />
not be so easily detected.<br />
<strong>The</strong> known causes of error are:<br />
i) Altitude<br />
Argos calculates the location of a PTT on the<br />
assumption that the transmitter is at a particular<br />
altitude. A difference between the true altitude of the<br />
PTT and the assumed elevation will result in error.<br />
<strong>The</strong>se errors are primarily on an east-west axis because<br />
the satellites travel in nearly north-south orbits. When<br />
signals come from PTTs that are higher than the<br />
assumed elevation, Argos interprets them as coming<br />
from locations that are closer than they actually are to<br />
the satellite along its across-track direction (Harris et<br />
al. 1990). French (1986) showed that for a maximum<br />
satellite elevation of 26o , an altitudinal error of 500m<br />
results in a range error of 250m. According to Argos,<br />
under certain geometric conditions (with the platform<br />
close to the ground track) the longitude error can reach<br />
four times the altitude error.<br />
ii) Speed of displacement<br />
For any FIT speed of Xkm/hr, the error in metres is<br />
100 to 200X. Thus, for an elephant moving at 10km/<br />
hr the error will be from 1000m to 2000m. <strong>The</strong> effect<br />
of small-scale movements, for example movement of<br />
the head during feeding, is unknown, but probably<br />
small.<br />
iii) Transmitter instability<br />
If the frequency of signal output by the PTT changes<br />
during the course of a satellite overpass. then<br />
inaccurate locations may be obtained, particularly in<br />
the longitudinal axis. PTTs are certified to vary less<br />
than three parts per million over their operational<br />
temperature range, but rapid temperature changes of<br />
122<br />
the PTT electronics can cause frequency shifts, which<br />
lead to errors.<br />
iv) Satellite orbital error<br />
<strong>The</strong> calculated track of the satellite during its overpass<br />
may be incorrect, and this will lead to errors in its<br />
calculations of the location of the PTT. This source of<br />
error can be reduced by using a reference beacon with<br />
a Local User Terminal (see Section 12.5.2).<br />
Little is known about which of these factors is most<br />
significant, and the only way to find out the level of<br />
locational precision is to locate the elephant on the<br />
ground during satellite overpasses, and collect a large<br />
number of simultaneous true and calculated positions,<br />
which can be compared with one another. Ground<br />
testing the collar before placing it on an elephant is<br />
likely to give an unduly optimistic picture, because<br />
system performance when the collar is not on an<br />
elephant will be relatively high.<br />
12.5 SATELLITE TRACKING<br />
EQUIPMENT FOR ELEPHANTS<br />
12.5.1 Collar assembly<br />
<strong>The</strong> majority of satellite collars used on elephants have<br />
been manufactured by Telonics Inc. of Arizona, U.S.A.<br />
<strong>The</strong>se consist of electronics and power supplies<br />
hermetically sealed in metal housings, fixed to<br />
machine belting collars, with an external urethane<br />
shock buffer. Collars are attached by a brass plate with<br />
four bolts which pass through holes in both flaps of<br />
the collar and are secured by four nuts and another<br />
brass plate. <strong>The</strong> aerials consist of a dipole antenna,<br />
with approximately 20cm of antenna protruding from<br />
each of the two sides of the transmitter at 1800. <strong>The</strong><br />
antenna is sewn into the collar and covered by about<br />
3mm of belting on both sides. To maximise<br />
transmission efficiency, the PTT should sit on top of<br />
the elephant’s neck, therefore a counterweight is<br />
necessary. If an additional conventional VHF<br />
transmitter is included in the package, then this can<br />
be made heavier than the PTT, and can thus act as the<br />
counterweight. In any case, the collar and transmitters<br />
will be considerably heavier than standard VHF<br />
collars. One satellite-collared bull elephant in Kenya<br />
was found to have suffered abrasion from the collar,<br />
and it is important to establish whether this problem<br />
is common, and whether it was due to collar tightness,<br />
or to excessive weight of the collar.
<strong>The</strong> advantages of including a VHF unit are that this<br />
transmitter can be used to relocate the elephant from<br />
the ground, so that it will allow one to remove the collar<br />
once the satellite transmitter has stopped transmitting,<br />
and it can be used to check the locations provided by<br />
the PTT.<br />
<strong>The</strong>re are trade-offs between the PTT package size and<br />
power output because of the weight of the battery. If a<br />
prolonged life span is required, then the PTT’s<br />
microprocessor can be programmed to switch the<br />
transmitter on and off on a regular basis, resulting in,<br />
for example, a’‘duty cycle’ of 22 hours on/26 hours<br />
off. Duty cycles must be programmed in advance and<br />
cannot be changed once the collar is on an elephant.<br />
With a 24 hour on/24 hour off duty cycle Telonics<br />
transmitters for elephants are expected to last over a<br />
year.<br />
Other kinds of data can also be collected via satellite, if<br />
the appropriate recording devices are incorporated<br />
within the transmitter package. On other species data<br />
has been collected on such factors as activity levels and<br />
temperatures.<br />
12.5.2 Local User Terminal<br />
A Local User Terminal (LUT) is a small satellite receiving<br />
station which allows one to collect data from the satellite as<br />
it is passing overhead. Although LUTs are expensive<br />
(minimum cost is about US$30,000), their use can reduce<br />
running costs, and without an LUT there may be an<br />
unacceptable delay in the time that data take to return to the<br />
field. In addition to providing immediate information on<br />
the location of tagged animals, LUTs also provide more<br />
detailed information on the signals received from PTTs and<br />
may be used to improve the quality of locational<br />
information. With an appropriate LUT, one can also receive<br />
1x1 km resolution image data on the area that the satellite<br />
is passing over, which can be used to produce maps of sea<br />
surface temperatures, weather phenomena, fires, floods and<br />
vegetation state.<br />
LUTs can also be used to improve the accuracy of locations<br />
in conjunction with a local reference beacon (a transmitter<br />
placed at a known location), which will allow correction<br />
for errors in the assumed path of the satellite.<br />
12.5.3 Uplink receiver<br />
<strong>The</strong> signal produced by a satellite PTT cannot be<br />
received by a conventional VHF receiver, so in order<br />
to test PTTs in the field, it is necessary to purchase a<br />
specialised receiver. This can either be a test receiver,<br />
which just indicates whether the PTT is transmitting,<br />
and can cost less than US$100, or an uplink receiver,<br />
which receives and analyses PTT output, and may<br />
cost over US$5,000. This may be an unnecessary<br />
expense, unless calibration of, for instance,<br />
temperature or activity data is required.<br />
12.5.4 Software<br />
SATELLITE TRACKING<br />
Certain computer software or programmes may assist<br />
with interpretation of satellite data. <strong>The</strong> satellite<br />
prediction programme can be valuable if ground<br />
truthing is to be carried out, since information on<br />
satellite overpass times and the height which the<br />
satellite will reach above the horizon will allow one<br />
to predict which overpasses have the best chance of<br />
providing good quality locations. <strong>The</strong> LARST<br />
software package is being developed by Bradfield<br />
University Research Ltd. and the Natural Resources<br />
Institute of UK, for use with a LUT System. This<br />
programme will collect detailed information on<br />
received frequencies from an overpass, and calculate<br />
the best estimate of the position of the PTT by working<br />
out which location provides the lowest inconsistency<br />
between values. It will also process and present the<br />
ground environmental information for better<br />
understanding of animal movements. Telonics Inc. is<br />
also developing a LUT with a software package called<br />
TIRIS.<br />
12.6 VHF VS. SATELLITE TRACKING<br />
Neither conventional nor satellite tracking are ideal<br />
under all circumstances. Deciding which one will be<br />
most appropriate is dependent on the precise<br />
conditions in the study area, and a number of<br />
other considerations.<br />
i) Cost<br />
Satellite tracking is expensive, in terms of<br />
equipment and Argos charges, though personnel<br />
and aircraft costs may be substantially less than<br />
for conventional tracking. 1994 prices for elephant<br />
PTTs with collars are about US$4,500 each<br />
(Telonics Inc.). Daily rates for Argos location data<br />
are 60FF (approximately US$9-10) per PTT.<br />
Charges are made for any day with reception from<br />
a particular PTT; therefore using a duty cycle<br />
where the transmitter is on for a short period each<br />
123
SATELLITE TRACKING<br />
day may be expensive. by using an LUT the daily<br />
rate will be reduced to 25FF, but capital costs will be<br />
considerably more. To dart elephants and remove<br />
collars is also an expensive business, and the shorter<br />
life span of satellite collars, compared with<br />
conventional ones, is a serious consideration.<br />
Conventional collars are considerably cheaper than<br />
satellite collars, but whether or not conventional<br />
tracking is cheaper than satellite tracking depends<br />
on whether one has to use an aircraft, how long it<br />
takes to find the animals, and whether one is paying<br />
full commercial rates for aircraft time. In general,<br />
satellite tracking will be better value for a study<br />
involving relatively few animals, since costs for<br />
satellite tracking (without an LUT) increase linearly<br />
with the number of animals collared, while the flying<br />
time per animal located for conventional tracking,<br />
which is usually the major expense, will reduce with<br />
the number of elephants collared.<br />
ii) Logistic limitations<br />
<strong>The</strong>re are many circumstances under which<br />
conventional tracking is not possible, because of lack<br />
of availability of aircraft, international movements<br />
by the elephants and so on. Under these<br />
circumstances, satellite tracking is the only option<br />
available, even if it does not fully satisfy data<br />
requirements.<br />
iii) Data requirements<br />
<strong>The</strong> appropriateness of satellite tracking is dependent<br />
on what kind of information is required. Because of<br />
the problems with lack of precision, it is most<br />
appropriate for working out general movement patterns<br />
of elephant populations where annual movements are<br />
relatively large compared with daily ones. It is not<br />
suitable for looking at detailed use of space. For<br />
instance, any study looking at habitat use with habitat<br />
patches smaller than tens of kilometres across, or<br />
nocturnal movements of elephants across boundaries<br />
of protected areas into adjoining cultivated fields, would<br />
probably draw false biological conclusions using<br />
satellite tracking. It may also be unsuitable for<br />
calculating home range sizes using the standard<br />
minimum convex polygon technique. As sample size<br />
increases, so will the number of outlying false locations,<br />
and thus home range size will appear to increase with<br />
sample size. Other techniques for calculation of home<br />
range size will need to be developed for analysing the<br />
results of satellite tracking, once the errors are better<br />
understood.<br />
Satellite tracking can be used to collect other<br />
information apart from location, and this has been<br />
124<br />
very useful, for example in transmitting data on dive<br />
lengths for marine mammals. However, remote<br />
collection of data by satellite prevents one from<br />
obtaining detailed data on factors such as habitat use<br />
and group size, which require direct observation.<br />
12.7 FUTURE DEVELOPMENTS<br />
12.7.1 New satellite systems<br />
Satellite collars have a restricted life span because of<br />
the high energy demands of transmitting to a satellite<br />
and the need to transmit even when the satellite is<br />
not overhead. Considerable savings in battery power<br />
can be achieved if the satellites stimulate the collars<br />
to start transmitting. <strong>The</strong> technology to achieve this<br />
does exist, but these systems do require a receiver to<br />
be included with the PTT package. This results in<br />
increased complexity, cost and current drain, and the<br />
technique has not so far been used for wildlife<br />
applications. It is anticipated that two new satellite<br />
systems, SAFIR and STARSYS, will operate in this<br />
way.<br />
12.7.2 Use of GPS technology<br />
Another satellite system which can be used to<br />
determine location is the Global Positioning System<br />
(GPS). This system uses the time differences between<br />
signals received from each of four or more satellites,<br />
which are in view simultaneously, to calculate the<br />
position of a receiver. Locations are more consistently<br />
accurate than those from Argos, and they are available<br />
24 hours per day. Since transmission is from the<br />
satellites, not the ground, smaller (but more<br />
sophisticated) aerials can be used on the receiver.<br />
A GPS unit attached to the elephant can record its<br />
position, but does not have the capability to transmit<br />
the information it is collecting to an observer. In order<br />
to do this one needs to have a transmitter unit attached<br />
to the receiver to relay the information. Two ways<br />
have been suggested to do this. One is to build an<br />
interactive unit that will transmit a data stream when<br />
it is interrogated by a suitable radio pulse. This<br />
requires being able to get within line of sight of the<br />
transmitter at appropriate intervals - which will be<br />
dependent on storage capacity of the chip and how<br />
often locational information is collected by the<br />
receiver. In order to do this, it will be necessary to
include a VHF transmitter in the collar assembly<br />
for ground location.<br />
<strong>The</strong> other approach is to send out the digital data<br />
stream via the Argos system. It may seem odd to use<br />
two different satellite systems in this way, but in fact,<br />
Argos is a very reliable way of transmitting remote<br />
information: its failing is in producing consistently<br />
accurate locations, and this is where GPS excels.<br />
Prototypes of GPS animal tags have been constructed<br />
using the Argos output system by Telonics Inc.<br />
(Degler & Tomkiewicz, 1993), and by Lotek using<br />
the interrogation system. It is anticipated that<br />
functioning systems should be available within the<br />
next two years. Recent tests of a GPS collar on an<br />
elephant bull in Amboseli show promising results,<br />
but further modifications will be necessary (I.<br />
Douglas-Hamilton).<br />
12.8 ADDRESSES OF SUPPLIERS<br />
Telonics Inc.<br />
932 Impala Ave. Mesa,<br />
Arizona 85204-6699, USA<br />
Tel: (602) 892-4444.<br />
Fax: (602) 892-9139<br />
Suppliers of transmitters, LUTs, ground<br />
telemetry equipment.<br />
Dr. J B Williams,<br />
Natural Resources institute.<br />
Chatham Marine,<br />
Kent ME4 4TB, UK.<br />
Tel: 0634 880088.<br />
Fax: 0634880066.<br />
Suppliers of LARST software and BURL<br />
local user terminal<br />
CLS Service Argos.<br />
18 Av. Edouard-Belin,<br />
31055 Toulouse Cedex, France.<br />
Tel:61394700.<br />
Fax: 61 75 10 14.<br />
Lotek - Wireless Telemetry Systems.<br />
115 Pony Drive, Newmarket,<br />
Ontario L3Y 7B5<br />
Tel: 416 8366890.<br />
Fax: 416 836 6455.<br />
Acknowledgements<br />
Thanks are due to Malan Lindeque, Jim Williams,<br />
Stan Tomkiwicz and Bill Burger, who have made<br />
valuable comments on an earlier version of this<br />
chapter<br />
References<br />
SATELLITE TRACKING<br />
DEGLER, R. & TOMKIEWICZ, S. (1993) GPS update, Telonics Quarterly<br />
6(2).<br />
FANCY. S.G., PANK, L.F., DOUGLAS, D.C., CURBY, C.M., GARNER, G.W.,<br />
AMSRUP, S.C & REGELIN, W.L. (1988) Satellite telemetry: a new tool for<br />
wildlife research and management. U.S Fish and Wildlife Service Resource<br />
Publication 72.<br />
FRENCH, J. (1986) Environmental housings for animal PTTs. Argos Newsletter<br />
26, 7.9.<br />
HARRIS, R.B., FANCY, S.G., DOUGLAS, D.C., GARNER G.W., AMSTRUP,<br />
S.C., McCABE, T.R. & PANK, L.F. (1990) Tracking wildlife by satellite: current<br />
systems and performance. U.S. Fish and Wildlife Technical Report 30.<br />
LINDEQUE, M. & LINDEQUE, P.M. (1991) Satellite tracking of elephants in<br />
northwestern Namibia. <strong>African</strong> Journal Ecology 29, 196-206.<br />
THOULESS, C.R., HOARE. R. & MULAMA, M. (1992) Satellite tracking of<br />
elephants in Laikipia District Kenya. Pachyderm 15, 28-33<br />
125
13.1 INTRODUCTION<br />
Reproductive physiology is the study of how<br />
reproductive organs and systems function normally,<br />
resulting in successful mating, fertilisation,<br />
implantation, parturition and lactation. While we have<br />
a good understanding of the reproductive systems and<br />
functions of many mammals, we know little of the<br />
reproductive physiology of elephants, such as the<br />
hormones that control the oestrus cycle. While the<br />
study of such functions may appear to be of academic<br />
interest only, the knowledge could have important<br />
management implications. For instance, if we<br />
understood fully which hormones control the female<br />
sexual cycle, we could possibly prevent pregnancy<br />
and thus manipulate elephant population dynamics.<br />
<strong>The</strong> level of hormones in the body depends on the<br />
animal’s reproductive condition. Hormones are<br />
carried in the blood, but their metabolites are passed<br />
out from the body in urine and faeces and may be<br />
analysed from urine and faecal samples.<br />
This chapter describes how to collect hormone<br />
samples from elephants and how to analyse these<br />
samples as a means to providing a better<br />
understanding of the elephant reproductive cycle.<br />
This chapter assumes some knowledge of elephant<br />
physiology. If you are unfamiliar with some of the<br />
terms, you are advised to consult a basic biology<br />
textbook.<br />
13.2 REPRODUCTIVE HORMONES<br />
Hormones are chemicals produced by specific parts<br />
of the body and transported through the blood to a<br />
target organ which is some distance away. Different<br />
hormones control different body functions and those<br />
126<br />
CHAPTER 13<br />
STUDYING THE REPRODUCTIVE PHYSIOLOGY OF<br />
ELEPHANTS<br />
Hamisi Mutinda<br />
Kenya Wildlife Service<br />
P.O. Box 40421<br />
Nairobi. Kenya<br />
affecting reproduction are simply called<br />
reproductive hormones. Basically, two groups<br />
of hormones exist:<br />
i) Steroids<br />
<strong>The</strong>se are products of the breakdown of<br />
cholesterol. Steroids are not fully soluble in<br />
water, and are thus bound to carrier protein<br />
molecules before they are transported to target<br />
tissues. <strong>The</strong> hormones are linked to sugar and!<br />
or sulphate molecules before excretion which<br />
makes them water-soluble, and therefore easily<br />
passed out of the body in urine. Steroids in<br />
faeces are not usually linked to sugar molecules<br />
because the microbial activity in the lower<br />
intestine destroys the link.<br />
Oestrogen and progesterone are the major<br />
steroid hormones influencing reproduction in<br />
mammals. <strong>The</strong>se hormones are produced mainly<br />
by the ovary during the oestrus cycle. During<br />
pregnancy, the hormones are produced by the<br />
ovary alone in some species and by both the<br />
ovary and the placenta in others.<br />
In the elephant, plasma progesterone levels have been<br />
found to be low during the follicular phase and<br />
elevated during the luteal phase of the oestrus cycle<br />
and thus indicate the oestrus cycle length of between<br />
14 and 16 weeks (McNeilly et al. 1983; Brannian et<br />
al. 1988; Plotka et al. 1988; de Villiers et al. 1989).<br />
During pregnancy levels of this steroid increase to a<br />
maximum value at mid-pregnancy (9-12 months)<br />
before declining as the gestation term is reached (de<br />
Villiers et al. 1989). Patterns of plasma oestrogen<br />
levels have so far failed to provide complete<br />
information on the oestrus cycle (Brannian et al.<br />
1988; Plotka et al. 1988), but levels increase during<br />
early pregnancy (Hodges et al. 1983).
ii) Proteins<br />
<strong>The</strong>se are chains made of amino acids (peptide<br />
chains) which are linked to form a large molecule.<br />
Among the major reproductive protein hormones are<br />
prolactin, follicle stimulating hormone (FSH) and<br />
luteinizing hormone (LH).<br />
Plasma FSH and LH concentrations are not indicative<br />
of the oestrus cycle. However, levels of LH peak<br />
before the onset of behavioural oestrus (McNeilly et<br />
a!. 1983; De Villiers et a). 1989). Plasma prolactin<br />
levels have been found to increase to consistently<br />
higher values by the fifth month of pregnancy<br />
(McNeilly et al. 1983).<br />
13.3 HORMONE SAMPLING<br />
13.3.1 General<br />
<strong>The</strong>re are four factors that one has to consider when<br />
attempting to study hormones in wild elephants. One<br />
must decide on (i) the hormones one wants to study,<br />
(ii) the kind of samples one would like to collect, (iii)<br />
the feasibility of collecting the desired samples and<br />
(iv) whether or not the intended hormone can be<br />
measured from the desired samples.<br />
13.3.2 Approaching elephants f or<br />
sample collection<br />
a) Blood samples<br />
Blood is the best medium for analysis of any kind of<br />
hormone. Perhaps that is why it has been used<br />
extensively in the studies on elephant reproduction<br />
mentioned above. Blood samples can be collected<br />
from an immobilised elephant (see Chapter 17) or<br />
following an elephant cull (see Chapter 18). One<br />
should note that the stress of bleeding or the events<br />
preceding it, e.g. chasing, capturing, immobilisation,<br />
etc. may affect hormone levels in blood.<br />
For logistical reasons, blood sample collection is not<br />
feasible when repeated sampling of the same animal<br />
needs to be done.<br />
b) Urine samples<br />
Unlike blood samples, urine samples can be collected<br />
with minimal interference to the animal. One should<br />
take care not to cause undue disturbance to the<br />
elephant, and also to ensure one’s own safety. You<br />
REPRODUCTIVE PHYSIOLOGY<br />
should wait for an elephant to finish urinating before<br />
moving towards it. Otherwise, you will make the<br />
elephant wary and the elephant may attempt to walk<br />
while urinating, spreading the urine over a wide area<br />
and making it difficult to collect. If you are using a<br />
vehicle, always drive towards the animal cautiously<br />
and slowly. Turn the engine off as soon as you are<br />
close enough to the elephants to collect your sample.<br />
It helps to keep the urination spot on the side of the<br />
car away from the elephant so tab you can have easy<br />
access to it. Urinary hormone levels have been used<br />
in the study of reproductive physiology of freeranging<br />
male elephants (Poole et a!. 1984).<br />
c) Faecal samples<br />
Faecal samples may be collected when the animals<br />
are a good distance away, thus no interference is<br />
necessary.<br />
13.3.3 How to collect samples<br />
a)Blood samples<br />
Blood is drawn from the ear veins of an immobilised<br />
elephant using a 10ml syringe fitted with a 19-21<br />
gauge needle. <strong>The</strong> sample is then poured into a glass<br />
vial and kept in an ice-filled cool box for some time<br />
to allow clotting to take place. <strong>The</strong> serum is then<br />
removed by decanting. A centrifuge that could be<br />
run manually or electrically through the car battery<br />
will help in further cleaning the sample after<br />
decanting. <strong>The</strong> decanted serum is spun for 30<br />
minutes and the clear serum removed into a clean,<br />
labelled vial before freezing at -20ºC.<br />
b)Urine samples<br />
A urine sample can be collected from the ground<br />
immediately after urination using a plastic syringe<br />
(without a needle). This works particularly well in<br />
areas with non-porous soils. <strong>The</strong> sample is emptied<br />
into a vial and kept in a cool-box with ice for one<br />
hour, letting soil and other organic debris settle. <strong>The</strong><br />
urine can then be decanted off, and centrifugation<br />
of the sample will then clean the sample further. <strong>The</strong><br />
centrifuge need not be very powerful, and one with<br />
a maximum speed of 2000 revolutions per minute<br />
is adequate. More powerful centrifugation<br />
equipment is usually available in laboratories, and<br />
samples which are not sufficiently clean may be<br />
further centrifuged at higher speeds before analysis.<br />
<strong>The</strong> sample should be labelled prior to storing in<br />
the freezer at –20ºC.<br />
c) Faecal samples<br />
A faecal sample is available long after defaecation,<br />
making such samples the easiest to collect in the field.<br />
127
REPRODUCTIVE PHYSIOLOGY<br />
<strong>The</strong> peripheral part of the dung is usually richer in liquid<br />
and digested vegetative matter than the central part,<br />
and should, therefore, be targeted for sampling. A faecal<br />
sample is collected by scooping about 200-300g of<br />
faecal mass into a vial. <strong>The</strong> vial is labelled and kept in<br />
a cool-box with ice, and frozen within 2-6 hours after<br />
collection.<br />
13.3.4 Labelling, storage and transport<br />
Good labelling is of crucial importance in sample<br />
collection. Water-resistant pens must be used. <strong>The</strong> kind<br />
of sample (when many different kinds of samples are<br />
being collected simultaneously), date of collection, and<br />
the name and/or reproductive state of the elephant are<br />
among the important details to be fixed on the sample<br />
container. <strong>The</strong> use of codes will greatly reduce the<br />
amount of writing, making the labelling neater.<br />
<strong>The</strong> samples must remain frozen throughout the storage<br />
phase, including during transportation to the laboratory<br />
so that the activity of enzymes, produced by microorganisms<br />
in the atmosphere or those in the sample, is<br />
maintained at minimum levels. This ensures that the<br />
hormones are not digested before analysis. Samples<br />
can be transported to the laboratory in dry ice or liquid<br />
nitrogen.<br />
13.4 SAMPLE ANALYSIS<br />
Several techniques of analysing hormones from blood,<br />
urine and faeces have been developed, but<br />
immunoassay methods such as Radio Immunoassay<br />
(RIA) and Enzyme Immunoassays (EIA) are preferred.<br />
Immunoassay methods are based on antibody-antigen<br />
reactions. Antibodies are proteins produced by specific<br />
cells in the body when a foreign body or substance<br />
(antigen) is introduced. <strong>The</strong> antibodies are specific to<br />
the substances or antigens they are produced against.<br />
In RIA and EIA techniques, fixed volumes of<br />
chemically labelled and unlabelled (standard and<br />
sample) hormone are added to a fixed volume of a<br />
solution containing excess molecules of their<br />
respective antibody. <strong>The</strong> labelled and unlabelled<br />
hormone molecules will compete for the restrictive<br />
sites on the antibody molecules. Thus, in the condition<br />
of excess antibody, the concentration of the unlabelled<br />
hormone in the sample or standard is inversely related<br />
to the amount of labelled hormone bound. <strong>The</strong>refore,<br />
measurement of bound labelled hormone is used to<br />
128<br />
calculate the amount of hormone in the sample and<br />
standard.<br />
<strong>The</strong> label used is the radioactive hydrogen, tritium,<br />
for RIA and an enzyme molecule for EIA. <strong>The</strong><br />
radioactive hydrogen used is part of the multiple<br />
hydrogen atoms found on hormone molecules;<br />
therefore, measurement is done by direct counting<br />
of the amount of radiation emitted by the labelled<br />
hormone per minute. This is done using specialised<br />
counters, depending on the kind of radiation being<br />
emitted. Beta (B) radiation is the weakest and<br />
relatively safest to use, but there are restrictions on<br />
the use of radioactive compounds in many laboratory<br />
establishments.<br />
EIAs are used in most laboratories. <strong>The</strong> method<br />
operates on a principle similar to RIA. In the EIA,<br />
the amount of bound labelled hormone is determined<br />
by the amount of colour change which occurs after<br />
addition of excess amounts of the enzyme substrate.<br />
<strong>The</strong> colour changes are measured using a<br />
spectrophotometer. All the reagents used, antibody<br />
labelled hormone and enzyme substrate, are<br />
commercially available. <strong>The</strong> procedures used in<br />
sample analysis by RIA or EIA including preparation<br />
of solutions and tubes or plates, are available in a<br />
laboratory where the analysis should be carried out.<br />
13.5 APPLICATIONS OF<br />
REPRODUCTIVE HORMONE<br />
ANALYSIS<br />
We are only just beginning to understand the<br />
reproductive physiology of elephants, but such<br />
studies may have an important role to play in the<br />
future. When we have a thorough understanding of<br />
the hormonal cycle in elephants, it should,<br />
theoretically be possible to develop compounds that<br />
would act as contraceptives in elephants.<br />
In areas where elephants are coming into conflict with<br />
humans or are causing undesirable habitat changes,<br />
elephant managers may wish to control elephant<br />
numbers. So far, culling has been the only way of<br />
reducing elephant numbers, although most recently<br />
translocation schemes have been carried out to move<br />
elephants from one area to another. It is likely that in<br />
small populations where all adult females are known<br />
and can be recognised, contraception will become<br />
an extremely attractive alternative to culling as a<br />
means of limiting population growth (Whyte 1994).
<strong>The</strong>oretically, the ability to detect precisely the<br />
ovulation period will also enable one to carry out an<br />
artificial insemination programme for free-ranging<br />
elephants. While this is not being practised at the<br />
moment, artificial insemination may become<br />
important in a situation where an elephant population<br />
is declining and/or when males are scarce (e.g. during<br />
periods of heavy poaching).<br />
References<br />
BRANNIAN, J.D., GRIFFITH F., POPKOFF, H. & TERRANOOVA, P.F. (1988)<br />
Short and long phases of progesterone secretion during the oestrous cycle of<br />
the <strong>African</strong> elephant (Loxodonta africana). Journal of Reproduction and Fertility<br />
84, 357-365. 357-365.<br />
REPRODUCTIVE PHYSIOLOGY<br />
DE VILLIERS, D.J., SKINNER. J.D. & HALL-MARTIN, A.J. (1989)<br />
Circulating progesterone concentration and ovarian functional anatomy in the<br />
<strong>African</strong> elephant (Laxodonta a), Journal of Reproduction and Fertility<br />
86.195201.<br />
HODGES, J.K., CILLA, H. & McNEILLY A.S. (1983) Circulating oestrogen<br />
concentration during pregnancy in the <strong>African</strong> elephant (Loxodonta africana)-<br />
Journal of Reproduction and fertility 67, 121-127.<br />
McNEILLY, A.S., MARTIN, R.D., HODGES, J.K. & SMUTTS, G.L. (1983)<br />
Blood concentrations of gonadotrophins, prolactin and gonadal steroids in males<br />
and non-pregnant and pregnant female <strong>African</strong> elephants (Loxodonta africana).<br />
Journal of Reproduction and Fertility 67, 113-120.<br />
PLOTKA, E.D., SEAL, U.S., ZEREMBKA, F.R., SIMMON, L.G., TEARE.<br />
A., PHILLIPS, L.G., HINSHOW, K.C. & WOOD, D.G. (1988) Ovarian function<br />
in the elephant: Luteinizing hormone and progesterone cycles in <strong>African</strong> and<br />
Asian elephants. Biology of Reproduction 38, 309-314.<br />
POOLE, J.H., KASMAN, L.H., RAMSAY, E.C. & LASLEY, B.L. (1984) Musth<br />
and urinary testosterone concentrations in the <strong>African</strong> elephant Loxodonta<br />
africana). Journal of Reproduction and Fertility 70, 255-260.<br />
WHYTE, I. (1994) Small populations can benefit from birth control. Custos.<br />
August 1994.<br />
129
14.1 INTRODUCTION<br />
Ivory or elephant tusks can potentially provide useful<br />
information on elephants. But what is ivory? And what<br />
constitutes a tusk?<br />
An elephant tusk is the elongated upper incisor<br />
externally exposed in older elephants, and extending<br />
from the base of the pulp cavity in the upper jaw to the<br />
narrow tip outside.<br />
In all species that have them, which include<br />
hippopotami, elephants, walruses etc., tusks are<br />
specially adapted teeth, and the chemical structure of<br />
both the teeth and tusks is similar. <strong>The</strong> word ivory has<br />
traditionally been applied exclusively to elephant tusks.<br />
Espinoza and Mann (1991), however, provide an<br />
identification guide for tusks of different mammalian<br />
species, and state that the word ivory can correctly be<br />
used to describe any mammalian tooth or tusk of<br />
commercial interest.<br />
14.2 WHAT CAN TUSKS TELL US?<br />
Tusks can tell us a variety of things in different<br />
circumstances. Tusks can enable us to age and sex<br />
elephants, and identify individuals and populations<br />
(Laws 1966; Moss 1988). <strong>The</strong>y can be used to determine<br />
population trends, and the absence of tusks from<br />
carcasses can suggest that the cause of mortality was<br />
poaching for ivory (Pilgram & Western 1986a; Douglas-<br />
Hamilton 1975). Paleontological tusk material provides<br />
clues on the evolutionary process (Wyckoff 1972), and<br />
provides information on diet and distribution of<br />
elephants in paleo-times (Van der Merwe & Vogel 1978;<br />
Gathua 1992). Tusks can also provide information on<br />
rates of tusk growth (Laws 1966; Laws et al. 1975).<br />
It is impossible in this chapter to cover all the ways<br />
tusks can provide the above information. This chapter,<br />
130<br />
therefore, will cover the aspects that would be of<br />
immediate practical value to protected area staff and<br />
researchers: namely, how tusks can be used to age<br />
and sex elephants, to identify individuals and<br />
populations, and to determine population trends.<br />
This chapter will also discuss the use of tusk material<br />
in obtaining information on elephant ecology, and the<br />
use of ivory to determine the source of tusks. Both<br />
these initiatives require specialised, high-technology<br />
laboratories, trained staff and large amounts of<br />
funding. As such, they may be beyond the scope of<br />
many protected area authorities, but they are discussed<br />
here because they potentially have profound<br />
implications for elephant management. If one can<br />
determine the source of ivory, one could, theoretically<br />
restrict the ivory trade to only countries that are<br />
sustainably managing elephants.<br />
Before going into details of how ivory can provide<br />
all this information, it is worth noting the limitations<br />
of the methods. First, as we will see, much of the<br />
research on the ways that tusks can provide<br />
information has not been done. Second, ivory only<br />
yields its full information content in the context of a<br />
comprehensive data framework which details where<br />
it is from, how it was found, etc. which is usually not<br />
available.<br />
14.3 AGEING, SEXING AND<br />
IDENTIFYING INDIVIDUALS AND<br />
POPULATIONS<br />
14.3.1 Ageing elephants<br />
CHAPTER 14<br />
WHAT WE CAN LEARN FROM TUSKS<br />
Njoroge Ngure<br />
<strong>African</strong> Wildlife Foundation<br />
P.O. Box 48177<br />
Nairobi, Kenya<br />
Tusks grow throughout an elephant’s life (Laws<br />
1966). <strong>The</strong>re is a quantitative relationship between<br />
tusk size and elephant age, and one can use tusks to
age elephants. In general, the larger the tusks, the<br />
older the elephant. When used together with other<br />
parameters like facial appearance and body size,<br />
measurements of tusks can greatly improve age<br />
estimates (Chapter 7; Moss 1988).<br />
Because tusks break and wear when elephants use<br />
them, their circumference at the lip is a better<br />
estimator of age than length (Pilgram & Western<br />
1983; Pilgram & Western 1986a). Surprisingly, tusk<br />
weight is also as good an estimator of age as lip<br />
circumference implying that tusks wear and break in<br />
a relatively uniform way (Pilgram & Western 1986a).<br />
<strong>The</strong> older the elephant the higher the probability that<br />
tusks have been altered. This means that tusk<br />
measurements would be expected to be more reliable<br />
in ageing younger elephants. This is in fact so, as<br />
tusk age estimates become less reliable beyond the<br />
age of 30 years (Pilgram & Western 1986a).<br />
Tusk weight is difficult to measure in live elephants,<br />
and therefore tusk size will always be the parameter<br />
of choice for ageing live elephants. Ageing elephants<br />
by tusk size starts with the age of tusk eruption, which<br />
tends to be between two and three years of age. While<br />
some variation occurs within populations (Laws<br />
1966; Moss 1988), there is little information<br />
indicating whether differences exist between<br />
populations (Moss 1991).<br />
Direct measurement of tusk size is only practical for<br />
dead, immobilised or relatively tame elephants. <strong>The</strong><br />
exposed length and lip circumference (see Fig. 14.1)<br />
of the tusk are most commonly measured (Pilgram<br />
Fig. 14:1: Measuring an elephant tusk.<br />
WHAT WE CAN LEARN FROM TUSKS<br />
& Western 1986a). For live, free-ranging elephants,<br />
tusk size has to be estimated from a distance.<br />
If baseline information relating age to tusk size in a<br />
population exists, size can easily be correlated to age.<br />
If no such data exist, size alone can give an indication<br />
of the relative ages of elephants in a population.<br />
Reference to other populations whose baseline data exist<br />
should also help. An ideal way to proceed would be to<br />
compare the tusk size of individuals of known age with<br />
the tusk size of individuals whose age is unknown, and<br />
thus age the latter. Whatever the situation one should<br />
aim to make the best of all available baseline<br />
information, experience, and available measurements.<br />
14.3.2 Sexing elephants<br />
Tusk size and shape enable one to differentiate<br />
between the sexes. Males generally have larger tusks<br />
than females of the same age. Male tusks erupt earlier<br />
and grow faster as the male gets older, while in<br />
females the growth rate of tusks remains steady (Laws<br />
1966; Moss 1988). Male tusks also tend to be thicker<br />
and more tapering or conical in shape, while female<br />
tusks are more uniform in circumference or<br />
cylindrical in shape (Pilgram & Western 1986a).<br />
Some <strong>African</strong> elephants are tuskless. <strong>The</strong> frequency<br />
of this trait is low (Parker & Martin 1982), and most<br />
non-tuskers are females (McKnight 1994). All<br />
tuskless elephants in Amboseli are females (Moss<br />
1988). It is, therefore, reasonable for one to assume a<br />
female when one encounters a tuskless elephant, but<br />
it would still be necessary to confirm the sex.<br />
131
WHAT WE CAN LEARN FROM TUSKS<br />
14.3.3 Identifying individuals<br />
Tusk size, shape, colour and texture in elephants are<br />
genetically determined and so vary among individuals.<br />
Tusk size and shape also vary due to growth and use<br />
(Pilgram & Western 1986a). Tusks can, therefore, be<br />
used in the identification of individuals, which is<br />
important in behavioural studies (see Chapters 7, 10<br />
and 11). Previous behavioural and population studies<br />
used tusks in combination with other features for<br />
identifying individuals (Douglas-Hamilton 1972;<br />
Moss 1988). Tusklessness or the presence of only one<br />
tusk can also be used to recognise individual elephants.<br />
14.3.4 Identifying populations<br />
<strong>Elephant</strong> tusks are known to vary between populations<br />
and can thus be used<br />
to discriminate between populations. Some<br />
populations, for example, have tusks that show greater<br />
differences in size for a particular age group than<br />
others (Laws 1966). Others have unique tusk shapes.<br />
For example Kilimanjaro elephants can be<br />
distinguished from Amboseli elephants, by their<br />
smaller, thinner tusks (Moss 1988). <strong>The</strong> possibility<br />
of separating regional subpopulations of <strong>African</strong><br />
elephants on the basis of tusk proportions, colour,<br />
hardness and surface texture has also been suggested<br />
(Pilgram & Western 1986a).<br />
14.3.5 Data requirements<br />
<strong>The</strong> most reliable size measurements for ageing and<br />
sexing elephants are the circumference at the lip and<br />
the exposed length (see Fig. 14.1 on how these are<br />
measured). Where an estimate of size is required for<br />
free-ranging, live elephants, a camera whose pictures<br />
can be calibrated to the true measurements may be<br />
useful (Douglas-Hamilton 1972). This technique is<br />
known as photogrammetry.<br />
To measure the circumference of tusks that are<br />
detached from the elephant, one needs to clearly<br />
identify the lip line. This point is usually discernible<br />
from the lip tissues attached to the tusk. In addition,<br />
small perforations occurring from the tusk base to the<br />
lip line can also be used. <strong>The</strong> weight of tusks that<br />
have been detached from elephants can be measured<br />
using a weighing scale.<br />
Data on shape and colour of tusks can be collected by<br />
photography, detailed verbal descriptions or sketches.<br />
Colour can be referenced to a standard colour chart.<br />
132<br />
14.4 DETERMINATION OF CAUSE<br />
OFDEATH AND POPULATION<br />
TRENDS<br />
14.4.1 Rationale<br />
When examining an elephant carcass the presence or<br />
absence of tusks can give an indication of the cause of<br />
death. <strong>The</strong> absence of tusks in a dead elephant that<br />
was evidently a tusker usually suggests that it was a<br />
victim of hunting for ivory, especially if it looks like<br />
the tusks were hacked out in a hurry. <strong>The</strong> absence of<br />
tusks is, however, not always an indication of hunting<br />
for ivory since people, and even elephants, can pull<br />
out tusks from elephant’s that died of other causes<br />
(Douglas-Hamilton & Douglas-Hamilton 1975; Moss<br />
1988).<br />
<strong>The</strong> presence of tusks in a carcass is even more<br />
confusing. <strong>The</strong> elephant could have been killed for<br />
ivory and the carcass left to rot to make the tusks easy<br />
to remove (Moss 1975). <strong>The</strong> elephant could also have<br />
been killed in tribal rituals (Moss 1988), or by<br />
cultivators disgruntled with the elephant’s crop raiding.<br />
And finally, the elephant could have died of natural<br />
causes.<br />
Tusks can also provide information on the status of a<br />
population. If one increasingly finds smaller tusks in a<br />
population, it may be an indication that there are fewer<br />
older and larger elephants. Since older males are the<br />
most important in reproduction (see Chapter 1) and<br />
older females are important in ensuring the survival of<br />
younger elephants in hard times like droughts (Moss<br />
1988), such a population can be regarded as unstable,<br />
and possibly on the decline.<br />
If one finds a population with a high or increasing<br />
frequency of tusklessness, it is a probable indication<br />
of selective removal of tuskers from the population<br />
(Pilgram & Western 1986b; Sukumar & Ramesh 1992).<br />
Since an individual tusk that is detached from its source<br />
represents a dead elephant, tusks alone can also tell us<br />
about their source populations and individuals. <strong>The</strong><br />
ivory stores of a protected area can thus provide much<br />
information on the status of the population. <strong>The</strong> rate<br />
of tusk recovery, with the exception of very young age<br />
classes (Corfield 1973), can indicate mortality rates.<br />
If one notices increasingly smaller tusks arriving either<br />
at a local ivory store, a central government store or a<br />
ware house, it suggests that the source population is<br />
probably declining and the age structure of the<br />
population is changing. Since ivory hunters selectively
take large tuskers and female tusks are generally<br />
smaller, the proportion of female tusks in the market<br />
can indicate that the large tuskers have already been<br />
taken out, and this can be used as an indicator of the<br />
status of the populations supplying the market.<br />
14.4.2 Data requirements<br />
To maximise the value of data on elephant mortality<br />
and population trends it will be necessary to put in<br />
place a reporting and analysis system for data<br />
associated with ivory and elephant carcasses. <strong>The</strong>se<br />
reports can be in the form of a few pages in a standard<br />
notebook which can be designed for other<br />
information as well. <strong>The</strong> pages reserved for<br />
information on ivory should be in the form of<br />
datasbeets that maximise the amount of information<br />
on tusks and their source. <strong>The</strong> area in which the tusks<br />
were found, the cause of mortality, the sex of the<br />
elephant, etc. can all be recorded. <strong>The</strong> effort put in<br />
to recover tusks in terms of time or patrol days should<br />
also be noted (see Chapter 16).<br />
If tusks are collected for the local ivory store, they<br />
should be appropriately marked to make sure no<br />
information is lost. A master record with all<br />
information obtained in the field but also other<br />
information like measurements of size and weight<br />
of the tusks should be kept. Cross-referencing of that<br />
information with the collected tusks should be readily<br />
accessible.<br />
If the tusks are to be transported, for example, to a<br />
central store, a system of registration that ensures<br />
maximum retention of information from the source<br />
area should be devised. If samples, for biochemical<br />
analysis (see below) are taken, information from the<br />
source area should again be retained.<br />
A good system would maximise information from<br />
tusks, ease data processing and interpretation of<br />
results.<br />
14.5 STUDYING ELEPHANT<br />
ECOLOGY AND SOURCING<br />
IVORY<br />
14.5.1 <strong>Elephant</strong> ecology<br />
14.5.1.1 Background<br />
<strong>Elephant</strong> tusks can potentially provide<br />
information on elephant diet (Van der Merwe et<br />
WHAT WE CAN LEARN FROM TUSKS<br />
al. 1990). <strong>The</strong>y can also tell us something about<br />
elephant movements and habitat use. <strong>The</strong> potential<br />
for tusks to provide information on elephant ecology<br />
stems from the way they grow. Dentine, which is the<br />
main component of ivory, is added from cells called<br />
odontoblastic cells which line the pulp cavity in the<br />
centre of the tusk. <strong>The</strong>se cells deposit dentine in<br />
layers of consistent thickness in the pulp cavity. <strong>The</strong><br />
point of a tusk furthest from the pulp cavity, therefore,<br />
contains the dentine formed earliest. <strong>The</strong> potential<br />
of ivory to provide information on elephant ecology<br />
lies in understanding the way various chemical<br />
elements are incorporated into plant tissues and<br />
subsequently into animal tissues.<br />
14.5.1.2 Carbon isotopes<br />
Isotopes are forms of a chemical element that differ<br />
in atomic mass, and most elements exist as two or<br />
more isotopes. During photosynthesis plants convert<br />
atmospheric carbon dioxide and water into tissues.<br />
<strong>The</strong>re are two major biosynthetic pathways by which<br />
plants do this, and depending on which they use, they<br />
are called C-three (C 3 ) or C-four (C 4 ) plants. Put<br />
simply, C 4 plants incorporate 13 C, an unstable isotope<br />
of carbon, at a faster rate than C 3 plants, and thus<br />
contain more 13 C than 12 C (the stable carbon isotope).<br />
In Africa C 3 plants comprise mainly trees and shrubs,<br />
whereas C 4 plants comprise mainly grasses in warm<br />
or dry habitats.<br />
<strong><strong>Elephant</strong>s</strong> tend to eat plants in the relative<br />
proportions that they occur in the environment and<br />
the carbon isotopes which are incorporated into<br />
their tissues track the above ecological differences<br />
(Van der Merwe et l. 1988). For example elephants<br />
feeding mainly on grasses will have higher 13 C<br />
values.<br />
Since tusks grow by addition of dentine layers at<br />
the pulp cavity, the carbon isotopic ratios<br />
incorporated in the layers at any one time depend<br />
on the ratios found In the diet at the time. One<br />
can, therefore, tell how the diet of an elephant<br />
varied over its life time from isotopic differences<br />
along its tusks.<br />
14.5.1.3 Other elements<br />
Other elemnts can be used as indicators of elephant<br />
diets. For example, there is a negative correlation<br />
between rainfall abundance and nitrogen isotopic<br />
values in plants (Van der Merwe et al. 1990, Vogel et<br />
al. 1990). Plants in arid areas are particularly rich in<br />
the stable nitrogen fifteen ( 15 N) compared to those<br />
133
WHAT WE CAN LEARN FROM TUSKS<br />
from moist areas. <strong>The</strong> difference is reflected in<br />
animal tissues, and allows discrimination of<br />
elephants from wet versus dry habitats.<br />
Elements from soil, incorporated into plants and then<br />
in turn, into elephant tissues, also provide information<br />
on elephant food plants. Strontium eighty-seven ( 87 Sr)<br />
and lead two-hundred-and-six ( 206 Pb) result from<br />
radio active decay of rubidium eighty-seven ( 87 Rb)<br />
and uranium two-hundred-and-thirty-eight 238 U)<br />
respectively. In Africa, soils derived from very old,<br />
granitic crusts which were rich in rubidium and<br />
uranium have higher 87 Sr/ 86 Sr and 206 Pb/ 204 Pb ratios<br />
than those with either young, volcanic or marine<br />
based sediments. As with nitrogen and carbon, tusks<br />
have the same lead (Pb) and strontium (Sr) isotopic<br />
composition as elephant food plants, and these<br />
directly track the isotopic composition of underlying<br />
soils and bedrock. This again allows discrimination<br />
of elephants from these areas using tusk material.<br />
14.5.2 Sourcing ivory<br />
14.5.2.1 Background<br />
<strong>The</strong> sourcing of ivory is linked to the various aspects<br />
of elephant ecology discussed above. All the<br />
compounds mentioned can help us track the origin<br />
of ivory found in the market. <strong>The</strong> tracking of ivory<br />
can also be enhanced by the fact that DNA (genetic<br />
material) from tissue attached to the tusk of the same<br />
elephant can also provide some clues to origins.<br />
It follows from the discussion on carbon that<br />
differences in carbon isotopic ratios along a tusk<br />
reflect changes in the relative frequency of 3 and C 4<br />
plants in one area for elephants that have not been<br />
migrating. <strong>The</strong> same differences reflect elephant<br />
movements between different habitats whose relative<br />
frequencies of C 3 and C 4 plant have not been changing.<br />
In the same way differences in 15 N values along<br />
elephant tusks either reflect temporal changes in the<br />
rainfall of one area, or elephant movements between<br />
areas with different rainfall values (Sukumar &<br />
Ramesh 1992; DeNiro & Epstein 1978). Since lead<br />
and strontium in one geologic formation barely vary<br />
over time, their variation along an elephant tusk can<br />
only reflect large scale elephant movements.<br />
<strong>The</strong> bulk of the thrust for attempts to source ivory<br />
using isotopes came as a result of the ban imposed<br />
on international ivory trade by the seventh conference<br />
of parties to the Convention on International Trade<br />
on Endangered Species (CITES) in 1989. It was<br />
134<br />
hoped that the use of all the isotopes, in combination,<br />
would greatly improve the discrimination process and<br />
allow for the sourcing of ivory (Van der Merwe et al.<br />
1990). Although initial attempts to apply ivory<br />
isotopic composition in the regulation of ivory trade<br />
have shown promising results, the lack of a<br />
continental database prevents realization of its full<br />
potential (Van der Merwe 1993; Koch &<br />
Behrensmeyer 1992). It is also extremely expensive<br />
and, therefore, not a practical method Africa-wide.<br />
14.5.2.2 <strong>The</strong> use of DNA<br />
DNA cannot be extracted from pure ivory, but in the<br />
absence of other sources, the degraded DNA found in<br />
tissue attached to tusks can be made sufficient for<br />
analysis (Georgiadis et al. 1990). By a technique called<br />
polymerase chain reaction, even small quantities of<br />
DNA can be multiplied to desired amounts.<br />
Mitochondria are cell organelles that possess their<br />
own DNA. This DNA is exclusively passed onto<br />
offspring via female eggs. In species where females<br />
do not migrate far, their mitochondria accumulate<br />
genetic markers unique to a population. <strong>The</strong> analysis<br />
of this DNA provides a potential way to discriminate<br />
populations by tusks, although there is great overlap<br />
across populations of Loxodonta africana (Georgiadis<br />
et al. 1990).<br />
14.5.3 Data requirements<br />
Samples for isotopic analysis of tusks can be taken<br />
from any part of the tusk. All tbat is required is a<br />
piece of tusk the size of a thumb-nail. <strong>The</strong> actual<br />
position where the sample is taken, however, depends<br />
on the objectives of the analysis. If, for instance, one<br />
wants to find out the diet of an elephant immediately<br />
before its death, one has to go for samples closest to<br />
the pulp cavity. If the objective is to trace the isotopic<br />
composition of an elephant’s diet during its lifetime,<br />
one needs to take samples along the length of the tusk.<br />
<strong>The</strong> objective of the study should determine the detail<br />
to which each tusk is analysed. One may also want to<br />
obtain samples from ivory artifacts.<br />
Because chemical analysis requires that samples are<br />
not contaminated, only ivory that is neither stained<br />
nor cracked should be used (Harbottle & Silsbee<br />
undated). Details of isotopic analysis of the elements<br />
discussed above can be obtained from Koch &<br />
Behrensmeyer (1992) and Van der Merwe (1988 and
1990), but, in general, the procedures involve<br />
preparation of samples for mass spectrophotometry. <strong>The</strong><br />
reporting of isotope values is detailed in Van der Merwe<br />
et al (1988). More information on DNA analysis can be<br />
obtained from Georgiadis et al. (1990), but in general,<br />
the procedures involve preparation of samples for mass<br />
spectrophotometry. <strong>The</strong> reporting of isotope values is<br />
detailed in Van der Merwe et al. (1990).<br />
Further research into DNA, microchemical and isotope<br />
analysis will require substantial time and resources.<br />
While DNA analysis per sample may be relatively<br />
cheap, many samples are required for comprehensive<br />
research (Chapter 18 - Box 18.1, Georgiadis 1990). On<br />
the other hand, the cost of isotope analysis is very<br />
expensive, ranging from approximately US$50 per<br />
sample for carbon and nitrogen to US$150 per sample<br />
for lead and strontium (Koch & Behrensmeyer 1992).<br />
Van der Merwe (1993) has estimated that a continental<br />
database of ivory isotopic composition would require<br />
up to US$ 400,000, assuming that the necessary<br />
equipment is available. To include additional trace<br />
elements the available microchemical techniques might<br />
be too expensive for routine use (Wyckoff 1972).<br />
14.6 CONCLUSION<br />
<strong>Elephant</strong> tusks can potentially provide useful<br />
information on the individual and population level.<br />
<strong>The</strong>y can tell us a variety of things in different<br />
circumstances and sometimes they are the only source<br />
of information on the elephants that have died. Further<br />
research is needed in order to realize the full potential<br />
of information from elephant tusks. At the same time,<br />
the reality of the costs of such research and potential<br />
applications must be taken into account.<br />
References<br />
CORFIELD, T.F. (1973) <strong>Elephant</strong> mortality in Tsavo National Park. Kenya.<br />
East <strong>African</strong> Wildlife Journal 11, 339-368.<br />
DENIRO, J.M., EPSTEIN, S. (1978) Carbon Isotopic evidence for different<br />
feeding patterns in two hyrax species occupying the same habitat. Science 201.<br />
906-908.<br />
DOUGLAS-HAMILTON, l. (1972) On the ecology and behaviour of the <strong>African</strong><br />
elephant. D. Phil. <strong>The</strong>sis. University of Oxford, U.K.<br />
DOUGLAS-HAMILTON. l. & DOUGLAS-HAMILTON, O. (1975) Among<br />
the <strong><strong>Elephant</strong>s</strong>. Collins & Harvill pres, London.<br />
WHAT WE CAN LEARN FROM TUSKS<br />
ESPINOZA, E.O., & MANN, M. (1991) Identification guide for ivory and ivory<br />
substitutes. World Wildlife Fond & <strong>The</strong> Conservation Foundation. Baltimore.<br />
GATHUA, M.J. (1992) A fossilized elephant tooth in Kakamega forest. East<br />
<strong>African</strong> Natural History Society Bulletin 22(4). 60.<br />
GEORGIADIS, N., PATTON, J. & WESTERN, D.( 1990) DNA and the ivory<br />
trade: how genetics can help conserve elephants. Pachyderm 13, 45.46.<br />
HARBOTTLE, G. & SILSBEE J. (undated) Preliminary report on the possible<br />
sourcing of Ivory by neutron activation analysis.<br />
KOCH, P.L., BEHRENSMEYER, AK. (1992) Determining the source area of<br />
ivory through isotopic analysis. AWP Ivory and <strong>Elephant</strong> Information Service<br />
19 (special issue).<br />
LAWS R.M. (1966) Age criteria for the <strong>African</strong> elephant, Loxodonta to a.<br />
africana. East <strong>African</strong> Wildlife Journal A 1-37.<br />
LAWS, R.M., PARKER I.S.C. & JOHNSTONE, R.C.B. (1975) <strong><strong>Elephant</strong>s</strong> and<br />
their Habitats: <strong>The</strong> Ecology of <strong><strong>Elephant</strong>s</strong> in North Bunyoro, Uganda. Clarendon<br />
Press, Oxford, 376pp.<br />
McKNIGHT, B.L. (1994) End of year report. Tsavo East <strong><strong>Elephant</strong>s</strong> Research<br />
Project. 6pp.<br />
MOSS, C.J. (1975) Portraits in the Wild: Behaviour Studies of Mammals of<br />
East Africa. University of Chicago Press, Chicago. 371pp.<br />
MOSS, C.J. (1988) <strong>Elephant</strong> Memories. Thirteen Years in the life of an <strong>Elephant</strong><br />
family. William Morrow anti Company, New York. 336pp.<br />
MOSS, C.J. (1991) Chobe National Park elephant age structure survey. Report<br />
to the Department of Wildlife and National Parks, Botswana.<br />
PARKER, I.S.C. & MARTIN, E.B. (1982) How many elephants are killed for<br />
the Ivory trade? Oryx 16, 235-239.<br />
PILGRAM, T. & WESTERN, D. (1983) Tusk measurements provide insight<br />
into elephant population dynamics. <strong>African</strong> <strong>Elephant</strong> and Rhino <strong>Group</strong><br />
Newsletter 2,16-17.<br />
PILGRAM, T. & WESTERN, D. (1986.) Inferring the sex and age of <strong>African</strong><br />
elephants from tusk measurements. Biological Conservation 36, 39-52,<br />
PILGR.AM. T. & WESTERN, D. (1986b) inferring hunting patterns on <strong>African</strong><br />
elephants front tusks in the international Ivory trade. Journal of Applied Ecology<br />
23, 503-514.<br />
SUKUMAR R.& RAMESH, R. (1992) Stable carbon isotope ratios in Asian<br />
elephant Collagen: implications for dietary studies. Ecologia 91, 536-539.<br />
VAN DER MERWE (1993) On the trail of ivory. Custos. <strong>The</strong> National Parks<br />
Board of South Africa. August 1993, Pretoria.<br />
VAN DER MERWE NJ., LEE-THORP, J,A.& BELL. R.H.V, (1988) Carbon<br />
isotopes as indicators of elephant diets and <strong>African</strong> environments. <strong>African</strong><br />
Journals of Ecology 26, 163—172.<br />
VAN DER MERWE, N.J., LEE-THORP, J.A., THACKERAY, J.F., HALL-<br />
MARTIN A,, KRUGER, H., COETZEE, H. BELL, R.H,V. & LINDEQUE, M.<br />
(1990) Source- area determination of elephant Ivory by isotopic analysis.<br />
Nature 346, 744-746.<br />
VAN DER MERWE, N.J. & VOGEL, J.C. (1978) 13 Content of human collagen<br />
as a measure of prehistoric diet in woodland North America. Nature 276, 815-<br />
816.<br />
VOGEL, J.C., EGLINGTON, B. & AURET. J.M. (1990) Isotope fingerprints<br />
In elephant bone and ivory. Nature 346, 747-749.<br />
WYCKOFF, R,W,G. (1972) <strong>The</strong> Biochemistry of Animal fossils. Scientechnical<br />
Publishers Ltd., Bristol, 152pp.<br />
135
136
SECTION 5<br />
ELEPHANTS IN THEIR HUMAN CONTEXT<br />
137
15.1 INTRODUCTION<br />
Throughout Africa elephants exist as island populations<br />
surrounded by humans, and a major component of the<br />
relationship between humans and elephants is the<br />
conflict over land use. <strong><strong>Elephant</strong>s</strong> are a large, spacedemanding<br />
species. In their search for food and water<br />
they have traditionally engaged in extensive seasonal<br />
migrations, and while the majority of these movements<br />
have been curtailed in recent years, elephants still require<br />
large tracts of land. At the same time the growing human<br />
population in much of Africa means that an increasing<br />
amount of marginal land is being converted to<br />
agriculture, encroaching increasingly upon land that was<br />
once available to wildlife. Both these trends mean that<br />
elephants and people are overlapping in their use of<br />
habitats and are coming into more and more conflict.<br />
<strong>The</strong> type of conflict that occurs at the meeting of humans<br />
and elephants depends largely on the primary economic<br />
activity of the people affected. Where people practice<br />
agriculture, conflict arises when elephants consume and<br />
destroy cultivated crops; and where the primary<br />
economic activity is keeping livestock either in cattle<br />
ranches or traditional pastoralist regimes, the conflict<br />
revolves around demands for grazing and water sources.<br />
<strong>The</strong> ultimate challenge that staff of protected areas<br />
face is to reduce the conflict between humans and<br />
elephants, solving the problems people encounter as<br />
a result of living with elephants, while at the same<br />
time conserving the elephants. It is only if this<br />
challenge is met that elephants and humans can<br />
continue to cohabit the continent.<br />
Prior to finding solutions to the problems of humanelephant<br />
conflict, one needs to have a good understanding<br />
of them. One needs to know the nature of the conflict, its<br />
extent, its impact in economic terms, and its impact on<br />
elephants. This chapter sets out to guide one on how to<br />
138<br />
begin assessing the impact of elephants on people and<br />
the impact of people on elephants.<br />
<strong><strong>Elephant</strong>s</strong> are not the only wild animals that come into<br />
conflict with people, and although this chapter is written<br />
focusing on investigating human-elephant interactions,<br />
one should bear in mind that the methods can be<br />
extended into a wider investigation of human-wildlife<br />
conflict involving other species.<br />
15.2 ASSESSMENT OF THE IMPACT OF<br />
ELEPHANTS ON HUMANS<br />
15.2.1 General<br />
CHAPTER 15<br />
ASSESSING THE IMPACT OF HUMAN<br />
-<br />
ELEPHANT INTERACTIONS<br />
Kadzo Kangwana<br />
<strong>African</strong> Wildlife Foundation<br />
P.O. Box 48177<br />
Nairobi, Kenya<br />
<strong>The</strong> conflict between humans and elephants usually<br />
revolves around the destruction of crops by elephants,<br />
human injury and mortality caused by elephants,<br />
competition over the use of limited water resources<br />
between elephants and people, damage of watering<br />
structures by elephants and the killing of livestock<br />
by elephants. Preliminary investigations will provide<br />
you with an idea of what the problems are in your<br />
area, and guide you in what steps to take in making<br />
further enquiries.<br />
15.2.2 Preliminary investigations<br />
It is likely that reports of conflict will come to you<br />
or you will hear about them long before you think of<br />
attempting to investigate them. People are always<br />
quick to report the costs incurred through living with<br />
wildlife. Your initial task simply becomes the<br />
verification of these reports.
Walk or drive around the area where the problems<br />
are said to be occurring, look for the signs of damage,<br />
and ascertain that elephants are causing it. <strong>Elephant</strong><br />
footprints, dung and the debarking or felling of trees<br />
(characteristic elephant feeding behaviour) are telling<br />
signs.<br />
Asking people questions will enlighten you further,<br />
as the local people are likely to know when elephants<br />
visit the area, and they will describe in great detail<br />
the damage elephants cause.<br />
Once you have identified the major problems people<br />
face, you will be able to design a strategy to assess<br />
comprehensively the impact of the contact between<br />
people and elephants. Some key methods of assessing<br />
the impact of elephants on humans are:<br />
• to ask people questions or to carry out a<br />
questionnaire survey;<br />
• to make independent assessments of the<br />
costs of living with elephants, such as the<br />
extent and value of crop damage;<br />
• to consult existing records for information;<br />
and<br />
• to observe the elephants.<br />
<strong>The</strong> best assessments of human - elephant conflict<br />
are obtained by using a combination of these methods.<br />
You will have to determine those most appropriate to<br />
use for your situation, as each provides a different<br />
kind of information.<br />
Questionnaire surveys are a quick way of obtaining<br />
information from a cross-section of people. <strong>The</strong>y will<br />
provide you with an assessment of the problem from<br />
the people’s perspective, and enable you to seek<br />
information on a number of issues at the same time.<br />
You may, however, need to complement this<br />
information with more objective assessments.<br />
Independent assessments of crop raiding can give you<br />
very accurate information on the frequency of crop<br />
raiding and the economic loss to the farmers, but they<br />
take a lot of time. Consulting existing records such<br />
as park incident records or local government reports<br />
is an easy way of gathering information, and is<br />
particularly useful if you are seeking a historical<br />
perspective, as the records can go back for a number<br />
of years. Unfortunately, such records are only as good<br />
as the people who keep them, and it is difficult to<br />
assess what proportion of incidents of any kind are<br />
recorded. Observing elephants enables you to identify<br />
WHAT WE CAN LEARN FROM TUSKS<br />
“problem” elephants and study their patterns of<br />
movement. This will give you further information<br />
with which to apply suitable solutions. Let us now<br />
look at each of these methods.<br />
15.2.3 Asking people questions<br />
Not surprisingly, much of the impact of elephants on<br />
people can be determined by asking people questions<br />
or carrying out a survey. <strong>The</strong> term “survey” usually<br />
implies a sample survey designed to gather<br />
information from or about a fraction of the population<br />
only (Heguye 1988). That fraction, however selected,<br />
constitutes a sample. This is in contrast to a “census”<br />
which is designed to gather information either from<br />
or about each and every member of the population<br />
(Heguye 1988; Moser & Kalton 1979).<br />
Heguye (1988) states that the primary purpose of a<br />
survey “is to collect data, usually through interviews,<br />
in as unbiased a form as possible, and to provide as<br />
accurate and complete a picture as you, the<br />
researcher, need or are interested in.”<br />
Both the philosophy and methodology of carrying<br />
out surveys have a long history and much has been<br />
written about the topic. <strong>The</strong> outline provided here,<br />
for the specific purpose of assessing the impact of<br />
elephants on people, should, where possible, be<br />
complemented by reading the texts in the further<br />
reading section at the end of this chapter.<br />
a) Defining the goals or objectives of the survey<br />
<strong>The</strong> first step in carrying out a survey is to define its<br />
goal. <strong>The</strong> information obtained in the primary<br />
investigation stage will be particularly valuable here,<br />
as having identified the general problems, you will have<br />
an idea of what to investigate. “To determine the impact<br />
of elephants on people” would be a typical general goal.<br />
Arising from this would be such sub-goals as “to assess<br />
the prevalence of crop damage by elephants”, and “to<br />
determine people’s attitudes towards elephants”.<br />
At this point, you may need to consider whether you<br />
can obtain the information you need by carrying out a<br />
survey just once, or whether you will need to do a<br />
series of surveys on the same subjects. For example,<br />
if you want to determine the impact of erecting a fence<br />
around a cultivated area to prevent elephants from<br />
entering the zone, then you may want to carry Out the<br />
survey before the fence goes up and three months or<br />
so after the fence has been erected, or in the next<br />
growing season.<br />
139
HUMAN-ELEPHANT INTERACTION<br />
b) Practical issues<br />
In planning your survey you will also need to consider<br />
some practicalities. For example do you have enough<br />
money, time and people to help you carry out the<br />
survey? You may not have the resources you need<br />
and you may have to seek another way of obtaining<br />
the information, as surveys can be time-consuming<br />
and expensive.<br />
c) Defining the population<br />
<strong>The</strong> next stage in designing a survey is to decide on<br />
whom you will carry out the survey. Is your survey<br />
going to be representative of all the people living in<br />
the district, or all the people using one water source,<br />
or all the people living within a 50km band around a<br />
protected area? Deciding on this is called<br />
“defining the population” (Moser & Kalton 1979).<br />
You then have to consider if you can talk to all<br />
individuals in the population, or whether there are<br />
too many individuals and you can only address a<br />
proportion of them. If you decide to talk to everyone<br />
in the population, then you are carrying out what is<br />
technically a “census” and you need not bother with<br />
the following considerations of selecting a sample.<br />
It is usually the case that one does not have the time<br />
nor the resources to cover the entire population, so<br />
one has to select a portion of the population or select<br />
a sample.<br />
Fig. 15.1: Map showing all settlements along the River A. <strong>The</strong><br />
“population” in this case would be all the land<br />
holdings within 20 km of River A. <strong>The</strong> “sampling<br />
unit” is the land holding. <strong>The</strong> “sampling frame”<br />
would be the list of all land holdings in the<br />
population, that is A, B, C, D …, etc.<br />
140<br />
d) Selecting a sample<br />
In selecting a sample there are a number of questions<br />
to be considered: What size should the sample be?<br />
What is the appropriate sampling unit or is one going<br />
to sample households, individuals, land holdings or<br />
agricultural plots?<br />
Most people carrying out surveys have to go through<br />
much deliberation about what sampling unit to use.<br />
In trying to assess elephant impact on people, I feel<br />
it is better to use a geographical unit such as<br />
settlement or land holding rather than an individual<br />
as the sampling unit. You will need to know the<br />
general components of this unit, like how many<br />
individuals live in a settlement or depend on the land<br />
holding, in order to interpret the findings of the survey<br />
fully, but these units enable one to work with a fixed<br />
subject that is easy to find. Furthermore, analysing<br />
information at the level of settlements or land<br />
holdings should suffice in most cases.<br />
To sample, you need a sampling frame. This is a list<br />
of all the units which exist in the population. If the<br />
sampling unit is the individual then you need a list<br />
of all individuals living in the population. If the<br />
sampling unit is the land holding or settlement, you<br />
need a list of all the names of the land holders or<br />
settlements, and also a map showing them all (see<br />
Fig. 15.1).<br />
A slightly different question to consider is what the unit<br />
of enquiry should be. Will you be asking about<br />
individuals and their experience or the experiences of<br />
the settlement or land holding? In surveys about elephant<br />
impact on humans, it is usual to make the unit of enquiry<br />
the land holding or the settlement. As such, the sampling<br />
unit and the unit of enquiry are the same.<br />
Once a sampling frame has been determined, you need<br />
to select from it those units to be surveyed. That is, to<br />
select the sample.<br />
<strong>The</strong>re are numerous and complex statistical<br />
considerations at this stage which may influence the<br />
course of action you take. Among them is the concept<br />
of how representative of the population the sample is<br />
and how you can use the Information gathered from<br />
the sample to make inferences about the population.<br />
<strong>The</strong> most accurate information on a population is<br />
obtained by collecting data on all members of that<br />
population. In theory, the larger the sample the more<br />
representative of the population it will be, but if a<br />
population is fairly homogeneous, or there is little<br />
variation between members of the population, then<br />
even a small sample will give an accurate picture of
the population. However, if you have enough<br />
information to know that the population is<br />
homogenous then you do not need to carry out a<br />
survey! Making a sample as random or unbiased as<br />
possible also increases the likelihood of its being<br />
representative of the population. For a detailed<br />
discussion of the statistical assumptions of sampling<br />
see Moser and Kalton (1979).<br />
On a more practical note, you have to decide how<br />
large the survey is going to be. How many sampling<br />
units do you wish to cover and how many can be<br />
covered given your resources? Usually a balance<br />
needs to be struck between these two. Aiming for a<br />
truly random sample of 10% to 20% of the defined<br />
population should give an indication of the trend in<br />
the population. But you should note that statements<br />
about samples are only probability statements (Moser<br />
& Kalton 1979), and they only indicate trends in the<br />
population.<br />
<strong>The</strong> main challenge of sampling is to ensure that the<br />
units sampled constitute a “fair” cross section of the<br />
BOX 15.1: SAMPLING METHODS<br />
HUMAN-ELEPHANT INTERACTION<br />
population or one that was chosen with enough rigour<br />
to satisfy an observer that the selection was not<br />
influenced by the most obvious sources of bias, such as<br />
asking questions only of people who wanted to answer<br />
questions or those nearest to one’s work base!<br />
<strong>The</strong>re are a number of ways of drawing or selecting a<br />
sample, all of which have some statistical assumptions.<br />
<strong>The</strong>se are described in Box 15.1.<br />
e) Drawing up the questionnaire<br />
After you have selected the sample, the next stage is to<br />
design the questionnaire or survey instrument to be used.<br />
This is a much less straight forward task than it seems<br />
and there are many things to take into account.<br />
<strong>The</strong> first is to ensure that you design questions<br />
which provide you with the information you need<br />
or the data you require to meet your overall goal.<br />
You will want information on the problems you<br />
encountered in the preliminary investigations. For<br />
example, you may want to know how widespread<br />
Drawing a Simple Random Sample involves drawing units from a population in such a way that each has the same<br />
chance of being selected. To do this it is essential to have a sampling frame which identifies all the units in the<br />
population either by name or number. If the population is small, one could write the names on cards of equal size,<br />
put these in a hat and draw out as many as are required for the sample. If the population is large, one can give a<br />
number to the units in the population and select those to be included from a list of random numbers (published<br />
series of numbers arranged in non-systematic order).<br />
Another common way of selecting a sample is to carry out Systematic Random Sampling. This also requires<br />
complete lists of all units in the population. <strong>The</strong> sample is then drawn, by selecting a figure from a random number<br />
table, for example, 4, and then selecting all sample units with the number. In this case 4, 14, 24, 24, 40 – 49, 54 will<br />
all be selected, until the required number of units is selected.<br />
Alternatively, you could select a sampling fraction such as 1 in 6, start at a random figure, say 4, and select every<br />
sixth unit which in this case will be the 10 th , 16 th , 22 nd unit. This second method has the disadvantage that you must<br />
be sure that the sampling fraction does not correspond to a cycle or pattern in the sampling frame (Heguye 1988).<br />
Stratified samples can be drawn, either to ensure that the researcher has equal or representative numbers in the<br />
sample of certain categories. One may decide to have equal numbers of pastoralist settlements or agriculturalist<br />
land holdings in the survey so half the sample would be drawn from the list of agriculturalist settlements and half<br />
from the list of pastoralist settlements. It may be the case that in a certain area one-third of the households keep<br />
livestock and two-thirds grow crops. A proportional representation of the population would mean that on-third of<br />
the sample would need to be drawn from the livestock keeping households and two-thirds from the crop growers.<br />
Alternatively, you may want to sample an equal number of men and women or an equal number of men and women<br />
or an equal number of people in different age groups. In this case you will require a list of all men and women or all<br />
members of the population by age as your sample frame.<br />
When selecting a sample it is useful to select four or five more than you need, as reserve sampling units, in case you<br />
cannot interview all of the original sample. (Adapted from Heguye 1988).<br />
141
HUMAN-ELEPHANT INTERACTION<br />
crop raiding is. When does it occurs? What crops are<br />
damaged? You may also want to know how many<br />
farmers have had livestock killed by elephants or how<br />
many people in each settlement have been injured or<br />
killed by elephants.<br />
In trying to assess the impact of elephants on humans,<br />
typical questions would be:<br />
142<br />
• Do elephants come into your agricultural<br />
plot?<br />
• Do they eat the crops you grow?<br />
• In what season do elephants come to your<br />
plot?<br />
• At what time of day do elephants come<br />
to your plot?<br />
• How do you chase elephants away?<br />
• Have you (anyone in your family) been<br />
hurt by an elephant?<br />
• Have any of your livestock been injured<br />
or killed by an elephant?<br />
• How would you feel if the elephants were<br />
removed?<br />
You will also need to ask questions that Will give you<br />
information about the respondent. For example, how<br />
long have you lived here? How many people depend<br />
on this piece of land? <strong>The</strong> answers will enable you to<br />
interpret the information on impact in the light of<br />
parameters of the population. In considering which<br />
questions are relevant, you should try to consider the<br />
kinds of analyses you plan to undertake with the results<br />
of your survey.<br />
Other considerations in designing questionnaires are<br />
what type of questions should you ask. Should they be<br />
closed, providing the respondent with a series of possible<br />
answers to choose from? Should the interviewer field<br />
code the responses into categories which he has, but<br />
which are not communicated to the respondent? Should<br />
questions be open where the interviewer asks the<br />
question and takes down, in longhand, the full response<br />
given, for coding at a later date?<br />
Each of these types of questions has advantages and<br />
disadvantages. Giving the respondent a response<br />
category obviously influences their response, and I<br />
recommend avoiding this type of question for<br />
interview surveys. Field coding where the<br />
interviewer has a number of responses to tick and<br />
interprets the respondent’s answer there and then<br />
has the advantage of being quick, but the<br />
disadvantage of wasting or losing information.<br />
Easy answers can be pre-coded for example, Do<br />
elephants come into your plot? Yes = 1, No = 2<br />
and the interviewer can tick the right number in<br />
the field as soon as the response is given.<br />
More complicated or interesting answers should<br />
be taken down in longhand and coded later, as it is<br />
a pity to lose some of the information before you<br />
have had a chance to think about it.<br />
Questionnaires take up the time of the respondent<br />
who will have many other things to do, so you<br />
should try to make them as short as possible, while<br />
meeting your research requirements. Remember<br />
questions are expensive! A long questionnaire<br />
results in a long interview which means you pay<br />
interviewers more. You also spend more on<br />
replicating the questionnaire sheet and you spend<br />
more on sorting out the data at the end!<br />
Once you have determined which questions to ask,<br />
you should consider the order in which to ask them.<br />
It is good practice to ask simple questions which<br />
do not threaten the respondent first, and place<br />
questions about sensitive issues at the end. By the<br />
time you ask these, it is hoped some rapport has<br />
been built between the interviewer and the<br />
respondent.<br />
It is also a good rule to start with general questions<br />
and then narrow down to specifics, such that you<br />
do not influence the answers of the respondents.<br />
Also remember to group related questions, again<br />
starting with the general and leading on to<br />
specifics.<br />
For ease of reference to interviews it is worth<br />
giving each questionnaire a unique number as its<br />
identifier. This should be at the top of the<br />
questionnaire sheet, and on each of its pages.<br />
If your questions are to be asked in different<br />
languages, you need to ensure linguistic<br />
equivalence, or that, once translated, each question<br />
means the same thing in all the languages.<br />
At this point you should test your questionnaire to<br />
determine if the questions are understood and you<br />
are obtaining the information you need. Pre-testing
will also give you an idea of how long the interview<br />
takes. Remember to test the questionnaire on<br />
members of the population who are not part of the<br />
main sample. If people have problems understanding<br />
questions, change the wording. If the interview is so<br />
long that the respondent’s interest fades, reduce the<br />
number of questions. Spending time and thought pretesting<br />
and adjusting your questionnaire will save you<br />
much wasted effort in the long run.<br />
f) Interviewing<br />
Once you have selected the sample and drawn up a<br />
questionnaire and pre-tested it, you are ready to carry<br />
out the survey. If you are going to use “enumerators”<br />
or other people to help you carry out the survey, you<br />
will need to train them to ensure they understand the<br />
questionnaire, and the importance of addressing the<br />
questions to the pre-selected sample of people, as you<br />
will be assigning a portion of the sample to each<br />
interviewer. It is wise to involve the enumerators in<br />
the pre-test.<br />
It is important that each interviewer asks the question<br />
as it appears on the questionnaire and records the<br />
answer accurately, not biasing it by his or her own<br />
attitudes or predispositions. It may be worth<br />
accompanying each of the interviewers to check that<br />
they are asking questions correctly. You should also<br />
check the completed questionnaires as they come in,<br />
to detect any problems at an early stage.<br />
You should try to carry out all the interviews within<br />
a relatively short space of time, as the problems you<br />
are interested in may vary seasonally.<br />
When approaching people, one needs to be friendly and<br />
pleasant. Go back another time if it is not convenient<br />
for the respondent to answer your questions at the time<br />
of your first visit. Depending on how much time you<br />
have and the distances you need to cover to reach your<br />
respondents, you may decide to substitute one of the<br />
sampling units with one on the reserve list after two or<br />
three unsuccessful visits.<br />
g) Processing and presenting the information<br />
Once some data is collected, you can turn your<br />
attention to coding it. <strong>The</strong> first step is to establish all<br />
the codes to be used and come up with a coding sheet.<br />
This will involve going through some of the<br />
questionnaires and summarising the categories of<br />
responses. You can then group the responses into<br />
categories and assign codes for processing the<br />
information. Be sure to include a category for no<br />
response. Codes should not overlap and should cover<br />
all possible answers. Some examples of coding:<br />
A. Sex of respondent:<br />
1 = Male<br />
2 = Female<br />
3 = Not indicated<br />
HUMAN-ELEPHANT INTERACTION<br />
B. Problems encountered:<br />
a) Crop Raiding<br />
1=Yes 2=No 3=No answer<br />
b) Human injury/mortality<br />
1=Yes 2=No 3=No answer<br />
c) Livestock injury/mortality<br />
1=Yes 2=No 3=No answer<br />
d) Damage to watering structures<br />
1=Yes 2=No 3=No answer<br />
e) Damage to food stores<br />
1=Yes 2=No 3=No answer<br />
Once you have established your coding list, you<br />
should go through all the questionnaires assigning<br />
codes to them. <strong>The</strong> way you handle these codes<br />
depends on the facilities available to you. You could<br />
enter the codes onto tabulated sheets of paper that<br />
will make it easy for you to carry out some hand<br />
counts and analysis, or you could enter the codes into<br />
a specially designed database on computer.<br />
<strong>The</strong> next step is to try to understand what the data<br />
you have collected mean. Counting up the different<br />
codes for each category is a good first step. For<br />
example, 70 of the 115 land owners complained about<br />
crop raiding. Ten of them had members of their family<br />
or household injured or killed by an elephant, etc.<br />
Try to grasp the meaning of these numbers.<br />
<strong>The</strong> final stage is to write up a report of the survey.<br />
Evaluate the results in relation to the questions you<br />
were asking, the problems of the community, and the<br />
ways you see to solve these problems.<br />
It should be noted that while the steps in carrying out<br />
a survey appear chronologically distinct, each phase<br />
depends on the others for its success, and forward<br />
and backward linking should be a key activity of<br />
survey design (Moser & Kalton 1979). For Instance,<br />
as you decide on the questions to ask, picturing the<br />
kind of tabulations and graphs you would like to draw<br />
143
HUMAN-ELEPHANT INTERACTION<br />
at the end of the survey will enable you to clarify<br />
what data you are seeking. It is very much worth<br />
thinking through the whole operation before the first<br />
step is undertaken.<br />
h) Possible sources of bias<br />
<strong>The</strong>re are numerous opportunities for bias to enter<br />
into a survey. Asking leading questions is one of<br />
them. A question like “What problems do elephants<br />
cause you?” assumes that elephants are a problem<br />
and influences your respondent’s frame of mind,<br />
even before they answer you. Questions should<br />
always be neutral.<br />
It may be the case that you work in an area where<br />
people would prefer to be interviewed by male<br />
enumerators, or that women prefer to be interviewed<br />
by female enumerators. You should be aware of the<br />
gender consideration and biases in your community<br />
and select your enumerators accordingly.<br />
<strong>The</strong> responses people give will sometimes depend<br />
on what they think you would like to hear, or what<br />
they think you will be able to do to help them.<br />
Sociologists have overcome or reduced this problem<br />
by asking the same question in different ways at<br />
different points in the questionnaire. This helps one<br />
to check for inconsistency.<br />
Enumerators dressed in a protected area authority<br />
uniform may cause the respondents to answer<br />
negatively in the hope that the authority will help<br />
them. Conversely, people may resent the protected<br />
area or local government authority and not want to<br />
have anything to do with enumerators in uniform.<br />
It is impossible to remove all bias from a survey,<br />
but being aware of how it might arise will help you<br />
tackle the most obvious problems. In writing a<br />
report on the survey, it is always fair to mention<br />
where bias may have influenced the results you<br />
obtained.<br />
15.2.4 Independent assessments and<br />
monitoring of crop raiding<br />
A questionnaire survey will give you a broad picture<br />
of the prevalence of crop raiding in an area, and<br />
provide you with information on the main crop<br />
raiding season which may suffice for your needs.<br />
<strong>The</strong>re are, however, aspects of crop raiding where<br />
the information required is best obtained from<br />
independent assessments. <strong>The</strong>se are the extent of crop<br />
144<br />
damage and the economic loss thus incurred.<br />
Understandably, some people are likely to over inflate<br />
the amount they have lost in the hope that they will<br />
be compensated at these levels. Over inflation of the<br />
loss also results from the emotional perception of loss.<br />
When you ask someone how much of his crop has<br />
been damaged, the response is likely to portray his<br />
perception of loss rather than the actual loss and these<br />
can be significantly different. In fact, it may be<br />
interesting to compare the difference between the<br />
perceived and actual loss.<br />
<strong>The</strong> value of independent assessments is greatest<br />
when they are part of a systematic study. To assess<br />
the extent of crop raiding, the first step would be to<br />
select randomly several farms or land holdings to be<br />
monitored, using the same methods for random<br />
selection described above for questionnaire surveys.<br />
Once you have selected the farms, you should plan a<br />
regime for visiting them on a regular basis, asking<br />
questions about the number of crop raiding incidents<br />
since your last visit and inspecting the cultivated area<br />
to assess damage.<br />
Crop raiding problems are invariably seasonal, and<br />
are best studied over time. <strong>The</strong> ideal scenario is to<br />
carry out the study over a year, but shorter spells may<br />
be adequate if you do not have the time. It would<br />
then be best to do some monitoring in the dry season<br />
and some in the wet season.<br />
You could leave a data sheet or calendar for the<br />
farmer to write down each time the elephants come<br />
to his or her plot of land to crop raid. You could then<br />
use these data to calculate the mean number of crop<br />
raiding incidents each month by adding up all the<br />
incidents reported in all the farms for each month<br />
and dividing this by the number of farms. Plotting<br />
these data for each month will give you a graph like<br />
the one in Fig 15.2. This analysis provides you with<br />
information on when crop raiding by elephants is at<br />
its worst. This is important information. If your<br />
management authority is to place a problem animal<br />
control unit in the field, you will know when it is<br />
needed the most!<br />
It is important not to base all your assessments on the<br />
reports of the farmers. You could, if time allows, make<br />
repeated visits to farms to ascertain that reports are<br />
correct by looking for fresh signs of elephants in the<br />
fields. Better still, a series of night watches at the<br />
farms will help increase the quality of your<br />
information.<br />
You might want to assess the economic loss
Fig. 15.2: Line graph showing the mean number crop raiding<br />
incidents in Mango District during 1994.<br />
caused by elephant crop raiding. <strong>The</strong> best way to do<br />
this is to visit the farms you have selected as regularly<br />
as you can and estimate the damage caused when<br />
elephants crop raid. This will involve measuring or<br />
estimating the area of the crop that has been damaged<br />
and, if necessary, expressing it as a fraction of the<br />
total area under cultivation with that crop by that<br />
farmer. Sukumar (1989) used a quadrat to measure<br />
the area of damage and, where relevant, counted the<br />
number of individual trees damaged. Ngure (1992)<br />
used string to measure the area of damage and also<br />
counted individual plants.<br />
<strong>The</strong>re are different approaches to estimating the cost<br />
of the damaged area. One is to estimate the value of<br />
the yield for the crop in the damaged area if it were<br />
to mature and fetch market prices, but this is<br />
problematic. If the crop was damaged just prior to<br />
harvesting it would be fair enough to estimate its value<br />
at market price. However, with an immature crop one<br />
cannot be sure it would reach maturity uninfluenced<br />
by natural catastrophes such as drought or floods and<br />
so one is assuming much in giving it a market value.<br />
A more cautious approach is to estimate the cost of<br />
the crop by simply adding all the inputs up to the<br />
stage it was in when it was damaged.<br />
An agricultural officer working in the area should be<br />
able to help you with the costing of all inputs and the<br />
valuation of the crop. If you begin with a list of all<br />
the inputs to the entire crop to the date of damage,<br />
you can then multiply this by the area of damage to<br />
get an estimate of what the loss is worth. Among the<br />
inputs will be the cost of seeds, fertilisers, insecticides,<br />
labour and irrigation.<br />
By visiting a farmer regularly over a growing season,<br />
you can obtain a cumulative figure of all the damage to<br />
his crop over one season. A sample of farmers will give<br />
you the data to work out the average loss per area of<br />
cultivated crop and you could multiply this figure by<br />
the total area under cultivation in the region to get a<br />
HUMAN-ELEPHANT INTERACTION<br />
figure for loss in monetary terms per season for the<br />
whole area.<br />
<strong>The</strong>se figures will be important in considering what<br />
management strategy to take, If people are losing<br />
nearly all their crops, management may need to come<br />
up with good ways of preventing elephants from<br />
entering crop fields.<br />
15.2.5 Consulting records<br />
An additional source of information on humanelephant<br />
conflict can be found in the incident records<br />
and reports in protected area and local government<br />
offices. It would, thus, be useful to consult these<br />
records.<br />
Protected area staff are likely to keep records of<br />
people injured and killed by wildlife as well as<br />
records of livestock killed by wildlife. Searching<br />
through these records you may be able to determine<br />
how many elephant incidents occur. It may interest<br />
you to compare these findings with the answers you<br />
got on elephant incidents in your survey.<br />
It is unlikely that these reports will be complete, but<br />
they will provide you with an indication of the<br />
number of incidents which are reported each year.<br />
At any rate they will provide you with the number<br />
of reported and recorded incidents, which is useful<br />
information in itself. If you are in a position to<br />
influence the keeping of official records, it is worth<br />
encouraging your colleagues to keep records as<br />
complete as possible.<br />
15.2.6 Observing elephants<br />
Useful information on the impact of elephants on<br />
people can be obtained by observing elephants.<br />
By staking out a cultivated field, and using a<br />
powerful flash light you will be able to see which<br />
elephants are crop raiding. Night watches can be<br />
followed up by tracking the elephants once it is light.<br />
For example, in Amboseli I was able to follow the<br />
footprints of a group of 17 bulls through a series of<br />
crop fields back into the National Park where I found<br />
the bulls resting. When the elephants moved away,<br />
I went through the dung they deposited, having noted<br />
which bull deposited which pile, and found tomatoes,<br />
maize and onions in the dung. I was thus able to<br />
identify exactly which bulls had been crop raiding<br />
the night before.<br />
145
HUMAN-ELEPHANT INTERACTION<br />
Many sections of this book are relevant here.<br />
Knowinghow to age and sex elephants and identify<br />
individuals (Chapter 7) will enable you to identify crop<br />
raiding animals. It has been observed that culprit<br />
elephants are consistent and it may only be a few who<br />
are causing the problem (Sukumar 1989). If you can<br />
identify the “problem” elephants, removing them may<br />
be the solution.<br />
<strong>Studying</strong> elephant movements (Chapter 8) will show<br />
you whether the human habitation is part of the home<br />
range of any particular elephants. Certainly, knowing<br />
the main routes of entry into and out of cultivated areas<br />
will enable you to position barrier fences strategically.<br />
Combining the reports taken from people with<br />
observations of elephants will give you a fuller picture<br />
of human-elephant interaction, and is worth doing.<br />
15.3 ASSESSMENT OF HUMAN<br />
IMPACT ON ELEPHANTS<br />
15.3.1 General<br />
Not all the impact of human-elephant conflict is suffered<br />
by humans. <strong><strong>Elephant</strong>s</strong> have also incurred major losses,<br />
with numbers crashing to the verge of extinction in<br />
many parts of Africa, primarily due to the poaching of<br />
elephants for ivory. <strong><strong>Elephant</strong>s</strong> have also had to adapt<br />
their movement and foraging habits to an increasingly<br />
populated continent.<br />
While quantifying how humans are influencing<br />
elephants is less easy than quantifying elephant impact<br />
on humans, you may be able to carry out some useful<br />
studies. You could, for example, determine how human<br />
use of an area is influencing elephant use of the same<br />
area. You could also look at how humans and elephants<br />
share a limiting resource such as water. Where there<br />
are good records of elephant mortality, you could<br />
determine the proportion of deaths caused by humans.<br />
<strong>The</strong> trick here is to be adaptive and use whatever method<br />
seems sensible to give you the data you want.<br />
15.3.2 Looking at elephant distribution in<br />
relation to human use<br />
Carrying out dung counts in the tropical forest of<br />
central Africa showed that the main factor in<br />
146<br />
determining elephant distribution is human habitation<br />
(Barnes et al. 1991). I used dung counts to determine<br />
the distribution of elephants in relation to Maasai<br />
settlement in Amboseli (Kangwana 1993). Details of<br />
the dung-counting method are given in Chapter 5.<br />
You can modify these methods to carry out a study of<br />
elephant distribution in relation to people as follows.<br />
You will need to divide your study area into strata<br />
according to distance from human settlement, and then<br />
distribute your counts in these strata. Your strata could<br />
be 0-5km away from settlements, 5-10km, and 10-<br />
15km, etc. A reconnaissance (see Chapter 5) in the area<br />
will give you an idea of where to place your transects.<br />
Once you have collected the data and have your dung<br />
densities for each of the transects and strata, you can<br />
begin to look for trends in the distribution. For a study<br />
of elephant use of areas you do not need to convert<br />
the dung density to elephant numbers, as relative use<br />
of areas is usually sufficient. However, you may need<br />
to carry out a study of the rate of dung decay as it is<br />
useful to know how long dung lasts on the ground<br />
(see Chapter 5). This will give you a time frame in<br />
which to assess your dung distributions.<br />
You are likely to find that elephants avoid areas of<br />
human settlement. You can infer from this that if the<br />
number of settlements in your area increases,<br />
elephants will have to find alternative areas to use or<br />
have less area available to them.<br />
15.3.3 Looking at dual usage of<br />
watering resources<br />
In some areas elephants and people may be forced to<br />
share water sources, and it is interesting to observe<br />
how they do so. This may also be a good way of<br />
observing the results of direct contact between<br />
humans and elephants.<br />
<strong>The</strong> first step is to identify an area which is used<br />
regularly by both people and elephants. Once you<br />
have done this, you can devise a scheme of watching<br />
the area. Setting a time frame for observing the area<br />
helps. For example, you may want to observe the area<br />
for two or three months, or for one month in the wet<br />
season and one month in the dry season to compare<br />
the use of the resource each season.<br />
You should then divide the day into time blocks for<br />
watching the watering place. Say early morning (6:30-<br />
9:30am), late morning (9:30am-12:30pm), early
afternoon (12:30am – 3.30pm), late afternoon (3:30-<br />
6:30pm) and evening or night. Over the time period<br />
that you decide to observe the area, you should spend<br />
one or two of the time sessions observing use of the<br />
area by people and wildlife. Which sessions on any<br />
day you watch the area should be random but you<br />
should cover an equal number of blocks in each time<br />
zone during your study time. Let us say on the first<br />
day you watch the area from 6:30- 9:30am, on the<br />
second day you could watch it from 3:30- 6.30pm<br />
and so on.<br />
<strong>The</strong> data you will be collecting are on human and<br />
elephant use of the area. You could design a simple<br />
data sheet to help you do this (see Chapter 10). In<br />
this case you will want to note the date and time as<br />
well as when elephants and people come into the<br />
zone and when they leave, what they do when there<br />
and how many elephants and humans come in at any<br />
one time. It will also be interesting to estimate the<br />
distance that elephants and humans stay apart.<br />
<strong>The</strong> data you obtain here will give you an indication<br />
of how the area is used by both, and the times with<br />
the highest probability of conflict. In an ideal world,<br />
you could then advise people to use the area at times<br />
elephants are least likely to use the area. It has been<br />
shown, however, that elephants can adjust their times<br />
of use of a watering hole around the times humans<br />
use it (Kangwana 1993).<br />
In your preliminary investigations you may have<br />
come across the fact that elephants destroy manmade<br />
watering structures such as wells and<br />
boreholes. <strong>The</strong> above regime for watching a watering<br />
place could be used to watch a well or borehole.<br />
Carrying out this study will give you an idea of how<br />
elephants use the structure, what damage they cause,<br />
and how you can decrease the damage or prevent<br />
elephants from using these structures.<br />
15.3.4 Human contribution to elephant<br />
mortality<br />
In places where there are good records of elephant<br />
mortality, it may interest you to try to determine how<br />
many of the elephant deaths are caused by humans.<br />
Human causes of elephant mortality include poaching<br />
for ivory or meat, killing in retaliation and hostility<br />
as a result of damage, ritual hunting and sport hunting.<br />
Protected area records are a good source of<br />
information on elephant deaths and their causes.<br />
Chapter 16 provides you with guidelines and a data<br />
sheet for collecting mortality data in the field. We<br />
have also seen how ivory stores provide information<br />
on elephant mortality trends (Chapter 14).<br />
15.4 CONCLUSION<br />
This chapter has gone through some of the methods<br />
you are likely to use in assessing human-elephant<br />
conflict. It should now be clear that assessing humanelephant<br />
conflict is not a field with its own<br />
idiosyncratic methods. It takes a combination of<br />
sociology, biology and economics plus some<br />
common sense and imagination to bring the relevant<br />
elements together to help you assess the humanelephant<br />
conflict in your area. Once you have<br />
assessed the problem you will need to make<br />
management decisions but that is another topic.<br />
15.5 FURTHER READING<br />
Moser, C. A. & Kalton, G. (1979)<br />
Survey Methods in Social Investigation. Heinemann<br />
Educational Books Limited, London.<br />
Sudman, S. & Bradburn, N.M. (1982) Asking<br />
questions - a practical guide to questionnaire design.<br />
Jossey-Brass Publishers, San Francisco.<br />
References<br />
HUMAN-ELEPHANT INTERACTION<br />
HEGUYE, E. (1988) Census and Surveys. Introduction to Social Research<br />
(Ed. V. Pons), University of Hull, Hull.<br />
MOSER, C. A. & KALTON, G. (1979) Survey Methods in Social<br />
Investigations. Heinemann Educational Books Limited, London.<br />
BARNES, R.F.W., BARNES, K.L., ALERS, M.P.T., & BLOM, A. (1991)<br />
Man determines the distribution of elephants in the rain forests of northeastern<br />
Gabon. <strong>African</strong> Journal of Ecology 29, 54-63<br />
KANGWANA, K. (1993) <strong><strong>Elephant</strong>s</strong> and Maasai: Conflict and Conservation<br />
in Amboseli Kenya. Unpublished PhD <strong>The</strong>sis. University of Cambridge.<br />
NGURE, N. (1992) History and Present Status of Human - <strong>Elephant</strong> Conflicts<br />
in the Mwatate-Bura Area, Kenya. Unpublished M.Sc. <strong>The</strong>sis. University of<br />
Nairobi.<br />
SUKUMAR, R. (1989) <strong>The</strong> Asian <strong>Elephant</strong>: Ecology and Management<br />
Cambridge University Press. Cambridge.<br />
147
16.1 LAWS AND LAW ENFORCEMENT<br />
Laws may be defined as a body of rules that enjoin or<br />
prohibit certain actions, and can be considered as the<br />
practical instrument for implementing policy. Laws<br />
are basically of two kinds, one written in statutes<br />
enacted by a legislative assembly, and the other often<br />
unwritten and acting by custom. Laws also operate<br />
at various levels ranging from local bye-laws, to<br />
national laws, to international treaties. <strong>The</strong> objective<br />
of law-makers is to make prescriptions that regulate<br />
human activity for the ‘greater good’. However, lawmakers<br />
have to reconcile a wide variety of interests<br />
and their vision of the ‘greater good’ may well not<br />
coincide with everyone’s view of their own personal<br />
good, which therefore gives rise to the well-known<br />
general rule that laws are made to be broken.<br />
Nevertheless, those who have made laws, and who<br />
believe they have ‘right’ on their side will wish to<br />
see that the law is enforced, that attempts to break<br />
the law are kept to a minimum and that the law<br />
achieves its particular objective. Given that<br />
monitoring consists of keeping track of the<br />
components of a system, specifically to assess their<br />
progress in relation to the objectives set for the system<br />
(Bell 1983), it is as valid to monitor the success or<br />
otherwise of the law in achieving its objectives as it<br />
is to monitor, let us say, the ecological components<br />
of a system such as trends of change in elephant<br />
numbers and in woodland cover in relation to the<br />
objectives of a culling programme. Indeed, given that<br />
around 90% of the staff of <strong>African</strong> wildlife authorities<br />
are employed in the field on management duties<br />
related to law enforcement, and that a large<br />
component of law enforcement relates to those large<br />
and charismatic species with valuable trophies like<br />
the elephant (Cumming’et al. 1984), it is of paramount<br />
importance that the monitoring of this component of<br />
148<br />
CHAPTER 16<br />
MONITORING LAW ENFORCEMENT AND<br />
ILLEGAL ACTIVITIES<br />
N. Leader-Williams<br />
Planning and Assessment for Wildlife Management, Department of Wildlife<br />
P.O. Box 63150,<br />
Dar es Salaam, Tanzania<br />
So many men, so many opinions; his own a law to each. Terence c.195-159 B.C.<br />
the system is accorded a very high priority by wildlife<br />
managers. Hence, the main purpose of this chapter is<br />
to emphasise the need for establishing a system for<br />
monitoring the success of law enforcement activities<br />
in <strong>African</strong> protected areas to ensure that investments<br />
are cost-effective. Using one case study, the chapter<br />
makes suggestions as to how monitoring can be<br />
achieved and discusses some results of relevance from<br />
those few studies which have been undertaken in this<br />
field. None of this is a new plea, having first been<br />
made a decade ago (Bell 1986a), yet sadly is one that<br />
has been taken up in very few instances (Dublin &<br />
Jachmann 1992; Leader-Williams & Albon 1988;<br />
Leader-Williams et al 1990).<br />
16.2 LAWS AND THE AFRICAN<br />
ELEPHANT<br />
<strong>The</strong> <strong>African</strong> elephant poses a particular challenge<br />
to the law-maker wishing to reconcile a wide<br />
variety of human interests, not to mention the<br />
interests’ of the elephants themselves. <strong><strong>Elephant</strong>s</strong><br />
are a challenge because they and their products<br />
attract the attention of many people, ranging from<br />
rural farmers, meat and ivory hunters, carvers and<br />
users of ivory, tourist hunters and game viewing<br />
tourists, to scientists and conservationists. Yet the<br />
perceptions of elephants held by these different<br />
interest groups vary widely. <strong>The</strong>y range from a<br />
complex mixture of motives from’‘greedy’ to<br />
‘noble’ and from ‘intolerant’ to ‘sentimental’. A<br />
local farmer may view an elephant as three tons of<br />
meat capable of damaging one year’s crop of maize.
Hunters, carvers and buyers may see ivory as a<br />
source of income, and a product of beauty,<br />
durability and prestige. A tourist, whether hunter<br />
or viewer, may see an elephant as trophy to be<br />
bagged with a rifle or in a photo. A scientist may<br />
see an elephant as species of high intelligence with<br />
a social system that is fascinating to study. And a<br />
whole further set of moral and ethical dilemmas<br />
are presented in deciding whether elephants should<br />
be used and shot, or totally protected and left<br />
undisturbed, or be allowed to damage human life<br />
and property. Such questions will produce different<br />
answers among different people, each of whom<br />
may be as ‘right’ as the other.<br />
Whatever the perceptions of the various interest<br />
groups, a general rule is that expanding human<br />
populations replace wildlife and their habitats, and<br />
especially those species that are large and long-lived.<br />
Accordingly, written national laws to protect wildlife<br />
have existed for centuries in some countries, while<br />
international wildlife laws have been formulated more<br />
recently. For the <strong>African</strong> elephant, however, the two<br />
have been developed fairly contemporaneously as the<br />
written national wildlife laws of range states date to<br />
the colonial era and, in some instances, result from<br />
an early international treaty, the so called “<strong>African</strong><br />
Convention”, which encouraged <strong>African</strong> range states<br />
to take measures to conserve their wildlife (Lyster<br />
1985). Most national legislation in Africa<br />
encompasses prescriptions for the protection of, for<br />
the hunting and capture of, for the damage to human<br />
life and property by wildlife including elephants.<br />
<strong>African</strong> wildlife laws include clauses establishing<br />
wildlife authorities, categories of protected areas and<br />
of protected species and clauses covering methods,<br />
fees, types of use and who can undertake that use,<br />
and penalties for those found breaking particular<br />
sections of the law (IUCN 1986). International laws<br />
which, in theory, could have some direct or indirect<br />
bearing upon <strong>African</strong> elephants include the “<strong>African</strong><br />
Convention”, which had the catalytic effect noted<br />
above in encouraging national conservation measures<br />
but now lacks resources and any secretariat to<br />
implement the Convention, and the “World Heritage<br />
Convention”, which plays a role in highlighting key<br />
protected areas, including those for elephant<br />
conservation (Lyster 1985). But of greatest<br />
contemporary relevance to <strong>African</strong> elephants is the<br />
Convention on International Trade in Endangered<br />
Species of Wild Fauna and Flora (CITES). With the<br />
listing of the <strong>African</strong> elephant on Appendix I of CITES<br />
in 1989, any international trade for primarily<br />
commercial purposes in specimens, whether living<br />
or dead and including any recognisable parts of<br />
derivatives thereof, is no longer allowed (Bräutigam<br />
1991).<br />
16.3 COMPONENTS OF A LAW<br />
ENFORCEMENT SYSTEM<br />
16.3.1 General<br />
LAW ENFORCEMENT<br />
Wildlife laws address many issues as noted above.<br />
<strong>The</strong>refore, a comprehensive system of monitoring law<br />
enforcement could encompass monitoring the success<br />
of enforcing every clause on the statute books or every<br />
article of an international treaty and assessing whether<br />
each clause or article achieves its objectives. Indeed,<br />
it would be quite possible to setup a monitoring system<br />
for almost any clause or article, given sufficient thought<br />
in assessing the objectives of that clause or article and<br />
in framing questions that need to be answered in the<br />
design of an appropriate monitoring system. However,<br />
in practice, research and monitoring budgets of national<br />
wildlife authorities and international convention<br />
secretariats are limited. <strong>The</strong>refore, it is necessary to<br />
give priority to monitoring the enforcement of those<br />
aspects of the law that relate to major management<br />
problems faced by wildlife authorities (Bell 1986b).<br />
Clearly, for the <strong>African</strong> elephant, the major problem<br />
confronting wildlife authorities and international<br />
conservationists over the past two decades has been<br />
the loss of elephants to supply international markets<br />
with illegal ivory and whether efforts to reverse that<br />
loss have been successful. Hence this chapter will<br />
concentrate on this topic and use it to explore the<br />
general principles of monitoring law enforcement.<br />
16.3.2 Law enforcement and the illegal<br />
ivory trade<br />
<strong>The</strong> ivory trade has a long and complex chain that<br />
extends from the hunter killing the elephant in Africa<br />
to the retailer selling a finished ivory product one or<br />
two continents away. An equally complex set of<br />
national and international legislation attempts to keep<br />
the ivory trade within legal bounds and at sustainable<br />
levels, while a variety of authorities attempt to enforce<br />
these laws at various levels. <strong>The</strong>se include the staff of<br />
national wildlife authorities who patrol on foot in<br />
protected areas with the objective of deterring and/or<br />
arresting illegal hunters, the police and staff of special<br />
units who investigate trafficking in ivory and supply<br />
of weapons to illegal hunters, the customs officer who<br />
149
LAW ENFORCEMENT<br />
checks shipments leaving or entering his country for<br />
illegal ivory the trading standards inspector who<br />
checks retail outlets, and the police and judiciary who<br />
are responsible for convicting and sentencing those<br />
caught breaking the laws. <strong>The</strong> success of law<br />
enforcement efforts can be monitored at all these<br />
different stages, given sufficient co-operation by law<br />
enforcement staff working in areas of sometimes<br />
great sensitivity, given sufficient ingenuity in setting<br />
up data collection protocols and in analysing the<br />
results of activities that are, by their very nature,<br />
illegal and circumspect. Before moving to consider<br />
examples of monitoring law enforcement activities<br />
at various stages of the chain or in relation to various<br />
pieces of legislation, certain basic principles of<br />
monitoring any form of law enforcement activity will<br />
be considered.<br />
16.3.3 Recording data and<br />
measurement of<br />
effort<br />
To be useful, law enforcement activities should be<br />
monitored with data that are collected rigorously and<br />
conscientiously. Within any law enforcement unit or<br />
anti-poaching patrol, this will usually require the<br />
assignment of one staff member to the task of data<br />
collection. It is vital that adequate training is provided<br />
to the person collecting the data, that middle-level<br />
managers provide the necessary leadership to junior<br />
staff collecting the data through their own regular<br />
participation in exercises and patrols, and that<br />
adequate debriefing is carried out at the end of any<br />
exercise or patrol by middle-level managers and/or<br />
research and monitoring staff who will collate and<br />
analyse the data. It will usually be appropriate for<br />
staff collecting data to be encouraged to note any<br />
other observations they feel are of interest and<br />
importance. <strong>The</strong>se additional notes should form a<br />
vital component of the debriefing, following the end<br />
of the exercise or patrol. A final important point is<br />
that law enforcement staff should be given feedback<br />
on the data they have collected, once it has been<br />
analysed and is readily presentable in graphical or<br />
geographical format. <strong>The</strong> increasing use of microcomputers<br />
provides a good tool with which to develop<br />
an interactive forum between law enforcement and<br />
research and monitoring staff in a manner that should<br />
improve the usefulness of everyone’s work.<br />
<strong>The</strong> priority accorded to different aspects of law<br />
enforcement may change over time, whether judged<br />
150<br />
consciously or not. Any monitoring of the success of<br />
law enforcement activities should be undertaken<br />
bearing two basic pre-requisites in mind. First, it is<br />
necessary to make all records of law enforcement<br />
activity in standardised categories. On foot patrols in<br />
protected areas, these categories could include<br />
sightings of live animals, finds of carcasses,<br />
encounters with illegal entrants and hunters or signs<br />
of their activity, the numbers of illegal hunters<br />
captured or seizures of illegal ivory made in terms of<br />
numbers and weight of tusks. Second, it is vital to<br />
measure all standardised categories against a measure<br />
of law enforcement effort (Bell 1986a). <strong>The</strong> measure<br />
of effort used will vary according to the type of law<br />
enforcement activity being monitored, and according<br />
to the level of complexity that those undertaking the<br />
monitoring wish to entertain or to impose upon the<br />
staff collecting the data. On foot patrols within<br />
protected areas, effort may be measured in area and<br />
time units, for example, the number of patrol days<br />
per 100km 2 per month. In contrast, in the case of<br />
seizures at international borders, effort may be<br />
measured in time units, for example, the number of<br />
shipments searched per month.<br />
When these two basic principles are followed, it is<br />
possible to derive an index of ‘catch per unit effort’.<br />
Such an index is an infinitely more valuable measure<br />
of the success of law enforcement activity than<br />
measures of categories lacking measures of effort.<br />
To give a simple example (Table 16.1), if twice as<br />
many illegal hunters or twice as much ivory is seized<br />
one year compared with the previous year, what does<br />
this mean? Very little, unless some measure of effort<br />
is available. But if it is known that twice as many<br />
poachers or twice as much ivory were caught with<br />
half the effort as opposed to twice the effort, then the<br />
results become more meaningful through the<br />
construction of catch per unit effort indices (Table<br />
16.1). In the first scenario, there has been an increase<br />
in the index, while in the second scenario the increased<br />
number of captures would appear to have resulted<br />
from an increased effort alone.<br />
While seemingly very simple and perhaps even<br />
abstract, the point made by these hypothetical<br />
examples should not be taken lightly, as will now<br />
be illustrated by an example from real life. As<br />
noted above, one of the major pieces of<br />
international legislation to affect the <strong>African</strong><br />
elephant is CITES and a major action that required<br />
monitoring to see if law enforcement was<br />
achieving its objectives, was the listing of<br />
elephants on Appendix I of CITES in 1989. Yet,<br />
when it was time to ask the question “has the ban
worked? to provide delegates to the 1992 Conference<br />
to the Parties of CITES with scientific evidence to<br />
enable them to make an informed decision on whether<br />
to vote for continuation of the ban, it was next to<br />
impossible to provide that evidence. Visits to six<br />
range states revealed a paucity of relevant data,<br />
especially with respect to effort (Dublin & Jachmann<br />
1992). Accordingly, it was not possible to provide<br />
any firm evidence that separated out any increased<br />
effort put into law enforcement within protected areas<br />
in individual range states as opposed to the effects of<br />
the ban itself. Hence, despite all the research that has<br />
been conducted on elephants to date, the information<br />
needed to monitor the success of such an important<br />
management action as banning the ivory trade is<br />
simply not collected in the vast majority of key<br />
conservation areas (Dublin & Jachmann 1992).<br />
Written as this chapter is, a couple of years on and<br />
approaching the 1994 Conference to the Parties of<br />
CITES, it is hard to imagine the monitoring of law<br />
enforcement will have improved around the<br />
continent, and that any better answer will be available<br />
in 1994 than in 1992 1 . However, it is possible to set<br />
up simple systems to monitor important law<br />
enforcement actions, as the following case study<br />
shows.<br />
16.4 A CASE STUDY IN LUANGWA<br />
VALLEY, ZAMBIA<br />
In the early 1980s, the Luangwa Valley, Zambia, had<br />
one of the largest remaining populations of elephants<br />
in Africa, and conservationists spent a large sum of<br />
LAW ENFORCEMENT<br />
Year Captures (C) Scenario 1 C/E Scenario 2 C/E<br />
Effort (E) Effort (E)<br />
1 100 50 2 50 2<br />
2 200 25 8 100 2<br />
Table 16.1 Hypothetical example of numbers of captures, e.g. of illegal hunters or of numbers of tusks, when compared<br />
with different levels of effort, e.g. days on patrol or numbers of searches undertaken. Catch per unit effort<br />
indices have been calculated under two different scenarios of effort(E), in order to show that twice the number<br />
of captures(C) in Year 2 needs to be interpreted with caution unless measures of effort are available.<br />
money attempting to save Luangwa’s elephant<br />
population from illegal exploitation. Anti-poaching<br />
patrols undertaking routine law enforcement duties<br />
were used to monitor their own success (Leader-<br />
Williams et al. 1990). Anti-poaching units patrolled<br />
six areas of unequal size during 1979-85. Patrols were<br />
undertaken in all months of the year and were of<br />
different sizes and lengths. Besides routine law<br />
enforcement duties, patrols also made quantitative<br />
records of animal sightings, on carcass finds, captures<br />
of offenders and levels of illegal activity during 1979-<br />
85. Indeed, records from foot patrols undertaken by<br />
Game Department rangers provided data on elephant<br />
numbers in Luangwa Valley during 1947-69.<br />
Encounter rate per effective patrol day was used as<br />
the standard unit of patrol effort to make the<br />
encounter rates equivalent to ‘catch per unit effort’<br />
indices. Thus for each day out on foot patrol, one<br />
scout was designated to record encounters. Data<br />
collected by scouts can provide an accurate record<br />
of events (Bell 1986a), and scouts avoided recording<br />
information when doubtful about the accuracy of<br />
their sightings. <strong>The</strong> following data were collected:<br />
1) Sightings of elephant herds and/or<br />
elephants;<br />
2) Numbers of skulls of elephants, both intact<br />
and with trophies axed off by poachers, as<br />
an index of the relative proportion of<br />
elephants dying as a result of natural<br />
mortality and poaching;<br />
3) Total poachers encountered, as an index<br />
of concurrent illegal activity;<br />
1 Since this chpater was written, a further study of the effect of the ivory ban has been undertaken (Dublin et al. 1995). Like the<br />
proceding study (Dublin & Jachmann 1982), the results were based on data that were sparse and often incosistent, and were again<br />
inconclusive (Dbulin et al. 1995). Hence, the message of this chapter still stands.<br />
151
LAW ENFORCEMENT<br />
152<br />
4) Camps, temporary shelters from cut<br />
branches and fires for cooking, as a<br />
retrospective index of recent illegal<br />
activity;<br />
5) Fresh carcasses, flesh-covered<br />
elephant carcasses encountered with<br />
trophies axed off, which provided an<br />
index of very recent and successful<br />
illegal activity that was detectable<br />
from a distance (by looking for<br />
vultures) but which was confirmed<br />
directly;<br />
6) <strong>The</strong> effective time spent by each scout<br />
on foot patrol measures the<br />
commitment of anti-poaching units<br />
(Bell 1986a). Patrol lengths were<br />
counted as the number of days that<br />
scouts were patrolling on foot in the<br />
bush away from vehicles;<br />
7) Offenders were caught by both foot<br />
and vehicle patrols. On foot patrols,<br />
as many offenders, weapons and<br />
trophies were caught or seized as<br />
possible from each gang encountered<br />
and returned to headquarters for<br />
charging and confiscation. Offenders<br />
were interrogated for their names,<br />
village and chief’s area, and any other<br />
useful intelligence information.<br />
Offenders were placed in one of two<br />
categories depending on whether they<br />
were hunting elephants or rhinos, or<br />
possessed ivory or rhino horn, or<br />
whether they only possessed trophies<br />
such as meat or hides from other<br />
animals;<br />
8) Guns were classified as automatics<br />
(including semi-automatics), rifles,<br />
muzzle-loading guns and shotguns.<br />
<strong>The</strong> number of trophies (tusks) seized<br />
from each gang was also recorded;<br />
9) <strong>The</strong> punishments given to arrested<br />
offenders were noted, to determine if<br />
minimum sentences laid down in law were<br />
being upheld and if the serious crime of<br />
elephant poaching was being differentiated<br />
from other poaching. In other words, were<br />
the judiciary supporting elephant<br />
conservation?<br />
Vehicle patrols were undertaken for a variety<br />
of reasons: reasons: 1) to follow up part of an<br />
escaped gang encountered by a foot patrol; 2)<br />
following receipt of information of unlawful<br />
possession of prescribed trophies or of<br />
possession of unlicensed firearms; 3) on an<br />
irregular basis, usually by setting up roadblocks at<br />
strategic points on the major trunk roads. Offenders<br />
caught, and weapons and trophies seized, were<br />
categorised as described for foot patrols. Offenders<br />
caught on vehicle patrols comprised both escapees<br />
from foot patrols and those in illegal possession of<br />
ivory or rhino horn who may not themselves have<br />
been involved in offences within protected areas.<br />
Clearly other data can also be collected routinely, for<br />
example weights of all seized and found ivory the<br />
age of all found elephants, other signs of illegal<br />
activity and greater detail from carcasses, more<br />
sophisticated measures of effort, and so on. However,<br />
the main duty of law enforcement staff is to undertake<br />
patrolling, rather than to collect data. <strong>The</strong>refore, a<br />
compromise has to be reached that does not overburden<br />
law enforcement staff with data collection<br />
requirements that detract from their main duty.<br />
All of these data were entered onto standard data sheets,<br />
examples of which are shown in Table 16.2. <strong>The</strong> patrol<br />
sheet (Table 16.2a) had columns that could be filled in<br />
by scouts on a daily basis while on patrol. <strong>The</strong> column<br />
totals were then added at the end of the patrol. Data<br />
from these field sheets were computerised for analysis.<br />
<strong>The</strong> arrests made were summarised on an arrest sheet<br />
(Table 16.2b) following the return of a patrol, to provide<br />
data on the origin and details of offenders, and of the<br />
sentences later delivered to them. <strong>The</strong> information<br />
collected was of immediate use in the field to examine<br />
trends in animal numbers and illegal activity through<br />
averaging the catch per unit effort indices. However,<br />
for a formal analysis that was published subsequently<br />
in a scientific journal, a complex statistical analysis was<br />
necessary because the data on the index of sightings<br />
contained many zeros and were therefore termed<br />
‘skewed’, and corrections need to be made for patrols<br />
of different length and in different seasons. While it is<br />
not necessary to go into details here, these can be found<br />
elsewhere (Leader-Williams’et al. 1990). Some results<br />
from the study can now be described, and all indices in<br />
the figures are expressed as if they were numbers of<br />
sightings from a seven-day patrol by four scouts in the<br />
wet season.<br />
Using sightings from patrols, trends in elephant<br />
numbers were shown to have increased at the rate
LAW ENFORCEMENT<br />
Table 16.2: Examples of patrol and arrest sheets suitable for collecting standardised data on law enforcement activities.<br />
Fig. 16.l: <strong>The</strong> relationship between the value of ivory and elephant abundance in Luangwa Valley, shown as: (a) the real price<br />
of ivory (in US dollars per kg) imported to Japan during 1950-1985; (b) elephant sightings on the Westbank of<br />
Luangwa River during 1947-69 and 1979-85 (from Leader-Williams et al. 1990).<br />
153
LAW ENFORCEMENT<br />
of 6% per year from l947-69. However, the overall<br />
rate of decline of elephants was 12% per year during<br />
1979-85, following rapid increases in the price of<br />
ivory on world markets (Fig. 16.1). Trends of decline<br />
in sightings for elephants derived in this way<br />
compared favourably with the accurate methods of<br />
counting elephants from the air, suggesting that the<br />
methods used may have value as means of tracking<br />
trends in population change. This overall decline in<br />
elephants clearly arose from illegal activity as most<br />
skulls had their trophies removed. However, elephants<br />
154<br />
increased in some areas of Luangwa Valley due to<br />
immigration (Fig. 16.2).<br />
Despite a large decline in elephant numbers, law<br />
enforcement units were motivated and successful at<br />
capturing offenders involved in illegal activity in Luangwa<br />
Valley during 1979-85 (Fig. 16.3). Most staff in antipoaching<br />
units spent about half of each month patrolling<br />
on foot under remote and difficult conditions. Offenders<br />
caught on foot patrols provided information for making<br />
arrests more successfully on vehicle patrols (Fig. 16.4).<br />
Fig. 16.2: Changes in elephant abundance in different areas of Luangwa Valley during 1979-85 (from Leader-Williams et al. 1990)
LAW ENFORCEMENT<br />
Fig. 16.3: <strong>The</strong> activities of offenders in different areas of Luangwa, Lower Zambezi and Luano valleys, shown as: (a) mean<br />
size of gangs; (b) the success of making arrests; (c) the proportion of offenders involved in elephant/rhino and other<br />
offences; (d) the proportions of each category of weapon seized; and (e) the median number of tusks recovered<br />
from gangs (from Leader-Williams et al. 1990).<br />
155
LAW ENFORCEMENT<br />
Fig. 16.4: Comparison of the success. of making arrests and seizing weapon and trophies on foot and vehicle patrols by<br />
different anti-poaching units (from Leader-Williams et al. 1990).<br />
Arrests were made cost-effectively and about 40% of<br />
operating costs were recovered from found and seized<br />
ivory. Offenders involved in less serious illegal activity<br />
originated from most areas of Luangwa Valley. In<br />
contrast, well organised gangs, armed with<br />
sophisticated weapons, exploited elephants and rhinos,<br />
and originated from areas outside Luangwa Valley (Fig.<br />
16.5). Offenders who exploited elephants and rhinos<br />
156<br />
were delivered sentences that did not uphold wildlife laws<br />
(Fig. 16.6).<br />
Signs of illegal activity, such as poachers, their camps<br />
and fresh carcasses, were encountered throughout the year<br />
(Fig. 16.7). Encounters of illegal activity generally showed<br />
consistent trends across years within different areas, but<br />
most trends in illegal activity showed complex changes
over time (Fig. 16.8). Increased patrol effort affected<br />
levels of illegal activity, with less activity in more<br />
heavily patrolled areas (Fig. 16.9). Poachers and<br />
camps tended to be seen less often in more heavily<br />
patrolled areas even though these held relatively more<br />
elephants. Finds of fresh carcasses declined with<br />
elephant numbers, but also were found less frequently<br />
in areas of heavier patrol effort. Differences in patrol<br />
effort were related directly to rates of change in<br />
elephant abundance, and were sufficient to create<br />
areas of relative safety which experienced<br />
immigrations of elephants (Fig. 16.10).<br />
<strong>The</strong> overall conclusion of this study was that the<br />
available manpower within law enforcement units<br />
was effective at capturing poachers, but was too small<br />
to provide effective protection to the large populations<br />
of elephants over such a vast area as Luangwa Valley.<br />
Predictions suggest that law enforcement staff should<br />
have been deployed at effective densities of at least<br />
one man per 20km 2 of protected area to have<br />
prevented the decline of elephants (Leader-Williams<br />
et al. 1990). This was equivalent to the spending of<br />
US$215 per km 2 of protected area in 1981 (Leader-<br />
Williams & Albon 1988).<br />
16.5 CONCLUSIONS AND<br />
RECOMMENDATIONS<br />
LAW ENFORCEMENT<br />
Fig. 16.5: <strong>The</strong> areas of origin of elephant/rhino ad other offenders captured in North Luangwa NP (NLNP) ad South Luangwa<br />
NP (SLNP) (from Leader-Williams et al. 1990).<br />
<strong>The</strong> case study described above monitors some<br />
important information related to a major management<br />
problem for elephants and draws conclusions that<br />
show where law enforcement capability did not match<br />
up to the intent of current wildlife policies and<br />
legislation. Several events have occurred since the<br />
time that this study was carried out. On the one hand,<br />
with inflation the 1981 sum of US$215 is now<br />
equivalent to US$340.<br />
157
LAW ENFORCEMENT<br />
Fig. 16.6: <strong>The</strong> sentences given to offenders during 1979-85, shown as: (a) the proportions of different types of sentence given to<br />
elephant/rhino and other offenders before and after a change in law of December 1982; (b) the skewed distributions of<br />
fines and prison sentences towards small sentences; and (c) the slight but significant increases in the size of sentences<br />
delivered during 1979-85. None of these changes upheld wildlife laws (from Leader-Williams et al. 1990.<br />
158
Fig. 16.7: Changes in encounters of each index of illegal activity during different seasons of the year<br />
(from Leader-Williams et al. 1990).<br />
LAW ENFORCEMENT<br />
Fig. 16.8: Changes in encounters of camps in four different areas of Luangwa Valley during 1979-85, shown as encounter rates<br />
adjusted as if they had been made by 4 scouts on a 7 day patrol in the wet season (from Leader-Williams et al. 1990).<br />
159
LAW ENFORCEMENT<br />
Fig. 16.9: Relationship between finds of camps and levels of patrol effort in different areas during 1980-85 (from Leader-Williams<br />
et al. 1990).<br />
Fig. 16.10: Relationships between annual changes in sighting rates of elephant herds and in patrol effort in different areas during<br />
1980-85 (from Leader-Williams et al. 1990).<br />
On the other hand, the <strong>African</strong> elephant was put onto<br />
Appendix I of CITES in 1989; and the demand for<br />
ivory appears to have plummeted in Europe and<br />
America and to have fallen by 50% in Japan. This<br />
might have been expected to reduce the incentive of<br />
commercial poachers to kill elephants for their ivory<br />
within protected areas throughout their range.<br />
However, evidence from certain southern states<br />
suggests that there is still sufficient incentive to poach<br />
elephants (Dublin & Jachmann 1992). <strong>The</strong> fact that<br />
there appears to be no hard data to answer what effect<br />
the ivory ban has had remains a sad indictment upon<br />
the scientific community and national wildlife<br />
160<br />
authorities, for exhortations to carry out research that<br />
is relevant to management have been made for many<br />
years (Bell 1986b; MacNab 1983). Indeed when such<br />
research is carried out it has proved to be of<br />
considerable practical importance, as well as being<br />
of interest to academics (Leader-Williams & Albon<br />
1988; Leader-Williams et al. 1990).<br />
<strong>The</strong> system described here could easily be adapted<br />
to different situations throughout Africa. In<br />
adapting it, the two basic requirements noted<br />
previously must be borne in mind, namely<br />
collecting the standadised categories of data and
setting such measures against a standardised measure<br />
of effort. Thus, in rainforest with no established<br />
system of patrolling, it might be possible to establish<br />
a system of monitoring through the number of reports<br />
of poaching measured against the numbers of villagers<br />
interviewed in an informer network. <strong>The</strong> sooner that<br />
situation-specific methods of monitoring law<br />
enforcement and illegal activities are developed<br />
across Africa, the sooner will data become available<br />
with which to assess such important management<br />
actions as the implementation of the ivory ban.<br />
References<br />
BELL. R.H.V. (1983) Decision making in wildlife management with reference<br />
to problems of overpopulation. Management of Large Mammals in <strong>African</strong><br />
Conservation Areas (Ed. R.N. Owen-Smith). pp. 145-172. Haum, Pretoria.<br />
BELL. R.H.V. (I986a) Monitoring of illegal activity and law enforcement in<br />
<strong>African</strong> conservation areas. In: Conservation and Wildlife Management in Africa<br />
(Eds. R.H.V. Bell & E. McShane-Caluzi), pp. 317-351. Peace Corps, Washington.<br />
BELL, R.H.V. (1986b) Research priorities: what does management need to<br />
know? In: Conservation and Wildlife Management in Africa (Eds. R.H.V. Bell<br />
& E. McShane≠-Caluzi), pp. 79-91. Peace Corps, Washington.<br />
LAW ENFORCEMENT<br />
BRIÄUTIGAM, A. (1991) CITES A Conservation Tool. Trade <strong>Specialist</strong> <strong>Group</strong>,<br />
Cambridge.<br />
CUMMING, D.H.M., MARTIN, R.B. & TAYLOR, R.H. (I984) Questionnaire<br />
survey on Use management and conservation of elephant and rhino, <strong>The</strong> Status<br />
and Conservation of Africa’s <strong><strong>Elephant</strong>s</strong> and Rhinos (Eds. D.H.M. Cumming &<br />
P. Jackson), pp. 46—62. International Union for the Conservation of Nature<br />
and Natural Resources, Gland.<br />
DUBLIN, H.T. & JACHMANN. H. (1992) <strong>The</strong> impact of the ivory ban on<br />
illegal hunting of elephants in six range states in Africa. WWF International<br />
Research Report. WWF, Gland, Switzerland.<br />
DUBLIN, H.T., MILLIKEN, T. & BARNES, R.F.W. (1995) Four years after<br />
the CITES ban: Illegal killing of elephants, ivory trade and stockpiles, IUCN/<br />
SSC/AESG.<br />
IUCN (1986) <strong>African</strong> Wildlife Laws. International Union for Conservation of<br />
Nature and Natural Resources, Gland, Switzerland.<br />
LEADER-WILLIAMS, N. & ALBON, S.D. (1988) Allocation of resources for<br />
conservation, Nature 336, 533.535.<br />
LEADER-WILLIAMS, N., ALBON, S.D. & BERRY, P.S.M. (1990) illegal<br />
exploitation of black rhinoceros and elephant populations: patterns of decline,<br />
law enforcement and patrol effort in Luangwa Valley, Zambia. Journal of Applied<br />
Ecology 27, 1055-I 1087.<br />
LYSTER S. (1985) International Wildlife Law. Grotius, Cambridge.<br />
MacNAB. J. (1983) Wildlife management as scientific experimentation. Wildlife<br />
Society Bulletin 11, 397-401.<br />
161
162
SECTION 6<br />
HANDLING ELEPHANTS<br />
163
17.1 INTRODUCTION<br />
It is sometimes necessary to immobilise elephants for<br />
purposes such as fitting radio collars or carrying out<br />
veterinary procedures. <strong>The</strong>se operations are dangerous<br />
because elephants may injure members of the darting<br />
team, or the immobilised elephant may die under<br />
anaesthesia. No matter how well planned and executed<br />
a darting operation may be, there will still be an element<br />
of risk, and this must be taken into consideration when<br />
deciding whether or not to carry out a particular<br />
immobilising exercise. No darting operation should be<br />
carried out unless it is understood by all concerned that<br />
there is a finite chance of elephant mortality.<br />
Darting from a helicopter or a vehicle is safer than doing<br />
it on foot. However, budgetary considerations or the<br />
nature of the vegetation may make it necessary to carry<br />
out the operation on foot. In this case it is preferable to<br />
use a spotter aircraft and/or a back-up team in a vehicle.<br />
Operations carried out on foot without back-up, as will<br />
be necessary in forest areas, carry a high degree of risk.<br />
<strong>The</strong> risks are particularly high in areas of thick<br />
vegetation, when darting elephant family groups rather<br />
than bulls, and where elephant density is high.<br />
17.2 PERSONNEL<br />
17.2.1 Darting team.<br />
a) On foot<br />
<strong>The</strong> darting team should consist of the person doing<br />
the darting (usually a vet), and a tracker/ guard or backup<br />
man armed with a heavy rifle at the minimum. If an<br />
elephant is to be radio collared, then a biologist should<br />
164<br />
also be present. In this case it is best to have an additional<br />
guard. All members of the team must have cool heads,<br />
be able to run fast, and have experience of approaching<br />
elephants on foot. <strong>The</strong> most difficult job is that of the<br />
back-up man, who must always be aware of where all<br />
the members of the team are in relation to the elephants.<br />
He must be able to decide if, and when, to fire a warning<br />
shot, or to kill an elephant to protect other members of<br />
the team. It is advisable to have a back-up man who has<br />
previous experience of shooting elephants.<br />
b) From helicopter<br />
<strong>The</strong> darting team should consist of a pilot and darter at<br />
the minimum. Usually, the darter sits in a back seat,<br />
behind the pilot. <strong>The</strong> selection of animals can be difficult<br />
since one wants to reduce the time that the helicopter is<br />
in close proximity to elephants, and it is not easy to age<br />
and sex elephants from overhead, so it is best to have a<br />
third person who is positioned on the same side as the<br />
darter, to concentrate on the selection of a target animal.<br />
Headsets and intercoms are essential for these people<br />
to be in communication with the pilot. Shouting or<br />
signing is not effective.<br />
17.2.2 Back-up team<br />
CHAPTER 17<br />
HOW TO IMMOBILISE ELEPHANTS<br />
Chris Thou1ess<br />
c/o WWF East <strong>African</strong> Regional Office<br />
PO Box 62440, Nairobi, Kenya<br />
Environment and Development <strong>Group</strong><br />
11 King Edward Street, Oxford 0X1 4HT, U.K.<br />
<strong>The</strong> role of the back-up team is to carry heavy<br />
equipment, to assist in driving away the rest of the<br />
elephant family and to change the position of the<br />
anaesthetised elephant if necessary. If any observers,<br />
photographers, etc. are present, their place is with the<br />
back-up team. Radio communications between the<br />
back-up team and darting team are essential.
17.2.3 Spotting team<br />
Ground operations can be made considerably safer<br />
if they are directed from a spotter plane, such as a<br />
Piper Supercub. <strong>The</strong> pilot should be able to do low<br />
tight turns at slow speed over a fixed point on the<br />
ground for a long time, allowing for the effects of<br />
wind, while observing an elephant on the ground. It<br />
also helps to have an observer with good eyes and a<br />
strong stomach. Ideally the spotting team should be<br />
able to communicate through an intercom to the<br />
ground team, rather than having to speak into a hand<br />
set.<br />
17.3 EQUIPMENT<br />
17.3.1. Darting team<br />
<strong>The</strong> darting team requires the following:<br />
• Dart gun and aluminium darts with robust<br />
70mm long needle. Appropriate guns are<br />
described in Bathmat (1989)<br />
• Etorphine (‘Immobilon’ or M99)<br />
• Antibiotic spray<br />
• Antibiotic injection<br />
• Respiratory stimulant<br />
• Syringes, needles, etc.<br />
• Syringes with narcotic antagonist<br />
Diprenorphine, ‘Revivion’) and preferably<br />
antagonist for human use (Naloxone)<br />
Items listed below are for a ground-based team only:<br />
• Binoculars<br />
• Wind indicator (a sock or small fabric bag<br />
filled with ash)<br />
• Signalling mirror<br />
• Heavy rifle (.458, .470 or similar calibre)<br />
• Hand held VHF radio (preferably with an<br />
ear plug) and spare batteries<br />
• Dark clothing and suitable shoes<br />
• Tape measure<br />
17.3.2 Back-up team<br />
<strong>The</strong> back-up team requires the following:<br />
Essential:<br />
• Water in jerry can<br />
• Radio with spare battery (as many as<br />
possible)<br />
• Sharp knife<br />
• Notebook and pens<br />
• VHF radio<br />
• Stethoscope and thermometer<br />
If the team has a vehicle:<br />
• Heavy rope (minimum 40ft long)<br />
• Winch<br />
For radio collaring:<br />
• Radio collars<br />
• Bolts for collar attachment<br />
• Wood block<br />
• Drill<br />
• Spanners<br />
• Screwdriver<br />
• Radio receiver<br />
Optional:<br />
• Camera and film<br />
• Marking pen<br />
• Blood tubes<br />
• Sample bottles<br />
17.3.3 Spotting team<br />
<strong>The</strong> spotting team requires the following:<br />
• Radio<br />
• Fuel<br />
• Fuel pump and filter<br />
• Airsickness pills (Avomine taken the previous<br />
day)<br />
17.4 OPERATIONAL PROCEDURES<br />
17.4.1 Preparation<br />
IMMOBILISING ELEPHANTS<br />
17.4.1.1 Briefing<br />
Before an operation starts there should be a meeting<br />
to ensure that everyone is fully briefed. Make clear<br />
what sort of animal is to be darted, the general area<br />
of operations, the time limit, any special<br />
considerations, and the chain of command.<br />
It is essential that everyone is clear about the<br />
procedures to be followed in the even of an<br />
emergency, especially those involving aggressive<br />
elephants and accidental injection of etorphine. At<br />
least one member of the darting team, apart from the<br />
vet, should know how to carry out artificial<br />
resuscitation and intravenous injection of the narcotic<br />
antagonist (preferably Naloxone) and know where<br />
the drugs and needles are kept.<br />
165
IMOBILISING ELEPHANTS<br />
Non-essential participants should be instructed to<br />
follow orders and should only get out of vehicles<br />
after permission is given. <strong>The</strong>y should not go on foot<br />
with the darting team. It should be made clear who<br />
is in charge. It may be necessary to divide<br />
responsibility between vets and biologists, but human<br />
safety should be given priority and one person must<br />
be clearly responsible for taking decisions on this.<br />
17.4.1.2 Radio test<br />
Radios must be operational, and spare batteries<br />
charged overnight. Radio procedures and channels<br />
should be agreed upon. Radios have to be checked<br />
for their ability to be heard from the distance they<br />
will need to be used. If other people are operating on<br />
the same channel, they should be informed that the<br />
operation is taking place and asked to maintain radio<br />
silence. It is essential that radio communication is<br />
available between the aircraft, darting team and backup<br />
team.<br />
17.4.1.3 Check equipment<br />
Go through the check-list; make sure that all the<br />
equipment is in the right place, and that relevant<br />
people know how to operate it. Ensure that there is<br />
sufficient fuel and flying time for the aircraft for any<br />
planned operation. If refuelling is necessary ensure<br />
that fuel, pump and filter are in a suitable location.<br />
<strong>The</strong> gun and darts should be checked thoroughly.<br />
Considerable time and resources can be wasted with<br />
distorted darts, damp cartridges, etc.<br />
If the purpose of the darting exercise is to apply a<br />
radio collar, make sure that the collar is working and<br />
that its frequency does not overlap with other<br />
transmitters in the area. Ensure that you know how<br />
the collar attaches.<br />
17.4.1.4 Load darts<br />
Make sure that there are at least two darts loaded<br />
with the appropriate amount of drug for the target<br />
animal. It may also be useful to carry a top-up dart<br />
with a partial dose. <strong>The</strong> darts should be stored in a<br />
way that prevents accidental discharge. A<br />
combination of pure etorphine (8-15mg for adult<br />
female and 10-18mg for adult males) and<br />
hyaluronidase (3000iu) are recommended. Three ml<br />
darts are ideal and dose volume can be adjusted to<br />
suit if 4.9mg/ml or 9.8mg/mI etorphine solution is<br />
available. Immobilon (etorphine and acepromazine)<br />
can also be used, but the sedative component is<br />
unnecessary. In general, high doses will lead to a more<br />
rapid induction, recumbency (usually lateral) and<br />
166<br />
longer down time (without reversal). Etorphine<br />
produces respiratory depression but there is little<br />
difference whether 10mg or 16mg is administered.<br />
Lower doses have relatively long induction or less<br />
rapid response to the drug, lead more frequently to<br />
sternal recumbency, hyperthermia and muscular stress,<br />
but they allow for better respiration. <strong>The</strong> actual dose<br />
used will vary with the circumstances, i.e., how easy<br />
it would be to reach an animal that moved 2km during<br />
the drug induction period, but in general high doses<br />
are preferable.<br />
17.4.2 Reconnaissance<br />
If operations are to be carried out with a spotter plane,<br />
the spotting team should check the wind direction<br />
before leaving. <strong>The</strong>y should do a reconnaissance flight<br />
to select a suitable group and identify the best starting<br />
point for the darting team, making allowances for a<br />
herd that is moving. If feasible, it is best to land and<br />
discuss this with the darting team. It may be useful to<br />
have a member of the darting team as an observer for<br />
this initial flight.<br />
17.4.3 Approach<br />
<strong>The</strong> darting team should aim to walk in from a distance<br />
of between 200m to 1km, keeping close together and<br />
continually checking the state of the wind. Vehicles<br />
should not come close enough to the elephants to cause<br />
disturbance. At this stage an aircraft should be circling<br />
overhead, giving distance and direction about the target<br />
herd. It should fly high enough and in wide enough<br />
circles not to disturb the animals. As the aircraft passes<br />
behind the elephants in line with the darting team, the<br />
pilot should say “<strong>The</strong> line is now. distance is X metres”.<br />
One member of the darting team should carry a mirror<br />
and flash it towards the aircraft to ensure that the<br />
aircraft team knows where the ground team is.<br />
On the final approach, radio volume should be kept low and<br />
communication between members of the darting team<br />
should, as far as possible, be by hand signals. Alert each<br />
other with neutral sounds (e.g. clicking fingers, soft whistling)<br />
rather than vocally. Keep checking the wind direction. When<br />
in sight of the elephant, the spotting team should only<br />
communicate in case of emergency.<br />
Approaching without an aircraft requires skilled<br />
tracking. It is essential to remain vigilant, particularly<br />
if there is more than one group of elephants in the area.
17.4.4 Selection of animal and darting<br />
a) On foot<br />
It is essential not to rush when the elephants are in<br />
range. If darting females for radio-collaring, it is best<br />
to select ones that do not have young calves or<br />
matriarchs. A calf staying close to its mother may be<br />
crushed when she collapses, and accidental death of<br />
the female will result in an orphan too young to<br />
survive alone. If possible, it is best to select an<br />
elephant with distinguishing features to make the job<br />
of the spotting team easier. It can be surprisingly<br />
difficult to distinguish sexes and to see whether a<br />
cow has a young calf, since in thick bush one can<br />
often only see the backs of the elephants. In very<br />
dense vegetation it is often best to withdraw for a<br />
while and wait until the elephants move into a better<br />
area.<br />
If the elephants start moving towards the darting<br />
team, the team should retire quietly, bearing in mind<br />
that if the elephants cross their tracks they are likely<br />
to become disturbed. <strong>The</strong> chief danger in darting<br />
operations is that an elephant will charge. This<br />
happens most often when a cow has seen the team. If<br />
she only detects human scent the herd will usually<br />
move away; if she sees suspicious movement without<br />
scent she will usually do nothing, but stay at a higher<br />
level of alertness and she may continue to watch in<br />
the direction of the people. When a matriarch alerted<br />
in this way detects human scent, perhaps because of<br />
a change in wind direction, she is likely to charge.<br />
<strong>The</strong> best response to a serious charge by an elephant<br />
is to run away immediately. On most occasions, the<br />
elephant will probably stop after a short run and will<br />
return to the herd, but it is not worth taking any<br />
chances. <strong>The</strong>re is no evidence that running away<br />
provides any additional encouragement to aggression,<br />
as is the case with lions. However, it is most important<br />
to ensure that everyone stays together, and the backup<br />
man knows what is going on. Where the team<br />
consists of two armed and two unarmed people, each<br />
back-up man should watch one of the others. When<br />
running away, go downwind, do not run in a straight<br />
line, and get thick vegetation between you and the<br />
elephant. If you find yourself in imminent danger of<br />
being overtaken by an elephant, it is probably best to<br />
dive into the middle of the nearest patch of thick bush.<br />
If there are large enough trees and the elephant is not<br />
too close, climb one of the trees.<br />
Most charges are bluffs and do not last longer than<br />
50m; provided that one starts at a sufficient distance,<br />
it should be possible to keep away. If the charge goes<br />
IMMOBILISING ELEPHANTS<br />
on longer or the starting distance is too small, a gun<br />
may have to be used. It is fairly safe to use the first<br />
shot as warning. If this fails to stop the elephant or if<br />
he or she is too close, a heavy calibre shot into the<br />
chest or head is usually enough to turn a charging<br />
elephant, if not to kill it. If an elephant is shot but not<br />
killed, it is important to follow up immediately as<br />
soon as the entire team is accounted for, and unarmed<br />
individuals have been escorted to safety.<br />
If everything goes well in the approach and selection<br />
of the target animal, a shot with the dart gun should<br />
be taken at a range of 20-30m. Darting should not be<br />
done less than two hours before dusk because of the<br />
risk of failing to locate an immobilised animal. <strong>The</strong><br />
rifle propellant (cartridge or gas) should be<br />
appropriate for the weight of the dart and the range,<br />
in order to avoid the failure of the dart to penetrate or<br />
discharge. Aim for the haunch or shoulder and ensure<br />
that the animal is as square as possible to the shot<br />
and that there is no vegetation in the way. <strong>The</strong> haunch<br />
is better, since a shot at the shoulder runs the risk of<br />
being intercepted by the ear. If one misses, the animals<br />
will usually run away from the sound and the<br />
operation will have to be started again.<br />
<strong>The</strong>re is normally no problem with the hit animal,<br />
which will tend to run in the direction that it is facing,<br />
so it will usually run at right angles to the darting<br />
team. If the herd comes towards the darting team,<br />
evasive action will have to be taken.<br />
b) From helicopter<br />
It is more difficult to dart from a helicopter because<br />
there are bones close to the top of the rump, and a<br />
dart fired from directly overhead may bounce out or<br />
fail to inject intramuscularly. It is better to shoot<br />
slightly obliquely at the rump or shoulder, though this<br />
means that the aim will have to be compensated for<br />
down draught.<br />
17.4.5 Drug induction period<br />
a) Ground operations<br />
It usually takes between five and fifteen minutes for<br />
an elephant to go down after being darted, although<br />
this depends on the drug combination, dosage and<br />
point of injection (i.e. intravenous or intramuscular).<br />
<strong>The</strong> distance the elephant moves can vary from less<br />
than 100m to more than 2km. <strong>The</strong> important objective<br />
at this stage of the operation is to ensure that both<br />
darting and support teams are close at hand when the<br />
elephant goes down. <strong>The</strong> spotting team plays a key<br />
role in keeping track of the drugged elephant and<br />
167
IMOBILISING ELEPHANTS<br />
guiding the ground teams. Circumstances determine<br />
what should be done. Sometimes the darting team<br />
may follow the elephant directly on foot, or rejoin<br />
the back-up team with the vehicle. Following a darted<br />
elephant on foot without aircraft support is difficult<br />
and dangerous, and requires alertness and good<br />
tracking skills. Because of the risk of confusion, it<br />
may only be possible where there are small numbers<br />
of elephants in an area.<br />
As soon as the elephant is darted, the darting team<br />
should communicate the time of darting and any<br />
distinguishing features of the target elephant.<br />
Sometimes the dart is visible but usually it falls out<br />
soon unless cuffed or barbed needles (which have<br />
considerable disadvantages) are used. <strong>The</strong> spotting<br />
team should bring the back-up team to the closest<br />
position on the road to where they expect the elephant<br />
to drop. Once the target animal shows signs of<br />
drugging and is unlikely to move further, they should<br />
bring the back-up team in on the easiest route.<br />
Constant communications from aircraft to ground<br />
team are necessary to tell them about the situation,<br />
the distance from other elephants and the level of<br />
urgency involved. This will allow the driver to decide<br />
how carefully to treat his vehicle, if one is available<br />
for the back-up team. For example, if the elephant<br />
has collapsed on its sternum, with the resulting risk<br />
of oxygen starvation, it may be necessary to make all<br />
speed to the spot. However, if it is surrounded by its<br />
family, they have to be driven off before people get<br />
too close.<br />
Once the ground team has arrived in place, and the<br />
rest of the elephants are away, the aircraft can land.<br />
However, if the rest of the family is nearby it is<br />
essential for the aircraft to stay overhead until the<br />
end of the operation to inform the team of any change<br />
in the situation. This will be particularly important if<br />
it has not been possible to get the vehicle in close. If<br />
the elephants are around the darted animal, they will<br />
have to be driven away. It may be necessary to fire in<br />
the air.<br />
Sometimes the elephant either fails to fall down or<br />
shows no sign of being drugged. <strong>The</strong> animal should be<br />
watched for 30 minutes and if it is still mobile after this time<br />
lapse, it can be safely left. If it is obviously drugged but has<br />
not fallen over, another partial dose may be administered.<br />
b) Operations with helicopter<br />
If a helicopter is used with an experienced pilot, it<br />
should be possible to get the elephant to drop in a<br />
spot that is easily accessible to the ground crew, by<br />
168<br />
applying gentle pressure in the direction required. It<br />
is important for the helicopter not to come too close,<br />
to avoid causing stress to the animal.<br />
17.4.6 Operations on the ground<br />
17.4.6.1 General<br />
As soon as the ground team arrives, it is essential to<br />
ensure that the immobilised animal is safe. Nonessential<br />
personnel should stay back until the person<br />
in charge has declared the situation safe.<br />
Everyone on the team should know what his<br />
responsibilities are. Ideally, one should have a vet to<br />
keep checking vital signs such as breathing rate, and<br />
another to collect samples, ectoparasites, etc.; one<br />
person should put on the collar, another should take<br />
measurements and another should write down data,<br />
and the back-up man should keep watch for other<br />
elephants.<br />
17.4.6.2 Veterinary<br />
During the time that the elephant is recumbent, the<br />
vet’s primary responsibilities are to ensure that the<br />
elephant is moving air into its lungs adequately by<br />
monitoring the rate and depth of breathing. Once vital<br />
signs have been checked the vet should insert a<br />
syringe with Revivon in an ear vein, in case immediate<br />
reversal is needed. He should remove the dart, unless<br />
it has already fallen out, and treat the injection site<br />
with local antibiotic application. Injection of systemic<br />
antibiotics will prevent abscess formation later. If<br />
possible, both eyes should be covered with eye<br />
ointment to prevent the cornea from drying out, and<br />
in order to reduce vision briefly when the elephant<br />
gets up, and the team is still close. This also may<br />
reduce distress since narcotics are not true<br />
anaesthetics, and the animal probably retains a degree<br />
of sensory perception. Noise should be kept to a<br />
minimum. In hot conditions water should be poured<br />
over the body, especially the ears.<br />
A drugged elephant will usually have fallen over<br />
before the ground team gets to it, but when<br />
approaching a drugged elephant that is in standing<br />
sedation, one must be careful that the elephant does<br />
not fall on top of any of the team, and that people<br />
stay out of reach of the trunk.<br />
Most elephants will fall onto their side (lateral<br />
recumbency), but some may fall on their sternum<br />
(sternal recumbency). If the elephants goes into<br />
sternal recumbency, or falls onto a tree trunk or rock,<br />
the animal should be pulled onto its side or away from<br />
the obstacle without delay. Use a rope around the neck
or over the shoulder and around the base of the<br />
opposite foreleg, or over the neck and around the base<br />
of the opposite tusk. Ensuring that the rear legs are in<br />
a safe position, the animal can be pulled over, using a<br />
vehicle or a large team of people. Respiration in<br />
sternal recumbency will be adequate for up to 15-20<br />
minutes but will become progressively more shallow,<br />
with difficulty in making deep inspiratory<br />
movements, evidenced by open-mouthed breathing.<br />
If it has been possible to get to the elephant as soon<br />
as it has fallen over, and operations on the<br />
immobilised animal can be restricted to less than ten<br />
minutes, turning the animal over may not be<br />
necessary. We have successfully collared three<br />
elephants in sternal recumbency, but did not take<br />
samples or measurements from them.<br />
In lateral recumbency respiration may be as low as<br />
four breaths per minute, but if inspirations are deep<br />
and regular, with good capillary refill time and good<br />
colour of the mucous membranes, low respiration rate<br />
is not a cause for alarm. If respiratory problems do<br />
develop, application of the antidote may be life-saving<br />
for the elephant. It is important to ensure the trunk is<br />
not obstructed, for example by a tusk, leading to<br />
respiratory arrest, hypoxia and death. Two short sticks<br />
placed at the opening of the trunk will maintain open<br />
the air passages.<br />
Body temperature should remain between 35 0 C and<br />
38C, and if it rises to over 40CC wetting the head<br />
and ears is essential. Rapid drug reversal is<br />
recommended in this case. Pulse rate should be<br />
between 40 and 60 per minute. If the rate rises rapidly<br />
or becomes markedly depressed, reversal of the<br />
narcotic should be considered. Easily accessible veins<br />
are on the posterior aspect of the ears and craniomedial<br />
aspects of the forelegs. At least four times the<br />
etorphine dose (i.e., 10mg etorphine reversed with<br />
40mg diprenorphine) is recommended for reversal,<br />
which should occur within 110 to 180 seconds. Less<br />
diprenorphine may cause problems as the halt life of<br />
the antagonist is shorter than the agonist. On occasion,<br />
entero-hepatic recycling can also be a problem.<br />
17.4.6.3 Collaring<br />
<strong>The</strong> radio collar should be put on just behind the ears.<br />
Sometimes it is difficult to get it around the elephant’s<br />
head, so the head may have to be lifted up to provide<br />
room for the collar to go underneath. Usually the<br />
collar will seem tighter when the animal is recumbent<br />
than when it is standing up. Under some<br />
circumstances, folds of skin make the neck seem<br />
IMMOBILISING ELEPHANTS<br />
thicker than it actually is, so the head should be pulled<br />
forwards if possible. If the animal is an adult female,<br />
whose neck will not grow further, the collar should<br />
be moderately close fitting, but still with room for a<br />
fist to go between it and the neck when the animal is<br />
recumbent. For young animals and bulls, the degree<br />
of slack will be dependent on how long the collar is<br />
expected to stay on, but avoid collaring growing<br />
animals because too little slack may cause distress<br />
later, while too much may result in a front leg being<br />
trapped in the collar.<br />
<strong>The</strong> transmitter should be activated and tested before<br />
the antidote is given. Collared animals have been<br />
allowed to recover with inactivated collars around<br />
their necks!<br />
17.4.6.4 Measurements<br />
<strong>The</strong>re is no standard format for taking body<br />
measurements, and it is difficult to get accurate<br />
measurements from a recumbent elephant. However,<br />
we have generally measured shoulder height, back<br />
length, tusk length, tusk basal circumference and hind<br />
foot length.<br />
For details on how to take these measurements see<br />
Chapter 18.<br />
17.4.6.5 Reviving<br />
When the elephant is ready to be revived, everyone<br />
except the vet should get back into the vehicle, or to<br />
a safe distance, and all the equipment should be out<br />
of the way.<br />
Once the vet has injected the reviving dose, he should<br />
get back to a position from which he can safely<br />
observe. <strong>The</strong>re should be a clear escape route for the<br />
vehicle and/or people on foot, ideally downwind and<br />
behind the elephant. It is Important to make certain<br />
that the elephant gets up but one must also keep out<br />
of the way. One of the best ways to wreck a car is to<br />
drive at speed through thick bush while being chased<br />
by an elephant!<br />
<strong>The</strong> transmitter of the radio collar should be re-tested<br />
while the elephant is moving away, since the<br />
frequency of the transmitter may change slightly once<br />
it is on the elephant.<br />
On several occasions, large old bulls have not<br />
responded well to being revived, and on one occasion<br />
an animal had to be raised with the aid of a winch<br />
after more than an hour of recumbency clearly adding<br />
to the trauma of the exercise. It is not clear what is<br />
the reason for this, but extra caution is recommended<br />
with these animals.<br />
169
IMOBILISING ELEPHANTS<br />
Acknowledgements<br />
Thanks are especially due to Dieter Rottcher, who<br />
has been responsible for successfully carrying out<br />
over 180 elephant immobilisations in Kenya, and<br />
Richard Kock, for their assistance in the field and<br />
170<br />
contributions to earlier versions of this chapter, and<br />
to Ian Whyte and Mohamed Sheriff, for advice and<br />
comments.<br />
References<br />
BOTHMA, J.D.P. (1989) Game Ranch Management. J. L. van Schaik, Pretoria.
18.1 INTRODUCTION<br />
A wealth of information can be collected from dead<br />
elephants. <strong>The</strong> data one is able to collect depend on the<br />
state of the dead elephant(s) and the circumstances of<br />
its/their death. <strong>The</strong> data fall into three basic categories:<br />
i) Data from carcasses found where no fresh<br />
material is obtainable (poached animals or<br />
those having died of natural causes).<br />
ii) Data from a single or a few animals killed<br />
where fresh material is obtainable (animals<br />
shot non-randomly for hunting, crop<br />
protection or other such purposes).<br />
iii) Data from randomly culled elephants<br />
where many animals are shot<br />
simultaneously 1 .<br />
When carcasses are found with no fresh material on<br />
them (category (i)), the data which can be gathered are<br />
very limited. Usually only sex, age, and if they are still<br />
on the carcass, an estimate of the weight of the tusks<br />
can be recorded (see Chapter 14).<br />
From category (ii) of dead elephants, more useful data<br />
can be recorded, but this still on a limited scale. Sex,<br />
age and reproductive status can be determined but these<br />
data can give no indication of the prevailing state of<br />
the dynamics of the parent population, unless such<br />
carcasses are regularly available and are of both sexes.<br />
On the other hand, data which can be gathered from<br />
category (iii) are very useful for the study of the<br />
dynamics of the culled sample’s parent population<br />
(population growth rate, inter-calving period, age<br />
CHAPTER 18<br />
COLLECTING DATA FROM DEAD ELEPHANTS<br />
I.J. Whyte<br />
National Parks Board<br />
Kruger National Park<br />
Private Bag X402<br />
Skukuza 1350, South Africa<br />
structure, etc.), as well as life-history data which may<br />
differ spatially and/or temporally (breeding and calving<br />
seasons, age at puberty, growth rates, etc.). <strong><strong>Elephant</strong>s</strong><br />
can be culled either randomly or non-randomly. In nonrandom<br />
culling, specific age and/or sex categories are<br />
removed from the population. This type of culling is<br />
rare and the data fall more into category (ii), and are of<br />
little use in providing information on the state of the<br />
elephant population. <strong>The</strong> second type of culling removes<br />
a random sample from the parent population and the<br />
data thus gathered are representative of the population<br />
to a lesser or greater degree, depending on the size of<br />
the Sample (culling is “random” when all animals in<br />
each group are culled regardless of age or sex).<br />
Obviously, a small sample is of less value, and the<br />
greater the proportion of the parent population that is<br />
sampled, the more representative of the parent<br />
population the results will be.<br />
This chapter, therefore, concentrates on this third<br />
category as the discussion of the data which can be<br />
collected are of relevance to the other two categories as<br />
well. Excellent examples of the type of information that<br />
can be gained from unsophisticated data from a sample<br />
of randomly culled elephants were conducted by Ranks<br />
(1972), Sherry (1975) and Smuts (1975). Caughley<br />
(1977) has written an extremely useful and<br />
understandable book on the dynamics of populations,<br />
which goes into far more detail than can be given here.<br />
This chapter assumes knowledge of elephant physiology<br />
and some basic veterinary skills. If you do not have the<br />
knowledge or skills yourself, you are advised to seek<br />
the assistance of someone who does when you collect<br />
data from dead elephants.<br />
1 Strictly speaking, the term “culling” implies the removal of selected animals from a herd or population. “Culling” has been used<br />
here as a generic term implying the removal of a pre-determined proportion of the population by shooting, as this has become the<br />
term used and accepted in southern Africa.<br />
171
DATA FROM DEAD ELEPHANTS<br />
18.2 DATA WHICH SHOULD BE<br />
COLLECTED<br />
18.2.1 Age of culled animals<br />
<strong>The</strong> determination of the age of each culled animal is<br />
fundamental to the study of the dynamics of a<br />
population. All aspects of a population dynamics<br />
study are relatable to age of individuals whether they<br />
be growth, age at puberty or age structure of the<br />
population.<br />
Age of culled elephants is usually determined by the<br />
method of Laws (1966), revised by Jachmann (1988)<br />
which involves the examination of the molars in the<br />
mandible or lower jaw (see Chapter 7 - Box 7.1). As<br />
the molars are not easily visible while still in situ it is<br />
useful to wire a numbered metal tag securely to the<br />
jaw before the carcass is dismembered. (Attached to<br />
Fig. 18.1: Age frequency distribution of hypothetical elephant population.<br />
172<br />
this metal tag should be a cardboard tag bearing the<br />
same number which can be stuck onto the wet surface<br />
of the uterus or testes when excised. This prevents<br />
subsequent confusion over which body parts belong<br />
to which animal). Age can be easily determined once<br />
the jaws have been excised. Preferably they should<br />
be stored (where scavengers cannot get access) and<br />
the ages of all the culled animals determined at the<br />
same time. This allows the worker to “get the feel”<br />
of the technique and thereby less errors will be made.<br />
Also, specific jaws can be re-examined should any<br />
possible anomalies arise.<br />
18.2.2 Age class frequencies<br />
Once the ages of all the culled animals have been<br />
determined, an idea of the age structure of the<br />
population can be gained by lumping the respective<br />
age classes and constructing a histogram of these
according to their. respective proportions in the sample<br />
(Fig. 18.1). In a healthy population the age classes with<br />
the highest proportions will be the younger ones while<br />
there will be a steady decline in the proportions towards<br />
the older classes. Occasionally, one age class will be<br />
proportionately larger than those of the younger ones<br />
succeeding it. This may be due either to sample bias<br />
or be the result of a particularly good conception rate<br />
from the previous two years. As the gestation time for<br />
elephants is 22 months, they obviously cannot breed<br />
every year and after a period of protracted drought,<br />
the calf percentage of a particular year may suddenly<br />
be far higher than that of previous years.<br />
Should the younger age-classes be consistently smaller<br />
than the older ones, there is the possibility of a problem<br />
with breeding and/or calf survival, and a strong<br />
likelihood that something is amiss in the elephants’<br />
habitat. Laws (1969) noted variations in annual<br />
recruitment among different elephant populations and<br />
suggested that they were related to variations in rainfall<br />
and therefore also to variations in habitat quality.<br />
18.2.3 Sex ratio<br />
<strong><strong>Elephant</strong>s</strong> are born at a sex ratio of approximately one<br />
male to one female. Young males leave their maternal<br />
groups soon after puberty and this is reflected in the<br />
sex ratios of the various age classes. <strong>The</strong> younger<br />
classes should have sex ratios of around 1:1 but from<br />
about 12 years on there is a bias towards females in<br />
the breeding herds. Age at puberty is dependent upon<br />
the attainment of a critical body mass, and elephants<br />
will achieve sexual maturity at older ages in habitats<br />
in poor condition. <strong>The</strong> age at which young males leave<br />
the herds can thus give an indication of the condition<br />
of the habitat for elephants. <strong>The</strong> relative proportions<br />
of animals culled will provide one with information<br />
on the sex ratio of the population.<br />
18.2.4 Age at puberty<br />
a) Males<br />
In males, puberty is regarded to have occurred once<br />
sperm production begins. From culled males, the age<br />
at which this begins can be determined in two ways:<br />
i) Sperm smears<br />
In contrast to most other mammal males, elephants’<br />
testes are carried intra-abdominally near the kidneys.<br />
<strong>The</strong>re is no epididymis but there is a Wolffian duct<br />
present. This should be excised with the testes once<br />
DATA FROM DEAD ELEPHANTS<br />
the animal has been’eviscerated. By cutting through this<br />
Wolffian duct using a sharp blade, a milky white fluid<br />
can be expressed, and by picking up a drop of this fluid<br />
on the edge of a microscope slide glass and then making<br />
a thick smear on another, the presence or absence of<br />
spermatozoa can be determined under a microscope<br />
after the smear has been stained. This can be done as<br />
follows:<br />
1. Air dry the smear after it has been made (it<br />
can be stored for a week or more before<br />
fixing).<br />
2. Fix in methanol (MeOH) for 5 minutes.<br />
3. Pour off MeOH and stain in 5-6% Giemsa<br />
(preheated to 60 0 C) for one hour at 60 0 C.<br />
4. Pour off Giemsa and in tap water.<br />
5. Allow to dry.<br />
It must be said that it is not easy to cut the Wolffian<br />
duct at the right place and some experience is necessary.<br />
Fluid in the ducts of younger animals (if obtainable at<br />
all) may be clear, not milky.<br />
ii) Histological specimens<br />
A small specimen of approximately 10mm X 10mm X<br />
10mm should be cut from the inside of the testis,<br />
avoiding the larger tubes. This should be preserved in<br />
Bouin’s Fluid for 48 hours and then transferred into<br />
70% ethyl alcohol. <strong>The</strong> sample can later be cut for<br />
histological examination for the presence or absence of<br />
spermatozoa in the seminiferous tubules.<br />
This is a far more sophisticated method which requires<br />
specialised laboratory equipment for the preparation of<br />
the histological specimens, and should only be<br />
attempted when the necessary laboratory facilities are<br />
available.<br />
Mean age at puberty can then be determined from the<br />
proportion of animals that have achieved puberty in each<br />
pubertal age class.<br />
b) Females<br />
<strong>The</strong> uterus of the female elephant is also situated in the<br />
abdomen, the ovaries being located near the kidneys.<br />
<strong>The</strong> ovaries and uterus should be excised intact once<br />
the animal has been eviscerated. Ovaries can be<br />
examined macroscopically. Immature females’ ovaries<br />
contain small (
DATA FROM DEAD ELEPHANTS<br />
as large as a golf ball. <strong>The</strong> CL produces hormones<br />
which are important in the maintenance of<br />
pregnancy and is yellow in colour when dissected.<br />
A CA is a CL which is degenerating after the birth of<br />
a calf and is dark brown in colour.<br />
A pubertal female will have no CLs or CAs but will<br />
have at least one follicle greater than 5mm.<br />
Mean age at puberty can also be determined from the<br />
proportion of animals that have achieved puberty in<br />
each pubertal age class.<br />
18.2.5 Pregnant adult females<br />
<strong>The</strong> data that can be collected from adult females are<br />
the most important with respect to understanding the<br />
dynamics of the parent population. Nearly all this<br />
information comes from the uterus, which should be<br />
excised intact. A pregnant uterus is fairly obvious<br />
except in the early stages of pregnancy In most<br />
mammals, the presence of a CL is indicative of<br />
pregnancy as it develops at the ovulation point and<br />
its function is to maintain the pregnancy. <strong><strong>Elephant</strong>s</strong>,<br />
however, may have several oestrus cycles which may<br />
not necessarily result in pregnancy. Each one has an<br />
ovulation point and subsequent CL. <strong>Elephant</strong> ovaries<br />
may therefore have several CLs present which have<br />
not yet resulted in a pregnancy. Each uterus must<br />
therefore be opened using a sharp knife to make sure<br />
that there is no small foetus in the early stages of<br />
development. Both of the uterine horns should be<br />
opened even if a small foetus is found in the first, as<br />
twins have been (rarely) recorded.<br />
Once the uterus has been excised, it should be cut<br />
transversely just above the cervix. This exposes the<br />
two horns of the uterus, and a sharp knife can then be<br />
inserted into the opening (lumen) so made and each<br />
horn can be cut open right up to the top. Any evidence<br />
of pregnancy is soon revealed-clear watery fluid and<br />
filamentous white membranes. If these are the only<br />
evidence of pregnancy, the foetus will be too small<br />
for the sex to be determined or to weigh.<br />
i) Foetal sex ratio<br />
From an early stage in the development of an<br />
elephant foetus, the sex can be determined. In a large<br />
enough sample, the ratio between foetal males and<br />
females can be determined. Any significant<br />
deviation from a 1:1 ratio may be indicative of<br />
habitat quality. This has not yet been demonstrated<br />
for elephants but has been for other species such as<br />
Red deer (Clutton-Brock et al. 1982) and buffalo<br />
174<br />
(Whyte in prep.) when females in poor condition<br />
are more likely to conceive a female foetus.<br />
ii) Foetal age<br />
Foetal age can be calculated for any mammal<br />
species according to the method of Huggett &<br />
Widdas (1951). <strong>The</strong>ir formula was revised for<br />
elephants by Craig (1984) and is the one more<br />
widely accepted today:<br />
age = 3√ mass 0.0945) + 138<br />
(<strong>The</strong> formula gives age in days when foetal mass in<br />
grams is used).<br />
A limitation of the method is that Craig estimates<br />
that an elephant foetus is 138 days old before it is<br />
large enough to be “weighable”. This means that<br />
there is a four-month period between conception<br />
and weighable size, which cannot be covered by<br />
the equation.<br />
iii) Conception and birth dates<br />
From the equation above, the foetal age (in days)<br />
on the date of collection can be calculated, and the<br />
conception date can therefore be determined by<br />
counting back from the date of collection.<br />
<strong>The</strong> expected birth date can also be estimated by<br />
adding the gestation time (22 months or 660 days)<br />
to the conception date. Such calculations are time<br />
consuming and prone to error unless a computer<br />
with date arithmetic is available, but a simple device<br />
to assist with such calculations was developed by<br />
Whyte (1986).<br />
By lumping the data for respective months, a<br />
histogram can be drawn showing the breeding and<br />
calving peaks for the population under study Fig. 18.2<br />
shows the conceptions for a hypothetical elephant<br />
population showing a peak in the summer months.<br />
iv) Inter-calving period<br />
<strong>The</strong> inter-calving period (i.e., the mean period between<br />
calves for adult females in the sample) can be calculated<br />
in two ways. <strong>The</strong> first is to make an estimate from the<br />
number of placental scars, which will be covered in the<br />
next section (non≠pregnant females). <strong>The</strong> other is to<br />
calculate the mean duration of anoestrus (DA) as follows<br />
(Hanks 1972):<br />
DA = gestation time x (number not pregnant)<br />
number pregnant<br />
Data from the Kruger National Park (Smuts 1975) gave<br />
an estimate of:
Fig 18.2: Distribution of mating activity in a hypothetical elephant population.<br />
DA = 22 x 430 = 32.4 months<br />
292<br />
<strong>The</strong> inter-calving period (ICP) is then calculated<br />
from this by simply adding the gestation time.<br />
ICP = 32.4 + 22 = 54.4 months.<br />
This is a measure of the inter-calving period<br />
prevailing at the time that the culling took place as it<br />
is based on the proportion of females currently<br />
pregnant and non-pregnant respectively. This can<br />
vary within a population temporally (from year to<br />
year).<br />
18.2.6 Non-pregnant adult females<br />
<strong>The</strong> other method of estimating the ICP, involving<br />
the counting of placental scars, is an estimate of the<br />
long-term performance of the population as it<br />
includes all the calves which have been born to all<br />
the adult females in the sample over their whole lives.<br />
DATA FROM DEAD ELEPHANTS<br />
This may show only minor differences from year to<br />
year depending mainly on the sample but<br />
comparisons with similar data from populations in<br />
other habitats may indicate clear differences.<br />
<strong><strong>Elephant</strong>s</strong> have what is known as a zonary placenta.<br />
This means that the placenta is connected to the uterus<br />
at only one place or “zone”. <strong>The</strong> connection is<br />
circular”- like a collar around the inside of one of<br />
the horns of the uterus. At birth the placenta tears<br />
away from the uterine wall in a traumatic process<br />
which leaves a clear scar once it has healed. When<br />
the lumen of the excised uterus has been opened,<br />
these scars lie horizontal to the direction of the cut<br />
made. <strong>The</strong>y form shallow “troughs” across the uterus<br />
which, when fresh, can be clearly seen. <strong>The</strong>y tend to<br />
fade with age but careful inspection can reveal them<br />
all. This is best done by placing the opened uterus<br />
on a flat surface and, while pressing down fairly hard,<br />
sliding the fingers slowly up and down the exposed<br />
length of the uterine horn. <strong>The</strong> troughs made by the<br />
scars can thus be felt. <strong>The</strong> placentas of successive<br />
175
DATA FROM DEAD ELEPHANTS<br />
pregnancies do not connect to the uterine wall in the<br />
same place and therefore these scars can be counted<br />
to determine the number of calves a female elephant<br />
may have had during her life.<br />
Scars cannot be counted when the female is pregnant<br />
as they are not visible, and there are also two other<br />
conditions of the uterus which may be encountered<br />
which make the counting of scars difficult. <strong>The</strong> first<br />
is when the endometrium (the inside surface of the<br />
uterine wall) becomes “haemorrhagic” (bloody and<br />
jelly-like). <strong>The</strong> second is when the uterine lumen<br />
becomes “occluded” or blocked. <strong>The</strong> lumen contracts<br />
very tightly, and it is extremely difficult even to get a<br />
knife into the lumen to open it up. <strong>The</strong> endometrium<br />
takes on a whitish jelly-like texture. <strong>The</strong> scars are<br />
almost invisible when the uterus is in either of these<br />
conditions, but by feeling for them with care, using<br />
the method described above, they can usually still be<br />
counted. <strong>The</strong>se two conditions are clearly part of the<br />
oestrus cycle but their significance or function has<br />
not yet been described.<br />
<strong>The</strong> number of scars counted for each female can be<br />
plotted against her age as in Fig. 18.3. A least squares<br />
regression line can then be fitted mathematically to the<br />
data and the slope of the line gives the inter-calving<br />
period. That is, the interval equivalent to one scar on<br />
Fig 18.3: <strong>The</strong> relationship between the number of placental scars and age in adult elephant cows.<br />
176<br />
the vertical axis indicates the calving interval on the<br />
horizontal axis. <strong>The</strong> data in the figure are for a<br />
hypothetical population, used only to show the method.<br />
18.2.7 Lactation<br />
It is reasonable to assume that every lactating female<br />
has a calf that is still suckling from her. If this is so,<br />
then there must be the same number of suckling calves<br />
as lactating females. It is also reasonable to assume<br />
that the suckling calves will be from the youngest<br />
age classes. An estimate of mean age at weaning can<br />
thus be obtained.<br />
In a sample of culled elephants examined by the<br />
author between 1989 and 1992, there were 344<br />
lactating females which means there should also have<br />
been the equivalent number (344) of suckling calves.<br />
<strong>The</strong> sample also included 88 calves of less than one<br />
year old (nought-year olds), 88 one-year-olds. 84 twoyear-olds<br />
and 90 three-year-olds. This means that all<br />
of the nought, one- and two-year-olds would still have<br />
been suckling. <strong>The</strong> remainder of the 344 would have<br />
come from the three-year-olds (84 of the 90 in the<br />
sample). <strong>The</strong>refore the mean age at weaning under<br />
the conditions prevailing during the sampling period<br />
can be estimated as:
2 + (84+90) = 2.93 years.<br />
18.2.8 Measuring dead elephants<br />
a) Shoulder height<br />
Many of the measurements that can be taken from an<br />
animal are prone to variation and therefore error, but<br />
a technique for measuring shoulder height can be<br />
standardised. <strong>The</strong> freshly dead elephant is rolled onto<br />
its side before rigor mortis sets in. <strong>The</strong> two front legs<br />
are then straightened and the top front leg is placed<br />
on top of the bottom one. As this is done, the top leg<br />
“locks” itself in this straight position and two stakes<br />
can then be driven vertically into the ground- one<br />
touching the top of the scapulars (shoulder blades)<br />
and the other touching the soles of the feet and an<br />
accurate, standardised measurement can then be taken<br />
between the stakes.<br />
From these data, growth curves can be calculated<br />
(Tomlinson & Abramson, 1961) but these complicated<br />
mathematical procedures will not receive further<br />
attention here.<br />
b) Back length<br />
<strong>The</strong> elephant should be measured from directly behind<br />
the ears to the start of the tail.<br />
c) Tusk length<br />
Tusks should be measured from the point where the<br />
tusk emerges from the skin along the tusk to the tip<br />
References<br />
CAIJGHLEY. GJ. (1977) <strong>The</strong> Analysis of Vertebrate Populations. John Wiley<br />
& Sons, London.<br />
CLUTTON-BROCK, T.H. GUINNESS, F.E. & ALBON, S.D. (1982) Red Deer:<br />
Behaviour and Ecology of Two Sexes. Edinburgh University Press, Edinburgh.<br />
CRAIG, G.C. (1984) Foetal mass and date of conception in <strong>African</strong> elephants.<br />
A revised formula. South <strong>African</strong> Journal of Science 80, 512-516.<br />
GEORGIADIS, N.. BISCHOF, L., TEMPLETON, A., PATTON, J., KARESH,<br />
W. & WESTERN, D. (1994). Structure and history of <strong>African</strong> <strong>Elephant</strong><br />
Populations. I: Eastern and Southern Africa. Journal of Heredity 85, 100-104.<br />
HANKS, J. (1972) Reproduction of elephant (Loxodonta africana) in the<br />
Luangwa valley, Zambia. Journal of Reproduction and Fertility 30, 13-26.<br />
HUGGET, A. St G. & WIDDAS, W.F. (1951) <strong>The</strong> relationship between<br />
mammalian foetal weight and conception age, Journal of Physiology 114, 306-<br />
317,<br />
JACHMANN, H. (1988) Estimating age in <strong>African</strong> elephants: a revision of<br />
Laws’ molar evaluation technique.’<strong>African</strong> Journal of Ecology 26, 51.56.<br />
of the tusk; both left and right tusks should be<br />
measured.<br />
d) Tusk circumference<br />
This should be measured around the point where the<br />
tusk emerges from the skin; both left and right tusks<br />
should be measured.<br />
18.3 OTHER INFORMATION<br />
In circumstances where the dead elephant falls into<br />
categories (i) or (ii) (see Section 18.1), that is, the<br />
elephant was not culled, additional information can<br />
be collected about the circumstances of the elephant’s<br />
death, to develop a database on elephant mortality in<br />
an area. One could note down the date and time of<br />
finding the carcass. Location, habitat type and the<br />
cause of death including whether or not the elephant<br />
was poached, should also be recorded, along with any<br />
other observations concerning the elephant that may<br />
interest you.<br />
Acknowledgements<br />
DATA FROM DEAD ELEPHANTS<br />
Thanks are due to Mrs Colleen Wood for useful<br />
comments on the manuscript. I am grateful to both<br />
her and Mr Obert Mathebula for meticulous collection<br />
of data in the field.<br />
LAWS, R.M. (l966) Age criteria for the <strong>African</strong> elephant Loxodonta a. africana.<br />
East <strong>African</strong> Wildlife Journal 4,1-37.<br />
LAWS, R.M. (1969) Aspects of reproduction in<br />
the <strong>African</strong> elephant, Laxodonta africana, Journal of Reproduction and Fertility,<br />
Supplement 6, 193-217.<br />
SHERRY, B.Y. (1975) Reproduction of elephant in Gonarezhou, south-eastern<br />
Rhodesia. Arnoldia 29, 1-13.<br />
SMUTS. G.L. (1975) Reproduction and population characteristics of elephants<br />
in the Kruger National Park, Journal of the Southern <strong>African</strong> Wildlife<br />
Management Association 5, 1-10,<br />
TOMLINSON, P.K, & ABRAMSON, N.J. (1961) Fitting a von Bertalanffy<br />
growth curve by least squares.<br />
Fishery Bulletin of California Fish Game<br />
116, 1.69.<br />
WHYTE, I.J. (1986) A device to determine mammalian foetal conception and<br />
birth dates. South <strong>African</strong> Journal for Wildlife Research 16(4), 156-158,<br />
177
DATA FROM DEAD ELEPHANTS<br />
178<br />
BOX 18.1: APPLICATION OF EVOLUTIONARY GENETICS TO ELEPHANT<br />
CONSERVATION USING TISSUE SAMPLES<br />
<strong>The</strong> long-term goal of elephant conservation is not just to conserve individual elephants, or local populations,<br />
but also to sustain and exploit natural processes that have been operating at regional or continental levels<br />
over evolutionary time. Within this long-term context, the questions invariably arise: What were those<br />
natural processes? And when are issues of historical continuity important in elephant conservation? For<br />
example, we will increasingly have the option of restoring populations that have gone extinct locally,<br />
sometimes by pooling individuals from distant locations. Current conservation policies implicitly assume<br />
that all elephant populations are phylogenetically equivalent, but recent studies have shown that this is far<br />
from true. For example, although they hybridise, forest and savanna elephants are not only genetically<br />
distinct, they are genealogically different as well. Powerful evolutionary forces, not yet identified, appear<br />
to be limiting gene flow between forest and savanna elephants.<br />
Recent advances in genetics now permit us to address these issues explicitly, to discover exactly what we<br />
are conserving in an evolutionary context. <strong>The</strong>se methods require samples of DNA from elephants in<br />
precisely known locations. DNA exists in all nucleated cells of all individuals, and thus any tissue (e.g.<br />
skin, blood, muscle) is suitable for DNA analysis. However, for genetic studies at the population level,<br />
samples from more than one individual are required from a given location, and more than thirty samples<br />
from unrelated individuals are ideal. I have collected over 400 samples from elephants in eastern, southern<br />
and western Africa, primarily using a ‘biopsy dart’ (Georgiadis et al. 1994). This is simply a tranquilising<br />
dart modified to bounce out of the target with a small skin biopsy, without tranquilising or harming the<br />
donor elephant. While this is a simple and very efficient device that provides fresh samples, it is also<br />
relatively expensive. Genetic analysis can be done not only on fresh tissue samples, but also on samples<br />
that have been dried, salted or preserved in alcohol. Many researchers who work with elephants in the<br />
field are interested to know the genetic identity and distinctness of the elephants in their study area, and<br />
are in a position to accumulate tissue samples from elephants on an opportunistic basis which will enable<br />
them to do this.<br />
If you are interested in collecting tissue samples and would like to have them analysed you can contact<br />
Nicholas Georgiadis at the address below for details on how to collect the samples and transport them to<br />
a laboratory where genetic analysis is carried out.<br />
Nicholas Georgiadis, Mpala Ranch, P.O. Box 92, Nanyuki, Kenya.
A F R I C A N<br />
W I L D L I F E<br />
F OUNDATION