Two-Lung and One-Lung Ventilation in Patients - Anesthesia ...
Two-Lung and One-Lung Ventilation in Patients - Anesthesia ...
Two-Lung and One-Lung Ventilation in Patients - Anesthesia ...

You also want an ePaper? Increase the reach of your titles
YUMPU automatically turns print PDFs into web optimized ePapers that Google loves.
<strong>Two</strong>-<strong>Lung</strong> <strong>and</strong> <strong>One</strong>-<strong>Lung</strong> <strong>Ventilation</strong> <strong>in</strong> <strong>Patients</strong> with<br />
Chronic Obstructive Pulmonary Disease: The Effects of<br />
Position <strong>and</strong> FIO 2<br />
Gizella I. Bardoczky, MD, PhD, DABA*, Laszlo L. Szegedi, MD*, Ala<strong>in</strong> A. d’Holl<strong>and</strong>er, MD, PhD*,<br />
Jean-Marie Moures, MD*, Philippe de Francquen, MD†, <strong>and</strong><br />
Jean-Claude Yernault, MD, PhD, FFCP‡<br />
Departments of *Anesthesiology, †Thoracic Surgery, <strong>and</strong> ‡Chest Medic<strong>in</strong>e, Erasme University Hospital, Free University of<br />
Brussels, Brussels, Belgium<br />
We compared the effects of position <strong>and</strong> fraction of <strong>in</strong>spired<br />
oxygen (Fio 2) on oxygenation dur<strong>in</strong>g thoracic<br />
surgery <strong>in</strong> 24 consent<strong>in</strong>g patients r<strong>and</strong>omly assigned to<br />
receive an Fio 2 of 0.4 (eight patients, Group 0.4), 0.6<br />
(eight patients, Group 0.6), or 1.0 (eight patients, Group<br />
1.0) dur<strong>in</strong>g the periods of two-lung (TLV) <strong>and</strong> one-lung<br />
ventilation (OLV) <strong>in</strong> the sup<strong>in</strong>e <strong>and</strong> lateral positions.<br />
TLV <strong>and</strong> OLV were ma<strong>in</strong>ta<strong>in</strong>ed while the patients were<br />
first <strong>in</strong> the sup<strong>in</strong>e <strong>and</strong> then <strong>in</strong> the lateral position for<br />
15 m<strong>in</strong> each. Thereafter, respiratory mechanical data<br />
were obta<strong>in</strong>ed, <strong>and</strong> arterial blood gas samples were<br />
drawn. Pao 2 decreased dur<strong>in</strong>g OLV compared with<br />
TLV <strong>in</strong> both the sup<strong>in</strong>e <strong>and</strong> lateral positions. In all three<br />
groups, Pao 2 was significantly higher dur<strong>in</strong>g OLV <strong>in</strong><br />
the lateral than <strong>in</strong> the sup<strong>in</strong>e position: 101 (72–201) vs 63<br />
(57–144) mm Hg <strong>in</strong> Group 0.4; 268 (162–311) vs 155<br />
(114–235) mm Hg <strong>in</strong> Group 0.6; <strong>and</strong> 486 (288–563) vs<br />
As a result of the latest technical developments<br />
<strong>in</strong> cardiothoracic surgery, a variety of thoracic<br />
procedures are performed with patients <strong>in</strong><br />
the sup<strong>in</strong>e <strong>in</strong>stead of the traditional lateral position.<br />
Double-lung transplantation (1), lung volume reduction<br />
surgery (2,3), <strong>and</strong> m<strong>in</strong>imally <strong>in</strong>vasive coronary artery<br />
surgery (4) are rout<strong>in</strong>ely performed with patients <strong>in</strong> the<br />
sup<strong>in</strong>e position. Median sternotomy has even been recommended<br />
for pulmonary resection (5). Dur<strong>in</strong>g these<br />
<strong>in</strong>terventions, one-lung ventilation (OLV) is <strong>in</strong>herently<br />
required, generally <strong>in</strong>duc<strong>in</strong>g some degree of hypoxemia.<br />
The major protective mechanism aga<strong>in</strong>st hypoxemia is<br />
hypoxic pulmonary vasoconstriction (HPV) (6), but <strong>in</strong><br />
The authors wish to dedicate this article to the memory of our<br />
colleague, Dr. Gizella Bardoczky, who passed away <strong>in</strong> July, 1998.<br />
Accepted for publication September 8, 1999.<br />
Address correspondence <strong>and</strong> repr<strong>in</strong>t requests to Laszlo L.<br />
Szegedi, MD, Department of Anesthesiology, Erasme University<br />
Hospital, Free University of Brussels, 808, route de Lennik, 1070<br />
Brussels, Belgium.<br />
301 (216–422) mm Hg <strong>in</strong> Group 1.0, respectively (P <br />
0.02, Wilcoxon’s signed rank test). We conclude that,<br />
compared with the sup<strong>in</strong>e position, gravity augments<br />
the redistribution of perfusion as a result of hypoxic<br />
pulmonary vasoconstriction, when patients are <strong>in</strong> the<br />
lateral position, which expla<strong>in</strong>s the higher Pao 2 dur<strong>in</strong>g<br />
OLV. Implications: This study compares oxygenation<br />
dur<strong>in</strong>g thoracic surgery dur<strong>in</strong>g periods of two-lung<br />
<strong>and</strong> one-lung ventilation with patients <strong>in</strong> the sup<strong>in</strong>e<br />
<strong>and</strong> lateral positions when us<strong>in</strong>g three different fraction<br />
of <strong>in</strong>spired oxygen values. Arterial oxygen tension was<br />
decreased <strong>in</strong> all three groups dur<strong>in</strong>g one-lung ventilation<br />
<strong>in</strong> comparison with the two-lung ventilation values,<br />
but the decrease was significantly less <strong>in</strong> the lateral,<br />
compared with the sup<strong>in</strong>e position.<br />
(Anesth Analg 2000;90:35–41)<br />
the lateral position, gravity-<strong>in</strong>duced blood flow redistribution<br />
must also be considered (7,8). Data compar<strong>in</strong>g<br />
gas exchange <strong>in</strong> the sup<strong>in</strong>e versus lateral position dur<strong>in</strong>g<br />
OLV are lack<strong>in</strong>g (9). The aims of our study were to<br />
analyze the role of the position (sup<strong>in</strong>e versus lateral)<br />
<strong>and</strong> the effect of varied fraction of <strong>in</strong>spired oxygen (Fio 2)<br />
values dur<strong>in</strong>g OLV of patients with coronary obstructive<br />
pulmonary disease (COPD) who are scheduled for lung<br />
surgery.<br />
Methods<br />
After approval from the ethics committee of the hospital,<br />
<strong>in</strong>formed consent was obta<strong>in</strong>ed from 24 consecutive<br />
patients scheduled for elective thoracic surgery.<br />
All subjects were studied <strong>in</strong> the sup<strong>in</strong>e <strong>and</strong> lateral<br />
positions both dur<strong>in</strong>g two-lung ventilation (TLV) <strong>and</strong><br />
OLV, before surgery. <strong>Patients</strong> were r<strong>and</strong>omly assigned<br />
to receive Fio 2 of 0.4 (Group 0.4 eight patients),<br />
0.6 (Group 0.6 eight patients), or 1.0 (Group<br />
©2000 by the International <strong>Anesthesia</strong> Research Society<br />
0003-2999/00 Anesth Analg 2000;90:35–41 35
36 CARDIOVASCULAR ANESTHESIA BARDOCZKY ET AL. ANESTH ANALG<br />
POSITION AND Fio 2 DURING OLV 2000;90:35–41<br />
1.0 eight patients) throughout the study. The patients<br />
had mild pulmonary hyper<strong>in</strong>flation (functional<br />
residual capacity 120%). All patients were premedicated<br />
with midazolam 3 to 5 mg IM, approximately<br />
30 m<strong>in</strong> before the <strong>in</strong>duction of anesthesia. In the operat<strong>in</strong>g<br />
room, all patients had an epidural catheter<br />
<strong>in</strong>serted around the T7 level, <strong>and</strong> after the adm<strong>in</strong>istration<br />
of a test dose, an epidural anesthesia was started<br />
with 8 mL of 2% lidoca<strong>in</strong>e with 100 g fentanyl <strong>and</strong><br />
was ma<strong>in</strong>ta<strong>in</strong>ed with a cont<strong>in</strong>uous <strong>in</strong>fusion of epidural<br />
bupivaca<strong>in</strong>e 0.5% (2–5 mL/h). The patients<br />
were anesthetized with a variable-rate (3–6 mg <br />
kg 1 m<strong>in</strong> 1 ) cont<strong>in</strong>uous <strong>in</strong>fusion of propofol <strong>and</strong> <strong>in</strong>haled<br />
isoflurane (0.4%–0.6%) <strong>in</strong> 40% or 60% oxygen <strong>in</strong><br />
air or pure oxygen. Muscle relaxation was achieved<br />
with pancuronium. In all patients, the bronchus of the<br />
dependent lung was <strong>in</strong>tubated with a double-lumen<br />
endotracheal tube (DLT) (Broncho-cath tm ; Mall<strong>in</strong>ckrodt<br />
Laboratories, Athlone, Irel<strong>and</strong>) of an appropriate<br />
size determ<strong>in</strong>ed by the height of the patient (10). The<br />
correct position of the DLT was determ<strong>in</strong>ed with fiberoptic<br />
bronchoscopy <strong>in</strong> both the sup<strong>in</strong>e <strong>and</strong> the<br />
lateral positions.<br />
The electrocardiogram, heart rate, systemic arterial<br />
blood pressure, non<strong>in</strong>vasive arterial oxygen saturation,<br />
<strong>and</strong> end-tidal CO 2 were cont<strong>in</strong>uously monitored.<br />
Constant tidal volume of 10 mL/kg was delivered<br />
with a Siemens 900C ventilator (Siemens ® Elema tm ,<br />
Solna, Sweden) throughout the study. The ventilatory<br />
pattern consisted of a volume-controlled, square-wave<br />
flow pattern, at a rate of 10 breaths/m<strong>in</strong>. Inspiratory<br />
time (T I/T TOT) was 0.33 <strong>and</strong> end-<strong>in</strong>spiratory pause<br />
was 10% of the total respiratory cycle. All measurements<br />
were performed with zero applied endexpiratory<br />
pressure. Ventilatory variables were kept<br />
constant dur<strong>in</strong>g the study, both dur<strong>in</strong>g TLV <strong>and</strong> OLV.<br />
This <strong>in</strong>vestigation was performed with the chest<br />
closed <strong>and</strong> before the surgical procedure.<br />
After <strong>in</strong>tubation <strong>in</strong> the sup<strong>in</strong>e position <strong>and</strong> fiberoptic<br />
control of the correct DLT position, the two lungs<br />
were ventilated with the above-described ventilatory<br />
pattern for 15 m<strong>in</strong>. End-<strong>in</strong>spiratory <strong>and</strong> end-expiratory<br />
occlusions were performed to determ<strong>in</strong>e the mechanical<br />
characteristics of the respiratory system (peak <strong>in</strong>spiratory<br />
airway pressure, end-<strong>in</strong>spiratory plateau pressure,<br />
<strong>and</strong> <strong>in</strong>tr<strong>in</strong>sic positive end-expiratory pressure) <strong>and</strong> arterial<br />
blood gas samples were drawn. Then, the tracheal<br />
lumen of the DLT was clamped, <strong>and</strong> the would-be operated<br />
nondependent lung was allowed to deflate to<br />
atmospheric pressure. After 15 m<strong>in</strong> of OLV <strong>and</strong> data<br />
collection, TLV was restored with unaltered ventilatory<br />
sett<strong>in</strong>gs, <strong>and</strong> the patient was turned to the lateral decubitus<br />
position. TLV <strong>and</strong> turn<strong>in</strong>g <strong>and</strong> position<strong>in</strong>g of the<br />
patients generally lasted approximately 30 m<strong>in</strong>. At the<br />
end of this period, ventilatory data were recorded, an<br />
arterial blood gas sample drawn, <strong>and</strong> the nondependent<br />
lung collapsed aga<strong>in</strong>, now with the patient <strong>in</strong> the lateral<br />
decubitus position. After 15 m<strong>in</strong>, respiratory mechanics<br />
<strong>and</strong> gas exchange data were collected aga<strong>in</strong>. Pao 2,<br />
alveolar-arterial oxygen tensions difference [P(A-a)o 2]<br />
were calculated by us<strong>in</strong>g st<strong>and</strong>ard equations.<br />
Demographic data <strong>and</strong> preoperative pulmonary<br />
functions of the three groups were comparable<br />
(Kruskall-Wallis test). The data obta<strong>in</strong>ed <strong>in</strong> the two<br />
positions were compared with the Wilcoxon matched<br />
pair test. The data caused by Fio 2 differences were<br />
analyzed with the Kruskall-Wallis test. Values of P <br />
0.05 were considered as statistically significant. Data<br />
were presented as median (range).<br />
Results<br />
Demographic characteristics, preoperative pulmonary<br />
function tests, <strong>and</strong> the values of the preoperative arterial<br />
oxygen <strong>and</strong> carbon dioxide tensions of the 24<br />
patients are shown <strong>in</strong> Table 1. The differences were<br />
not statistically significant among the three groups.<br />
Right- <strong>and</strong> left-sided thoracotomies were comparable<br />
<strong>in</strong> the three groups <strong>and</strong> among the groups (Kruskall-<br />
Wallis test). Initiat<strong>in</strong>g OLV with unaltered ventilatory<br />
sett<strong>in</strong>gs <strong>in</strong>creased peak <strong>in</strong>spiratory pressures significantly<br />
<strong>in</strong> all three groups (Tables 2–4).<br />
Effects of the Position<br />
Dur<strong>in</strong>g the period of TLV, the position of the patient<br />
(sup<strong>in</strong>e versus lateral) did not significantly <strong>in</strong>fluence<br />
the variables related to gas exchange <strong>in</strong> the three<br />
groups of patients (Tables 2–4).<br />
In contrast, <strong>in</strong> the OLV assessment stages, the Pao 2<br />
values <strong>in</strong> the lateral position were always significantly<br />
higher than <strong>in</strong> the sup<strong>in</strong>e position: Group 0.4, 63 (57–<br />
144) vs 101(72–201) mm Hg (P 0.02); Group 0.6, 155<br />
(114–235) vs 268 (162–311) mm Hg (P 0.02); Group<br />
1.0, 301 (216–422) vs 486 (288–563) mm Hg (P 0.02)<br />
(Wilcoxon’s matched pair test). The values of P(A-a)o 2<br />
showed similarly significant changes, but <strong>in</strong> the opposite<br />
direction (Tables 2–4 <strong>and</strong> Figure 1).<br />
While turn<strong>in</strong>g the patients from the sup<strong>in</strong>e <strong>in</strong>to the<br />
lateral position, no changes were observed regard<strong>in</strong>g<br />
the variables related to the mechanical properties of<br />
the respiratory system (peak <strong>in</strong>spiratory airway pressure,<br />
end-<strong>in</strong>spiratory airway pressure, <strong>and</strong> <strong>in</strong>tr<strong>in</strong>sic<br />
positive end-expiratory pressure), dur<strong>in</strong>g neither TLV,<br />
nor OLV (not significant, Wilcoxon matched-pair test).<br />
Effects of FIO 2<br />
In the three groups of patients ventilated with different<br />
Fio 2 values, the differences of Pao 2 values observed<br />
between the sup<strong>in</strong>e <strong>and</strong> lateral TLV periods<br />
were not significant. In contrast, the <strong>in</strong>creases of Pao 2
ANESTH ANALG CARDIOVASCULAR ANESTHESIA BARDOCZKY ET AL. 37<br />
2000;90:35–41 POSITION AND Fio 2 DURING OLV<br />
Table 1. Demographic Characteristics, Preoperative Pulmonary Function Studies, <strong>and</strong> Preoperative Arterial Blood Gas<br />
Values of 24 <strong>Patients</strong> Dur<strong>in</strong>g Thoracic Surgery<br />
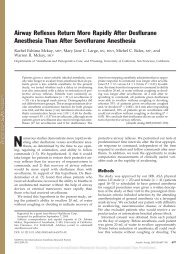
values observed between the lateral <strong>and</strong> sup<strong>in</strong>e OLV<br />
were significantly higher when the Fio 2 was higher<br />
(P 0.02, Kruskall-Wallis test) (Figure 2).<br />
Pao 2 was decreased <strong>and</strong> P(A-a)o 2 was <strong>in</strong>creased<br />
dur<strong>in</strong>g OLV <strong>in</strong> comparison with the TLV values <strong>in</strong><br />
both the sup<strong>in</strong>e <strong>and</strong> the lateral positions <strong>and</strong> at every<br />
level of Fio 2. However, these changes were more pronounced<br />
<strong>in</strong> the sup<strong>in</strong>e position (Group 0.4: 61 [17–132]<br />
vs 19 [5–39]) mm Hg; Group 0.6: 68 [9–150] vs 14<br />
[4–44] mm Hg; Group 1.0: 107 [5–268] vs 65 [18–205]<br />
mm Hg; P 0.05, Wilcoxon’s matched pair test).<br />
When turn<strong>in</strong>g the patients from the sup<strong>in</strong>e to the<br />
lateral position, Pao 2 <strong>in</strong>creased significantly when<br />
compar<strong>in</strong>g the periods of OLV. These Pao 2 <strong>in</strong>creases<br />
(lateral-sup<strong>in</strong>e) were significantly larger when higher<br />
Fio 2 values were used (Figure 2).<br />
When compar<strong>in</strong>g the periods of TLV, no significant<br />
differences <strong>in</strong> Pao 2 <strong>in</strong>creases (lateral-sup<strong>in</strong>e) were<br />
found, regardless of the Fio 2 values adm<strong>in</strong>istered<br />
(Figure 2).<br />
There were no significant changes <strong>in</strong> mean arterial<br />
pressure or heart rate <strong>in</strong> any of the patients dur<strong>in</strong>g the<br />
study period.<br />
Discussion<br />
Fio 2<br />
Group 0.4 (n 8) Group 0.6 (n 8) Group 1.0 (n 8)<br />
Age (yr) 59 (46–62) 60 (24–72) 64 (44–78)<br />
Height (cm) 175 (169–183) 169 (154–180) 167 (162–184)<br />
Weight (kg) 75 (51–105) 69 (55–86) 65 (56–98)<br />
FEV1 (% predicted) 76 (35–81) 79 (51–84) 80 (53–85)<br />
FRC (% predicted) 152 (122–195) 145 (121–182) 145 (122–181)<br />
RV (% predicted) 170 (128–177) 156 (131–196) 151 (124–193)<br />
TLC (% predicted) 115 (99–131) 115 (98–138) 112 (77–135)<br />
Paco 2 (mm Hg, room air, sup<strong>in</strong>e) 37 (31–41) 37 (29–43) 40 (36–47)<br />
Pao 2 (mm Hg, room air, sup<strong>in</strong>e) 78 (66–90) 82 (68–102) 72.5 (64–95)<br />
Data are median (range).<br />
Fio 2 fraction of <strong>in</strong>spired oxygen, FEV1 forced expiratory volume <strong>in</strong> 1 s, FRC functional residual capacity, RV residual volume, TLC total lung<br />
capacity.<br />
Table 2. Respiratory Mechanics <strong>and</strong> Gas Exchange Data Obta<strong>in</strong>ed Dur<strong>in</strong>g TLV <strong>and</strong> OLV with <strong>Patients</strong> <strong>in</strong> the Sup<strong>in</strong>e <strong>and</strong><br />
<strong>in</strong> the Lateral Positions, Fio 2 0.4 (n 8)<br />
Sup<strong>in</strong>e Lateral<br />
TLV OLV TLV OLV<br />
Ppeak (cm H 2O) 21 (12–35) 29 (17–40) 20 (12–35) 29 (17–42)<br />
Pplateau (cm H 2O) 14 (7–23) 18 (9–26) 13 (9–19) 18 (12–24)†<br />
PEEPi (cm H 2O) 1.5 (0–2) 2.5 (0–6) 1 (0–3) 3 (0–8)<br />
Paco 2 (mm Hg) 38 (34–47) 39 (32–49) 40.5 (35–47) 38.5 (36–45)<br />
Pao 2 (mm Hg) 124 (81–240) 63 (57–144) 132 (102–296) 101 (72–201)‡<br />
P(A-a)o 2 (mm Hg) 118 (12–170) 181 (94–197) 117 (16–166) 131 (44–177)‡<br />
Data are median (range).<br />
TLV two-lung ventilation, OLV one-lung ventilation, Ppeak peak <strong>in</strong>spiratory airway pressure, Pplateau end-<strong>in</strong>spiratory airway pressure, PEEPi <br />
<strong>in</strong>tr<strong>in</strong>sic positive end-expiratory pressure, P(A-a)o 2 alveolar-arterial oxygen tension difference.<br />
* P 0.02, † P 0.05 (OLV versus TLV).<br />
‡ P 0.02 (lateral versus sup<strong>in</strong>e OLV).<br />
In this study, we <strong>in</strong>vestigated arterial oxygenation<br />
with the patient <strong>in</strong> the sup<strong>in</strong>e <strong>and</strong> <strong>in</strong> the lateral positions<br />
dur<strong>in</strong>g TLV <strong>and</strong> OLV <strong>in</strong> patients with mild<br />
pulmonary hyper<strong>in</strong>flation scheduled for thoracic surgery.<br />
We found significantly higher Pao 2 <strong>and</strong> lower<br />
P(A-a)o 2 when OLV was performed <strong>in</strong> the lateral<br />
position.<br />
Recent developments <strong>in</strong> thoracic surgery have widened<br />
the scale of surgical <strong>in</strong>terventions <strong>and</strong> changed<br />
certa<strong>in</strong> traditions, <strong>in</strong>clud<strong>in</strong>g the patient position<strong>in</strong>g.<br />
S<strong>in</strong>gle-lung transplantation (12) <strong>and</strong> resection of unilateral<br />
emphysematous bullae (3) are performed with<br />
the patient <strong>in</strong> the lateral decubitus position, while<br />
double-lung transplantation, lung volume reduction<br />
surgery, <strong>and</strong> m<strong>in</strong>imally <strong>in</strong>vasive coronary artery surgery<br />
are performed with the patient placed <strong>in</strong> the<br />
sup<strong>in</strong>e position (1,2,13). In both conditions, to facilitate<br />
the surgeon’s task, variable periods of OLV are<br />
required dur<strong>in</strong>g these procedures.<br />
To expla<strong>in</strong> the preservation of blood oxygenation <strong>in</strong><br />
the presence of a large fraction of atelectatic lung, as
38 CARDIOVASCULAR ANESTHESIA BARDOCZKY ET AL. ANESTH ANALG<br />
POSITION AND Fio 2 DURING OLV 2000;90:35–41<br />
Table 3. Respiratory Mechanics <strong>and</strong> Gas Exchange Data Obta<strong>in</strong>ed Dur<strong>in</strong>g TLV <strong>and</strong> OLV with <strong>Patients</strong> <strong>in</strong> the Sup<strong>in</strong>e <strong>and</strong><br />
<strong>in</strong> the Lateral Positions, Fio 2 0.6 (n 8)<br />
dur<strong>in</strong>g OLV, <strong>in</strong> experimental or cl<strong>in</strong>ical conditions,<br />
many factors have been mentioned, <strong>in</strong>clud<strong>in</strong>g pr<strong>in</strong>cipally<br />
HPV (8,14), gravity (12), or local mechanical<br />
forces (13,15). We have found only one study compar<strong>in</strong>g<br />
oxygenation dur<strong>in</strong>g OLV <strong>in</strong> the sup<strong>in</strong>e <strong>and</strong> lateral<br />
positions (9).<br />
When OLV is performed <strong>and</strong> one of the lungs is<br />
excluded from ventilation, an obligatory right-to-left<br />
shunt occurs through the nonventilated lung that is<br />
Sup<strong>in</strong>e Lateral<br />
TLV OLV TLV OLV<br />
Ppeak (cm H 2O) 18 (15–22) 23 (16–35) 19 (12–32) 24 (16–32)†<br />
Pplateau (cm H 2O) 13 (11–17) 15 (12–23) 14 (9–17) 15 (11–30)<br />
PEEPi (cm H 2O) 1 (0–4) 2 (0–6) 1.5 (0–4) 3 (0–6)<br />
Paco 2 (mm Hg) 40 (36–52) 39 (31–46) 38 (35–46) 41 (35–51)<br />
Pao 2 (mm Hg) 256 (172–391) 155 (114–235)† 289 (225–353) 268 (162–311)‡<br />
P(A-a)o 2 (mm Hg) 136 (101–198) 196 (163–254)† 126 (97–213) 151 (123–234)‡<br />
Data are median (range).<br />
TLV two-lung ventilation, OLV one-lung ventilation, Ppeak peak <strong>in</strong>spiratory airway pressure, Pplateau end-<strong>in</strong>spiratory airway pressure, PEEPi <br />
<strong>in</strong>tr<strong>in</strong>sic positive end-expiratory pressure, P(A-a)o 2 alveolar-arterial oxygen tension difference.<br />
* P 0.02, † P 0.05 (OLV versus TLV).<br />
‡ P 0.02 (lateral versus sup<strong>in</strong>e OLV).<br />
Table 4. Respiratory Mechanics <strong>and</strong> Gas Exchange Data Obta<strong>in</strong>ed Dur<strong>in</strong>g TLV <strong>and</strong> OLV with <strong>Patients</strong> <strong>in</strong> the Sup<strong>in</strong>e <strong>and</strong><br />
<strong>in</strong> the Lateral Positions, Fio 2 1.0 (n 8)<br />
Sup<strong>in</strong>e Lateral<br />
TLV OLV TLV OLV<br />
Ppeak (cm H 2O) 17 (16–21) 24 (14–32)* 19 (15–24) 24 (17–29)†<br />
Pplateau (cm H 2O) 15 (8–18) 15 (8–19) 16 (9–19) 18 (11–22)<br />
PEEPi (cm H 2O) 1.5 (0–3) 2 (0–4) 1.5 (0–4) 2.5 (0–6)<br />
Paco 2 (mm Hg) 39 (33–48) 38 (36–52) 38 (34–50) 40 (34–51)<br />
Pao 2 (mm Hg) 472 (232–591) 301 (216–422)† 492 (336–600) 486 (288–563)‡<br />
P(A-a)o 2 (mm Hg) 185 (151–382) 267 (212–446)† 173 (144–376) 190 (153–396)‡<br />
Data are median (range).<br />
TLV two-lung ventilation, OLV one-lung ventilation, Ppeak peak <strong>in</strong>spiratory airway pressure, Pplateau end-<strong>in</strong>spiratory airway pressure, PEEPi <br />
<strong>in</strong>tr<strong>in</strong>sic positive end-expiratory pressure, P(A-a)o 2 alveolar-arterial oxygen tension difference.<br />
* P 0.02, † P 0.05 (OLV versus TLV).<br />
‡ P 0.02 (lateral versus sup<strong>in</strong>e OLV).<br />
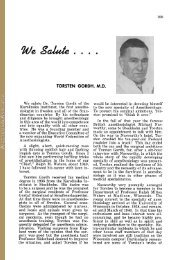
Figure 1. Individual modifications <strong>in</strong> arterial oxygenation secondary<br />
to changes <strong>in</strong> position <strong>in</strong> the three groups of patients dur<strong>in</strong>g<br />
thoracic surgery. The bold l<strong>in</strong>es represent the median values.<br />
not present dur<strong>in</strong>g TLV, <strong>and</strong> arterial oxygenation decreases<br />
(7). The pulmonary vessels <strong>in</strong> that nonventilated,<br />
hypoxic area respond by <strong>in</strong>creas<strong>in</strong>g resistance to<br />
flow. This reflex HPV of vessels perfus<strong>in</strong>g hypoxic<br />
alveoli diverts blood flow from nonventilated lung<br />
units (7,14) to ventilated regions <strong>and</strong> attenuates hypoxemia<br />
by actively reduc<strong>in</strong>g the perfusion of nonventilated<br />
lung tissue.<br />
In the sup<strong>in</strong>e position, dur<strong>in</strong>g anesthesia <strong>and</strong> controlled<br />
mechanical ventilation of both lungs, there are<br />
generally no significant differences <strong>in</strong> the perfusion<br />
between the two lungs as both are exposed to the same<br />
pressures of gravity (12). Start<strong>in</strong>g OLV will <strong>in</strong>itiate<br />
right-to-left shunt, <strong>and</strong> as a consequence, Pao 2 will<br />
decrease <strong>and</strong> P(A-a)o 2 will <strong>in</strong>crease. Indeed, <strong>in</strong> this<br />
study, when OLV was <strong>in</strong>itiated <strong>in</strong> the sup<strong>in</strong>e position,<br />
Pao 2 decreased from 124 (81–240) to 63 (57–144) mm<br />
Hg (P 0.02) <strong>in</strong> Group 0.4, from 255 (172–391) to 155<br />
(114–235) mm Hg (P 0.02) <strong>in</strong> Group 0.6, <strong>and</strong> from<br />
472 (232–591) to 300.5 (216–422) mm Hg <strong>in</strong> Group 1.0.<br />
Every patient’s P(A-a)o 2 <strong>in</strong>creased significantly dur<strong>in</strong>g<br />
OLV (Tables 2–4).<br />
However, dur<strong>in</strong>g TLV <strong>in</strong> the lateral position, the<br />
position of the patient reduces perfusion of the upper<br />
lung caused by gravitational diversion of blood flow
ANESTH ANALG CARDIOVASCULAR ANESTHESIA BARDOCZKY ET AL. 39<br />
2000;90:35–41 POSITION AND Fio 2 DURING OLV<br />
Figure 2. Values of arterial oxygen tension <strong>in</strong>creases between lateral <strong>and</strong> sup<strong>in</strong>e positions, dur<strong>in</strong>g TLV <strong>and</strong> OLV <strong>in</strong> the three groups of<br />
patients. The bold l<strong>in</strong>es represent the median values. TLV two-lung ventilation, OLV one-lung ventilation.<br />
to the dependent lung (7,8). As a result of anesthesia<br />
<strong>and</strong> muscle relaxation, the distribution of ventilation<br />
also changes <strong>in</strong> the lateral position because the applied<br />
positive-pressure ventilation displaces the diaphragm<br />
preferentially at the nondependent part. Traditionally,<br />
this discrepancy is thought to be disadvantageous (7).<br />
However, <strong>in</strong> our patients, the change <strong>in</strong> position from<br />
the sup<strong>in</strong>e to lateral decubitus position resulted <strong>in</strong> a<br />
modest change <strong>in</strong> Pao 2 dur<strong>in</strong>g TLV (124 [81–240] <strong>and</strong><br />
132 [102–296] mm Hg <strong>in</strong> Group 0.4; 256 [172–391] <strong>and</strong><br />
289 [225–353] mm Hg <strong>in</strong> Group 0.6; <strong>and</strong> 472 [232–591]<br />
<strong>and</strong> 492 [336–600] mm Hg <strong>in</strong> Group 1.0, respectively).<br />
This is <strong>in</strong> agreement with the f<strong>in</strong>d<strong>in</strong>gs of Boldt et al.<br />
(16) <strong>and</strong> Rehder et al. (17), who also reported no<br />
difference <strong>in</strong> Pao 2 between the lateral <strong>and</strong> the sup<strong>in</strong>e<br />
positions with TLV.<br />
Induc<strong>in</strong>g OLV when the patient is <strong>in</strong> the lateral<br />
position activates HPV <strong>and</strong> reduces the further perfusion<br />
of the collapsed lung. Hence, we found that Pao 2<br />
was significantly greater when OLV was <strong>in</strong>itiated after<br />
turn<strong>in</strong>g the patients <strong>in</strong>to the lateral decubitus position<br />
(Tables 2–4 <strong>and</strong> Figures 1 <strong>and</strong> 2).<br />
Fiser et al. (9) studied the period of OLV <strong>in</strong> both the<br />
sup<strong>in</strong>e <strong>and</strong> the lateral positions <strong>and</strong> did not f<strong>in</strong>d<br />
changes <strong>in</strong> arterial oxygen tension after 10 to 20 m<strong>in</strong>utes<br />
of OLV when the patients were turned <strong>in</strong>to the<br />
lateral position. However, <strong>in</strong> the study of Fiser et al.<br />
(9), OLV was <strong>in</strong>itiated <strong>in</strong> the sup<strong>in</strong>e position <strong>and</strong><br />
ma<strong>in</strong>ta<strong>in</strong>ed cont<strong>in</strong>uously, even dur<strong>in</strong>g the period of<br />
position<strong>in</strong>g <strong>and</strong> turn<strong>in</strong>g the patient, with an Fio 2 of<br />
1.0.<br />
The most important mechanism for reduc<strong>in</strong>g blood<br />
flow of an atelectatic lung is HPV (6,14). When OLV is<br />
<strong>in</strong>duced <strong>in</strong> the lateral position, the blood flow of the<br />
nondependent lung is already reduced by gravitational<br />
forces, <strong>and</strong> HPV further reduces blood flow. In<br />
contrast, <strong>in</strong> the sup<strong>in</strong>e position, both lungs are equally<br />
exposed to an identical gravitational force; thus dur<strong>in</strong>g<br />
OLV, the reduction of blood flow depends solely<br />
on the strength of the HPV.<br />
Here, consideration should be given to possible limitations<br />
<strong>in</strong> our experimental methods.<br />
First, concern<strong>in</strong>g the patients <strong>in</strong>cluded <strong>in</strong> the study,<br />
the presence of chronic airflow obstruction may be<br />
associated with better Pao 2 dur<strong>in</strong>g OLV possibly because<br />
of dynamic hyper<strong>in</strong>flation result<strong>in</strong>g <strong>in</strong> an <strong>in</strong>creased<br />
functional residual capacity <strong>and</strong> <strong>in</strong>tr<strong>in</strong>sic positive<br />
end-expiratory pressure <strong>in</strong> the dependent lung<br />
(18). In contrast, <strong>in</strong> patients with severe COPD, HPV<br />
may not be an important protective mechanism, as<br />
these patients already have an <strong>in</strong>creased pulmonary<br />
arterial pressure <strong>and</strong> reduced pulmonary vascular<br />
bed. The amount of disease <strong>in</strong> the nondependent lung<br />
is also a significant determ<strong>in</strong>ant of the amount of<br />
blood flow to the nondependent lung. If the nondependent<br />
lung is severely diseased, there may be a<br />
fixed reduction <strong>in</strong> blood flow to this lung preoperatively,<br />
<strong>and</strong> the collapse of such a diseased lung may
40 CARDIOVASCULAR ANESTHESIA BARDOCZKY ET AL. ANESTH ANALG<br />
POSITION AND Fio 2 DURING OLV 2000;90:35–41<br />
not cause more of an <strong>in</strong>crease <strong>in</strong> shunt. Pao 2 dur<strong>in</strong>g<br />
TLV may also be a determ<strong>in</strong><strong>in</strong>g factor of oxygenation<br />
dur<strong>in</strong>g OLV (18).<br />
Second, we did not study OLV for long periods<br />
(more than two hours) with high Fio 2 values, but<br />
accord<strong>in</strong>g to the study of Barker et al. (19), late hypoxemia<br />
occurs (mean OLV time, 170 m<strong>in</strong>utes) when ventilat<strong>in</strong>g<br />
with 100% oxygen, which may be <strong>in</strong> part<br />
caused by absorption atelectasis. High Fio 2 can lead to<br />
arteriovenous shunt<strong>in</strong>g <strong>in</strong> areas of airway closure <strong>and</strong>,<br />
further, cause absent ventilation <strong>in</strong> lung units with<br />
low ventilation/perfusion ratios.<br />
Third, if we consider that the lateral TLV/OLV always<br />
followed the sup<strong>in</strong>e TLV/OLV sequence, one<br />
can argue that a time effect could <strong>in</strong>fluence the present<br />
results. Concern<strong>in</strong>g the time course of the HPV response,<br />
many experimental <strong>and</strong> cl<strong>in</strong>ical studies have<br />
been performed, with sometimes contradictory results.<br />
Benumof (20) showed that <strong>in</strong>termittent hypoxic<br />
challenges potentiated the hypoxic vasoconstriction <strong>in</strong><br />
the left lower lobe of open-chest dog lungs, but the<br />
preparation <strong>and</strong> manipulation of the animals required<br />
considerable <strong>in</strong>strumentation <strong>and</strong> manipulation,<br />
which may have <strong>in</strong>terfered with the HPV. Carlsson et<br />
al. (21) found maximal HPV response with<strong>in</strong> 15 m<strong>in</strong>utes<br />
of hypoxia <strong>in</strong> a human study, which agrees with<br />
observations <strong>in</strong> animal studies. Tucker <strong>and</strong> Reeves<br />
(22) were unable to ma<strong>in</strong>ta<strong>in</strong> HPV dur<strong>in</strong>g acute hypoxia<br />
<strong>in</strong> anesthetized dogs. Dur<strong>in</strong>g one-lung hypoxia<br />
<strong>in</strong> dogs, Dom<strong>in</strong>o et al. (23) studied HPV <strong>in</strong> closedchest<br />
dogs <strong>and</strong> found a maximal level from the very<br />
first hypoxic challenge. Thus, there is a wide variation<br />
<strong>in</strong> the results obta<strong>in</strong>ed concern<strong>in</strong>g the <strong>in</strong>fluence of<br />
time on HPV. In our study, the experimental procedure<br />
was almost identical to the procedure performed<br />
by Carlsson et al. (21) or by Dom<strong>in</strong>o et al. (23), who<br />
concluded that the time factor should not be a h<strong>in</strong>drance<br />
to manipulative studies on the HPV response<br />
once a maximal response has been evoked, normally<br />
<strong>in</strong> 10–15 m<strong>in</strong>utes.<br />
Fourth, if we consider that, after the period of sup<strong>in</strong>e<br />
TLV, we have only declamped the tracheal limb<br />
of the DLT <strong>and</strong> closed it, without sigh<strong>in</strong>g the nondependent<br />
lung, the 5-mL/kg gas distributed to that<br />
lung will not reverse the amount of atelectasis. So, our<br />
study may be comparable to the study of Fiser et al.<br />
(9), but as significant changes were found <strong>in</strong> the lateral<br />
position, we can argue that if HPV was maximal after<br />
the first 15 m<strong>in</strong> of hypoxia, there is another factor,<br />
probably gravity, that could contribute to flow redistribution.<br />
Nevertheless, <strong>in</strong> the particular conditions of<br />
the present study—patients with mild COPD, closed<br />
chest, mixed locoregional/general balanced anesthesia—<strong>in</strong>creased<br />
HPV responses <strong>in</strong> the lateral position<br />
cannot be excluded as explanations of Pao 2 values<br />
observed <strong>in</strong> the second OLV episode.<br />
Paco 2, especially at high values, <strong>in</strong>fluences the level<br />
HPV response (24). Thus, the Paco 2 values of the<br />
studied patients were always ma<strong>in</strong>ta<strong>in</strong>ed with<strong>in</strong> normal<br />
limits <strong>in</strong> the different periods of blood gas<br />
measurements.<br />
Another factor that may <strong>in</strong>fluence hypoxia dur<strong>in</strong>g<br />
OLV is the side of the surgery. Left thoracotomy has a<br />
better Pao 2 dur<strong>in</strong>g OLV than right thoracotomy, because<br />
the left lung normally receives 10 percent less<br />
cardiac output than the right lung (18). In our study,<br />
there were no statistical differences concern<strong>in</strong>g the<br />
side of surgery <strong>in</strong> the three groups or among the three<br />
groups.<br />
Gravity is a major, pharmacologically <strong>and</strong> physiopathologically,<br />
<strong>in</strong>dependent determ<strong>in</strong>ant of regional<br />
pulmonary blood flow distribution. The extent of<br />
blood flow redistribution depends on the local relationship<br />
between pulmonary arterial, venous, <strong>and</strong> airway<br />
pressures. In the lateral position, regional blood<br />
flow <strong>in</strong>creases from the nondependent to the dependent<br />
thoracic wall (8). Unfortunately, the design of our<br />
study did not permit us to dist<strong>in</strong>guish between the<br />
direct effects of HPV on blood flow <strong>and</strong> the effects of<br />
gravitational redistribution of blood flow.<br />
The differences observed among the three groups of<br />
patients supports the hypothesis of Benumof et al.<br />
(25), who demonstrated, on a can<strong>in</strong>e left lower lobe<br />
preparation, that if Fio 2 changes cause secondary<br />
changes <strong>in</strong> Pao 2, <strong>and</strong> <strong>in</strong> the mixed venous oxygen<br />
tension, then the mixed venous oxygen tension is a<br />
new <strong>and</strong> important determ<strong>in</strong>ant of the magnitude of<br />
HPV. This suggests that when one compartment Fio 2<br />
is 1.0 <strong>and</strong> the other compartment is hypoxic, HPV <strong>in</strong><br />
the hypoxic compartment is maximal.<br />
The method used to ventilate the dependent lung is<br />
an important determ<strong>in</strong>ant of the blood flow distribution<br />
dur<strong>in</strong>g OLV. High airway pressures can compress<br />
lung vessels, divert<strong>in</strong>g blood flow from ventilated to<br />
nonventilated regions. However, hypoventilation of<br />
the dependent lung dur<strong>in</strong>g OLV is associated with<br />
lower airway pressure, <strong>and</strong> the ventilated lung pulmonary<br />
vascular resistance may decrease, thus promot<strong>in</strong>g<br />
HPV <strong>in</strong> the nonventilated lung (7). This mechanism<br />
of improved Pao 2 was unlikely <strong>in</strong> the present<br />
<strong>in</strong>vestigation, as ventilatory sett<strong>in</strong>gs were kept constant,<br />
<strong>in</strong>spiratory airway pressures were not changed,<br />
<strong>and</strong> the mechanical characteristics of the dependent<br />
lung rema<strong>in</strong>ed unaltered (Tables 2–4) after chang<strong>in</strong>g<br />
the position. These f<strong>in</strong>d<strong>in</strong>gs <strong>in</strong>dicate that the improved<br />
Pao 2 cannot be attributed to an altered HPV<br />
caused by change <strong>in</strong> ventilatory pattern.<br />
Surgical compression <strong>and</strong> retraction may also contribute<br />
to the passive reduction of nondependent lung<br />
blood flow (15). However, <strong>in</strong> our study, there was no<br />
mechanical effect on lung parenchyma, as the data
ANESTH ANALG CARDIOVASCULAR ANESTHESIA BARDOCZKY ET AL. 41<br />
2000;90:35–41 POSITION AND Fio 2 DURING OLV<br />
were collected before chest open<strong>in</strong>g. Therefore, surgical<br />
manipulation could not <strong>in</strong>fluence the amount of<br />
shunt occurr<strong>in</strong>g.<br />
We conclude that, <strong>in</strong> addition to HPV, the augmented<br />
redistribution of perfusion caused by gravitational<br />
forces is probably responsible for the higher<br />
Pao 2 dur<strong>in</strong>g OLV <strong>in</strong> the lateral position. The f<strong>in</strong>d<strong>in</strong>g of<br />
significantly lower Pao 2 values occurr<strong>in</strong>g when OLV<br />
was <strong>in</strong>itiated <strong>in</strong> the sup<strong>in</strong>e position may predict more<br />
frequent <strong>in</strong>traoperative hypoxemia when thoracic surgery<br />
requir<strong>in</strong>g OLV is performed with patients <strong>in</strong> the<br />
sup<strong>in</strong>e position. If severe hypoxemia occurs dur<strong>in</strong>g<br />
OLV <strong>in</strong> the lateral position, higher Fio 2 values might<br />
be used.<br />
References<br />
1. Pasque MK, Cooper JD, Kaiser L, et al. Improved technique for<br />
bilateral lung transplantation: rationale <strong>and</strong> <strong>in</strong>itial cl<strong>in</strong>ical experience.<br />
Ann Thorac Surg 1990;49:785–91.<br />
2. Cooper JD, Patterson GA, Sundaresan RS, et al. Results of 150<br />
consecutive bilateral lung volume reduction procedures <strong>in</strong> patients<br />
with severe emphysema. J Thorac Cardiovasc Surg 1996;<br />
112:1319–30.<br />
3. Lima O, Ramos L, DiBiasi P, Judice L. Median sternotomy for<br />
bilateral resection of emphysematous bullae. J Thorac Cardiovasc<br />
Surg 1981;82:892–7.<br />
4. Wasnick JD, Acuff T. <strong>Anesthesia</strong> <strong>and</strong> m<strong>in</strong>imally <strong>in</strong>vasive thoracoscopically<br />
assisted coronary artery bypass: a brief cl<strong>in</strong>ical<br />
report. J Cardiothorac Vasc Anesth 1997;11:552–5.<br />
5. Urschel HC, Razzuk MA. Median sternotomy as a st<strong>and</strong>ard<br />
approach for pulmonary resection. Ann Thorac Surg 1986;41:<br />
130–4.<br />
6. Benumof JL. <strong>One</strong>-lung ventilation <strong>and</strong> hypoxic pulmonary<br />
vasoconstriction: implications for anesthetic management.<br />
Anesth Analg 1985;64:821–33.<br />
7. Benumof JL. Physiology of the lateral decubitus position, the<br />
open chest <strong>and</strong> one-lung ventilation. In: Kaplan JA, ed. Thoracic<br />
anesthesia. New York: Churchill Liv<strong>in</strong>gstone, 1993:193–221.<br />
8. Arborelius M, Lund<strong>in</strong> G, Svanberg L, Defares JG. Influence of<br />
unilateral hypoxia on blood flow through the lungs <strong>in</strong> man <strong>in</strong><br />
lateral position J Appl Physiol 1960;15:595–7.<br />
9. Fiser WP, Friday CD, Read RC. Changes <strong>in</strong> arterial oxygenation<br />
<strong>and</strong> pulmonary shunt dur<strong>in</strong>g thoracotomy with endobronchial<br />
anesthesia. J Thorac Cardiovasc Surg 1982;83:523–31.<br />
10. Hannalah MS, Benumof JL, McCarthy PO, et al. Comparison of<br />
three techniques to <strong>in</strong>flate the bronchial cuff of left polyv<strong>in</strong>ylchloride<br />
double-lumen tubes. Anesth Analg 1993;77:990–4.<br />
11. Deleted <strong>in</strong> proof.<br />
12. Rehder K, Wenthe FM, Sessler AD. Function of each lung dur<strong>in</strong>g<br />
mechanical ventilation with ZEEP <strong>and</strong> with PEEP <strong>in</strong> man<br />
anesthetized with thiopental-meperid<strong>in</strong>e. Anesthesiology 1973;<br />
39:597–606.<br />
13. Gayes JM, Emery RW. The MIDCAB experience: a current look<br />
at evolv<strong>in</strong>g surgical <strong>and</strong> anesthetic approaches. J Cardiothorac<br />
Vasc Anesth 1997;11:625–8.<br />
14. Marshall BE. Hypoxic pulmonary vasoconstriction. Acta Anaesthesiol<br />
Sc<strong>and</strong> 1990;34:37–41.<br />
15. Alfery DD, Benumof JL, Trousdale FR. Improv<strong>in</strong>g oxygenation<br />
dur<strong>in</strong>g one-lung ventilation <strong>in</strong> dogs: the effects of positive endexpiratory<br />
pressure <strong>and</strong> blood-flow restriction to the nonventilated<br />
lung. Anesthesiology 1981;55:381–5.<br />
16. Boldt J, Muller M, Uphus D, et al. Cardiorespiratory changes <strong>in</strong><br />
patients undergo<strong>in</strong>g pulmonary resection us<strong>in</strong>g different anesthetic<br />
management techniques. J Cardiothorac Vasc Anesth<br />
1996;7:854–9.<br />
17. Rehder K, Knopp TJ, Sessler AD, Didier EP. <strong>Ventilation</strong>perfusion<br />
relationship <strong>in</strong> young healthy awake <strong>and</strong><br />
anesthetized-paralyzed man. J Appl Physiol 1979;47:745–53.<br />
18. Sl<strong>in</strong>ger P, Suissa S, Adam J, Triolet W. Predict<strong>in</strong>g arterial oxygenation<br />
dur<strong>in</strong>g one-lung ventilation with cont<strong>in</strong>uous positive<br />
airway pressure to the nonventilated lung. J Cardiothorac<br />
Anesth, 1990;4:436–40.<br />
19. Barker SJ, Clarke C, Trivedi N, et al. <strong>Anesthesia</strong> for thoracoscopic<br />
laser ablation of bullous emphysema. Anesthesiology<br />
1993;78:44–50.<br />
20. Benumof JL. Intermittent hypoxia <strong>in</strong>creases lobar hypoxic pulmonary<br />
vasoconstriction. Anesthesiology 1983;58:399–404.<br />
21. Carlsson AJ, B<strong>in</strong>dslev L, Santesson J, et al. Hypoxic pulmonary<br />
vasoconstriction <strong>in</strong> the human lung: the effect of prolonged<br />
unilateral hypoxic challenge dur<strong>in</strong>g anaesthesia. Acta Anaesthesiol<br />
Sc<strong>and</strong> 1985;29:346–51.<br />
22. Tucker A, Reeves JT. Non-susta<strong>in</strong>ed pulmonary vasoconstriction<br />
dur<strong>in</strong>g acute hypoxia <strong>in</strong> anesthetized dogs. Am J Physiol<br />
1977;42:889–99.<br />
23. Dom<strong>in</strong>o K, Chen L, Alex<strong>and</strong>er C, et al. Time course <strong>and</strong> responses<br />
of susta<strong>in</strong>ed hypoxic pulmonary vasoconstriction <strong>in</strong> the<br />
dog. Anesthesiology 1984;60:562–6.<br />
24. Benumof JL, Mathers JM, Wahrenbrock EA. Cyclic hypoxic<br />
pulmonary vasoconstriction <strong>in</strong>duced by concomitant carbon dioxide<br />
changes. J Appl Physiol 1976;41:466–9.<br />
25. Benumof JL, Pirlo AF, Johanson I, Trousdale FR. Interaction of<br />
PVO2 with PAO2 on hypoxic pulmonary vasoconstriction.<br />
J Appl Physiol 1981;51:871–4.