National Wrong Blood In Tube - Irish Blood Transfusion Service
National Wrong Blood In Tube - Irish Blood Transfusion Service
National Wrong Blood In Tube - Irish Blood Transfusion Service

Create successful ePaper yourself
Turn your PDF publications into a flip-book with our unique Google optimized e-Paper software.
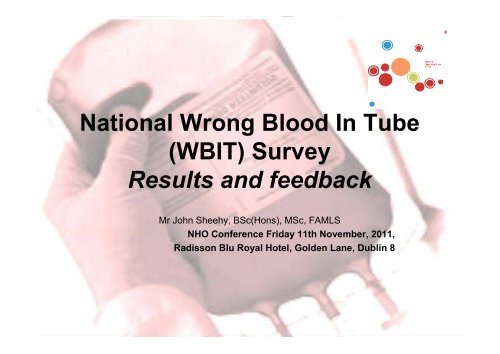
<strong>National</strong> <strong>Wrong</strong> <strong>Blood</strong> <strong>In</strong> <strong>Tube</strong><br />
(WBIT) Survey<br />
Results and feedback<br />
Mr John Sheehy, BSc(Hons), MSc, FAMLS<br />
NHO Conference Friday 11th November, 2011,<br />
Radisson Blu Royal Hotel, Golden Lane, Dublin 8
Background<br />
• Southern Haemovigilance Working Group query<br />
• Do the NHO want <strong>Wrong</strong> <strong>Blood</strong> <strong>In</strong> <strong>Tube</strong> (WBIT)<br />
incidents reported as a SAE?<br />
• NHO response<br />
• Reluctant to collate reports due to<br />
– Staffing constraints<br />
– Potential sizeable workload<br />
• Proposed a national survey<br />
– To establish a baseline<br />
– <strong>In</strong>vited my participation (member of <strong>Transfusion</strong> &<br />
Transplantation Science Advisory Body – TTSAB)
Objectives<br />
• The primary aim of this national study was to<br />
assess the frequency of mislabelled and<br />
miscollected (i.e. WBIT) samples submitted to<br />
hospital blood banks in Ireland<br />
• Survey carried out over a three month period (Jun,<br />
Jul, Aug 2011)<br />
• To access the availability of policies and training on<br />
blood transfusion sampling in <strong>Irish</strong> hospitals.<br />
• To assess who takes samples for blood transfusion<br />
in <strong>Irish</strong> hospitals<br />
• To propose solutions to minimise problem
Participation rate<br />
• 79 hospitals transfuse red cells <strong>In</strong> Ireland<br />
(figure from ANSAE/ANSAR reports)<br />
• Response from 41hospitals<br />
– 40 respondents themselves<br />
– 1 respondent did not identified<br />
• Response rate 52%
<strong>National</strong> <strong>Wrong</strong> <strong>Blood</strong> <strong>In</strong> <strong>Tube</strong><br />
Section 1:<br />
(WBIT) Survey<br />
Results and feedback<br />
Policies, procedures and training
Does the hospital have a written policy<br />
with explicit criteria for acceptance of<br />
samples for blood transfusion?<br />
98%<br />
2%<br />
Yes No<br />
40 Yes<br />
1 No
Does your hospital have a written policy<br />
on sampling for blood transfusion?<br />
100%<br />
41 Yes<br />
0 No<br />
YES
Is training provided in your hospital for staff<br />
involved in sampling for blood transfusion?<br />
30<br />
25<br />
20<br />
15<br />
10<br />
5<br />
0<br />
27<br />
14<br />
All Some None<br />
0
Is training provided in your hospital for staff<br />
involved in sampling for blood transfusion?<br />
• Comments<br />
– Submitted by 19 respondents (all respondents<br />
had option)<br />
• Challenges in delivering training to doctors<br />
including locum doctors (11 comments)<br />
• Other comments referred to staff not receiving<br />
training specifically in the act of venepuncture<br />
• Generally where midwives / nursing / phlebotomy<br />
involved training is provided
35<br />
30<br />
25<br />
20<br />
15<br />
10<br />
5<br />
0<br />
Who delivers training on sampling for<br />
blood transfusion in your hospital?<br />
35 35<br />
Haemovigilance<br />
Haemovigilance<br />
Officer<br />
Officer<br />
6<br />
Medical Medical Scientist Scientist Nursing/Midwifery<br />
Nursing/Midwifery<br />
Staff<br />
Staff<br />
4<br />
38 respondents<br />
3 non-respondents<br />
3<br />
Medical Medical Staff<br />
Staff
Who delivers training on sampling for<br />
blood transfusion in your hospital?<br />
• Comments<br />
– Submitted by 18 respondents<br />
• 9 comments referred to the involvement of<br />
phlebotomy staff in training in venepuncture -<br />
• 2 comments referred to the use of SNBTS elearning<br />
programme
Who is permitted to take transfusion samples<br />
in your hospitals? (both routine and emergency)<br />
40<br />
35<br />
30<br />
25<br />
20<br />
15<br />
10<br />
5<br />
0<br />
38<br />
Phlebotomist<br />
34<br />
0<br />
Medical Scientific Staff<br />
1<br />
33<br />
Nursing /Midwifery Staff<br />
34<br />
2<br />
Medical student<br />
2<br />
40<br />
<strong>In</strong>tern/House Officer / Registrar<br />
40<br />
33<br />
Consultant<br />
36<br />
41 respondents<br />
Parents, perfusionists,<br />
healthcare assistants, nurses<br />
working in specialist areas<br />
3<br />
General Practitioner<br />
1<br />
10<br />
Other<br />
Routine Emergency<br />
7
<strong>National</strong> <strong>Wrong</strong> <strong>Blood</strong> <strong>In</strong> <strong>Tube</strong><br />
Section 2:<br />
(WBIT) Survey<br />
Results and feedback<br />
Specimen rejection rates
What number of samples are received in<br />
the hospital blood bank per annum (2010)?<br />
16<br />
14<br />
12<br />
10<br />
8<br />
6<br />
4<br />
2<br />
0<br />
6<br />
16 16<br />
5<br />
40 respondents<br />
1 non-respondents<br />
< 1000 1000 - 5000 5001 - 10,000 10,001 - 15,000 >15,001<br />
Small to medium sized hospital Medium to large sized hospital<br />
6<br />
7
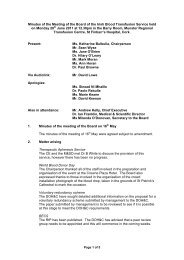
Total specimens received and rejected<br />
June – August 2011<br />
Jun ’11<br />
Jul ’11<br />
Aug ’11<br />
Total for<br />
3-month period<br />
Samples<br />
received<br />
24,082<br />
23,374<br />
23,858<br />
71,314<br />
Samples<br />
rejected<br />
944<br />
1,004<br />
974<br />
2,922<br />
Average rejection<br />
rate per month<br />
3.9%<br />
4.3%<br />
4.1%<br />
4.1%<br />
(or 1 in 24<br />
specimens)
1,200<br />
1,000<br />
800<br />
600<br />
400<br />
200<br />
62<br />
Why were samples rejected?<br />
6<br />
Unlabeled Illegible /<br />
Unreadable<br />
1,181 1,181<br />
1,181<br />
<strong>In</strong>complete or<br />
missing<br />
information on<br />
sample tube<br />
and / or<br />
request form<br />
Mismatched<br />
information<br />
between sample<br />
tube and<br />
request form<br />
2922 rejected specimens<br />
<strong>In</strong>creased use of electronic<br />
Suggestions to reduce ordering these rejection RFID systems errors??<br />
<strong>National</strong><br />
Standardise<br />
blood<br />
policy<br />
transfusion<br />
nationally<br />
request<br />
on addressograph<br />
form<br />
labels<br />
<strong>In</strong>creased use of electronic<br />
No excuse!!<br />
ordering RFID Confusion systems re use of<br />
No excuse!! addressograph labels<br />
Education<br />
No excuse!!<br />
437 437<br />
437<br />
Standardise MCRN??<br />
policy<br />
nationally<br />
194<br />
194<br />
Addressograph<br />
label used to<br />
label tube<br />
248<br />
248<br />
Sample tube<br />
and / or<br />
request form<br />
not clearly<br />
signed.<br />
746<br />
746<br />
Other
How do we compare with international<br />
figures for mislabelled specimens?<br />
• Murphy et al, Transfus Med, 2004 UK study<br />
• Rejection rate of 3.2%<br />
– “…identified great variation in policies and practice for sample<br />
collection..”<br />
– “…practice Or can allowing we additions learn or from changes the to sample best tubes &<br />
request forms varied …”<br />
– “…regular performing tracking of the <strong>Irish</strong> rates of specimen hospitals? rejection could be<br />
used to identify poor performance in individual hospitals…”<br />
Further analysis of our own data!!<br />
• Dzik et al, Vox Sang, 2003, 10-country<br />
worldwide study<br />
• Rejection Rate of 0.2% to 1.7%<br />
– “…great variation worldwide in the reported frequency of<br />
mislabelled samples, probably representing from variation in<br />
policies for sample acceptance..”
Total specimens received and rejected<br />
June – August 2011<br />
Jun ’11<br />
Jul ’11<br />
Aug ’11<br />
Total for<br />
3-month period<br />
Samples<br />
received<br />
24,082<br />
23,374<br />
23,858<br />
71,314<br />
Samples<br />
rejected<br />
944<br />
1,004<br />
974<br />
2,922<br />
Average rejection<br />
rate per month<br />
3.9%<br />
4.3%<br />
4.1%<br />
4.1%<br />
(or 1 in 24<br />
specimens)<br />
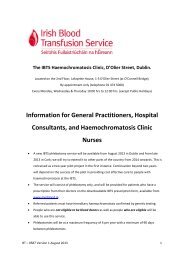
Range in rejection rate for the hospitals<br />
who responded is 0.0% to 10.85%
Number<br />
Number<br />
31<br />
24<br />
16<br />
35<br />
32<br />
17<br />
3<br />
4<br />
20<br />
2<br />
10<br />
34<br />
28<br />
14<br />
37<br />
1<br />
22<br />
38<br />
36<br />
39<br />
Response Response Date<br />
Date<br />
Oct 12, 2011 9:53 AM<br />
Oct 12, 2011 10:16 AM<br />
Oct 12, 2011 10:40 AM<br />
Oct 12, 2011 8:42 AM<br />
Oct 12, 2011 9:47 AM<br />
Oct 12, 2011 10:39 AM<br />
Oct 13, 2011 9:33 AM<br />
Oct 12, 2011 11:27 AM<br />
Oct 12, 2011 10:22 AM<br />
Oct 13, 2011 9:37 AM<br />
Oct 12, 2011 10:56 AM<br />
Oct 12, 2011 8:49 AM<br />
Oct 12, 2011 10:01 AM<br />
Oct 12, 2011 10:47 AM<br />
Sep 9, 2011 12:11 PM<br />
Oct 13, 2011 9:42 AM<br />
Oct 12, 2011 10:19 AM<br />
Sep 8, 2011 12:52 PM<br />
Sep 13, 2011 2:57 PM<br />
Sep 5, 2011 8:42 AM<br />
June June 2011<br />
2011<br />
318<br />
368<br />
285<br />
1623<br />
646<br />
1349<br />
64<br />
75<br />
1028<br />
1787<br />
137<br />
131<br />
338<br />
320<br />
946<br />
515<br />
951<br />
1320<br />
1113<br />
607<br />
July July 2011<br />
2011<br />
302<br />
400<br />
220<br />
1704<br />
590<br />
1296<br />
52<br />
77<br />
1144<br />
1616<br />
150<br />
150<br />
296<br />
327<br />
1007<br />
490<br />
883<br />
1234<br />
1160<br />
563<br />
Aug Aug-11 Aug Aug 11<br />
311<br />
365<br />
222<br />
1652<br />
622<br />
1337<br />
67<br />
44<br />
1124<br />
1655<br />
158<br />
148<br />
307<br />
296<br />
1018<br />
504<br />
957<br />
1277<br />
1200<br />
548<br />
Total Total no. no. of of specs<br />
specs<br />
931<br />
1133<br />
727<br />
4979<br />
1858<br />
3982<br />
183<br />
196<br />
3296<br />
5058<br />
445<br />
429<br />
941<br />
943<br />
2971<br />
1509<br />
2791<br />
3831<br />
3473<br />
1718<br />
Total Total rejected<br />
rejected<br />
101<br />
109<br />
69<br />
450<br />
164<br />
348<br />
15<br />
15<br />
248<br />
274<br />
23<br />
22<br />
41<br />
36<br />
108<br />
53<br />
92<br />
121<br />
101<br />
46<br />
% % rejected<br />
rejected<br />
10.85%<br />
9.62%<br />
9.49%<br />
9.04%<br />
8.83%<br />
8.74%<br />
8.20%<br />
7.65%<br />
7.52%<br />
5.42%<br />
5.17%<br />
5.13%<br />
4.36%<br />
3.82%<br />
3.64%<br />
3.51%<br />
3.30%<br />
3.16%<br />
2.91%<br />
2.68%
Number<br />
Number<br />
8<br />
9<br />
27<br />
15<br />
18<br />
40<br />
30<br />
33<br />
13<br />
25<br />
21<br />
12<br />
29<br />
19<br />
5<br />
26<br />
7<br />
23<br />
11<br />
6<br />
Response Response Date<br />
Date<br />
Jun Jun 2011<br />
2011<br />
318<br />
368<br />
285<br />
1623<br />
Jun Jun 2011<br />
2011<br />
761<br />
398<br />
568<br />
274<br />
Oct 12, 2011 11:00 AM<br />
Jul Jul Jul 2011<br />
2011<br />
Oct 12, 2011 10:58 AM<br />
302<br />
Oct 12, 2011 10:04 AM<br />
Oct 12, 2011 10:42 AM<br />
400<br />
Oct 12, 2011 10:36 AM<br />
Sep 2, 2011 10:48 AM<br />
220<br />
Oct 12, 2011 9:55 AM<br />
Oct 12, 2011 8:59 AM<br />
1704<br />
Oct 12, 2011 10:50 AM<br />
Oct 12, 2011 10:08 AM 52<br />
39<br />
53<br />
Oct 12, 2011 10:21 AM 159<br />
121<br />
156<br />
LOW rejection rates<br />
Oct 12, 2011 10:52 AM<br />
Jul Jul Jul 2011 2011<br />
2011<br />
Oct 12, 2011 10:00 AM 141<br />
Aug 2011<br />
Oct 12, 2011 10:25 AM<br />
735<br />
Oct 12, 2011 11:09 AM<br />
Oct 12, 2011 10:05 AM<br />
401<br />
Oct 12, 2011 11:02 AM<br />
Oct 12, 2011 10:17 AM<br />
497<br />
Oct 12, 2011 10:54 AM<br />
280<br />
Oct 12, 2011 11:06 AM<br />
HIGH June June 2011 2011<br />
2011 rejection July July July 2011<br />
2011 Aug Aug-11 Aug 11 11<br />
rates Total Total Total no. no. of of specs<br />
specs<br />
905<br />
Aug Aug 2011<br />
2011<br />
269<br />
1263<br />
311<br />
1403<br />
300<br />
365<br />
530<br />
152 222<br />
2366<br />
1652<br />
199<br />
369<br />
Aug 2011<br />
50<br />
761 820<br />
398<br />
568 407<br />
274<br />
507 2<br />
0<br />
293<br />
Total Total Total 865 no. no. no. of of 860specs<br />
specs<br />
specs<br />
(3 (3-mths) (3<br />
mths) mths)<br />
232<br />
1217<br />
1358<br />
300<br />
540<br />
105<br />
2280<br />
179<br />
399<br />
58<br />
735<br />
401<br />
497<br />
280<br />
4<br />
0<br />
236<br />
931<br />
1266<br />
1437<br />
300<br />
1133<br />
581<br />
727<br />
106<br />
2233<br />
4979<br />
214<br />
398<br />
Total Total no. no. of of specs specs<br />
specs<br />
103<br />
105<br />
(3 (3-mths) (3<br />
mths)<br />
67<br />
820 2316<br />
407<br />
507 1206<br />
293<br />
1572 6<br />
1<br />
847<br />
2630 Total<br />
Total<br />
rejected<br />
rejected<br />
737<br />
101<br />
3746<br />
4198<br />
900<br />
109<br />
1651<br />
363<br />
6879<br />
450<br />
592<br />
144<br />
436<br />
1166<br />
175<br />
2316<br />
1206<br />
1572<br />
847<br />
12<br />
1<br />
69<br />
Total<br />
Total<br />
349<br />
rejected<br />
rejected<br />
22<br />
10<br />
9<br />
2<br />
Total Total rejected<br />
rejected<br />
65<br />
% % rejected<br />
rejected<br />
17<br />
79<br />
10.85%<br />
85<br />
16<br />
9.62%<br />
29<br />
6 9.49%<br />
109<br />
9.04%<br />
9<br />
2<br />
6<br />
14<br />
4<br />
% rejected<br />
% rejected<br />
2<br />
22 0.95%<br />
10<br />
9 0.83%<br />
2<br />
0.57%<br />
0<br />
0<br />
0.24%<br />
% % rejected<br />
rejected<br />
2.47%<br />
2.31%<br />
2.11%<br />
2.02%<br />
1.78%<br />
1.76%<br />
1.65%<br />
1.58%<br />
1.52%<br />
1.39%<br />
1.38%<br />
1.20%<br />
1.15%<br />
1.14%<br />
0.95%<br />
0.83%<br />
0.57%<br />
0.24%<br />
0.00%<br />
0.00%
<strong>National</strong> <strong>Wrong</strong> <strong>Blood</strong> <strong>In</strong> <strong>Tube</strong><br />
Section 3:<br />
(WBIT) Survey<br />
Results and feedback<br />
<strong>Wrong</strong> <strong>Blood</strong> <strong>In</strong> <strong>Tube</strong> (WBIT) incidents
<strong>Wrong</strong> <strong>Blood</strong> <strong>In</strong> <strong>Tube</strong> (WBIT)<br />
• Some confusion when survey initially sent out<br />
• <strong>In</strong>itially we were defining WBIT as any incident<br />
where the wrong blood was detected through a<br />
different historical blood group<br />
• We then sought information of all WBITs<br />
irrespective of how determined .i.e.<br />
– either through a different historical blood group<br />
– notification/communication from clinical area<br />
– identified in laboratory through ‘other’ means
Total specimens received & WBIT incidences<br />
June – August 2011<br />
Jun ’11<br />
Jul ’11<br />
Aug ’11<br />
Total for<br />
3-month period<br />
Samples<br />
received<br />
24,082<br />
23,374<br />
23,858<br />
71,314<br />
No. of WBIT<br />
<strong>In</strong>cidences<br />
4<br />
5<br />
6<br />
15<br />
Average incidence<br />
of WBIT per month<br />
0.017%<br />
0.021%<br />
0.025%<br />
0.021%<br />
(or 1 in 4,743<br />
specimens)
10<br />
9<br />
8<br />
7<br />
6<br />
5<br />
4<br />
3<br />
2<br />
1<br />
0<br />
WBIT incidences<br />
How were they detected?<br />
9<br />
Different<br />
historical<br />
blood group<br />
4<br />
<strong>In</strong>formation<br />
received from<br />
sampler<br />
<strong>In</strong>vestigation<br />
'triggered' in<br />
blood bank<br />
1 1<br />
Detected due<br />
to mislabelling<br />
of sample
10<br />
9<br />
8<br />
7<br />
6<br />
5<br />
4<br />
3<br />
2<br />
1<br />
0<br />
8<br />
Emergency<br />
Dept<br />
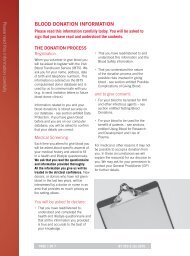
WBIT incidences<br />
Where did they occur?<br />
A WBIT can occur throughout the hospital<br />
but there ‘appears’ to be a higher<br />
incidence in the Emergency Dept.<br />
Care has to be taken with this finding as<br />
we did not collect how many specimens<br />
were collected in each area of the hospital<br />
0 0 0 0 0<br />
Theatre ITU Day Ward Out Patients<br />
Dept<br />
Neonatal<br />
Unit<br />
7<br />
'Routine'<br />
Ward
12<br />
10<br />
8<br />
6<br />
4<br />
2<br />
0<br />
WBIT incidences<br />
Who took the specimens?<br />
Medical NCHD staff ‘appear’ to be the staff grade<br />
involved in most WBIT incidents<br />
11<br />
This is what one would expect as they take the most<br />
samples<br />
Slightly disappointing though is the finding that as most<br />
respondents would have stated that where nursing /<br />
midwifery receive specific training, this staff grade<br />
accounted for 27% of the 4 WBITs reported<br />
No phlebotomy staff involved 27% in WBIT<br />
0 0<br />
Phlebotomist Medical<br />
Scientist<br />
Nurse /<br />
Midwife<br />
73%<br />
0 0<br />
NCHD Consultant 'Other'
How do we compare with international<br />
figures for WBIT specimens?<br />
• Dzik et al, Vox Sang, 2003, 10-country worldwide<br />
study<br />
• WBIT Rate of 0.03% to 0.09%<br />
– “…greater variation worldwide in reported frequency of<br />
mislabelled samples …incidence of WBIT occurred at a<br />
more constant rate..”<br />
• Ansari & Szallasi, Vox Sang, 2011, US study<br />
• WBIT Rate of 0.04%<br />
• Grimm et al, Arch Pathol Lab Med, 2010, US study<br />
• WBIT Rate of 0.04%
Total specimens received & WBIT incidences<br />
June – August 2011<br />
Jun ’11<br />
Jul ’11<br />
Aug ’11<br />
Total for<br />
3-month period<br />
Samples<br />
received<br />
24,023<br />
23,326<br />
23,797<br />
71,146<br />
No. of WBIT<br />
<strong>In</strong>cidences<br />
4<br />
5<br />
6<br />
15<br />
Average rate of<br />
WBIT per month<br />
One hospital accounted for 3 of the 15 WBIT<br />
incidences reported in this survey<br />
0.017%<br />
0.021%<br />
– a WBIT rate of 0.2% (or 1 in 503 specimens)<br />
0.025%<br />
0.021%<br />
This hospital had a mislabelling rate of 3.5%<br />
(or 1 in 4,743<br />
specimens)<br />
Range in WBIT incidences for the hospitals<br />
who responded is 0.0% to 0.2%
What have we learned from the study?<br />
• All respondents have policies and<br />
procedures<br />
• Training to the samplers is provided<br />
though with difficulty gaining access to<br />
medical staff<br />
• The data for mislabelling of specimens<br />
and WBIT incidents is comparable with<br />
international findings though with some<br />
variations
Where to go from here??<br />
• Does Ireland need a national common blood transfusion<br />
request form?<br />
– Who will design it?, will we be able to agree?<br />
• Does Ireland need a national common policy on sample<br />
acceptance, minimum requirements, use of<br />
addressograph label on request from etc,?<br />
• Will the use of electronic RFID help reduce the problem?<br />
• Does the use of phlebotomy staff help to reduce the<br />
error rate?<br />
• Does a zero-tolerance approach to mislabelling help to<br />
reduce the error rate?<br />
• How can some hospitals achieve a mislabelling rate of<br />
Any Questions?<br />
Or more importantly any<br />
suggestions?????<br />
……..Thank you!!!!