PMP Training

You also want an ePaper? Increase the reach of your titles
YUMPU automatically turns print PDFs into web optimized ePapers that Google loves.
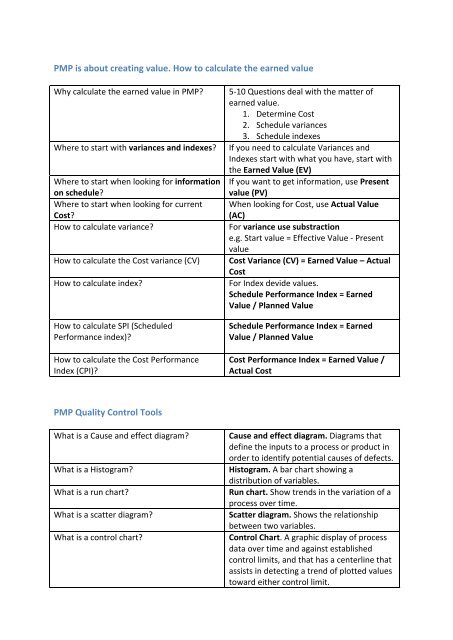
<strong>PMP</strong> is about creating value. How to calculate the earned value<br />
Why calculate the earned value in <strong>PMP</strong>? 5-‐10 Questions deal with the matter of<br />
earned value.<br />
1. Determine Cost<br />
2. Schedule variances<br />
3. Schedule indexes<br />
Where to start with variances and indexes? If you need to calculate Variances and<br />
Indexes start with what you have, start with<br />
the Earned Value (EV)<br />
Where to start when looking for information If you want to get information, use Present<br />
on schedule?<br />
value (PV)<br />
Where to start when looking for current When looking for Cost, use Actual Value<br />
Cost?<br />
(AC)<br />
How to calculate variance? For variance use substraction<br />
e.g. Start value = Effective Value -‐ Present<br />
value<br />
How to calculate the Cost variance (CV) Cost Variance (CV) = Earned Value – Actual<br />
Cost<br />
How to calculate index? For Index devide values.<br />
Schedule Performance Index = Earned<br />
Value / Planned Value<br />
How to calculate SPI (Scheduled<br />
Performance index)?<br />
How to calculate the Cost Performance<br />
Index (CPI)?<br />
<strong>PMP</strong> Quality Control Tools<br />
Schedule Performance Index = Earned<br />
Value / Planned Value<br />
Cost Performance Index = Earned Value /<br />
Actual Cost<br />
What is a Cause and effect diagram? Cause and effect diagram. Diagrams that<br />
define the inputs to a process or product in<br />
order to identify potential causes of defects.<br />
What is a Histogram? Histogram. A bar chart showing a<br />
distribution of variables.<br />
What is a run chart? Run chart. Show trends in the variation of a<br />
process over time.<br />
What is a scatter diagram? Scatter diagram. Shows the relationship<br />
between two variables.<br />
What is a control chart? Control Chart. A graphic display of process<br />
data over time and against established<br />
control limits, and that has a centerline that<br />
assists in detecting a trend of plotted values<br />
toward either control limit.