Department of Electrical and Computer Engineering Digital Signal ...
Department of Electrical and Computer Engineering Digital Signal ...
Department of Electrical and Computer Engineering Digital Signal ...
Create successful ePaper yourself
Turn your PDF publications into a flip-book with our unique Google optimized e-Paper software.
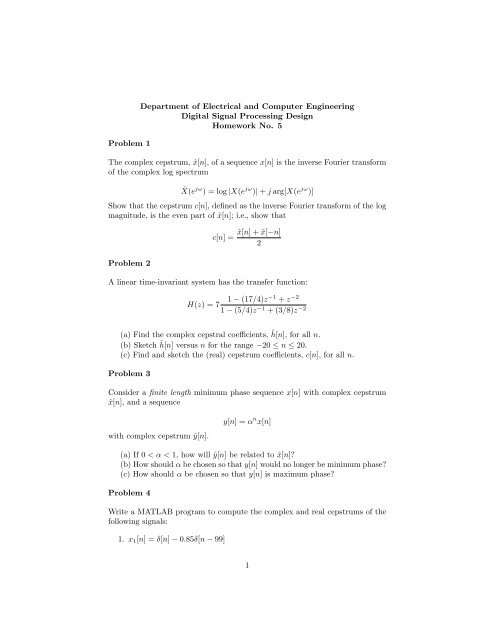
Problem 1<br />
<strong>Department</strong> <strong>of</strong> <strong>Electrical</strong> <strong>and</strong> <strong>Computer</strong> <strong>Engineering</strong><br />
<strong>Digital</strong> <strong>Signal</strong> Processing Design<br />
Homework No. 5<br />
The complex cepstrum, ˆx[n], <strong>of</strong> a sequence x[n] is the inverse Fourier transform<br />
<strong>of</strong> the complex log spectrum<br />
ˆX(e jω ) = log |X(e jω )| + j arg[X(e jω )]<br />
Show that the cepstrum c[n], defined as the inverse Fourier transform <strong>of</strong> the log<br />
magnitude, is the even part <strong>of</strong> ˆx[n]; i.e., show that<br />
Problem 2<br />
c[n] =<br />
ˆx[n] + ˆx[−n]<br />
2<br />
A linear time-invariant system has the transfer function:<br />
H(z) = 7<br />
1 − (17/4)z−1 + z−2 1 − (5/4)z−1 + (3/8)z−2 (a) Find the complex cepstral coefficients, ˆ h[n], for all n.<br />
(b) Sketch ˆ h[n] versus n for the range −20 ≤ n ≤ 20.<br />
(c) Find <strong>and</strong> sketch the (real) cepstrum coefficients, c[n], for all n.<br />
Problem 3<br />
Consider a finite length minimum phase sequence x[n] with complex cepstrum<br />
ˆx[n], <strong>and</strong> a sequence<br />
with complex cepstrum ˆy[n].<br />
y[n] = α n x[n]<br />
(a) If 0 < α < 1, how will ˆy[n] be related to ˆx[n]?<br />
(b) How should α be chosen so that y[n] would no longer be minimum phase?<br />
(c) How should α be chosen so that y[n] is maximum phase?<br />
Problem 4<br />
Write a MATLAB program to compute the complex <strong>and</strong> real cepstrums <strong>of</strong> the<br />
following signals:<br />
1. x1[n] = δ[n] − 0.85δ[n − 99]<br />
1
2πn<br />
2. x2[n] = sin<br />
100<br />
0 ≤ n ≤ 99<br />
3. x3[n] = 0.95 n 0 ≤ n ≤ 99<br />
4. a section <strong>of</strong> voiced speech<br />
5. a section <strong>of</strong> unvoiced speech<br />
For each <strong>of</strong> the first 3 signals, plot the waveform, the complex cepstrum, <strong>and</strong><br />
the real cepstrum. For the speech signals (numbers 4 <strong>and</strong> 5) plot the signal,<br />
the log magnitude spectrum, the real cepstrum, <strong>and</strong> the lowpass liftered log<br />
magnitude spectrum. Use the file test 16k.wav to test your program. Specify<br />
the unvoiced section as starting at sample 3400 in the file, <strong>and</strong> <strong>of</strong> duration 400<br />
samples. Specify the voiced section as starting at sample 13000 in the file, <strong>and</strong> <strong>of</strong><br />
duration 400 samples. Use a Hamming window before computing the cepstrums<br />
<strong>of</strong> the speech files.<br />
2


