1. Introduction: - ASSBT Proceedings
1. Introduction: - ASSBT Proceedings
1. Introduction: - ASSBT Proceedings

Create successful ePaper yourself
Turn your PDF publications into a flip-book with our unique Google optimized e-Paper software.
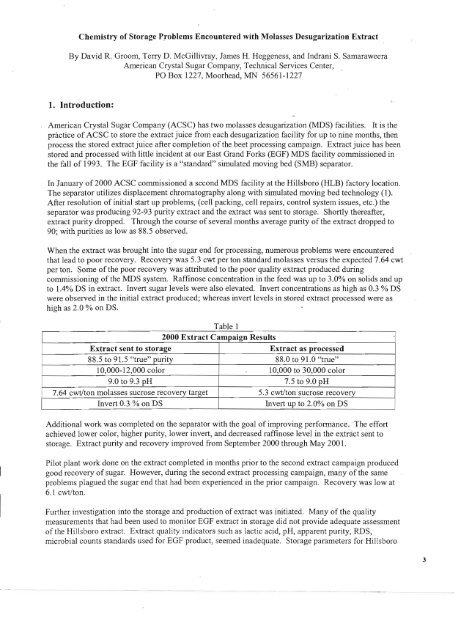
Chemistry of Storage Problems Encountered with Molasses Desugarization Extract<br />
By David R. Groom, Terry D. McGillivray, James H. Heggeness, and Indrani S. Samaraweera<br />
American Crystal Sugar Company, Technical Services Center,<br />
PO Box 1227, Moorhead, MN 56561-1227<br />
<strong>1.</strong> <strong>Introduction</strong>:<br />
American Crystal Sugar Company (ACSC) has two molasses desugarization(MDS) facilities. It is the<br />
practice of ACSC to store the extract juice from each desugarization facility for up to nine months, then<br />
process the stored extract juice after completion of the beet processing campaign. Extract juice has been<br />
stored and processed with little incident at our East Grand Forks (EGF) MDS facility commissioned in<br />
the fall of 1993. The EGF facility is a "standard" simulated moving bed (SMB) separator.<br />
In January of 2000 ACSC commissioned a second MDS facility at the Hillsboro (HLB) factory location.<br />
The separator utilizes displacement chromatography along with simulated moving bed technology (1).<br />
After resolution of initial start up problems, (cell packing, cell repairs, control system issues, etc.) the<br />
separator was producing 92-93 purity extract and the extract was sent to storage. Shortly thereafter,<br />
extract purity dropped. Through the course of several months average purity of the extract dropped to<br />
90; with purities as low as 88.5 observed.<br />
When the extract was brought into the sugar end for processing, numerous problems were encountered<br />
that lead to poor recovery. Recovery was 5.3 cwt per ton standard molasses versus the expected 7.64 cwt<br />
per ton. Some of the poor recovery was attributed to the poor quality extract produced during<br />
commissioning of the MDS system. Raffinose concentration in the feed was up to 3.0% on solids and up<br />
to <strong>1.</strong>4% DS in extract. Invert sugar levels were also elevated. Invert concentrations as high as 0.3 % DS<br />
were observed in the initial extract produced; whereas invert levels in stored extract processed were as<br />
high as 2.0 % on DS.<br />
Table I<br />
2000 Extract Campaign Results<br />
Extract sent to storage Extract as processed<br />
88.5 to 9<strong>1.</strong>5 "true" purity 88.0 to 9<strong>1.</strong>0 "true"<br />
10,000-12,000 color 10,000 to 30,000 color<br />
9.0 to 9.3 pH 7.5 to 9.0 pH<br />
7.64 cwt/ton molasses sucrose recovery target 5.3 cwt/ton ;sucrose recovery<br />
Invert 0.3 % on DS Invert up to 2.0% on DS<br />
Additional work was completed on the separator with the goal of improving performance. The effort<br />
achieved lower color, higher purity, lower invert, and decreased raffinose level in the extract sent to<br />
storage. Extract purity and recovery improved from September 2000 through May 200<strong>1.</strong><br />
Pilot plant work done on the extract completed in months prior to the second extract campaign produced<br />
good recovery of sugar. However, during the second extract processing campaign, many of the same<br />
problems plagued the sugar end that had been experienced in the prior campaign. Recovery was low at<br />
6.1 cwt/ton.<br />
Further investigation into the storage and production of extract was initiated. Many of the quality<br />
measurements that had been used to monitor EGF extract in storage did not provide adequate assessment<br />
of the Hillsboro extract. Extract quality indicators such as lactic acid, pH, apparent purity, RDS,<br />
microbial counts standards used for EGF product, seemed inadequate. Storage parameters for Hillsboro<br />
\.<br />
3
4<br />
extract had been set initially to those of EGF product; RDS of 68.S, temperature below 2SoC, pH target of<br />
nme.<br />
Table 2<br />
2001 Extract Campaign Results<br />
Extract sent to storage Extract as processed<br />
90.0 to 94.0 IC purity* 89.S to 93.S IC purity* \.<br />
8000-9000 color 8000 to 20,000 color<br />
9.4 to 9.6 pH 9.1 pH<br />
7.64 cwt/ton molasses sucrose recovery target 6.1 cwt/ton sucrose recovery<br />
Invert 0.1 % on DS Invert up to 2.9% on DS (1 tank)<br />
*IC purity refers to purity determined by ion chromatography.<br />
In reviewing data, it was found that invert levels in the extract had increased in storage. Invert levels<br />
were found to be higher in the Hillsboro extract entering the factory than when the extract went into<br />
storage. Since high color was a major issue in processing the extract, we expressed the color on<br />
nonsugars as described in Sugar Technology (2). The Hillsboro extract color to nonsugar (CINS) ratio<br />
was found to be higher than normally encountered in previous extract processing at EGF or in HLB thick<br />
juice. Additional tests indicated that water activity and buffering capacity of the Hillsboro extract were<br />
different than the EGF extract. Biocides such as formaldehyde, hops beta acids, and sulfur dioxide had no<br />
impact on stored extract stability. Investigation into the extract processing/storage issue proceeded along<br />
several paths.<br />
In order to evaluate conditions required to store Hillsboro extract, a comprehensive study was conducted<br />
to look at the impact of various variables on the stability of the Hillsboro extract. An accelerated storage<br />
study was completed using coupled loop extract from Hillsboro and extract from our East Grand Forks<br />
facility. Samples were incubated at 50°C to accelerate reaction rates. Hillsboro extract was observed to<br />
decrease in purity and pH with an increase in color and invert with little change in microbial counts or<br />
lactic acid. Similar results had been observed in the tanks but occurred over a longer time frame.<br />
Ion chromatographic data indicated that concentration of invert was correlated with the degree ofjuice<br />
degradation. Increased concentration of invert in the stored extract was not correlated with increased<br />
microbial counts, lactic acid or other signs of microbial infection (3). Based on the prior mentioned<br />
observations, we investigated other causes for juice degradation including chemical and enzymatic<br />
activity. Invert sugar as determined by IC was found to be an effective predictor ofjuice degradation (3).<br />
Invertase activity was found in the pH range of 8 to 10.0, negligible at pH 1O.S, no activity noted at pH<br />
1<strong>1.</strong> High pH and pasteurization were found to mitigate degradation.<br />
Recommendations to monitor invert in production and storage extract gave us sufficient early warning to<br />
process a tank in time to avoid significant loss. Even though microbial counts in the stored extract didn't<br />
seem high enough to indicate problems, tracking invert allowed us to indirectly monitor enzymatic<br />
(invertase) activity. High nitrite levels that appeared in the extract evaporator loop indicated problems<br />
with the evaporators. In our studies, elevated nitrite was associated with unstable extract. Elevated micro<br />
counts were found in the extract evaporator loop. Interestingly, microbial counts did not always correlate<br />
to high nitrite levels (4). It was suggested that the temps (SO-SS°C) in the extract evaporators were ideal<br />
for certain microbes to proliferate. A recommendation was made to raise the temperature in the extract<br />
evaporator loop to a minimum of 7S°C. In addition, the pH of the extract prior to evaporators was raised<br />
to 10.5. Microbial and nitrite data indicated a decrease in microbial activity in the extract. Increased<br />
temperature in the water loop decreased sliming of check filters, indicating a reduction in microbial load<br />
to the trains.
2. Materials and Methods:<br />
Sample collection: Samples were collected from various points in the MDS processing facility, extract<br />
storage tanks, and sugar end stations. Purging of sampling ports/valves was done before collection of<br />
samples. Samples were collected using appropriate aseptic method and placed in sterile containers. All<br />
subsequent handling of samples was accomplished using sterile techniques. Accelerated storage test<br />
samples were placed in an incubator and kept at 50°C for the duration ofthe test period. Sub samples<br />
were taken periodically from the accelerated storage test containers via sterile pipette for analytical and<br />
microbial analysis.<br />
Analytical methods, chemical analysis: Wet chemical analysis was completed'using standard ICUMSA<br />
methods. Determination of pH was done by using a Ross combination electrode and an Orion pH meter.<br />
Apparent purity was determined on a Rudolph AutoPol 880 using 880 nm wavelength and a 10 cm cell.<br />
RDS was determined on a Bausch and Lomb refractometer. Color was determined by measuring<br />
absorbance on a Milton Roy Spectronic 21 D using a 1 cm cell. Samples were adjusted to pH 7 before<br />
absorbance was read. Water activity was measured with an Aqualab CX2; 0.78 N NaCl was used as a<br />
calibration standard. Invert (glucose and fructose) and sucrose concentrations were determined on a<br />
Oionex OX 500 Ion Chromatograph (IC) unit, using a Carbopac PAl colulllil an ED 40 detector in the<br />
PAD mode. The system was operated in isocratic mode at 22°C. Eluent was 200 millimolar sodium<br />
hydroxide kept under pressurized helium. Acetic, butyric, formic, lactic, and propionic acids were<br />
determined on Waters 500 series HPLCs using refractive index detection in isocratic mode. Eluent for<br />
the HPLC was a 5 millimolar sulfuric acid mobile phase; a BioRad Aminex HPX-87H colulllil was used<br />
at 35°C. Betaine was determined with the Waters HPLC using a Bio-Rad Aminex HPX-87N colulllil,<br />
eluent at 0.6 mllminute 10 millimolar sodium sulfate and refract index detector. Nitrite concentration was<br />
estimated by using EM Quant test strips, samples were diluted with de-ionized water before reading.<br />
Microbial analysis included: Mesophilic, thermophilic, regular and osmophilic yeast and mold counts.<br />
In addition, flat sours, total thermophilic spore, along with thermophilic anaerobes producing H2S, and<br />
thermophilic anaerobes not producing H2S were counted. The methods used are described in detail by<br />
Samaraweera et al (4).<br />
Accelerated Laboratory Storage Testing:<br />
Accelerated storage studies were started in July 2001 and continued in various form until December 2002.<br />
Most of the studies ran from 6 to 10 weeks. All accelerated storage trials (AST) involved collecting<br />
extract from tanks or production extract to tanks and placing in sterile HDPP 1 'or 3 liter containers.<br />
Samples were then incubated at 50°C. Aliquots were drawn for chemical analysis at regular intervals.<br />
Aliquots were also drawn from AST samples on selected trials and microbial analysis completed. Details<br />
of the microbial results are addressed by Samaraweera et al. (4). Method details of various trials<br />
conducted will be addressed in Results and Discussion section of this paper.<br />
3. Results:<br />
Trial 1: Involved collection of production extracts on July 19, 2001 from EGF and HLB. Samples were<br />
placed in 3 liter containers and stored at 50°C. In addition, two 3 liter samples were stored at ambient<br />
temperature. The test ran for 10 weeks. Samples incubated at 50°C will be referred to as the AST<br />
sample.<br />
At the end of the 10 week trial period, there were obvious differences noted between the EGF and HLB<br />
extract AST samples. Purity as measure by IC dropped 0.6 points in the EGF extract while the HLB<br />
extract purity dropped 4 points as shown in figure <strong>1.</strong> Both ambient samples had little change in purity.<br />
As shown in figure 2, the HLB extract AST sample increased in color from 7700 to 24,000. The EGF<br />
AST sample color increased from 7600 to 14,000. Note in figure 3 that the pH dropped significantly in<br />
the HLB AST sample, from 9.6 to 7.l. Figure 4 shows that invert in the HLB AST sample increased 16<br />
5
<br />
% Retain AP<br />
X = A: Purity HLB<br />
Y = B: pH HLB<br />
Actual Factor<br />
C: RDS= 70<br />
% Color rise<br />
X = A: Purity HLB<br />
Y = B: pH HLB<br />
Actual Factor<br />
C: RDS= 70<br />
188<br />
173<br />
157<br />
% Color n58 142<br />
126<br />
B: pH HLB<br />
1<strong>1.</strong>0<br />
10.5<br />
10.0<br />
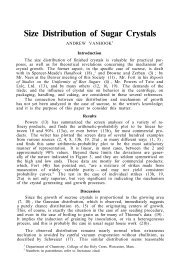
Figure 6<br />
9.5 95.5<br />
9.0 95 .0<br />
Figure 7<br />
B: pH HLB 9.5 95 .5<br />
9.0 95 .0<br />
96.5<br />
A: PurityHLB<br />
96.0<br />
96 .5<br />
A: Purily HLB<br />
97.0<br />
9
. . _ ._<br />
14<br />
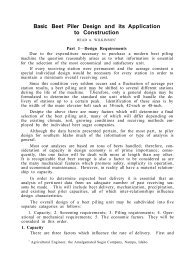
Note the predicted response for color below. Color is the highest at the highest invert level, which<br />
occurred at the lowest pH (9). At pH 11, invert increase was low, regardless of the invertase addition.<br />
Invert increase in the samples were also minimal when no invertase was added regardless of the pH. For<br />
this trial, high pH treatment clearly stopped invertase activity.<br />
Color<br />
X = A: pH<br />
Y = B: Invertase 30772<br />
25616<br />
20464<br />
Color 15310<br />
10157<br />
10.0<br />
% Invert<br />
X = A: pH<br />
Y = B: Invertase 20.9<br />
% Invert<br />
15.7<br />
10.4<br />
B: Invertase<br />
5.2<br />
0.0<br />
100<br />
0.0 9,0<br />
Figure 15<br />
Figure 16<br />
B: Invertase 2.5 9.5<br />
0,0 9,0<br />
10.5<br />
A: Alkalinity<br />
A: pH
Trial 10: In Trial 10, the focus was on the impact/interactions of invert and pH on the stability of<br />
Hillsboro extract (6). The HLB extract was autoclaved, and then treated with acid or base to adjust pH.<br />
In addition, a sterile preparation of invert sugar solution was added to the extract. Levels of invert were<br />
0.02 to 0.07% on extract after autoclaving. Invert was adjusted to targets of 1 and 2% on sample as<br />
required at the start of the trial. Extract pH was also adjusted; the initial targets were 9, 10, and 1<strong>1.</strong><br />
A slight IC purity drop of 0.2 to 0.5 units was noted for the treatments. Interesting differences were found<br />
for other measured responses as noted in Table 7 below. At low invert level, color was unaffected by pH.<br />
As pH and invert level increased, color increased. Color increase was the bighest at high pH and high<br />
invert level. The greatest increase in acetic acid was observed under conditions of high pH and invert. At<br />
low levels of invert, acetic acid increased little regardless ofpH. At low pH, acetic acid level was less<br />
influenced by invert level. Lactic acid concentrations varied little between treatments.<br />
Table 7<br />
Treatments Initial Data Ending Data<br />
Trial # 10 Color % Invert Acetic ppm Color % Invert Acetic2pm<br />
0% Invert, pH 9 10,370 0.020 342 13,140 0.008 388<br />
2% Invert, pH 9 10,060 <strong>1.</strong>987 331 28,160 <strong>1.</strong>158 988<br />
0% Invert, pH 11 10,000 0.012 350 11,470 0.008 392<br />
2% Invert, pH 11 9580 <strong>1.</strong>773 331 46,310 0.018 2362<br />
Discussion:<br />
The major issues regarding extract were increased color in storage, high color in sugar end processing,<br />
low buffering capacity, decreased purity in storage, and increased invert levels.<br />
Early in the campaign 2001 recommendations were made to keep RDS above 69.5, the pH at 9.5, and<br />
temp to storage less than 20°C. Sargent indicated that stability was noticeably improved ifjuice was<br />
stored at 10°C (3, 7). With improved cooling equipment we were able to target and hold 15°C to storage.<br />
To prevent microbial loading into the system finer filter media was used for filtering the feed molasses.<br />
Recommendations were considered the usual target values for juice storage in the sugar industry. While<br />
these measures may have helped stabilize the extract somewhat, they were insufficient to maintain desired<br />
extract quality in storage. Further investigative work was required to address the storage issue.<br />
Through all the testing, East Grand Forks extract was more stable (chemically) than Hillsboro extract.<br />
Various treatments to improve stability of Hillsboro extract were not effective. The ineffective treatments<br />
included beta acid hops, sulfur dioxide, and formaldehyde.<br />
Buffering capacity of the Hillsboro extract was found to be 2 to 5 times lower than EGF extract. As the<br />
degradation reaction occurred, a lack of buffering capacity led to an accelerated pH drop which in turn<br />
increased enzymatic, microbial, and chemical degradation. In our studies, juice that was buffered did not<br />
degrade as rapidly. Based on test results, a recommendation was made to raise the pH of the extract sent<br />
to storage. Raising the pH to 10.5 also retarded enzymatic and microbial activity. In addition, the action<br />
increased buffering capacity of the extract. While the course of action did not address the root cause, the<br />
juice was stabilized. Invert levels were held in check with the high pH treatment. Also to lower the rate<br />
of reactions a recommendation was made to lower the target temp ofjuice to storage to 15°C or less.<br />
Since water activity impacts rates ofchemical and biological processes, we tested stability of Hillsboro<br />
extract at a range of RDS from 68 to 72. In our studies we did not see any significant difference between<br />
extract stored at 70 or 72 RDS. There may have been some contribution to the problem when extract was<br />
sent out to storage at 68 RDS. The recommendation to elevate the RDS to above 69.5 reduced water<br />
activity impact.<br />
15
-----'"<br />
18<br />
7. Sargent, D.; Briggs, s.; Spencer, S. (1997): Thickjuice degradation during storage. Zuckerindustrie. 122, Nr.<br />
8, pp. 615-621<br />
8. Bruijn, de, <strong>1.</strong>M: Kieboom, A.P.P.; Bekkum, van, A. (1986): Sugar Teclmology Review 13, pp 21-52.<br />
9. Bruijn, de, <strong>1.</strong>M; Struijs, <strong>1.</strong>; Bout-Diederen, M (1998): Sugar degradation and colour fonnation. <strong>Proceedings</strong>,<br />
SPRl Conference. Savannah, GA, USA pp 127-143.<br />
10. Madsen, R.F.; Nielsen, WK. ; Winstrom-Olsen, B.; Nielsen, TE. (1978-79): Fonnation of colour compounds in<br />
production of sugar from sugar beet. Sugar Teclmology Reviews, 6, pp 49-115.<br />
II. Godshall, M A. (1992): Isolation of a high molecular weight colorant from white beet sugar. <strong>Proceedings</strong>, 1992<br />
Sugar Proc. Res. Conf., pp 312-323.