PSTricks - CTAN
PSTricks - CTAN
PSTricks - CTAN

Create successful ePaper yourself
Turn your PDF publications into a flip-book with our unique Google optimized e-Paper software.
<strong>PSTricks</strong><br />
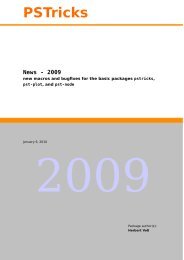
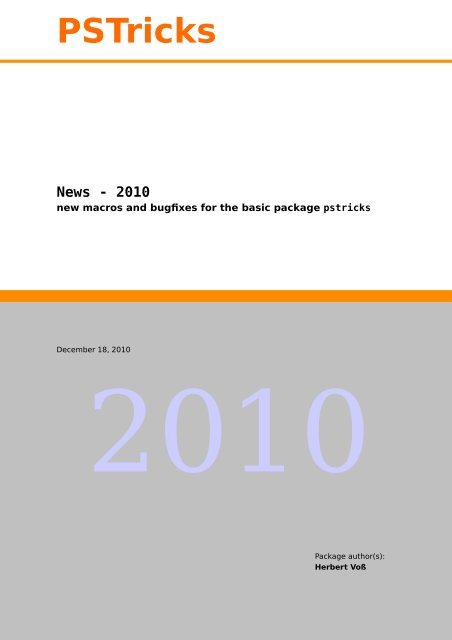
News - 2010<br />
new macros and bugfixes for the basic package pstricks<br />
December 18,2010<br />
2010<br />
Package author(s):<br />
Herbert Voß
Contents 2<br />
Contents<br />
I. pstricks – package 3<br />
1. General 3<br />
2. pstricks.sty 3<br />
2.1. New optional argument . . . . . . . . . . . . . . . . . . . . . . . . . . . . . . 3<br />
3. pstricks.tex (2.16– 2010/12/18) 3<br />
3.1. Coordinates . . . . . . . . . . . . . . . . . . . . . . . . . . . . . . . . . . . . . 3<br />
3.2. New optional arguments . . . . . . . . . . . . . . . . . . . . . . . . . . . . . . 4<br />
3.3. Macro \psellipse . . . . . . . . . . . . . . . . . . . . . . . . . . . . . . . . . 8<br />
3.4. Macro \psellipticarc . . . . . . . . . . . . . . . . . . . . . . . . . . . . . . 8<br />
3.5. Option algebraic . . . . . . . . . . . . . . . . . . . . . . . . . . . . . . . . . . 10<br />
4. New linestyle symbol 12<br />
5. Numeric functions 17<br />
6. Numeric functions 17<br />
6.1. \pstFPadd, \pstFPsub, \pstFPmul, and \pstFPdiv . . . . . . . . . . . . . . . 17<br />
6.2. \pstFPMul and \pstFPDiv . . . . . . . . . . . . . . . . . . . . . . . . . . . . . 18<br />
7. The PostScript header files 18<br />
7.1. pstricks.pro . . . . . . . . . . . . . . . . . . . . . . . . . . . . . . . . . . . . 18<br />
7.2. pst-algparser.pro . . . . . . . . . . . . . . . . . . . . . . . . . . . . . . . . 19<br />
7.3. IfTE . . . . . . . . . . . . . . . . . . . . . . . . . . . . . . . . . . . . . . . . . 20<br />
7.4. Derive function . . . . . . . . . . . . . . . . . . . . . . . . . . . . . . . . . . . 22<br />
7.5. Special arrow option arrowLW . . . . . . . . . . . . . . . . . . . . . . . . . . . 22<br />
8. \psforeach and \psForeach 24<br />
II. pst-node – package 25<br />
9. pst-node.tex 25<br />
III. pst-plot – package 25<br />
10.pst-plot.tex 25<br />
11.List of all optional arguments for pstricks 26<br />
References 26
1. General 3<br />
Part I.<br />
pstricks – package<br />
1. General<br />
There exists a new document class pst-doc for writing <strong>PSTricks</strong> documentations, like<br />
thisnewsdocument. ItdependsontheKOMA-Scriptdocumentclassscrartcl. pst-doc<br />
defines a lot of special macros to create a good index. Take one of the already existing<br />
packagedocumentationandlookintothesourcefile. Thenitwillbeeasytounderstand,<br />
how all these macros have to be used.<br />
When running pdflatex the title page is created with boxes and inserted with the<br />
macro \AddToShipoutPicture from the package eso-pic. It inserts the background<br />
title page image pst-doc-pdf to use directly pdflatex. When running latex the title<br />
page is created with <strong>PSTricks</strong> macros.This allows to use the Perl script pst2pdf or<br />
the package pst-pdf or auto-pst-pdf or any other program/package which supports<br />
PostScript code in the document.<br />
2. pstricks.sty<br />
2.1. New optional argument<br />
Withthe settingof the optional argumentpdf thepackageauto-pst-pdf will be loaded<br />
by <strong>PSTricks</strong>. This requires that you run pdflatex as<br />
pdflatex --shell-escape % T E XLive users<br />
pdflatex --enable-write18 % MiKT E X users<br />
The package exports the pspicture environments into single images which are col-<br />
lectedinacreatedfile-pics.pdf andinsertedautomaticallyinthelastpdflatex<br />
run.<br />
3. pstricks.tex (2.16– 2010/12/18)<br />
3.1. Coordinates<br />
With the setting \SpecialCoor the package allows different kinds of coordinates. The<br />
macro\uputcannowbe usedinadifferent way. Thedefaultbehaviour fornodeswitha<br />
relative point puts its argument without rotation on the line AB. When using the prefix<br />
> before the node or the x-value for cartesian coordinates, the behaviour is different.<br />
Now the angle between the line OB and the horizontal line is taken into account and<br />
the placement of the argument of \uput is different to the default behaviour.
6<br />
5<br />
4 <br />
3<br />
2<br />
1<br />
0<br />
3.2. New optionalarguments 4<br />
bar<br />
foo<br />
0 1 2 3 4 5<br />
<br />
3.2. New optional arguments<br />
1 \begin{pspicture}[showgrid](5,6)<br />
2 \pnode(0,4){A}\psdot(A)<br />
3 \pnode(3,2){B}\psdot(B)<br />
4 \psline(A)(B)<br />
5 \psline[linestyle=dashed](A)(3,4)<br />
6 \psline[linestyle=dashed](A)(3,6)<br />
7 \psline[linestyle=dashed](B)<br />
8 \uput{1cm}[(B)](A){foo}<br />
9 \uput{1cm}[(B)](>A){bar}<br />
10 \end{pspicture}<br />
The new arguments are only valid for the macros \psellipse, \pscircle, \psarc.<br />
\psellipticarc, \pscurve, \psplot, and \psparametricplot.<br />
name type default description<br />
dashcolor color \relax for colored dashed lines<br />
startLW length \pslinewidth starting linewidth<br />
endLW length \pslinewidth ending linewidth<br />
startWL integer 380 starting wave length<br />
endWL integer 780 ending wave length<br />
variableLW boolean false use variable linewidth<br />
variableColor boolean false use variable color<br />
1 \psset{linewidth=2mm,linestyle=dashed}<br />
2 \begin{pspicture}(4,-4)<br />
3 \psline[linecolor=blue,dashcolor=red,linearc=0.5](0,0)(4,0)(4,-4)<br />
4 \psline[linecolor=blue,dashcolor=cyan,linearc=0.5](0,0)(0,-4)(4,-4)<br />
5 \end{pspicture}\quad<br />
6 \begin{pspicture}(4,4)<br />
7 \psframe[linecolor=blue,dashcolor=green,framearc=0.5](0,0)(4,4)<br />
8 \end{pspicture}<br />
9 \quad \psset{linecap=2,dash=5mm 5mm }<br />
10 \begin{pspicture}(4,-4)<br />
11 \psline[linecolor=black,dashcolor=black!40,linecap=0](0,0)(4,-4)<br />
12 \psline[linecolor=blue,dashcolor=red,linearc=0.5](0,0)(4,0)(4,-4)
3.2. New optionalarguments 5<br />
13 \psline[linecolor=blue,dashcolor=cyan,linearc=0.5](0,0)(0,-4)(4,-4)<br />
14 \end{pspicture}<br />
1 \psset{endLW=15pt}<br />
2 \begin{pspicture}(-3.5,-2.5)(3.5,2.5)<br />
3 \psellipse[linejoin=2,variableLW,startLW=1pt,<br />
4 linecolor=green!40](0,0)(3,1)<br />
5 \end{pspicture}<br />
1 \psset{endLW=15pt}<br />
2 \begin{pspicture}(-2.5,-2.5)(2.5,2.5)<br />
3 \pscircle[variableLW,startLW=1pt,<br />
4 linecolor=blue!40]{2}<br />
5 \end{pspicture}<br />
1 \psset{endLW=15pt}<br />
2 \begin{pspicture}(-2.5,-2.5)(2.5,2.5)<br />
3 \psarc[variableLW,startLW=1pt,<br />
4 linecolor=red!40](0,0){2}{10}{300}<br />
5 \end{pspicture}<br />
1 \psset{endLW=15pt}<br />
2 \begin{pspicture}(-3.5,-2.5)(3.5,2.5)<br />
3 \psellipticarc[variableLW,startLW=1pt,<br />
4 linecolor=black!40](0,0)(3,1){90}{30}<br />
5 \end{pspicture}
3.2. New optionalarguments 6<br />
1 \begin{pspicture}(-5,-3)(5,3)<br />
2 \psplot[variableLW,startLW=1pt,endLW=20pt,<br />
3 linecolor=magenta!60,variableColor,<br />
4 algebraic,plotpoints=3000,startWL=500,<br />
5 endWL=700]{-5}{5}{2*sin(2*x)+cos(x)}<br />
6 \end{pspicture}<br />
1 \begin{pspicture}(-2.5,-2.5)(2.5,2.5)<br />
2 \pscurve[variableLW,startLW=1pt,endLW=20pt,<br />
3 variableColor](-1,0.5)(-2,1)(2,2)(-1,-2)(2,-2)<br />
4 \end{pspicture}<br />
1 \begin{pspicture}(-2.5,-2.5)(2.5,2.5)<br />
2 \pscurve[variableLW,startLW=1pt,endLW=20pt]%<br />
3 (-1,0.5)(-2,1)(2,2)(-1,-2)(2,-2)<br />
4 \end{pspicture}
3.2. New optionalarguments 7<br />
1 \psset{endLW=24pt}<br />
2 \begin{pspicture}(-5,-5)(5,5)<br />
3 \psparametricplot[variableLW,startLW=1pt,<br />
4 endLW=60pt,linecolor=red,variableColor,<br />
5 algebraic,plotpoints=3000,plotstyle=curve,<br />
6 opacity=0.4,strokeopacity=0.4,<br />
7 endWL=600]{-5}{5}{t*sin(t) | t*cos(t)}<br />
8 \end{pspicture}
3.3. Macro \psellipse 8<br />
3.3. Macro \psellipse<br />
To rotate an ellipse the already existing keyword rot can be used. This is easier than<br />
using the \rput command and its optional argument for rotating.<br />
3.4. Macro \psellipticarc<br />
1 \psset{unit=0.25}<br />
2 \begin{pspicture}(-1,5)(20,18)<br />
3 \psclip{\psellipse[linecolor=red,<br />
4 rot=-12.606](5.821,10.04)(6.633,5.103)}<br />
5 \psellipse[linecolor=blue,fillstyle=vlines,<br />
6 rot=39.29](13.141,11.721)(6.8,5.4)<br />
7 \endpsclip<br />
8 \psellipse[linecolor=blue,rot=39.29](13.1,11.7)(6.8,5.4)<br />
9 \end{pspicture}<br />
10<br />
11 \begin{pspicture}(-1,5)(20,18)<br />
12 \psellipse[linecolor=blue,rot=-39.29,<br />
13 fillstyle=vlines](13.1,11.7)(6.8,5.4)<br />
14 \psclip{\psellipse[linecolor=red,rot=12.6,<br />
15 fillstyle=vlines](5.8,10)(6.6,5.1)}<br />
16 \psellipse*[linecolor=white,rot=-39.29](13.1,11.7)<br />
(6.8,5.4)<br />
17 \endpsclip<br />
18 \psellipse[linecolor=blue,rot=-39.29](13.1,11.7)<br />
(6.8,5.4)<br />
19 \psellipse[linecolor=red,rot=12.6](5.8,10)(6.6,5.1)<br />
20 \end{pspicture}<br />
In a circle the angle is proportional to the bow: b = rα. In an elliptic arc this is no more<br />
the case, which is the reason why angles are internally corrected by <strong>PSTricks</strong>, to get<br />
the same arc lengthts for different radii:<br />
1 \psset{unit=0.5cm}<br />
2 \begin{pspicture}(-5.5,-5.5)(5.5,5.5)%<br />
3 \psset{linewidth=0.4pt,linejoin=1}<br />
4 \psline(5,0)(0,0)(5,-5)<br />
5 \psellipticarc(0,0)(3,3){0}{315}<br />
6 \end{pspicture}%
3.4. Macro \psellipticarc 9<br />
1 \psset{unit=0.5cm}<br />
2 \begin{pspicture}(-5.5,-5.5)(5.5,5.5)%<br />
3 \psset{linewidth=0.4pt,linejoin=1}<br />
4 \psline(5,0)(0,0)(5,-5)<br />
5 \psellipticarc(0,0)(1,3){0}{315}%<br />
6 \psset{linecolor=red}<br />
7 \psellipticarc(0,0)(3,1){22}{222}%<br />
8 \psline(3;22)\psline(3;222)<br />
9 \end{pspicture}%<br />
1 \psset{unit=0.5cm}<br />
2 \begin{pspicture}(-5.5,-5.5)(5.5,5.5)%<br />
3 \psset{linewidth=0.4pt,linejoin=1}<br />
4 \psline(5,0)(0,0)(5,-5)<br />
5 \psellipticarc*(0,0)(1,3){0}{315}%<br />
6 \psset{linecolor=red}<br />
7 \psellipticarc*(0,0)(3,1){22}{222}%<br />
8 \psline(3;22)\psline(3;222)<br />
9 \end{pspicture}%<br />
Ifyoudonotwanttheanglecorrection,thenusethekeywordsettingcorrectAngle=false:<br />
1 \psset{unit=0.5cm}<br />
2 \begin{pspicture}(-5.5,-5.5)(5.5,5.5)%<br />
3 \psset{linewidth=0.4pt,linejoin=1,<br />
4 correctAngle=false}<br />
5 \psline(5,0)(0,0)(5,-5)<br />
6 \psellipticarc(0,0)(1,3){0}{315}%<br />
7 \psset{linecolor=red}<br />
8 \psellipticarc(0,0)(3,1){22}{222}%<br />
9 \psline(3;22)\psline(3;222)<br />
10 \end{pspicture}%
3.5. Option algebraic 10<br />
3.5. Option algebraic<br />
1 \psset{unit=0.5cm}<br />
2 \begin{pspicture}(-5.5,-5.5)(5.5,5.5)%<br />
3 \psset{linewidth=0.4pt,linejoin=1,<br />
4 correctAngle=false}<br />
5 \psline(5,0)(0,0)(5,-5)<br />
6 \psellipticarc*(0,0)(1,3){0}{315}%<br />
7 \psset{linecolor=red}<br />
8 \psellipticarc*(0,0)(3,1){22}{222}%<br />
9 \psline(3;22)\psline(3;222)<br />
10 \end{pspicture}%<br />
The option algebraic moved from the other packages into the main package pstricks<br />
to get rid of the dependencies.<br />
By default the function in \psplot has to be described in Reversed Polish Notation.<br />
The option algebraic allows you to do this in the common algebraic notation. E.g.:<br />
RPN algebraic<br />
x ln ln(x)<br />
x cos 2.71 x neg 10 div exp mul cos(x)*2.71^(-x/10)<br />
1 x div cos 4 mul 4*cos(1/x)<br />
t cos t sin cos(t)|sin(t)<br />
Setting the option algebraic, allow the user to describe all expression to be written<br />
in the classical algebraic notation (infix notation). The four arithmetic operations are<br />
obviously defined +-*/, and also the exponential operator ^. The natural priorities are<br />
used : 3 + 4 × 5 5 = 3 + (4 × (5 5 )), and by default the computation is done from left to<br />
right. The following functions are defined :<br />
sin, cos, tan, acos, asin in radians<br />
log, ln<br />
ceiling, floor, truncate, round<br />
sqrt square root<br />
abs absolute value<br />
fact for the factorial<br />
Sum for building sums<br />
IfTE for an easy case structure<br />
These options can be used with all plot macros.<br />
Using the option algebraic implies that all angles have to be in radians!<br />
For the \parametricplot the two parts must be divided by the | character:<br />
1 \begin{pspicture}(-0.5,-0.5)(0.5,0.5)<br />
2 \parametricplot[algebraic,linecolor=red]{-3.14}{3.14}{cos(t)|sin(t<br />
)}<br />
3 \end{pspicture}
3.5. Option algebraic 11<br />
8<br />
7<br />
6<br />
5<br />
4<br />
3<br />
2<br />
1<br />
0<br />
<br />
<br />
<br />
<br />
<br />
<br />
<br />
<br />
<br />
<br />
<br />
<br />
<br />
<br />
<br />
<br />
<br />
<br />
<br />
<br />
<br />
<br />
<br />
<br />
<br />
<br />
<br />
<br />
<br />
−3π −2π −π<br />
1 \psset{lly=-0.5cm}<br />
0.5<br />
−0.5 <br />
−1.0<br />
y<br />
<br />
<br />
<br />
<br />
<br />
<br />
<br />
<br />
<br />
<br />
<br />
<br />
<br />
<br />
<br />
<br />
<br />
<br />
<br />
<br />
<br />
<br />
<br />
<br />
<br />
<br />
π 2π 3π<br />
<br />
<br />
<br />
<br />
<br />
<br />
<br />
<br />
2 \psgraph[trigLabels,dx=\psPi,dy=0.5,Dy=0.5]{->}(0,0)(-10,-1)(10,1){\linewidth<br />
}{6cm}<br />
3 \psset{algebraic,plotpoints=1000}<br />
4 \psplot[linecolor=yellow,linewidth=2pt]{-10}{10}{0.75*sin(x)*cos(x/2)}<br />
5 \psplot[linecolor=red,showpoints=true,plotpoints=101]{-10}{10}{0.75*sin(x)*<br />
cos(x/2)}<br />
6 \endpsgraph<br />
y <br />
<br />
<br />
<br />
<br />
<br />
<br />
<br />
<br />
0 1 2 3 4 5 6 7<br />
x<br />
8 9 10 11 12 13 14 15 16 17 18<br />
1 \psset{lly=-0.5cm}<br />
<br />
<br />
<br />
<br />
<br />
<br />
<br />
<br />
<br />
<br />
<br />
<br />
<br />
<br />
2 \psgraph(0,-5)(18,3){0.9\linewidth}{5cm}<br />
3 \psset{algebraic,plotpoints=501}<br />
<br />
<br />
<br />
<br />
<br />
<br />
<br />
<br />
<br />
<br />
<br />
4 \psplot[linecolor=yellow, linewidth=4\pslinewidth]{0.01}{18}{ln(x)}<br />
5 \psplot[linecolor=red]{0.01}{18}{ln(x)}<br />
6 \psplot[linecolor=yellow,linewidth=4\pslinewidth]{0}{18}{3*cos(x)*2.71^(-x<br />
/10)}<br />
7 \psplot[linecolor=blue,showpoints=true,plotpoints=51]{0}{18}{3*cos(x)*2.71^(-<br />
x/10)}<br />
8 \endpsgraph<br />
<br />
<br />
<br />
x
4. Newlinestylesymbol 12<br />
4. New linestyle symbol<br />
Instead of drawing a continous line or curve for a series of coordinates, one can now<br />
out a symbol in a given size, direction, and step. This works only for the line style<br />
symbol. It takes the symbol defined by the optional argument symbol, which can have<br />
a single character or a octal number of three digits. The font is specified by the key<br />
symbolFont, which can take as argument one of the valid PostScript fonts or the in-<br />
ternal <strong>PSTricks</strong>DotFont. If the symbol is given by a single character then the equivi-<br />
lant character in the given font is used. The difference between two symbols is set by<br />
symbolStep and the symbol rotation by rotateSymbol. For the first symbol there is an<br />
additional keyword startAngle. The default values for these new optional keywords<br />
are:<br />
\psset[pstricks]{symbolStep=20pt}<br />
\psset[pstricks]{symbolWidth=10pt}<br />
\psset[pstricks]{symbolFont=Dingbats}<br />
\psset[pstricks]{rotateSymbol=false}<br />
\psset[pstricks]{startAngle=0}<br />
➢<br />
➢<br />
1 \pspicture(-1,-1)(8,6)<br />
✡ ✡ ✡ ✡ ✡ ✡<br />
<br />
<br />
<br />
<br />
◆ ◆ ◆ ◆ ◆<br />
✴❁<br />
✴❁<br />
◆ ✡ ✴<br />
❁<br />
◆ ✡✴<br />
❁◆<br />
✴ ◆<br />
❁<br />
✴ ✡<br />
✴ ✴ ✴ ✴ ✴ ✴ ✴ ✴<br />
❁<br />
❁<br />
❁ ❁ ❁ ❁ ❁ ❁ ❁ ❁<br />
2 \psline[linestyle=symbol](0,0)(5,0)(8,4)<br />
➢<br />
3 \psline[linestyle=symbol,symbol=T](0,1)(5,1)(8,4)<br />
➢<br />
➢<br />
➢<br />
➢<br />
➢<br />
➢<br />
4 \psline[linestyle=symbol,symbol=u,symbolFont=<strong>PSTricks</strong>DotFont](0,2)(5,2)(8,4)<br />
5 \psline[linestyle=symbol,symbol=u,symbolStep=25pt,linecolor=red](0,3)(5,3)(8,2)<br />
6 \psline[linestyle=symbol,symbol=A,symbolStep=25pt,<br />
7 symbolWidth=20pt,linecolor=blue](0,4)(5,4)(8,1)<br />
8 \psline[linestyle=symbol,symbol=342,rotateSymbol=true,symbolStep=12pt](0,5)<br />
(5,5)(8,0)<br />
9 \endpspicture<br />
➢<br />
➢<br />
➢<br />
➢<br />
➢<br />
➢<br />
➢<br />
➢<br />
➢<br />
➢<br />
➢<br />
➢<br />
➢<br />
➢<br />
➢<br />
➢<br />
<br />
<br />
✡
4. Newlinestylesymbol 13<br />
1 \pspicture(-1,-1)(8,6)<br />
➢<br />
✡ ✡ ✡ ✡ ✡ ✡<br />
✡ <br />
<br />
◆ ◆ ◆ ◆ ◆ ◆ ✡<br />
◆<br />
<br />
✡✡<br />
❁ ✡<br />
❁ ❁ ❁ ❁ ❁ ❁ ❁ ❁<br />
❁ ❁ ❁ ❁ ❁ ❁<br />
2 \pscurve[linestyle=symbol](0,0)(5,0)(8,4)<br />
3 \pscurve[linestyle=symbol](0,1)(5,1)(8,4)<br />
➢<br />
➢<br />
➢<br />
➢<br />
➢<br />
➢<br />
➢<br />
➢<br />
➢<br />
➢<br />
➢<br />
➢<br />
➢<br />
❁ ❁<br />
➢<br />
➢<br />
❁<br />
➢<br />
❁<br />
❁<br />
◆<br />
❁<br />
❁ ◆<br />
❁ ◆<br />
❁<br />
❁<br />
4 \pscurve[linestyle=symbol,symbol=u,symbolFont=<strong>PSTricks</strong>DotFont](0,2)(5,2)(8,4)<br />
5 \pscurve[linestyle=symbol,symbol=u,symbolStep=25pt,linecolor=red](0,3)(5,3)<br />
(8,2)<br />
6 \pscurve[linestyle=symbol,symbol=A,symbolStep=25pt,<br />
7 symbolWidth=20pt,linecolor=blue](0,4)(5,4)(8,1)<br />
8 \pscurve[linestyle=symbol,symbol=342,rotateSymbol=true,<br />
9 startAngle=190,symbolStep=12pt](0,5)(5,5)(8,0)<br />
10 \endpspicture<br />
➢<br />
➢<br />
❁<br />
➢<br />
➢<br />
➢<br />
➢<br />
➢<br />
➢<br />
❁
4. Newlinestylesymbol 14<br />
➢<br />
<br />
<br />
<br />
❁ ❁<br />
❁<br />
❁ ❁ ❁<br />
❁ ❁<br />
❁<br />
❁<br />
✡ ❁<br />
❁<br />
❁ ❁<br />
<br />
✡<br />
❁<br />
❁<br />
<br />
◆ ◆ ❁◆<br />
❁<br />
◆ ✡<br />
✡<br />
❁ ◆<br />
<br />
◆◆ ◆ ✡ ❁<br />
◆ ❁<br />
❁<br />
❁<br />
◆ ◆<br />
❁<br />
❁ ❁<br />
❁ <br />
<br />
✡<br />
✡◆ ◆<br />
❁<br />
❁<br />
❁ ✡<br />
❁ ❁<br />
✡◆<br />
◆<br />
✡◆<br />
❁<br />
❁<br />
❁<br />
❁<br />
◆<br />
◆<br />
✡ ◆ ❁◆ ❁<br />
◆<br />
❁<br />
❁<br />
◆ ✡<br />
❁ ❁<br />
❁ ❁ ❁<br />
❁✡ ✡ ❁ ✡<br />
❁ ✡ ✡<br />
❁<br />
❁<br />
❁ ❁ ❁ ❁<br />
❁ ✡ ✡ ✡ ✡ ✡ ✡<br />
➢<br />
➢<br />
➢<br />
➢<br />
1 \pspicture(-1,-1)(8,6)<br />
➢<br />
2 \psccurve[linestyle=symbol](0,0)(5,0)(8,4)<br />
3 \psccurve[linestyle=symbol](0,1)(5,1)(8,4)<br />
➢<br />
➢<br />
➢<br />
➢<br />
➢<br />
➢<br />
➢<br />
➢<br />
➢<br />
➢<br />
➢<br />
➢<br />
➢<br />
➢<br />
➢<br />
➢<br />
➢<br />
4 \psccurve[linestyle=symbol,symbol=u,symbolFont=<strong>PSTricks</strong>DotFont](0,2)(5,2)(8,4)<br />
5 \psccurve[linestyle=symbol,symbol=u,symbolStep=25pt,linecolor=red](0,3)(5,3)<br />
(8,2)<br />
6 \psccurve[linestyle=symbol,symbol=A,symbolStep=25pt,<br />
7 symbolWidth=20pt,linecolor=blue](0,4)(5,4)(8,1)<br />
8 \psccurve[linestyle=symbol,symbol=342,rotateSymbol=true,<br />
9 startAngle=190,symbolStep=12pt](0,5)(5,5)(8,0)<br />
10 \endpspicture<br />
1 \pspicture(-1,-1)(5,4)<br />
✂✂✂✂✂✂✂<br />
➢<br />
➢<br />
✂✂✂✂✂✂<br />
2 \pscurve[rotateSymbol=true,linestyle=symbol,<br />
3 rot=180,startAngle=100,symbol=",<br />
4 symbolWidth=20pt](0,0)(1,4)(3,0)(5,2)<br />
5 \endpspicture<br />
➢<br />
➢<br />
<br />
➢<br />
➢<br />
➢<br />
➢<br />
✂<br />
<br />
➢<br />
➢<br />
➢<br />
➢<br />
<br />
➢<br />
➢<br />
➢<br />
✂✂✂<br />
<br />
➢<br />
➢<br />
➢<br />
➢<br />
➢<br />
<br />
➢<br />
➢<br />
➢<br />
➢<br />
➢<br />
➢<br />
<br />
➢<br />
➢
4. Newlinestylesymbol 15<br />
1 \pspicture(-1,-1)(6,4)<br />
<br />
<br />
2 \psbezier[rotateSymbol=true,linestyle=symbol,symbol=u,<br />
<br />
<br />
<br />
3 symbolFont=<strong>PSTricks</strong>DotFont,rot=-90,startAngle=0](0,0)(0,4)(6,4)(6,0)<br />
4 \endpspicture<br />
1 \psset{unit=0.5cm}<br />
2 \pspicture(-1,-4)(6,4)<br />
<br />
<br />
3 \pscbezier[rotateSymbol=true,linestyle=symbol,symbol=u,<br />
4 symbolFont=<strong>PSTricks</strong>DotFont](0,4)(4,4)(4,-4)(0,-4)<br />
5 \pscbezier[linestyle=dashed](0,4)(4,4)(4,-4)(0,-4)<br />
6 \endpspicture<br />
1 \pspicture(-1,-1)(6,4)<br />
<br />
<br />
2 \psbezier[rotateSymbol=true,linestyle=symbol,symbol=u,<br />
3 symbolFont=<strong>PSTricks</strong>DotFont](0,0)(0,4)(6,4)(6,0)<br />
4 \endpspicture
4. Newlinestylesymbol 16<br />
1 \pspicture(-1,-1)(6,4)<br />
<br />
<br />
<br />
<br />
<br />
<br />
2 \pspolygon[rotateSymbol=true,linestyle=symbol,symbol=u,<br />
3 symbolFont=<strong>PSTricks</strong>DotFont](0,0)(0,4)(6,4)(6,0)(1,3)<br />
4 \endpspicture<br />
1 \pspicture(-3,-1)(6,6)<br />
<br />
<br />
<br />
<br />
<br />
<br />
<br />
<br />
<br />
<br />
<br />
<br />
<br />
<br />
<br />
<br />
<br />
<br />
<br />
<br />
<br />
<br />
<br />
<br />
<br />
<br />
<br />
<br />
<br />
<br />
<br />
<br />
<br />
<br />
<br />
<br />
<br />
<br />
<br />
<br />
2 \psccurve[linestyle=symbol,symbol=u, rot=-90,rotateSymbol,<br />
3 symbolFont=<strong>PSTricks</strong>DotFont, symbolWidth=5pt, symbolStep=10pt<br />
4 ](-3,-1)(0,0)(0,4)(6,4)(6,0)(0,4)(-1,5)<br />
5 \endpspicture
5. Numericfunctions 17<br />
1 \pspicture(-1,-1)(6,6)<br />
<br />
<br />
<br />
<br />
<br />
<br />
<br />
<br />
<br />
<br />
<br />
<br />
<br />
<br />
<br />
<br />
<br />
<br />
<br />
<br />
<br />
<br />
<br />
<br />
<br />
<br />
<br />
2 \pscurve[linestyle=dashed,linecolor=black!30](0,0)(0,4)(6,4)(6,0)(0,4)<br />
3 \pscurve[rotateSymbol=true,linestyle=symbol,symbol=k,<br />
4 symbolFont=<strong>PSTricks</strong>DotFont, symbolWidth=5pt, symbolStep=10pt,linecolor=blue<br />
5 ](0,0)(0,4)(6,4)(6,0)(0,4)<br />
6 \endpspicture<br />
5. Numeric functions<br />
<br />
<br />
All macros have a @ in their name, because they are only for internal use, but it is no<br />
problem to use them like other macros. One can define another name without a @:<br />
\makeatletter<br />
\let\pstdivide\pst@divide<br />
\makeatother<br />
or put the macro inside the \makeatletter – \makeatother sequence.<br />
6. Numeric functions<br />
By default <strong>PSTricks</strong> loads the file pst-fp which is derived from the fp package. It<br />
supports the following macros:<br />
6.1. \pstFPadd, \pstFPsub, \pstFPmul, and \pstFPdiv<br />
Multiplication and division:<br />
\pstFPadd{result}{number}{number}<br />
\pstFPsub{result}{number}{number}<br />
\pstFPmul{result}{number}{number}<br />
\pstFPdiv{result}{number}{number}
6.2. \pstFPMul and \pstFPDiv 18<br />
-0.079847250000000000<br />
-145.202558635394456289<br />
-0.079847250000000000<br />
-0.006886930983847283<br />
7726.059000000000000000<br />
7.094636363636363636<br />
267.123000000000000000<br />
201.123000000000000000<br />
201.123000000000000000<br />
-267.123000000000000000<br />
1 \pstFPmul\Result{-3.405}{0.02345} \Result\quad<br />
2 \pstFPdiv\Result{-3.405}{0.02345} \Result\\<br />
3 \pstFPmul\Result{0.02345}{-3.405} \Result\quad<br />
4 \pstFPdiv\Result{0.02345}{-3.405} \Result\\<br />
5 \pstFPmul\Result{234.123}{33} \Result\quad<br />
6 \pstFPdiv\Result{234.123}{33} \Result\\<br />
7 \pstFPadd\Result{234.123}{33} \Result\quad<br />
8 \pstFPadd\Result{234.123}{-33} \Result\\<br />
9 \pstFPsub\Result{234.123}{33} \Result\quad<br />
10 \pstFPsub\Result{-234.123}{33} \Result<br />
Thezeroscanbestrippedwiththemacro\pstFPstripZeros. Expectalwaysrounding<br />
errors, T E X was not made for calculations ...The value is converted into a length and<br />
then reconverted to a number by stripping the unit. Which also strips the zeros.<br />
-0.07985 -145.20256<br />
-0.07985 -0.00688<br />
6.2. \pstFPMul and \pstFPDiv<br />
Integer multiplication and division:<br />
1 \pstFPmul\Result{-3.405}{0.02345}<br />
2 \pstFPstripZeros{\Result}{\Result}\Result\quad<br />
3 \pstFPdiv\Result{-3.405}{0.02345}<br />
4 \pstFPstripZeros{\Result}{\Result}\Result\\<br />
5 \pstFPmul\Result{0.02345}{-3.405}<br />
6 \pstFPstripZeros{\Result}{\Result}\Result\quad<br />
7 \pstFPdiv\Result{0.02345}{-3.405}<br />
8 \pstFPstripZeros{\Result}{\Result}\Result<br />
\pstFPMul{result as a truncated integer}{number}{number}<br />
\pstFPDiv{result as a truncated integer}{number}{number}<br />
-0 -145<br />
-79 -6<br />
7726 7<br />
1 \makeatletter<br />
7. The PostScript header files<br />
7.1. pstricks.pro<br />
2 \pstFPMul\Result{-34.05}{0.02345} \Result\quad<br />
3 \pstFPDiv\Result{-3.405}{0.02345} \Result\\<br />
4 \pstFPMul\Result{23.45}{-3.405} \Result\quad<br />
5 \pstFPDiv\Result{0.2345}{-0.03405} \Result\\<br />
6 \pstFPMul\Result{234.123}{33} \Result\quad<br />
7 \pstFPDiv\Result{234.123}{33} \Result<br />
8 \makeatother<br />
It contains now most of the stuff from pstricks-add and the new routines for plotting<br />
lines/curves with symbols.
7.2. pst-algparser.pro 19<br />
7.2. pst-algparser.pro<br />
Using the Sum function<br />
\Sum(,,,,)<br />
+∞ (−1)<br />
Let’s plot the first development of cosine with polynomials:<br />
n=0<br />
nx2n .<br />
n!<br />
−7<br />
−6<br />
−5<br />
−4<br />
−3<br />
−2<br />
−1<br />
1<br />
−1<br />
1 \psset{algebraic=true, plotpoints=501, yunit=3}<br />
1 2 3 4 5 6 7<br />
2 \def\getColor#1{\ifcase#1 black\or red\or magenta\or yellow\or green\or Orange\<br />
or blue\or<br />
3 DarkOrchid\or BrickRed\or Rhodamine\or OliveGreen\fi}<br />
4 \begin{pspicture}(-7,-1.5)(7,1.5)<br />
5 \psclip{\psframe(-7,-1.5)(7,1.5)}<br />
6 \psplot{-7}{7}{cos(x)}<br />
7 \multido{\n=1+1}{10}{%<br />
8 \psplot[linewidth=1pt,linecolor=\getColor{\n}]{-7}{7}{%<br />
9 Sum(ijk,0,1,\n,(-1)^ijk*x^(2*ijk)/fact(2*ijk))}}<br />
10 \endpsclip<br />
11 \psaxes(0,0)(-7,-1.5)(7,1.5)<br />
12 \end{pspicture}
7.3. IfTE 20<br />
7.3. The variable step algorithm together with the PostScript function<br />
IfTE<br />
IfTE(,,)<br />
Nesting of several IfTE is possible and seen in the following examples. A classic example<br />
is a piece-wise linear function.<br />
−7 −6 −5 −4 −3 −2 −1<br />
−1<br />
5<br />
4<br />
3<br />
2<br />
1<br />
−2<br />
y<br />
x<br />
1 2 3 4 5 6 7<br />
1 \psset{unit=1.5, algebraic, VarStep, showpoints, VarStepEpsilon=.001}<br />
2 \begin{pspicture}[showgrid=true](-7,-2)(2,4)<br />
3 \psplot{-7}{2}{IfTE(x
7.3. IfTE 21<br />
−8<br />
−7<br />
−6<br />
1 \psset{unit=0.75}<br />
−5<br />
−4<br />
−3<br />
2 \begin{pspicture}(-8,-8)(8,8)<br />
−2<br />
7<br />
6<br />
5<br />
4<br />
3<br />
2<br />
1<br />
−1<br />
−1<br />
−2<br />
−3<br />
−4<br />
−5<br />
−6<br />
−7<br />
−8<br />
3 \psaxes{->}(0,0)(-8,-8)(8,8)[x,-90][y,0]<br />
4 \psset{plotpoints=1000,linewidth=1pt}<br />
y<br />
1 2 3 4 5 6 7<br />
5 \psplot[algebraic=true, linecolor=yellow]{-8}{8}{rand/(2^31-1)+x}<br />
6 \psplot[algebraic=true]{-8}{8}{ceiling(x)}<br />
7 \psplot[algebraic=true, linecolor=red]{-8}{8}{floor(x)}<br />
8 \psplot[algebraic=true, linecolor=blue]{-8}{8}{round(x)}<br />
9 \psplot[algebraic=true, linecolor=green]{-8}{8}{truncate(x)}<br />
10 \psplot[algebraic=true, linecolor=cyan]{-8}{8}{div(mul(4,x),7)}<br />
11 \psplot[algebraic=true, linecolor=gray]{-8}{8}{abs(x)+abs(x-3)-abs(5-5*x/7)}<br />
12 \psplot[algebraic=true, linecolor=gray]{-8}{8}{abs(3*cos(x)+1)}<br />
13 \psplot[algebraic=true, linecolor=magenta]{-8}{8}{floor(8*cos(x))}<br />
14 \end{pspicture}<br />
x
7.4. Derive function 22<br />
7.4. Successive derivatives of a polynomial with the PostScript<br />
function Derive<br />
<br />
<br />
<br />
<br />
<br />
<br />
<br />
<br />
<br />
<br />
<br />
<br />
<br />
<br />
<br />
<br />
<br />
<br />
<br />
<br />
<br />
<br />
<br />
<br />
<br />
<br />
<br />
<br />
<br />
<br />
<br />
<br />
<br />
<br />
<br />
<br />
<br />
<br />
<br />
<br />
<br />
<br />
<br />
<br />
<br />
<br />
<br />
<br />
<br />
<br />
<br />
<br />
<br />
<br />
<br />
<br />
<br />
<br />
<br />
<br />
<br />
<br />
<br />
<br />
<br />
<br />
<br />
<br />
<br />
<br />
<br />
<br />
<br />
<br />
<br />
<br />
<br />
<br />
<br />
<br />
<br />
<br />
<br />
<br />
<br />
<br />
<br />
<br />
<br />
<br />
<br />
<br />
<br />
<br />
<br />
<br />
<br />
<br />
<br />
<br />
<br />
<br />
<br />
<br />
<br />
<br />
<br />
<br />
<br />
<br />
<br />
<br />
<br />
<br />
<br />
<br />
<br />
<br />
<br />
<br />
<br />
<br />
<br />
<br />
<br />
<br />
<br />
<br />
<br />
<br />
<br />
<br />
<br />
<br />
<br />
<br />
<br />
<br />
<br />
<br />
<br />
<br />
<br />
<br />
<br />
<br />
<br />
<br />
<br />
<br />
<br />
<br />
<br />
<br />
<br />
<br />
<br />
<br />
<br />
<br />
<br />
<br />
<br />
<br />
<br />
<br />
<br />
<br />
<br />
<br />
<br />
<br />
<br />
<br />
<br />
<br />
<br />
<br />
<br />
<br />
<br />
<br />
<br />
<br />
<br />
<br />
<br />
<br />
<br />
<br />
<br />
<br />
<br />
<br />
<br />
<br />
<br />
<br />
<br />
<br />
<br />
<br />
<br />
<br />
<br />
<br />
<br />
<br />
<br />
<br />
<br />
<br />
<br />
<br />
<br />
<br />
<br />
<br />
<br />
<br />
<br />
<br />
<br />
<br />
<br />
<br />
<br />
<br />
1<br />
0<br />
<br />
-1<br />
0 1 2 3 4 5 6 7<br />
1 \psset{unit=2, algebraic=true, VarStep=true, showpoints=true, VarStepEpsilon<br />
=.001}<br />
2 \def\getColor#1{\ifcase#1 Tan\or RedOrange\or magenta\or yellow\or green\or<br />
Orange\or blue\or<br />
3 DarkOrchid\or BrickRed\or Rhodamine\or OliveGreen\or Goldenrod\or Mahogany\or<br />
4 OrangeRed\or CarnationPink\or RoyalPurple\or Lavender\fi}<br />
5 \begin{pspicture}[showgrid=true](0,-1.2)(7,1.5)<br />
6<br />
7<br />
8<br />
9<br />
\psclip{\psframe[linestyle=none](0,-1.1)(7,1.1)}<br />
\multido{\in=0+1}{16}{%<br />
\psplot[algebraic=true, linecolor=\getColor{\in}]{0.1}{7}<br />
{Derive(\in,Sum(i,0,1,7,(-1)^i*x^(2*i)/Fact(2*i)))}}<br />
10 \endpsclip<br />
11 \end{pspicture}<br />
7.5. Special arrow option arrowLW<br />
<br />
<br />
<br />
<br />
<br />
<br />
<br />
<br />
<br />
Only for the arrowtype o, oo, *, and ** it is possible to set the arrowlinewidth with<br />
<br />
<br />
<br />
<br />
width can be set separately and is not taken into account by the scaling value.<br />
<br />
<br />
<br />
the optional keyword arrowLW. When scaling an arrow by the keyword arrowscale the<br />
width of the borderline is also scaled. With the optional argument arrowLW the line<br />
<br />
<br />
<br />
<br />
1 \begin{pspicture}(4,6)<br />
<br />
<br />
2 \psline[arrowscale=3,arrows=*-o](0,5)(4,5)<br />
3 \psline[arrowscale=3,arrows=*-o, <br />
4 arrowLW=0.5pt](0,3)(4,3) <br />
<br />
5 \psline[arrowscale=3,arrows=*-o, <br />
6 arrowLW=0.3333\pslinewidth](0,1)(4,1) <br />
<br />
7 \end{pspicture}
7.5. Special arrowoption arrowLW 23<br />
1 \begin{pspicture}(4,6)<br />
2 \psline[arrowscale=3,arrows=**-oo](0,5)(4,5)<br />
3 \psline[arrowscale=3,arrows=**-oo,<br />
4 arrowLW=0.5pt](0,3)(4,3)<br />
5 \psline[arrowscale=3,arrows=**-oo,<br />
6 arrowLW=0.3333\pslinewidth](0,1)(4,1)<br />
7 \end{pspicture}
8. \psforeachand \psForeach 24<br />
8. \psforeach and \psForeach<br />
The macro \psforeach allows a loop with an individual increment.<br />
\psforeach{variable}{value list}{action}<br />
\psForeach{variable}{value list}{action}<br />
With \psforeach the action is done inside a group and for \psForeach not. This maybe<br />
useful when using the macro to create tabular cells, which are alread grouped itself.<br />
5<br />
4<br />
3<br />
2<br />
1<br />
0<br />
<br />
<br />
<br />
0 1 2 3 4 5<br />
y = 2 x<br />
<br />
2 4 6 8 10 12<br />
4.0 16.0 64.0 256.0 1024.0 4096.0<br />
1 %\usepackage{pst-func}<br />
2 \makeatletter<br />
3 \newcommand*\InitToks{\toks@={}}<br />
<br />
1 \begin{pspicture}[showgrid=true](5,5)<br />
2 \psforeach{\nA}{0, 1, 1.5, 3, 5}{%<br />
3 \psdot[dotscale=3](\nA,\nA)}<br />
4 \end{pspicture}<br />
4 \newcommand\AddToks[1]{\toks@=\expandafter{\the\toks@ #1}}<br />
5 \newcommand*\PrintToks{\the\toks@}<br />
6 \newcommand*{\makeTable}[4][5mm]{%<br />
7 \begingroup<br />
8 \InitToks%<br />
9 \AddToks{\begin{tabular}{|*{#2}{>{\RaggedLeft}p{#1}|}@{}l@{}}\cline{1-#2}}<br />
10 \psForeach{\iA}{#3}{\expandafter\AddToks\expandafter{\iA & }}<br />
11 \AddToks{\\\cline{1-#2}}%<br />
12 \psForeach{\iA}{#3}{\expandafter\AddToks\expandafter{\expandafter%<br />
13 \psPrintValue\expandafter{\iA\space /x ED #4} & }}<br />
14 \AddToks{\\\cline{1-#2}\end{tabular}}%<br />
15 \PrintToks<br />
16 \endgroup<br />
17 }<br />
18 \makeatother<br />
19<br />
20 \sffamily<br />
21 \psset{decimals=2,valuewidth=7,xShift=-20}<br />
22 $y=2^x$\\<br />
23 \makeTable[1cm]{6}{2,4,6,8,10,12}{2 x exp}<br />
The value List can also be given by the first two and the last value, e.g. 1,4,..,31,<br />
then <strong>PSTricks</strong> calculates all values with the distance given by the first two values.
1<br />
0<br />
5<br />
4<br />
3<br />
2<br />
1<br />
0<br />
9. pst-node.tex 25<br />
0 1 2 3 4 5 6 7 8 9 10 11 12 13 14 15 16 17 18 19 20 21 22 23 24 25<br />
1 \psset{xunit=0.55cm,yunit=2cm}<br />
2 \begin{pspicture}[showgrid](0,-5mm)(25,1)<br />
3 \psforeach{\nA}{0, 3.14,..,25}{\psline(\nA,0)(\nA,1)}<br />
4 \end{pspicture}<br />
The internal counter for the steps is named psLoopIndex and can be used for own<br />
purposes.<br />
<br />
<br />
<br />
0 1 2 3 4 5<br />
Part II.<br />
<br />
<br />
pst-node – package<br />
9. pst-node.tex<br />
1 \begin{pspicture}[showgrid=true](5,5)<br />
2 \psforeach{\nA}{0, 1, 1.5, 2.25, 5}{%<br />
3 \psdot[dotscale=3](\the\psLoopIndex,\nA)}<br />
4 \end{pspicture}<br />
The package pst-node now uses the advanced key handling from xkeyval. The reason<br />
why it moved from the base into the contrib sections, where all packages uses xkeyval.<br />
Part III.<br />
pst-plot – package<br />
10. pst-plot.tex<br />
The package pst-plot now uses the advanced key handling from xkeyval. The reason<br />
why it moved from the base into the contrib sections, where all packages uses xkeyval.
References 26<br />
11. List of all optional arguments for pstricks<br />
Key Type Default<br />
References<br />
[1] Michel Goosens, Frank Mittelbach, Sebastian Rahtz, Denis Roegel, and Herbert<br />
Voß. TheL AT E XGraphicsCompanion. Addison-WesleyPublishingCompany,Reading,<br />
Mass., 2007.<br />
[2] Laura E. Jackson and Herbert Voß. Die Plot-Funktionen von pst-plot. Die<br />
T E Xnische Komödie, 2/02:27–34, June 2002.<br />
[3] Nikolai G. Kollock. PostScript richtig eingesetzt: vom Konzept zum praktischen<br />
Einsatz. IWT, Vaterstetten, 1989.<br />
[4] Herbert Voß. Die mathematischen Funktionen von Postscript. Die T E Xnische<br />
Komödie, 1/02:40–47, March 2002.<br />
[5] Herbert Voss. <strong>PSTricks</strong> Support for pdf. http://<strong>PSTricks</strong>.de/pdf/pdfoutput.<br />
phtml, 2002.<br />
[6] Herbert Voß. L AT E XReferenz. DANTE–Lehmanns,Heidelberg/Hamburg, 1.edition,<br />
2007.<br />
[7] Herbert Voß. <strong>PSTricks</strong> – Grafik für T E X und L AT E X. DANTE – Lehmanns Media,<br />
Heidelberg/Hamburg, 5. edition, 2008.<br />
[8] Michael Wiedmann and Peter Karp. References for T E X and Friends. http://www.<br />
miwie.org/tex-refs/, 2003.
Index<br />
*, 22<br />
**, 22<br />
\AddToShipoutPicture, 3<br />
algebraic, 10<br />
arrowLW, 22<br />
arrowscale, 22<br />
auto-pst-pdf, 3<br />
Class<br />
pst-doc, 3<br />
scrartcl, 3<br />
correctAngle, 9<br />
dashcolor, 4<br />
enable-write18, 3<br />
endLW, 4<br />
endWL, 4<br />
Environment<br />
pspicture, 3<br />
eso-pic, 3<br />
File<br />
pst-doc-pdf, 3<br />
fp, 17<br />
pst-fp, 17<br />
IfTE, 20<br />
Keyvalue<br />
<strong>PSTricks</strong>DotFont, 12<br />
symbol, 12<br />
Keyword<br />
algebraic, 10<br />
arrowLW, 22<br />
arrowscale, 22<br />
correctAngle, 9<br />
dashcolor, 4<br />
endLW, 4<br />
endWL, 4<br />
linecolor, 8<br />
plotpoints, 20<br />
rot, 8<br />
rotateSymbol, 12<br />
showpoints, 20<br />
startAngle, 12<br />
startLW, 4<br />
startWL, 4<br />
symbol, 12<br />
symbolFont, 12<br />
symbolStep, 12<br />
variableColor, 4<br />
variableLW, 4<br />
VarStep, 20<br />
VarStepEpsilon, 20<br />
vlines, 8<br />
latex, 3<br />
linecolor, 8<br />
Macro<br />
\AddToShipoutPicture, 3<br />
\makeatletter, 17<br />
\makeatother, 17<br />
\parametricplot, 10<br />
\psarc, 4<br />
\pscircle, 4<br />
\pscurve, 4<br />
\psellipse, 4<br />
\psellipticarc, 4, 8<br />
\psForeach, 24<br />
\psforeach, 24<br />
\pslinewidth, 4<br />
\psparametricplot, 4<br />
\psplot, 4, 10<br />
\pstFPadd, 17<br />
\pstFPDiv, 18<br />
\pstFPdiv, 17<br />
\pstFPMul, 18<br />
\pstFPmul, 17<br />
\pstFPstripZeros, 18<br />
\pstFPsub, 17<br />
\rput, 8<br />
\SpecialCoor, 3<br />
\Sum, 19<br />
\uput, 3<br />
\makeatletter, 17<br />
27
Index 28<br />
\makeatother, 17<br />
o, 22<br />
oo, 22<br />
Package<br />
auto-pst-pdf, 3<br />
eso-pic, 3<br />
fp, 17<br />
pst-node, 25<br />
pst-pdf, 3<br />
pst-plot, 25<br />
pstricks, 10<br />
pstricks-add, 18<br />
xkeyval, 25<br />
Package option<br />
enable-write18, 3<br />
pdf, 3<br />
shell-escape, 3<br />
\parametricplot, 10<br />
pdf, 3<br />
pdflatex, 3<br />
plotpoints, 20<br />
PostScript<br />
IfTE, 20<br />
Program<br />
latex, 3<br />
pdflatex, 3<br />
pst2pdf, 3<br />
\psarc, 4<br />
\pscircle, 4<br />
\pscurve, 4<br />
\psellipse, 4<br />
\psellipticarc, 4, 8<br />
\psForeach, 24<br />
\psforeach, 24<br />
\pslinewidth, 4<br />
psLoopIndex, 25<br />
\psparametricplot, 4<br />
pspicture, 3<br />
\psplot, 4, 10<br />
pst-doc, 3<br />
pst-doc-pdf, 3<br />
pst-fp, 17<br />
pst-node, 25<br />
pst-pdf, 3<br />
pst-plot, 25<br />
pst2pdf, 3<br />
\pstFPadd, 17<br />
\pstFPDiv, 18<br />
\pstFPdiv, 17<br />
\pstFPMul, 18<br />
\pstFPmul, 17<br />
\pstFPstripZeros, 18<br />
\pstFPsub, 17<br />
pstricks, 10<br />
pstricks-add, 18<br />
<strong>PSTricks</strong>DotFont, 12<br />
rot, 8<br />
rotateSymbol, 12<br />
\rput, 8<br />
scrartcl, 3<br />
shell-escape, 3<br />
showpoints, 20<br />
\SpecialCoor, 3<br />
startAngle, 12<br />
startLW, 4<br />
startWL, 4<br />
\Sum, 19<br />
symbol, 12<br />
symbolFont, 12<br />
symbolStep, 12<br />
Syntax<br />
*, 22<br />
**, 22<br />
o, 22<br />
oo, 22<br />
\uput, 3<br />
variableColor, 4<br />
variableLW, 4<br />
VarStep, 20<br />
VarStepEpsilon, 20<br />
vlines, 8<br />
xkeyval, 25