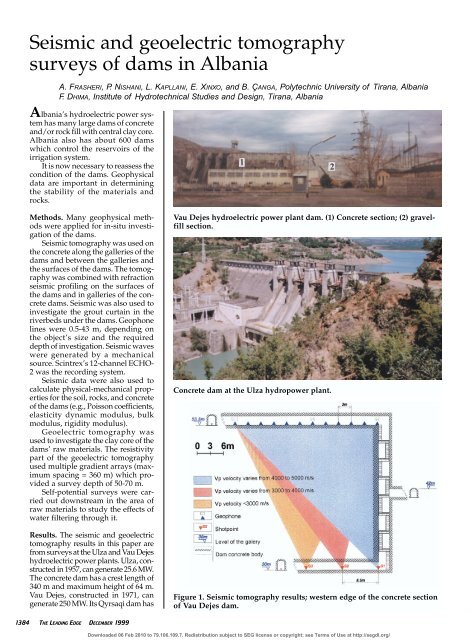
Seismic and geoelectric tomography surveys of dams in Albania
Seismic and geoelectric tomography surveys of dams in Albania
Seismic and geoelectric tomography surveys of dams in Albania

You also want an ePaper? Increase the reach of your titles
YUMPU automatically turns print PDFs into web optimized ePapers that Google loves.
<strong>Seismic</strong> <strong>and</strong> <strong>geoelectric</strong> <strong>tomography</strong><br />
<strong>surveys</strong> <strong>of</strong> <strong>dams</strong> <strong>in</strong> <strong>Albania</strong><br />
A. FRASHERI, P.NISHANI, L.KAPLLANI, E.XINXO, <strong>and</strong> B. ÇANGA, Polytechnic University <strong>of</strong> Tirana, <strong>Albania</strong><br />
F. D HIMA, Institute <strong>of</strong> Hydrotechnical Studies <strong>and</strong> Design, Tirana, <strong>Albania</strong><br />
<strong>Albania</strong>’s hydroelectric power system<br />
has many large <strong>dams</strong> <strong>of</strong> concrete<br />
<strong>and</strong>/or rock fill with central clay core.<br />
<strong>Albania</strong> also has about 600 <strong>dams</strong><br />
which control the reservoirs <strong>of</strong> the<br />
irrigation system.<br />
It is now necessary to reassess the<br />
condition <strong>of</strong> the <strong>dams</strong>. Geophysical<br />
data are important <strong>in</strong> determ<strong>in</strong><strong>in</strong>g<br />
the stability <strong>of</strong> the materials <strong>and</strong><br />
rocks.<br />
Methods. Many geophysical methods<br />
were applied for <strong>in</strong>-situ <strong>in</strong>vestigation<br />
<strong>of</strong> the <strong>dams</strong>.<br />
<strong>Seismic</strong> <strong>tomography</strong> was used on<br />
the concrete along the galleries <strong>of</strong> the<br />
<strong>dams</strong> <strong>and</strong> between the galleries <strong>and</strong><br />
the surfaces <strong>of</strong> the <strong>dams</strong>. The <strong>tomography</strong><br />
was comb<strong>in</strong>ed with refraction<br />
seismic pr<strong>of</strong>il<strong>in</strong>g on the surfaces <strong>of</strong><br />
the <strong>dams</strong> <strong>and</strong> <strong>in</strong> galleries <strong>of</strong> the concrete<br />
<strong>dams</strong>. <strong>Seismic</strong> was also used to<br />
<strong>in</strong>vestigate the grout curta<strong>in</strong> <strong>in</strong> the<br />
riverbeds under the <strong>dams</strong>. Geophone<br />
l<strong>in</strong>es were 0.5-43 m, depend<strong>in</strong>g on<br />
the object’s size <strong>and</strong> the required<br />
depth <strong>of</strong> <strong>in</strong>vestigation. <strong>Seismic</strong> waves<br />
were generated by a mechanical<br />
source. Sc<strong>in</strong>trex’s 12-channel ECHO-<br />
2 was the record<strong>in</strong>g system.<br />
<strong>Seismic</strong> data were also used to<br />
calculate physical-mechanical properties<br />
for the soil, rocks, <strong>and</strong> concrete<br />
<strong>of</strong> the <strong>dams</strong> (e.g., Poisson coefficients,<br />
elasticity dynamic modulus, bulk<br />
modulus, rigidity modulus).<br />
Geoelectric <strong>tomography</strong> was<br />
used to <strong>in</strong>vestigate the clay core <strong>of</strong> the<br />
<strong>dams</strong>’ raw materials. The resistivity<br />
part <strong>of</strong> the <strong>geoelectric</strong> <strong>tomography</strong><br />
used multiple gradient arrays (maximum<br />
spac<strong>in</strong>g = 360 m) which provided<br />
a survey depth <strong>of</strong> 50-70 m.<br />
Self-potential <strong>surveys</strong> were carried<br />
out downstream <strong>in</strong> the area <strong>of</strong><br />
raw materials to study the effects <strong>of</strong><br />
water filter<strong>in</strong>g through it.<br />
Results. The seismic <strong>and</strong> <strong>geoelectric</strong><br />
<strong>tomography</strong> results <strong>in</strong> this paper are<br />
from <strong>surveys</strong> at the Ulza <strong>and</strong> Vau Dejes<br />
hydroelectric power plants. Ulza, constructed<br />
<strong>in</strong> 1957, can generate 25.6 MW.<br />
The concrete dam has a crest length <strong>of</strong><br />
340 m <strong>and</strong> maximum height <strong>of</strong> 64 m.<br />
Vau Dejes, constructed <strong>in</strong> 1971, can<br />
generate 250 MW. Its Qyrsaqi dam has<br />
Vau Dejes hydroelectric power plant dam. (1) Concrete section; (2) gravelfill<br />
section.<br />
Concrete dam at the Ulza hydropower plant.<br />
Figure 1. <strong>Seismic</strong> <strong>tomography</strong> results; western edge <strong>of</strong> the concrete section<br />
<strong>of</strong> Vau Dejes dam.<br />
1384 THE LEADING EDGE DECEMBER 1999 DECEMBER 1999 THE LEADING EDGE 0000<br />
Downloaded 06 Feb 2010 to 79.106.109.7. Redistribution subject to SEG license or copyright; see Terms <strong>of</strong> Use at http://segdl.org/
Figure 2. Quality <strong>of</strong> concrete <strong>in</strong> galleries accord<strong>in</strong>g to seismic <strong>in</strong>vestigation<br />
2 m under the gallery floor. Concrete section <strong>of</strong> Qyrsaqi dam.<br />
Figure 3. Quality <strong>of</strong> concrete <strong>in</strong> galleries accord<strong>in</strong>g to seismic <strong>in</strong>vestigation<br />
0.5 m under the gallery floor. Concrete section <strong>of</strong> Qyrsaqi dam.<br />
Figure 4. <strong>Seismic</strong> section <strong>of</strong> the concrete section <strong>of</strong> Qyrsaqi dam.<br />
Direction <strong>of</strong> seismic <strong>tomography</strong><br />
Figure 5. Concrete blocks with<br />
different quality at Ulza dam.<br />
a concrete section <strong>and</strong> a gravel fill with<br />
central clay core section. The dam has<br />
a crest length <strong>of</strong> 480 m <strong>and</strong> maximum<br />
height <strong>of</strong> 79 m. Geoelectric <strong>tomography</strong><br />
was performed only <strong>in</strong> the rawmaterials<br />
section.<br />
Tomographic data at 30 m <strong>and</strong> 53.5<br />
m <strong>in</strong> the concrete section <strong>of</strong> Qyrsaqi<br />
dam showed that generally, the concrete<br />
has P-wave velocity greater than<br />
4000 m/s <strong>and</strong> shear-wave velocity<br />
greater than 1900 m/s (Figure 1). But<br />
at the left edge <strong>of</strong> the dam, V P<br />
decreases to less than 4000 m/s.<br />
S-wave velocity also decreases, show<strong>in</strong>g<br />
that this sector has weaker physical<br />
<strong>and</strong> mechanical properties.<br />
These results were compared<br />
with seismic pr<strong>of</strong>il<strong>in</strong>g. The concrete<br />
bottom <strong>of</strong> <strong>in</strong>spection galleries generally<br />
has good physical-mechanical<br />
properties. But <strong>in</strong> some sectors <strong>of</strong> the<br />
galleries, a superficial layer <strong>of</strong> up to<br />
1 m is attached, which is weak<br />
mechanically (Figure 2). This shows<br />
that the concrete will deteriorate due<br />
to the water’s effect or that these sectors<br />
were constructed with concrete<br />
<strong>of</strong> poor quality.<br />
In Ulza, seismic <strong>tomography</strong><br />
(Figure 3) <strong>in</strong>dicates that the concrete<br />
is also characterized by high seismic<br />
velocities (V P = 4300-5035 m/s <strong>and</strong> V S<br />
= 2412-2429 m/s). The elastic dynamic<br />
modulus is (3.27-3.60)10 5<br />
kG/cm 2 . Accord<strong>in</strong>g to the tomographic<br />
data, the upper levels <strong>of</strong> the<br />
dam have P-wave velocities that are,<br />
on average, higher than at the lower<br />
levels. However, S-wave velocities are<br />
equal <strong>in</strong> both areas. In addition, the<br />
1386 THE LEADING EDGE DECEMBER 1999 DECEMBER 1999 THE LEADING EDGE 0000<br />
Downloaded 06 Feb 2010 to 79.106.109.7. Redistribution subject to SEG license or copyright; see Terms <strong>of</strong> Use at http://segdl.org/
SCHEME OF SEISMIC TOMOGRAPHY<br />
BETWEEN THE GALLERIES<br />
Figure 6. <strong>Seismic</strong> <strong>tomography</strong> results, Ulza concrete dam.<br />
SKETCH OF GEOPHONE LOCATIONS<br />
Figure 7. <strong>Seismic</strong> <strong>in</strong>-situ test results <strong>in</strong> <strong>in</strong>spection gallery at Ulza.<br />
average deviation <strong>of</strong> V S is almost half<br />
that <strong>of</strong> V P. These facts are an argument<br />
that V P <strong>in</strong> the lowest levels is lower<br />
than <strong>in</strong> the upper levels as a result <strong>of</strong><br />
SCHEME OF SEISMIC TOMOGRAPHY<br />
IN DAM BODY<br />
constant high pressure. The concrete<br />
at lower levels also conta<strong>in</strong>s more<br />
water <strong>and</strong> its mechanical properties<br />
are weaker than the upper levels. In the<br />
V P velocity >4000 m/s<br />
V P velocity 3000-4000 m/s<br />
V P velocity 2000-3000 m/s<br />
Geophone<br />
V P <strong>and</strong> V S accord<strong>in</strong>g to surface <strong>surveys</strong><br />
<strong>Seismic</strong> <strong>of</strong>fset<br />
Ultrabasic rock<br />
Dam concrete body<br />
tomogram it is possible to def<strong>in</strong>e a sector<br />
which is characterized by lower<br />
physical-mechanical properties than<br />
the surround<strong>in</strong>g environment.<br />
0000 THE LEADING EDGE DECEMBER 1999 DECEMBER 1999 THE LEADING EDGE 1387<br />
Shotpo<strong>in</strong>t<br />
<strong>Seismic</strong> discont<strong>in</strong>uity<br />
Downloaded 06 Feb 2010 to 79.106.109.7. Redistribution subject to SEG license or copyright; see Terms <strong>of</strong> Use at http://segdl.org/
Figure 8. Electrical resistivity real section <strong>and</strong> seismic sections <strong>of</strong> head<br />
refraction wave velocities V P <strong>and</strong> V S, Vau Dejes’ dam.<br />
Figure 9. Geoelectrical section <strong>of</strong> the gravelfill Qyrsaqi dam.<br />
At Ulza, the <strong>in</strong>ner walls <strong>of</strong> the<br />
<strong>in</strong>spection gallery <strong>and</strong> the dam surface<br />
have a low elastic dynamic modulus—up<br />
to 74.000 kG/cm 2 . At this<br />
sector, much lake water has <strong>in</strong>filtrated<br />
the <strong>in</strong>ner <strong>of</strong> the dam, show<strong>in</strong>g<br />
aga<strong>in</strong> the impact <strong>of</strong> “ag<strong>in</strong>g” on concrete.<br />
Evaluation <strong>of</strong> the physical-mechanical<br />
properties <strong>of</strong> soil <strong>and</strong> rocks. The<br />
clay has lower resistivity at the center<br />
<strong>and</strong> west <strong>of</strong> Qyrsaqi dam than at<br />
the east. The seismic velocity is lower<br />
<strong>in</strong> the east because water has filtered<br />
<strong>in</strong>to the clay’s core.<br />
The average resistivity <strong>of</strong> the<br />
dam’s core is about 100 ohm-m.<br />
However, <strong>in</strong> five sectors <strong>of</strong> the core,<br />
resistivity decreases up to 25 ohm-m.<br />
These anomalous spots are 3-45 m<br />
below the top <strong>of</strong> the dam (Figure 4).<br />
It is evident that three <strong>of</strong> these anomalies<br />
co<strong>in</strong>cide horizontally. The anomaly<br />
under station 20 starts at a depth<br />
<strong>of</strong> 22 m, cont<strong>in</strong>ues to 45 m, <strong>and</strong> dips<br />
toward the west.<br />
Beneath the superficial layer at<br />
the top <strong>of</strong> the dam, which has a thickness<br />
<strong>of</strong> 2-10 m <strong>and</strong> low seismic velocities<br />
(V P = 1080 m/s <strong>and</strong> V S = 550<br />
m/s), seismic <strong>tomography</strong> shows a<br />
second clay layer with thickness <strong>of</strong> 4-<br />
21 m which <strong>in</strong>creases to the west,<br />
where the ground dam meets the concrete<br />
part <strong>of</strong> the dam. <strong>Seismic</strong> velocities<br />
are lower <strong>in</strong> the western part <strong>of</strong> the<br />
dam. The clay’s core, under the second<br />
layer, is characterized by higher seismic<br />
velocities (V P up to 2200 m/s <strong>and</strong><br />
V S up to 800 m/s). The elastic dynamic<br />
modulus, calculated accord<strong>in</strong>g to V S<br />
data, varies from 0.04 to 0.8810 5<br />
kG/cm 2 for the second clay core.<br />
The lower resistivity <strong>and</strong> lower<br />
seismic velocities are <strong>in</strong>terpreted as<br />
be<strong>in</strong>g the result <strong>of</strong> water filter<strong>in</strong>g<br />
through the clay core. This <strong>in</strong>terpretation<br />
does not exclude the possibility <strong>of</strong><br />
heterogeneity <strong>of</strong> the clay. The decrease<br />
<strong>of</strong> seismic velocities with depth shows<br />
that the clay’s core is compacted.<br />
Conclusions. Dams at Qyrsaqi <strong>and</strong><br />
Ulza hydroelectric power plants have<br />
superficial concrete layers up to 1 m<br />
thick, which have very poor physicalmechanical<br />
properties.<br />
The central <strong>and</strong> western parts <strong>of</strong><br />
the clay core at Qyrsaqi dam have<br />
some sectors with resistivity <strong>and</strong> seismic<br />
velocities that are lower than the<br />
side parts <strong>of</strong> the dam. The <strong>in</strong>creases <strong>in</strong><br />
physical properties are <strong>in</strong>terpreted to<br />
result from water <strong>in</strong>filtration to the<br />
clay’s core.<br />
Suggestions for further read<strong>in</strong>g.<br />
“Outlook on results <strong>of</strong> geophysical <strong>in</strong>situ<br />
test <strong>and</strong> monitor<strong>in</strong>g <strong>of</strong> hydrotechnical<br />
constructions <strong>in</strong> <strong>Albania</strong>” by<br />
Frasheri et al. (1998 EAGE Meet<strong>in</strong>g).<br />
“Ingenierurgeologische Untersuchunger<br />
für den Wasserbau im Fels” by<br />
Dzienvanski et al. Veb Deutscher Verlag<br />
für Grundst<strong>of</strong>f<strong>in</strong>dustrie, Leipzig,<br />
Germany. LE<br />
Correspond<strong>in</strong>g author: A. Frasheri, alfi@<br />
<strong>in</strong>ima.al<br />
1388 THE LEADING EDGE DECEMBER 1999 DECEMBER 1999 THE LEADING EDGE 0000<br />
Downloaded 06 Feb 2010 to 79.106.109.7. Redistribution subject to SEG license or copyright; see Terms <strong>of</strong> Use at http://segdl.org/