ENSO Cycle: Recent Evolution, Current Status and Predictions
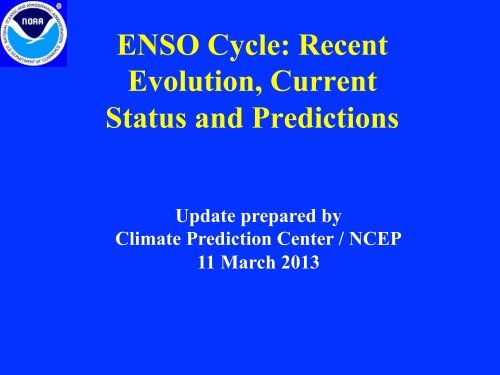
ENSO Cycle: Recent Evolution, Current Status and Predictions
ENSO Cycle: Recent Evolution, Current Status and Predictions
Create successful ePaper yourself
Turn your PDF publications into a flip-book with our unique Google optimized e-Paper software.
<strong>ENSO</strong> <strong>Cycle</strong>: <strong>Recent</strong><br />
<strong>Evolution</strong>, <strong>Current</strong><br />
<strong>Status</strong> <strong>and</strong> <strong>Predictions</strong><br />
Update prepared by<br />
Climate Prediction Center / NCEP<br />
11 March 2013
• Overview<br />
Outline<br />
• <strong>Recent</strong> <strong>Evolution</strong> <strong>and</strong> <strong>Current</strong> Conditions<br />
• Oceanic Niño Index (ONI) – Revised March 2012<br />
• Pacific SST Outlook<br />
• U.S. Seasonal Precipitation <strong>and</strong><br />
Temperature Outlooks<br />
• Summary
• <strong>ENSO</strong>-neutral conditions continue.*<br />
Summary<br />
<strong>ENSO</strong> Alert System <strong>Status</strong>: Not Active<br />
• Equatorial sea surface temperatures (SST) are near average across the Pacific<br />
Ocean.<br />
• Over the last couple months, the atmospheric circulation has been variable<br />
partially due to an active Madden-Julian Oscillation (MJO).<br />
• <strong>ENSO</strong>-neutral is favored into the Northern Hemisphere summer 2013.*<br />
* Note: These statements are updated once a month in association with the <strong>ENSO</strong> Diagnostics Discussion:<br />
http://www.cpc.ncep.noaa.gov/products/analysis_monitoring/enso_advisory
Time<br />
<strong>Recent</strong> <strong>Evolution</strong> of Equatorial Pacific<br />
SST Departures ( o C)<br />
Longitude<br />
From June - October 2012, aboveaverage<br />
SSTs were evident across most<br />
of the equatorial Pacific Ocean.<br />
During January-February 2013,<br />
below-average SSTs were observed<br />
over the eastern half of the Pacific.<br />
<strong>Recent</strong>ly, below-average SSTs have<br />
weakened across the eastern Pacific.
The latest weekly SST departures are:<br />
Niño 4 -0.2ºC<br />
Niño 3.4 -0.1ºC<br />
Niño 3 0.1ºC<br />
Niño 1+2 0.4ºC<br />
Niño Region SST Departures ( o C)<br />
<strong>Recent</strong> <strong>Evolution</strong>
SST Departures ( o C) in the Tropical Pacific<br />
During the Last 4 Weeks<br />
During the last 4-weeks, equatorial SSTs were 0.5ºC below average across most of the<br />
eastern half of the Pacific Ocean.
Global SST Departures ( o C)<br />
During the last four weeks, equatorial SSTs were above average across the eastern<br />
Atlantic Ocean <strong>and</strong> near the Maritime Continent (north of Australia). SSTs were below<br />
average in the central <strong>and</strong> eastern Pacific Ocean.
Weekly SST Departures ( o C)<br />
for the Last Four Weeks<br />
• During the last month, below average SSTs have<br />
weakened in the eastern Pacific.<br />
• Over the last month, the change in SST anomalies is<br />
positive in the eastern Pacific.
Cold<br />
Episodes<br />
Warm<br />
Episodes<br />
Upper-Ocean Conditions in the Eq. Pacific<br />
• The basin-wide equatorial<br />
upper ocean (0-300 m) heat<br />
content is greatest prior to <strong>and</strong><br />
during the early stages of a<br />
Pacific warm (El Niño) episode<br />
(compare top 2 panels) <strong>and</strong> least<br />
prior to <strong>and</strong> during the early<br />
stages of a cold (La Niña) episode.<br />
• The slope of the oceanic<br />
thermocline is least (greatest)<br />
during warm (cold) episodes.<br />
• <strong>Recent</strong> values of the upperocean<br />
heat anomalies (slightly<br />
negative) <strong>and</strong> a positive<br />
thermocline slope index reflect<br />
cool, <strong>ENSO</strong>-neutral conditions.<br />
The monthly thermocline slope index represents the difference in anomalous depth of the 20ºC<br />
isotherm between the western Pacific (160ºE-150ºW) <strong>and</strong> the eastern Pacific (90º-140ºW).
Weekly Central & Eastern Pacific Upper-Ocean<br />
(0-300 m) Average Temperature Anomalies<br />
From April - November 2012, the subsurface temperatures were above-average.<br />
Since November, anomalies have decreased, becoming negative in December 2012.<br />
During January 2013, the negative subsurface temperature anomalies remained<br />
nearly unchanged. <strong>Recent</strong>ly, subsurface temperature anomalies have increased.
Time<br />
Sub-Surface Temperature Departures ( o C)<br />
in the Equatorial Pacific<br />
Longitude<br />
• During January, negative subsurface<br />
temperature anomalies strengthened in the<br />
eastern Pacific.<br />
• In the last two months, positive subsurface<br />
temperature anomalies have exp<strong>and</strong>ed<br />
eastward.<br />
• <strong>Recent</strong>ly, positive sub-surface anomalies<br />
have shifted to east to near 120W.<br />
Most recent pentad analysis
Tropical OLR <strong>and</strong> Wind Anomalies<br />
During the Last 30 Days<br />
Negative OLR anomalies (enhanced convection <strong>and</strong><br />
precipitation, blue shading) were observed near<br />
Malaysia <strong>and</strong> the Philippines. Positive OLR<br />
anomalies (suppressed convection <strong>and</strong> precipitation,<br />
red shading) were evident near the Date Line,<br />
extending south of the equator to northern Australia.<br />
Low-level (850-hPa) wind anomalies were easterly<br />
over the west-central Pacific. Weak westerly<br />
anomalies were present over the eastern Pacific.<br />
Upper-level (200-hPa) winds were westerly<br />
across the east-central Pacific.
200-hPa Wind<br />
Atmospheric Circulation over the North Pacific & North<br />
America During the Last 60 Days<br />
500-hPa Height & Anoms.<br />
925-hPa Temp. Anoms. ( o C)<br />
Since the beginning of January, an anomalous ridge has been evident over the eastern N. Pacific/ west coast of the U.S.<br />
Considerable variability in the height <strong>and</strong> temperature patterns over N. America has been observed downstream from<br />
the ridge.
U.S. Temperature <strong>and</strong> Precipitation Departures<br />
During the Last 30 <strong>and</strong> 90 Days<br />
30-day (ending 8 Mar 2013) % of<br />
average precipitation<br />
90-day (ending 8 Mar 2013) % of<br />
average precipitation<br />
Last 30 Days<br />
Last 90 Days<br />
30-day (ending 9 Mar 2013)<br />
temperature departures (degree C)<br />
90-day (ending 9 Mar 2013)<br />
temperature departures (degree C)
Intraseasonal Variability<br />
• Intraseasonal variability in the atmosphere (wind<br />
<strong>and</strong> pressure), which is often related to the<br />
Madden-Julian Oscillation (MJO), can<br />
significantly impact surface <strong>and</strong> subsurface<br />
conditions across the Pacific Ocean.<br />
• Related to this activity<br />
– significant weakening of the low-level easterly<br />
winds usually initiates an eastward-propagating<br />
oceanic Kelvin wave.
Time<br />
Weekly Heat Content <strong>Evolution</strong><br />
in the Equatorial Pacific<br />
Longitude<br />
• From March- May 2012, heat content anomalies<br />
increased across much of the equatorial Pacific,<br />
partly in association with the downwelling phase of<br />
a Kelvin wave.<br />
• Strong Kelvin wave activity was evident during<br />
September – December 2012.<br />
• <strong>Recent</strong>ly, above-average heat content has<br />
emerged in the east-central Pacific, while negative<br />
anomalies have decayed in the eastern Pacific.<br />
• Oceanic Kelvin waves have alternating warm <strong>and</strong><br />
cold phases. The warm phase is indicated by dashed<br />
lines. Down-welling <strong>and</strong> warming occur in the<br />
leading portion of a Kelvin wave, <strong>and</strong> up-welling<br />
<strong>and</strong> cooling occur in the trailing portion.
Time<br />
Low-level (850-hPa) Zonal (east-west)<br />
Wind Anomalies (m s -1 )<br />
Longitude<br />
Westerly wind anomalies (orange/<br />
red shading).<br />
Easterly wind anomalies (blue<br />
shading).<br />
During January-beginning of March<br />
2013, the Madden Julian Oscillation<br />
(MJO) was evident in the eastward<br />
shift of easterly <strong>and</strong> westerly wind<br />
anomalies.<br />
<strong>Current</strong>ly, equatorial westerly wind<br />
anomalies are located near Indonesia<br />
<strong>and</strong> east of 150W, while easterly wind<br />
anomalies are evident near the Date<br />
Line.
Time<br />
200-hPa Velocity Potential<br />
Anomalies (5ºN-5ºS)<br />
Longitude<br />
Positive anomalies (brown shading)<br />
indicate unfavorable conditions for<br />
precipitation.<br />
Negative anomalies (green shading)<br />
indicate favorable conditions for<br />
precipitation.<br />
During mid October through mid November, a<br />
weak MJO was evident.<br />
The Madden Julian Oscillation (MJO)<br />
emerged in early January <strong>and</strong> has continued<br />
into March 2013.
Time<br />
Outgoing Longwave Radiation (OLR)<br />
Anomalies<br />
Longitude<br />
Drier-than-average conditions<br />
(orange/red shading)<br />
Wetter-than-average conditions<br />
(blue shading)<br />
Since mid-February 2013, aboveaverage<br />
OLR is evident near the Date<br />
Line, while below-average OLR is<br />
observed over Indonesia <strong>and</strong> the western<br />
Pacific.
Oceanic Niño Index (ONI)<br />
• The ONI is based on SST departures from average in the<br />
Niño 3.4 region, <strong>and</strong> is a principal measure for monitoring,<br />
assessing, <strong>and</strong> predicting <strong>ENSO</strong>.<br />
• Defined as the three-month running-mean SST departures<br />
in the Niño 3.4 region. Departures are based on a set of<br />
improved homogeneous historical SST analyses (Extended<br />
Reconstructed SST – ERSST.v3b). The SST reconstruction<br />
methodology is described in Smith et al., 2008, J. Climate,<br />
vol. 21, 2283-2296.)<br />
• Used to place current events into a historical perspective<br />
• NOAA’s operational definitions of El Niño <strong>and</strong> La Niña<br />
are keyed to the ONI index.
NOAA Operational Definitions for<br />
El Niño <strong>and</strong> La Niña<br />
El Niño: characterized by a positive ONI greater than or equal<br />
to +0.5°C.<br />
La Niña: characterized by a negative ONI less than or equal to<br />
-0.5°C.<br />
By historical st<strong>and</strong>ards, to be classified as a full-fledged El Niño<br />
or La Niña episode, these thresholds must be exceeded for a<br />
period of at least 5 consecutive overlapping 3-month seasons.<br />
CPC considers El Niño or La Niña conditions to occur when the monthly<br />
Niño3.4 OISST departures meet or exceed +/- 0.5°C along with consistent<br />
atmospheric features. These anomalies must also be forecasted to persist for 3<br />
consecutive months.
The most recent<br />
ONI value<br />
(December 2012 –<br />
February 2013) is<br />
-0.6 o C.<br />
ONI ( o C): <strong>Evolution</strong> since 1950<br />
El Niño<br />
neutral<br />
La Niña
NOTE (Mar. 2012):<br />
The historical values of<br />
the ONI have slightly<br />
changed due to an<br />
update in the<br />
climatology. Please<br />
click here for more<br />
details on the<br />
methodology:<br />
Historical ONI Values<br />
Historical El Niño <strong>and</strong> La Niña Episodes<br />
Based on the ONI computed using ERSST.v3b<br />
Highest<br />
El Niño ONI Value<br />
Lowest<br />
La Niña ONI Value<br />
JJA 1951 – DJF 1951/52 1.2 ASO 1949 – JAS 1950 -1.4<br />
DJF 1952/53 – JFM 1954 0.8 SON 1950 – JFM 1951 -0.8<br />
MAM 1957 – JJA 1958 1.8 AMJ 1954 − NDJ 1956/57 -1.7<br />
OND 1958 – FMA 1959 0.6 AMJ 1964 – DJF 1964/65 -0.8<br />
MJJ 1963 – JFM 1964 1.4 JJA 1970 – DJF 1971/72 -1.3<br />
AMJ 1965 – MAM 1966 1.9 AMJ 1973 – JJA 1974 -2.0<br />
JAS 1968 – DJF 1969/70 1.1 SON 1974 – MAM 1976 -1.7<br />
AMJ 1972 – FMA 1973 2.1 ASO 1983 – DJF 1983/84 -0.9<br />
ASO 1976 - JFM 1977 0.8 SON 1984 – ASO 1985 -1.1<br />
ASO 1977 – JFM 1978 0.8 AMJ 1988 – AMJ 1989 -1.9<br />
AMJ 1982 – MJJ 1983 2.2 ASO 1995 – FMA 1996 -0.9<br />
JAS 1986 – JFM 1988 1.6 JJA 1998 – FMA 2001 -1.7<br />
AMJ 1991 – MJJ 1992 1.6 OND 2005 – FMA 2006 -0.9<br />
ASO 1994 – FMA 1995 1.2 JAS 2007 – MJJ 2008 -1.5<br />
AMJ 1997 – MAM 1998 2.4 OND 2008 – FMA 2009 -0.8<br />
AMJ 2002 – JFM 2003 1.3 JJA 2010 – MAM 2011 -1.5<br />
JJA 2004 – DJF 2004/05 0.7 ASO 2011 – FMA 2012 -1.0<br />
ASO 2006 – DJF 2006/07 1.0<br />
JJA 2009 – MAM 2010 1.6
Year<br />
2002<br />
2003<br />
2004<br />
2005<br />
2006<br />
2007<br />
2008<br />
2009<br />
2010<br />
2011<br />
2012<br />
2013<br />
2014<br />
2015<br />
2016<br />
2017<br />
2018<br />
2019<br />
2020<br />
2021<br />
2022<br />
2023<br />
2024<br />
2025<br />
2026<br />
2027<br />
<strong>Recent</strong> Pacific warm (red) <strong>and</strong> cold (blue) episodes based on a threshold of +/- 0.5 o C for the<br />
Oceanic Nino Index (ONI) [3 month running mean of ERSST.v3b SST anomalies in the Nino<br />
3.4 region (5N-5S, 120-170W)]. For historical purposes El Niño <strong>and</strong> La Niña episodes are<br />
defined when the threshold is met for a minimum of 5 consecutive over-lapping seasons. The<br />
complete table going back to DJF 1950 can be found by clicking: Historical ONI Values<br />
DJF JFM FMA MAM AMJ MJJ JJA JAS ASO SON OND NDJ<br />
-0.2 0.0 0.1 0.3 0.5 0.7 0.8 0.8 0.9 1.2 1.3 1.3<br />
1.1 0.8 0.4 0.0 -0.2 -0.1 0.2 0.4 0.4 0.4 0.4 0.3<br />
0.3 0.2 0.1 0.1 0.2 0.3 0.5 0.7 0.8 0.7 0.7 0.7<br />
0.6 0.4 0.3 0.3 0.3 0.3 0.2 0.1 0.0 -0.2 -0.5 -0.8<br />
-0.9 -0.7 -0.5 -0.3 0.0 0.1 0.2 0.3 0.5 0.8 1.0 1.0<br />
0.7 0.3 -0.1 -0.2 -0.3 -0.3 -0.4 -0.6 -0.8 -1.1 -1.2 -1.4<br />
-1.5 -1.5 -1.2 -0.9 -0.7 -0.5 -0.3 -0.2 -0.1 -0.2 -0.5 -0.7<br />
-0.8 -0.7 -0.5 -0.2 0.2 0.4 0.5 0.6 0.8 1.1 1.4 1.6<br />
1.6 1.3 1.0 0.6 0.1 -0.4 -0.9 -1.2 -1.4 -1.5 -1.5 -1.5<br />
-1.4 -1.2 -0.9 -0.6 -0.3 -0.2 -0.2 -0.4 -0.6 -0.8 -1.0 -1.0<br />
-0.9<br />
-0.6<br />
-0.6 -0.5 -0.3 -0.2 0.0 0.1 0.4 0.5 0.6 0.2 -0.3
CPC/IRI Probabilistic <strong>ENSO</strong> Outlook<br />
(updated 7 Mar 2013)<br />
<strong>ENSO</strong>-neutral is favored into Northern Hemisphere fall 2013.
Pacific Niño 3.4 SST Outlook<br />
• Most models predict the persistence of current Niño-3.4 values, with <strong>ENSO</strong>-neutral (-0.5ºC to<br />
+0.5ºC) continuing through the Northern Hemisphere summer 2013.<br />
Figure provided by the<br />
International Research<br />
Institute (IRI) for Climate<br />
<strong>and</strong> Society (updated 18<br />
Feb 2013).
SST Outlook: NCEP CFS.v2 Forecast<br />
Issued 10 March 2013<br />
The CFS.v2 ensemble mean (black dashed<br />
line) predicts <strong>ENSO</strong>-neutral conditions<br />
through the Northern Hemisphere summer<br />
2013.
U. S. Seasonal Outlooks<br />
March – May 2013<br />
Temperature Precipitation<br />
The seasonal outlooks combine the effects of long-term trends,<br />
soil moisture, <strong>and</strong>, when appropriate, <strong>ENSO</strong>.
• <strong>ENSO</strong>-neutral conditions continue.*<br />
Summary<br />
<strong>ENSO</strong> Alert System <strong>Status</strong>: Not Active<br />
• Equatorial sea surface temperatures (SST) are near average across the Pacific<br />
Ocean.<br />
• Over the last couple months, the atmospheric circulation has been variable<br />
partially due to an active Madden-Julian Oscillation (MJO).<br />
• <strong>ENSO</strong>-neutral is favored into the Northern Hemisphere summer 2013.*<br />
* Note: These statements are updated once a month in association with the <strong>ENSO</strong> Diagnostics Discussion:<br />
http://www.cpc.ncep.noaa.gov/products/analysis_monitoring/enso_advisory


