Christopher Ragan, "Canada's Looming Fiscal Squeeze," November
Christopher Ragan, "Canada's Looming Fiscal Squeeze," November
Christopher Ragan, "Canada's Looming Fiscal Squeeze," November

You also want an ePaper? Increase the reach of your titles
YUMPU automatically turns print PDFs into web optimized ePapers that Google loves.
14<br />
eventual retirement of this same generation will have the opposite effect in the future. It will actually be a drag<br />
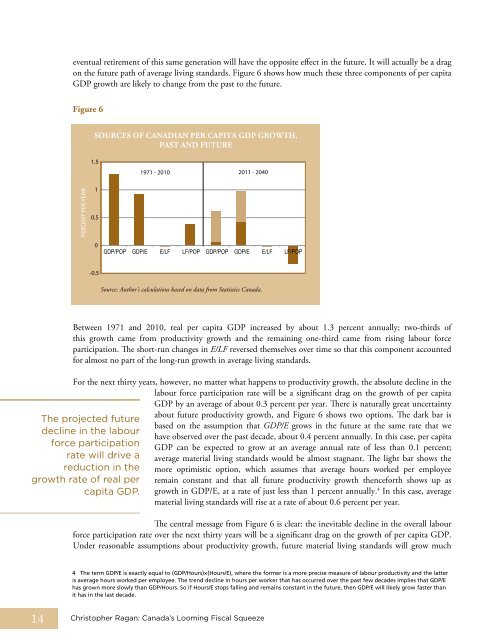
on the future path of average living standards. Figure 6 shows how much these three components of per capita<br />
GDP growth are likely to change from the past to the future.<br />
Figure 6<br />
PERCENT PER YEAR<br />
1.5<br />
0.5<br />
0<br />
-0.5<br />
between 1971 and 2010, real per capita GDP increased by about 1.3 percent annually; two-thirds of<br />
this growth came from productivity growth and the remaining one-third came from rising labour force<br />
participation. The short-run changes in E/LF reversed themselves over time so that this component accounted<br />
for almost no part of the long-run growth in average living standards.<br />
For the next thirty years, however, no matter what happens to productivity growth, the absolute decline in the<br />
labour force participation rate will be a significant drag on the growth of per capita<br />
GDP by an average of about 0.3 percent per year. There is naturally great uncertainty<br />
The projected future<br />
decline in the labour<br />
force participation<br />
rate will drive a<br />
reduction in the<br />
growth rate of real per<br />
capita GDP.<br />
SouRCES oF CANADIAN PER CAPITA GDP GRoWTH,<br />
PAST AND FuTuRE<br />
1<br />
1971 - 2010 2011 - 2040<br />
GDP/POP GDP/E E/LF LF/POP GDP/POP GDP/E E/LF LF/POP<br />
Source: Author’s calculations based on data from Statistics Canada.<br />
about future productivity growth, and Figure 6 shows two options. The dark bar is<br />
based on the assumption that GDP/E grows in the future at the same rate that we<br />
have observed over the past decade, about 0.4 percent annually. In this case, per capita<br />
GDP can be expected to grow at an average annual rate of less than 0.1 percent;<br />
average material living standards would be almost stagnant. The light bar shows the<br />
more optimistic option, which assumes that average hours worked per employee<br />
remain constant and that all future productivity growth thenceforth shows up as<br />
growth in GDP/e, at a rate of just less than 1 percent annually. 4 In this case, average<br />
material living standards will rise at a rate of about 0.6 percent per year.<br />
The central message from Figure 6 is clear: the inevitable decline in the overall labour<br />
force participation rate over the next thirty years will be a significant drag on the growth of per capita GDP.<br />
Under reasonable assumptions about productivity growth, future material living standards will grow much<br />
4 The term GDP/E is exactly equal to (GDP/Hours)×(Hours/E), where the former is a more precise measure of labour productivity and the latter<br />
is average hours worked per employee. The trend decline in hours per worker that has occurred over the past few decades implies that GDP/E<br />
has grown more slowly than GDP/Hours. So if Hours/E stops falling and remains constant in the future, then GDP/E will likely grow faster than<br />
it has in the last decade.<br />
<strong>Christopher</strong> <strong>Ragan</strong>: Canada’s <strong>Looming</strong> <strong>Fiscal</strong> <strong>Squeeze</strong>