Christopher Ragan, "Canada's Looming Fiscal Squeeze," November
Christopher Ragan, "Canada's Looming Fiscal Squeeze," November
Christopher Ragan, "Canada's Looming Fiscal Squeeze," November

Create successful ePaper yourself
Turn your PDF publications into a flip-book with our unique Google optimized e-Paper software.
20<br />
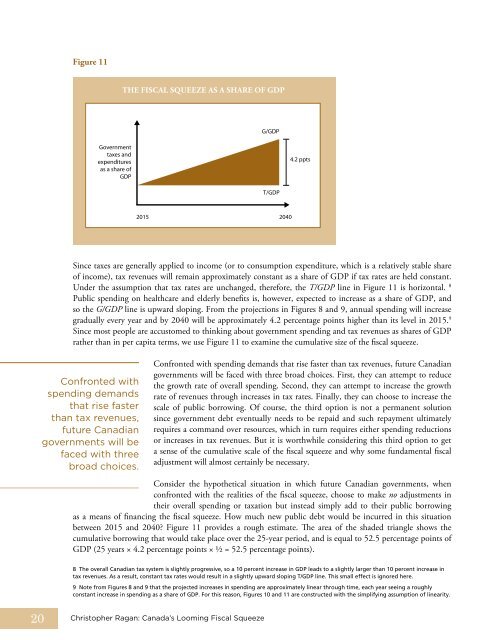
Figure 11<br />
Government<br />
taxes and<br />
expenditures<br />
as a share of<br />
GDP<br />
Since taxes are generally applied to income (or to consumption expenditure, which is a relatively stable share<br />
of income), tax revenues will remain approximately constant as a share of GDP if tax rates are held constant.<br />
Under the assumption that tax rates are unchanged, therefore, the T/GDP line in Figure 11 is horizontal. 8<br />
Public spending on healthcare and elderly benefits is, however, expected to increase as a share of GDP, and<br />
so the G/GDP line is upward sloping. From the projections in Figures 8 and 9, annual spending will increase<br />
gradually every year and by 2040 will be approximately 4.2 percentage points higher than its level in 2015. 9<br />
Since most people are accustomed to thinking about government spending and tax revenues as shares of GDP<br />
rather than in per capita terms, we use Figure 11 to examine the cumulative size of the fiscal squeeze.<br />
Confronted with<br />
spending demands<br />
that rise faster<br />
than tax revenues,<br />
future Canadian<br />
governments will be<br />
faced with three<br />
broad choices.<br />
THE FISCAL SquEEzE AS A SHARE oF GDP<br />
Confronted with spending demands that rise faster than tax revenues, future Canadian<br />
governments will be faced with three broad choices. First, they can attempt to reduce<br />
the growth rate of overall spending. Second, they can attempt to increase the growth<br />
rate of revenues through increases in tax rates. Finally, they can choose to increase the<br />
scale of public borrowing. of course, the third option is not a permanent solution<br />
since government debt eventually needs to be repaid and such repayment ultimately<br />
requires a command over resources, which in turn requires either spending reductions<br />
or increases in tax revenues. but it is worthwhile considering this third option to get<br />
a sense of the cumulative scale of the fiscal squeeze and why some fundamental fiscal<br />
adjustment will almost certainly be necessary.<br />
Consider the hypothetical situation in which future Canadian governments, when<br />
confronted with the realities of the fiscal squeeze, choose to make no adjustments in<br />
their overall spending or taxation but instead simply add to their public borrowing<br />
as a means of financing the fiscal squeeze. How much new public debt would be incurred in this situation<br />
between 2015 and 2040? Figure 11 provides a rough estimate. The area of the shaded triangle shows the<br />
cumulative borrowing that would take place over the 25-year period, and is equal to 52.5 percentage points of<br />
GDP (25 years × 4.2 percentage points × ½ = 52.5 percentage points).<br />
<strong>Christopher</strong> <strong>Ragan</strong>: Canada’s <strong>Looming</strong> <strong>Fiscal</strong> <strong>Squeeze</strong><br />
G/GDP<br />
T/GDP<br />
2015 2040<br />
4.2 ppts<br />
8 The overall Canadian tax system is slightly progressive, so a 10 percent increase in GDP leads to a slightly larger than 10 percent increase in<br />
tax revenues. As a result, constant tax rates would result in a slightly upward sloping T/GDP line. This small effect is ignored here.<br />
9 Note from Figures 8 and 9 that the projected increases in spending are approximately linear through time, each year seeing a roughly<br />
constant increase in spending as a share of GDP. For this reason, Figures 10 and 11 are constructed with the simplifying assumption of linearity.