Christopher Ragan, "Canada's Looming Fiscal Squeeze," November
Christopher Ragan, "Canada's Looming Fiscal Squeeze," November
Christopher Ragan, "Canada's Looming Fiscal Squeeze," November

Create successful ePaper yourself
Turn your PDF publications into a flip-book with our unique Google optimized e-Paper software.
Spending programs<br />
can be reduced or<br />
eliminated or taxes<br />
can be increased.<br />
There is nothing else.<br />
28<br />
the scale of changes necessary to fully offset the coming fiscal squeeze could be at once<br />
feasible and politically acceptable.<br />
The inconvenient truth that Canadians and their governments must immediately face<br />
is that the existing demographic forces and the fiscal implications that follow are so<br />
large that governments will need to respond by making fundamental adjustments to<br />
their fiscal frameworks. As is always the case, the simple arithmetic of government<br />
budgets implies that there are only two broad fiscal choices available to address the<br />
looming fiscal squeeze. Spending programs can be reduced or eliminated or taxes can<br />
be increased. There is nothing else.<br />
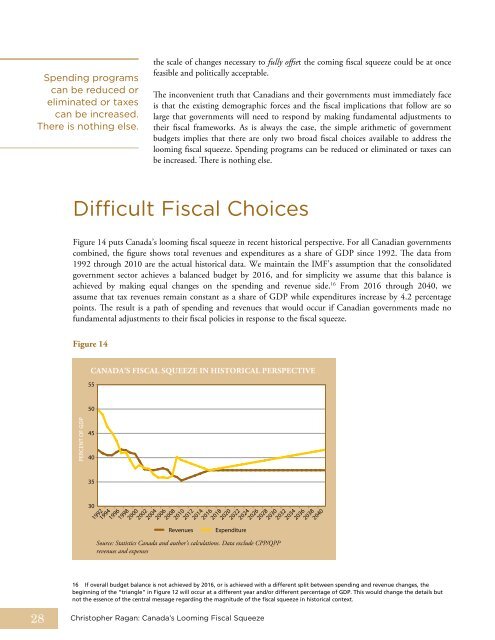
Difficult <strong>Fiscal</strong> Choices<br />
Figure 14 puts Canada’s looming fiscal squeeze in recent historical perspective. For all Canadian governments<br />
combined, the figure shows total revenues and expenditures as a share of GDP since 1992. The data from<br />
1992 through 2010 are the actual historical data. We maintain the ImF’s assumption that the consolidated<br />
government sector achieves a balanced budget by 2016, and for simplicity we assume that this balance is<br />
achieved by making equal changes on the spending and revenue side. 16 From 2016 through 2040, we<br />
assume that tax revenues remain constant as a share of GDP while expenditures increase by 4.2 percentage<br />
points. The result is a path of spending and revenues that would occur if Canadian governments made no<br />
fundamental adjustments to their fiscal policies in response to the fiscal squeeze.<br />
Figure 14<br />
PERCENT OF GDP<br />
CANADA’S FISCAL SquEEzE IN HISToRICAL PERSPECTIvE<br />
55<br />
50<br />
45<br />
40<br />
35<br />
30<br />
1992<br />
1994<br />
1996<br />
1998<br />
2000<br />
2002<br />
2004<br />
2006<br />
2008<br />
<strong>Christopher</strong> <strong>Ragan</strong>: Canada’s <strong>Looming</strong> <strong>Fiscal</strong> <strong>Squeeze</strong><br />
2010<br />
Revenues Expenditure<br />
Source: Statistics Canada and author’s calculations. Data exclude CPP/QPP<br />
revenues and expenses<br />
2012<br />
2014<br />
2016<br />
2018<br />
2020<br />
2022<br />
2024<br />
2026<br />
2028<br />
2030<br />
2032<br />
2034<br />
2036<br />
2038<br />
2040<br />
16 If overall budget balance is not achieved by 2016, or is achieved with a different split between spending and revenue changes, the<br />
beginning of the “triangle” in Figure 12 will occur at a different year and/or different percentage of GDP. This would change the details but<br />
not the essence of the central message regarding the magnitude of the fiscal squeeze in historical context.