Insurance Risk Study - Aon
Insurance Risk Study - Aon
Insurance Risk Study - Aon

You also want an ePaper? Increase the reach of your titles
YUMPU automatically turns print PDFs into web optimized ePapers that Google loves.
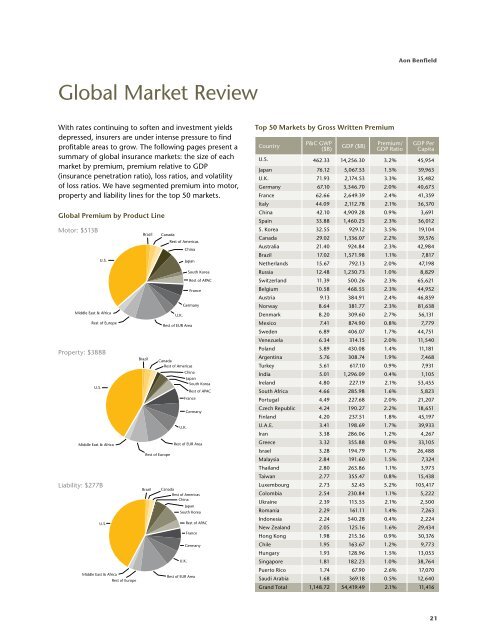
Global Market Review<br />
With rates continuing to soften and investment yields<br />
depressed, insurers are under intense pressure to find<br />
profitable areas to grow. The following pages present a<br />
summary of global insurance markets: the size of each<br />
market by premium, premium relative to GDP<br />
(insurance penetration ratio), loss ratios, and volatility<br />
of loss ratios. We have segmented premium into motor,<br />
property and liability lines for the top 50 markets.<br />
Global Premium by Product Line<br />
Motor: $513B<br />
U.S.<br />
Middle East & Africa<br />
Rest of Europe<br />
Property: $388B<br />
U.S.<br />
Middle East & Africa<br />
Liability: $277B<br />
U.S.<br />
Middle East & Africa<br />
Rest of Europe<br />
Brazil<br />
Brazil<br />
Rest of Europe<br />
Brazil<br />
Canada<br />
Rest of Americas<br />
China<br />
U.K.<br />
Japan<br />
Germany<br />
Rest of EUR Area<br />
U.K.<br />
South Korea<br />
Rest of APAC<br />
France<br />
Canada<br />
Rest of Americas<br />
China<br />
Japan<br />
South Korea<br />
Rest of APAC<br />
France<br />
Germany<br />
Rest of EUR Area<br />
Canada<br />
Rest of Americas<br />
China<br />
Japan<br />
South Korea<br />
U.K.<br />
Rest of EUR Area<br />
Rest of APAC<br />
France<br />
Germany<br />
Top 50 Markets by Gross Written Premium<br />
Country<br />
P&C GWP<br />
($B)<br />
GDP ($B)<br />
Premium/<br />
GDP Ratio<br />
<strong>Aon</strong> Benfield<br />
GDP Per<br />
Capita<br />
U.S. 462.33 14,256.30 3.2% 45,954<br />
Japan 76.12 5,067.53 1.5% 39,963<br />
U.K. 71.93 2,174.53 3.3% 35,482<br />
Germany 67.10 3,346.70 2.0% 40,673<br />
France 62.66 2,649.39 2.4% 41,359<br />
Italy 44.09 2,112.78 2.1% 36,370<br />
China 42.10 4,909.28 0.9% 3,691<br />
Spain 33.88 1,460.25 2.3% 36,012<br />
S. Korea 32.55 929.12 3.5% 19,104<br />
Canada 29.02 1,336.07 2.2% 39,576<br />
Australia 21.40 924.84 2.3% 42,984<br />
Brazil 17.02 1,571.98 1.1% 7,817<br />
Netherlands 15.67 792.13 2.0% 47,198<br />
Russia 12.48 1,230.73 1.0% 8,829<br />
Switzerland 11.39 500.26 2.3% 65,621<br />
Belgium 10.58 468.55 2.3% 44,952<br />
Austria 9.13 384.91 2.4% 46,859<br />
Norway 8.64 381.77 2.3% 81,638<br />
Denmark 8.20 309.60 2.7% 56,131<br />
Mexico 7.41 874.90 0.8% 7,779<br />
Sweden 6.89 406.07 1.7% 44,751<br />
Venezuela 6.34 314.15 2.0% 11,540<br />
Poland 5.89 430.08 1.4% 11,181<br />
Argentina 5.76 308.74 1.9% 7,468<br />
Turkey 5.61 617.10 0.9% 7,931<br />
India 5.01 1,296.09 0.4% 1,105<br />
Ireland 4.80 227.19 2.1% 53,455<br />
South Africa 4.66 285.98 1.6% 5,823<br />
Portugal 4.49 227.68 2.0% 21,207<br />
Czech Republic 4.24 190.27 2.2% 18,651<br />
Finland 4.20 237.51 1.8% 45,197<br />
U.A.E. 3.41 198.69 1.7% 39,933<br />
Iran 3.38 286.06 1.2% 4,267<br />
Greece 3.32 355.88 0.9% 33,105<br />
Israel 3.28 194.79 1.7% 26,488<br />
Malaysia 2.84 191.60 1.5% 7,324<br />
Thailand 2.80 263.86 1.1% 3,973<br />
Taiwan 2.77 355.47 0.8% 15,438<br />
Luxembourg 2.73 52.45 5.2% 105,417<br />
Colombia 2.54 230.84 1.1% 5,222<br />
Ukraine 2.39 113.55 2.1% 2,500<br />
Romania 2.29 161.11 1.4% 7,263<br />
Indonesia 2.24 540.28 0.4% 2,224<br />
New Zealand 2.05 125.16 1.6% 29,434<br />
Hong Kong 1.98 215.36 0.9% 30,376<br />
Chile 1.95 163.67 1.2% 9,773<br />
Hungary 1.93 128.96 1.5% 13,053<br />
Singapore 1.81 182.23 1.0% 38,764<br />
Puerto Rico 1.74 67.90 2.6% 17,070<br />
Saudi Arabia 1.68 369.18 0.5% 12,640<br />
Grand Total 1,148.72 54,419.49 2.1% 11,416<br />
21